homeowners have struggled with low admission rates … reports/homeowners_have_struggled... ·...
TRANSCRIPT

Homeowners Have Struggled With Low Admission Rates and Lengthy Delays In Getting Help From TARP’s Second-Largest
Housing Program — The Hardest Hit Fund
Special Inspector General for the Troubled Asset Relief ProgramOctober 28, 2015
TROUBLED ASSET RELIEF PROGRA
M
SPEC
IAL INSPECTOR GENERAL

With the nation’s largest financial institutions teetering on the brink of failure and millions of American homeowners facing imminent foreclosure, Congress rejected Treasury’s initial TARP proposal and insisted that TARP funds be used not just for banks, but also to aid struggling homeowners.1 The “preservation of homeownership” is an explicit purpose of the law that established TARP, which includes “the need to help families keep their homes” as a chief consideration required of the Treasury Secretary in exercising his authorities under TARP.2
In February 2010, the Administration announced TARP’s Housing Finance Agency Innovation Fund for the Hardest Hit Housing Markets (“Hardest Hit Fund” or “HHF”), to target help to families in the states “hit the hardest by the aftermath of the housing bubble.”3 The program initially targeted five states that each saw the average price of homes fall by more than 20% from the peak. The program was expanded to become the second-largest TARP housing program, with $7.6 billion in funding and covering 18 states and the District of Columbia.
In SIGTARP’s recent evaluation report, “Factors Impacting the Effectiveness of Hardest Hit Fund Florida,” released earlier this month, SIGTARP found that Treasury abandoned its intent to set goals for HHF program effectiveness and to measure progress against those goals.i SIGTARP found that Treasury set the objective of HHF to allow state housing finance agencies (“HFAs”) “to develop creative, effective approaches that consider local conditions” [emphasis added], but that Treasury has not done everything it can do to ensure that HHF Florida is “effective” in providing assistance to homeowners. In Treasury’s March 29, 2010 press release, and in guidelines given to the HHF states, Treasury stated that the objective of HHF is to develop creative, effective approaches that consider local conditions. After Treasury approved state-specific HHF programs, on June 23, 2010, Treasury’s Assistant Secretary for Financial Stability, Herbert Allison, stated that the Administration “will continue to do everything it can to help those who are struggling the most during this difficult time.”
In February 2010, the White House announced, “The program will be under strict transparency and accountability rules.” The White House announced that “program effectiveness” would be measured, and that there would be “effective oversight” under the Emergency Economic Stabilization Act of 2008 (the law that created TARP) [emphasis added]. Oversight under EESA means Treasury, not just the state housing finance agencies.
On March 29, 2010, Treasury repeated that program activity will be subject to effective oversight under EESA, stating:
HFAs will be required to develop and maintain operational and performance metrics, have a detailed financial reporting system and track homeowners helped through its programs. HFAs will report data to Treasury on a periodic basis, including metrics used to measure program effectiveness against stated objectives. Treasury may request that the HFA modify the proposed performance measures or seek additional metrics as necessary [emphasis added].
i SIGTARP, “Factors Impacting the Effectiveness of Hardest Hit Fund Florida,” October 6, 2015, www.sigtarp.gov/Audit%20Reports/SIGTARP_HHF_Florida_Report.pdf.
SIGTARP QUARTERLY REPORT TO CONGRESS I OCTOBER 28, 2015 1
Treasury repeated this statement in its guidelines to state HFAs. Treasury’s guidelines provide that HHF is designed to allow the maximum possible flexibility to eligible HFAs in designing programs that are tailored to the needs of the specific state, while Treasury ensures the effectiveness of the program. The two concepts of state flexibility and Treasury measuring effectiveness were not mutually exclusive. Among other things, Treasury required states to provide (i) detailed information about the specific problems that the program would address, as well as the specific goals for the program and how progress toward those goals will be measured, and (ii) a description of the proposed methodology for measuring program progress, including key performance measurements, frequency of reporting and a tracking system to measure progress against goals.
Treasury’s former Home Preservation Office Chief, Phyllis Caldwell, told SIGTARP in 2011, that Treasury could evaluate success in HHF in ways such as, “are we reaching the right number of people, are we reaching them in a sustainable way…” [emphasis added]. HHF states’ performance numbers are the only information Treasury publishes on accountability in HHF.
In its April 2012 audit of HHFii SIGTARP found that—contrary to what the Administration and Treasury said they would do at the start of HHF to conduct effective oversight—Treasury had not set any measurable goals and metrics that would allow Treasury, the public, and Congress to measure the progress of HHF. Treasury rejected SIGTARP’s recommendations to set goals, stating, “Treasury believes establishing static numeric targets (as the recommendations seem to suggest) is not well suited to the dynamic nature of HHF. Treasury has a rigorous performance management program in place, which requires each HFA to set goals and targets for all of its initiatives.” The number of people helped is not the only goal that Treasury could have set. There are a number of goals that Treasury could have set, but did not. Treasury’s current HPO Chief, Mark McArdle, told SIGTARP, “There is no such thing as one set goal that works or doesn’t work.”
Treasury’s responsibility to define targeted outcomes and measure progress against them is important for accountability over the state HFAs’ uses of TARP funds. The Government Performance and Results Act (“GPRA”) requires Federal agencies to measure performance against established goals. Congress enacted this law to hold Federal agencies accountable for achieving program results and to improve management of Federal programs. Treasury cannot escape GPRA’s requirements because a state should have flexibility and be innovative under HHF. Flexibility and innovation does not come in a Federal program without accountability that can be measured.
Treasury’s measurement of program effectiveness announced by the Administration for HHF must include not only how many homeowners are helped by HHF, but how many homeowners seek help but do not receive it. Each quarter, Treasury prepares and releases a Hardest Hit Fund Quarterly Performance Summary, Treasury’s report on the performance of HHF. That 22-page report discusses the number of homeowners assisted in HHF, but does not discuss or
ii SIGTARP, “Factors Affecting Implementation of the Hardest Hit Fund Program,” April 12, 2012, www.sigtarp.gov/Audit%20Reports/SIGTARP_HHF_Audit.pdf.
SPECIAL INSPECTOR GENERAL I TROUBLED ASSET RELIEF PROGRAM2

report on all of the homeowners who applied for HHF, but were not assisted.4 To find information on those homeowners, the public would have to look to a different section of Treasury’s website, where some more detailed aggregate HHF information is reported, and to the websites of the individual HHF state housing finance agencies. According to Treasury’s data, of the 551,563 homeowners who applied as of June 30, 2015, only 234,497 received HHF assistance. This is a homeowner admission rate of 43%. The homeowner admission rate is simple arithmetic: the number of people who received HHF assistance divided by the number of people who applied. Another 293,344 homeowners applied for HHF, but did not receive assistance for one reason or another. Some were denied. Some had their applications withdrawn for them by the state agency. Some withdrew their applications themselves.5 Treasury does not require states to report the reasons why a homeowner is denied or why the agency or the homeowner withdraws an application.6 As homeowners struggle to keep their homes, homeowners face lengthy and frustrating delays in getting their applications processed, which could have led homeowners to withdraw their applications and seek help elsewhere.
While the largest financial institutions have recovered from the financial crisis, many homeowners in this country continue to struggle to keep their homes. Five years into the program, Treasury and the participating state housing finance agencies must be accountable for mitigating obstacles to homeowners getting help from HHF, and for continually ensuring that HHF is effective at getting help to homeowners. Struggling homeowners—and the taxpayers who funded TARP—deserve the accountability for performance that the Administration promised when HHF was launched. Homeowners in distress need TARP’s help now, not by the end of 2017 when Treasury will stop funding HHF.7
FEWER THAN HALF OF HOMEOWNERS WHO APPLIED FOR HHF ASSISTANCE RECEIVED HELP, FAR LESS THAN THAT IN CERTAIN STATESStruggling homeowners who turned to HHF for help have less than a 50-50 chance of getting HHF assistance, based on a national average in HHF. As of June 30, 2015, only 234,497 homeowners out of 551,563 homeowners who applied for HHF assistance (43%) were assisted.8 More than half (57%) of homeowners who applied for help from HHF have not received that HHF assistance. Seven states have stopped accepting applications for HHF, although they continue to review applications of homeowners who applied before the cut-off and, according to Treasury, in several cases have again begun accepting new homeowner applications on a limited basis.9,iii Among the other twelve states whose HHF programs have remained open to accepting homeowner applications, almost two-thirds (62%) of homeowners who applied for HHF in these states did not receive assistance.10
iii According to Treasury, as of September 30, 2015, four state HFAs had indicated they were again accepting applications for HHF assistance “under select programs”: Illinois, New Jersey, Oregon, and Washington, DC.
SIGTARP QUARTERLY REPORT TO CONGRESS I OCTOBER 28, 2015 3
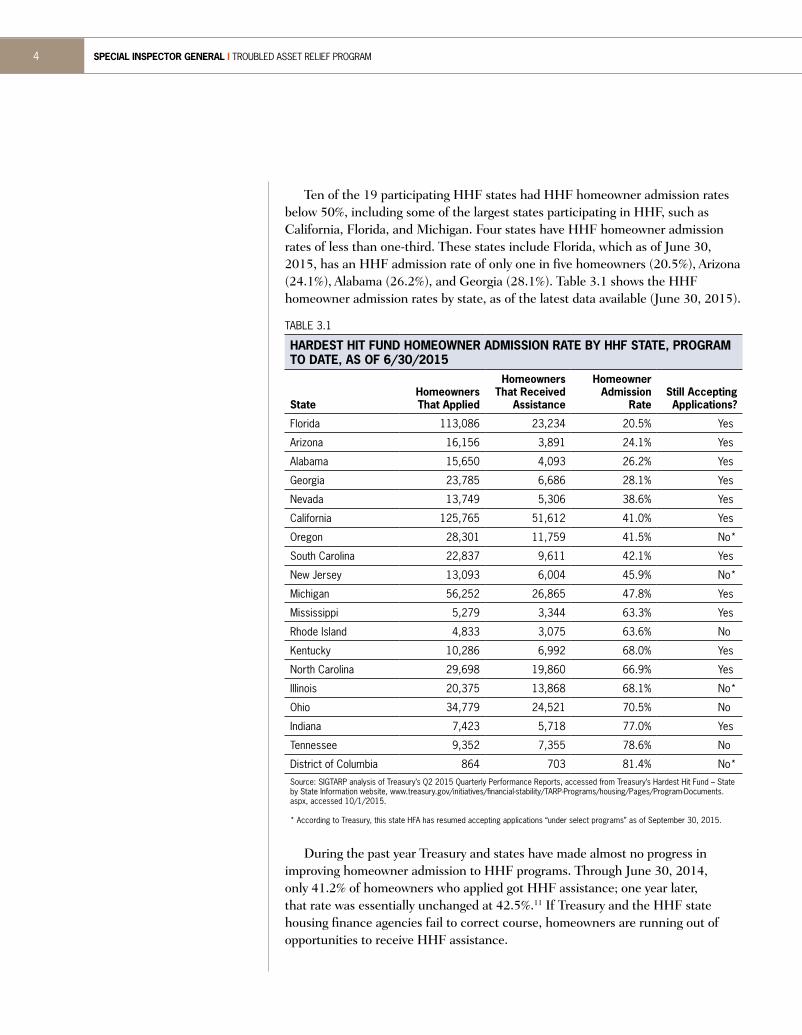
Ten of the 19 participating HHF states had HHF homeowner admission rates below 50%, including some of the largest states participating in HHF, such as California, Florida, and Michigan. Four states have HHF homeowner admission rates of less than one-third. These states include Florida, which as of June 30, 2015, has an HHF admission rate of only one in five homeowners (20.5%), Arizona (24.1%), Alabama (26.2%), and Georgia (28.1%). Table 3.1 shows the HHF homeowner admission rates by state, as of the latest data available (June 30, 2015).
TABLE 3.1
HARDEST HIT FUND HOMEOWNER ADMISSION RATE BY HHF STATE, PROGRAM TO DATE, AS OF 6/30/2015
StateHomeowners That Applied
Homeowners That Received
Assistance
Homeowner Admission
RateStill Accepting Applications?
Florida 113,086 23,234 20.5% Yes
Arizona 16,156 3,891 24.1% Yes
Alabama 15,650 4,093 26.2% Yes
Georgia 23,785 6,686 28.1% Yes
Nevada 13,749 5,306 38.6% Yes
California 125,765 51,612 41.0% Yes
Oregon 28,301 11,759 41.5% No*
South Carolina 22,837 9,611 42.1% Yes
New Jersey 13,093 6,004 45.9% No*
Michigan 56,252 26,865 47.8% Yes
Mississippi 5,279 3,344 63.3% Yes
Rhode Island 4,833 3,075 63.6% No
Kentucky 10,286 6,992 68.0% Yes
North Carolina 29,698 19,860 66.9% Yes
Illinois 20,375 13,868 68.1% No*
Ohio 34,779 24,521 70.5% No
Indiana 7,423 5,718 77.0% Yes
Tennessee 9,352 7,355 78.6% No
District of Columbia 864 703 81.4% No*Source: SIGTARP analysis of Treasury’s Q2 2015 Quarterly Performance Reports, accessed from Treasury’s Hardest Hit Fund – State by State Information website, www.treasury.gov/initiatives/financial-stability/TARP-Programs/housing/Pages/Program-Documents.aspx, accessed 10/1/2015.
* According to Treasury, this state HFA has resumed accepting applications “under select programs” as of September 30, 2015.
During the past year Treasury and states have made almost no progress in
improving homeowner admission to HHF programs. Through June 30, 2014, only 41.2% of homeowners who applied got HHF assistance; one year later, that rate was essentially unchanged at 42.5%.11 If Treasury and the HHF state housing finance agencies fail to correct course, homeowners are running out of opportunities to receive HHF assistance.
SPECIAL INSPECTOR GENERAL I TROUBLED ASSET RELIEF PROGRAM4
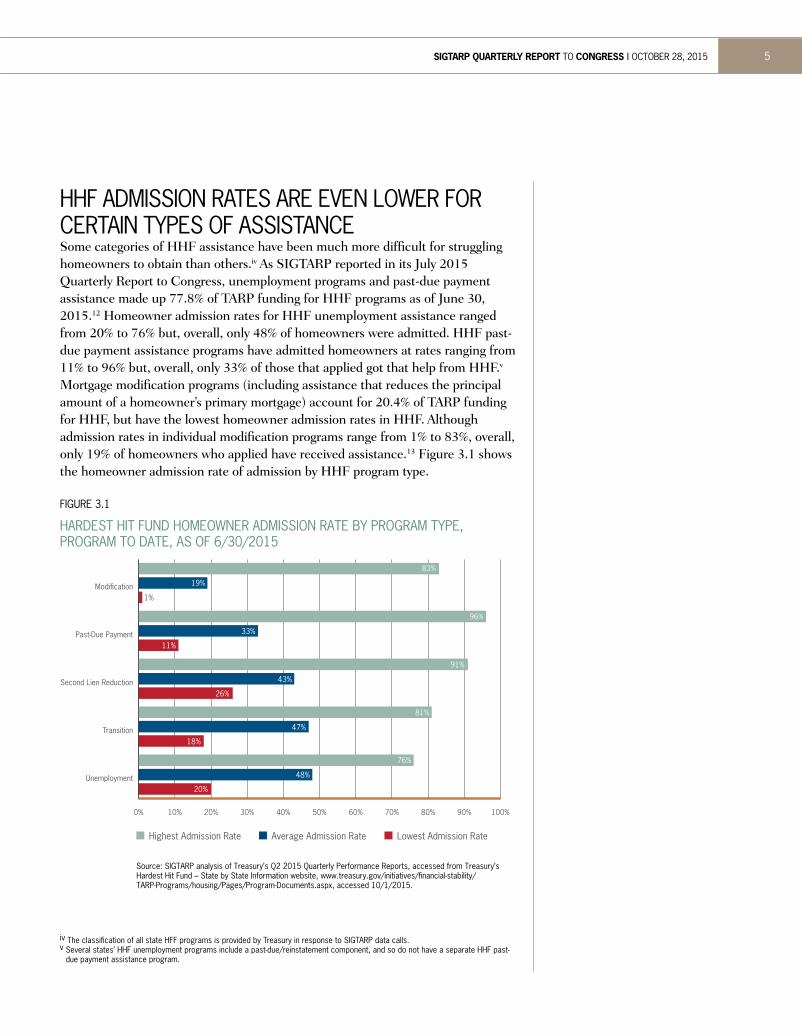
HHF ADMISSION RATES ARE EVEN LOWER FOR CERTAIN TYPES OF ASSISTANCESome categories of HHF assistance have been much more difficult for struggling homeowners to obtain than others.iv As SIGTARP reported in its July 2015 Quarterly Report to Congress, unemployment programs and past-due payment assistance made up 77.8% of TARP funding for HHF programs as of June 30, 2015.12 Homeowner admission rates for HHF unemployment assistance ranged from 20% to 76% but, overall, only 48% of homeowners were admitted. HHF past-due payment assistance programs have admitted homeowners at rates ranging from 11% to 96% but, overall, only 33% of those that applied got that help from HHF.v Mortgage modification programs (including assistance that reduces the principal amount of a homeowner’s primary mortgage) account for 20.4% of TARP funding for HHF, but have the lowest homeowner admission rates in HHF. Although admission rates in individual modification programs range from 1% to 83%, overall, only 19% of homeowners who applied have received assistance.13 Figure 3.1 shows the homeowner admission rate of admission by HHF program type.
FIGURE 3.1
HARDEST HIT FUND HOMEOWNER ADMISSION RATE BY PROGRAM TYPE, PROGRAM TO DATE, AS OF 6/30/2015
0% 10% 20% 30% 40% 50% 60% 70% 80% 90% 100%
Unemployment
Transition
Second Lien Reduction
Past-Due Payment
Modi�cation
Source: SIGTARP analysis of Treasury’s Q2 2015 Quarterly Performance Reports, accessed from Treasury’s Hardest Hit Fund – State by State Information website, www.treasury.gov/initiatives/�nancial-stability/TARP-Programs/housing/Pages/Program-Documents.aspx, accessed 10/1/2015.
Highest Admission Rate Lowest Admission RateAverage Admission Rate
83%
19%
1%
96%
33%
11%
91%
43%
26%
81%
47%
18%
76%
48%
20%
iv The classification of all state HFF programs is provided by Treasury in response to SIGTARP data calls.v Several states’ HHF unemployment programs include a past-due/reinstatement component, and so do not have a separate HHF past-
due payment assistance program.
SIGTARP QUARTERLY REPORT TO CONGRESS I OCTOBER 28, 2015 5
Treasury and states can take action to fix low homeowner admission rates in the 12 participating HHF states that remain fully open to new homeowner applications, as well as in the four states whose HFAs, according to Treasury, have recently begun to again accept applications for HHF assistance under select programs. HHF Alabama has the lowest homeowner admission rate (1%) for HHF with modification assistance, in a program that began in early 2013. HHF California has the lowest homeowner admission rate (11%) of all HHF past-due payment programs. HHF Indiana has the lowest homeowner admission rate (18%) of HHF transition assistance programs. HHF Florida and HHF Nevada have the lowest homeowner admission rates of all HHF unemployment and second-lien reduction assistance programs (20% and 26%, respectively).14
LONG WAITING PERIODS FOR HOMEOWNERS TO RECEIVE HHF ASSISTANCE Homeowners applying for HHF assistance to keep their homes face long waiting periods for a decision on their HHF applications for help. Some states offer more than one HHF program, such as unemployment assistance and past-due assistance programs. According to Treasury, as of September 30, 2015, there were 77 active HHF programs.15 Treasury requires states to report the waiting periods for homeowners to receive HHF assistance in terms of the median number of days it takes a homeowner to receive HHF help for each program. A median number of days means that half of the homeowners applying had to wait longer than the reported (median) period to receive assistance after applying, while half received assistance within a shorter period. As some programs have closed and some are new, as of June 30, 2015, Treasury has data on homeowner waiting periods for 66 of the 77 of the active HHF programs.
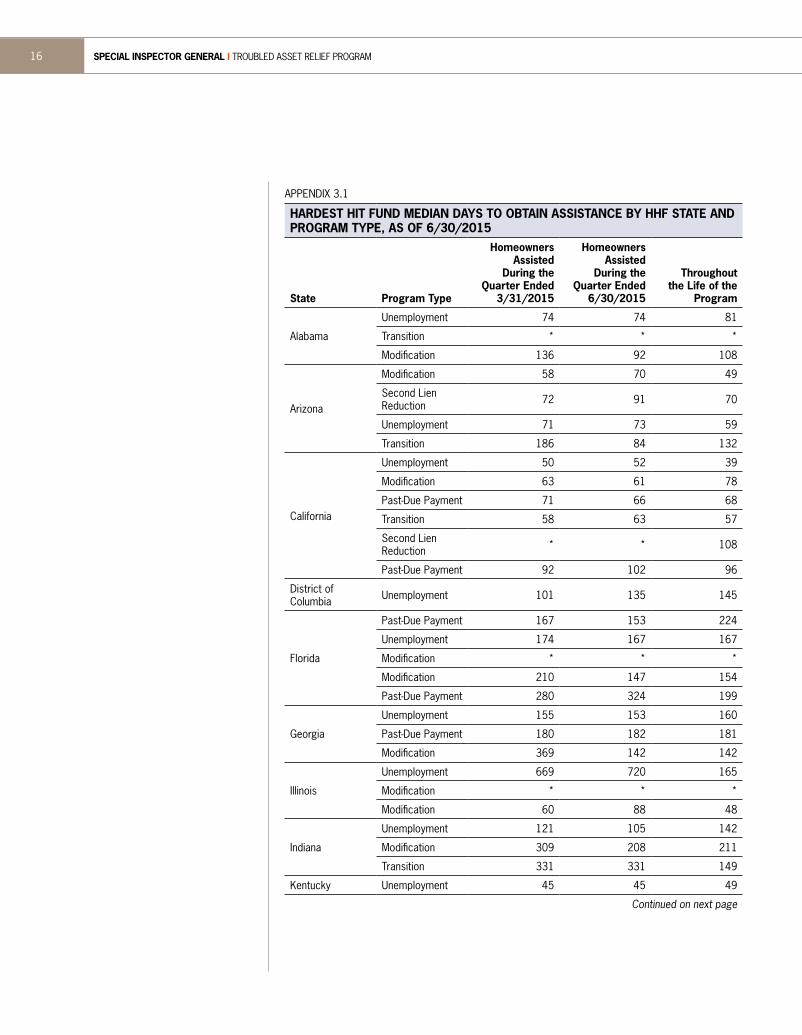
Treasury data shows that it takes months for homeowners to get HHF assistance. For 15 HHF programs, homeowners had to wait a median of more than 6 months to get help.16 In more than half of all reported HHF programs (37), homeowners had to wait a median of 4 months or longer to receive help. Homeowners applying for help from 45 HHF programs had to wait a median of at least 3 months to receive assistance. Appendix 3.1 to this report shows the (median) number of days homeowners had to wait after applying to receive HHF assistance for each program over the lifetime of the program, as reported by each state to Treasury as of June 30, 2015. Appendix 3.1 also shows Treasury’s most recent reporting on how long homeowners who received help in the last 2 quarters had to wait after applying for HHF assistance.
Homeowners in Ohio have suffered some of the longest delays in seeking HHF assistance. Unemployed homeowners in Ohio waited more than a median of 6 months to receive HHF unemployment assistance. According to Treasury’s data, homeowners in Ohio who seek transition assistance when they give up their homes waited a full year to get help (a median of 366 days). Ohio homeowners who apply
SPECIAL INSPECTOR GENERAL I TROUBLED ASSET RELIEF PROGRAM6
for HHF help with past-due payments waited almost 9 months (266 days) to get assistance. Homeowners in Ohio who apply for HHF modification assistance had to wait more than 7-8 months to get assistance from the state’s Lien Elimination Program (251 days) and Modification with Contribution Assistance Program (233 days). Given that these are median numbers, some Ohio homeowners waited less time, but some Ohio homeowners had to wait considerably longer to get HHF help. HHF Ohio is no longer accepting new homeowner applications for HHF, but has homeowners who applied before the cut-off. HHF Ohio continues to review those homeowner applications, and in the most recent quarter ended June 30, 2015, provided assistance to 36 of those homeowners. Ohio’s HFA reported to Treasury that the unemployed homeowners who got help from HHF Ohio in the quarter ended March 31, 2015, had waited a median of 14 months (426 days) to get that assistance. Ohio’s HFA reported that unemployed homeowners who finally received HHF unemployment assistance in the quarter ended June 30, 2015, had waited a median of almost 2 years (710 days) for that assistance.
But Ohio homeowners are not alone. Over the life of HHF programs, unemployed homeowners in 15 of 19 states had to wait longer than a median of 3 months to get unemployment assistance from HHF. Only 6 programs within the participating states provided HHF unemployment assistance to homeowners with less than a 3-month median wait time.vi Table 3.2 shows the HHF unemployment and past-due assistance programs—which account for over 77% of TARP funding for HHF—for which homeowners had to wait at least a median of 3 months to get assistance.
vi There is more than one HHF program in some categories in some states.
SIGTARP QUARTERLY REPORT TO CONGRESS I OCTOBER 28, 2015 7
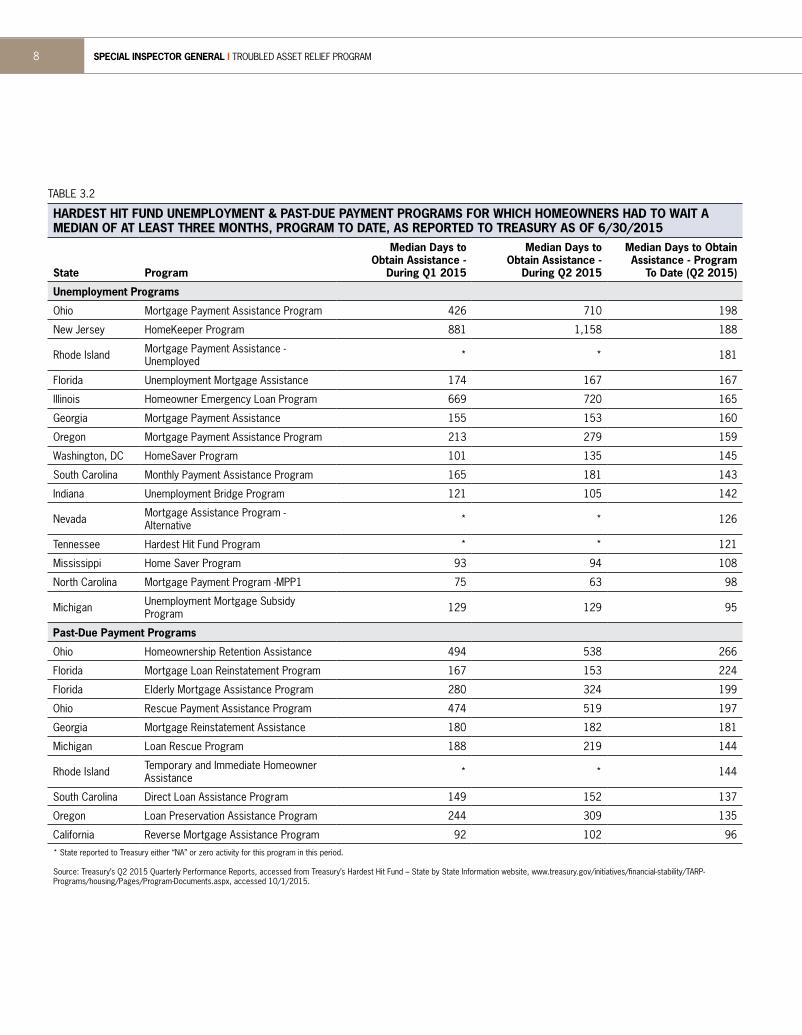
TABLE 3.2
HARDEST HIT FUND UNEMPLOYMENT & PAST-DUE PAYMENT PROGRAMS FOR WHICH HOMEOWNERS HAD TO WAIT A MEDIAN OF AT LEAST THREE MONTHS, PROGRAM TO DATE, AS REPORTED TO TREASURY AS OF 6/30/2015
State Program
Median Days to Obtain Assistance -
During Q1 2015
Median Days to Obtain Assistance -
During Q2 2015
Median Days to Obtain Assistance - Program
To Date (Q2 2015)
Unemployment Programs
Ohio Mortgage Payment Assistance Program 426 710 198
New Jersey HomeKeeper Program 881 1,158 188
Rhode Island Mortgage Payment Assistance - Unemployed * * 181
Florida Unemployment Mortgage Assistance 174 167 167
Illinois Homeowner Emergency Loan Program 669 720 165
Georgia Mortgage Payment Assistance 155 153 160
Oregon Mortgage Payment Assistance Program 213 279 159
Washington, DC HomeSaver Program 101 135 145
South Carolina Monthly Payment Assistance Program 165 181 143
Indiana Unemployment Bridge Program 121 105 142
Nevada Mortgage Assistance Program - Alternative * * 126
Tennessee Hardest Hit Fund Program * * 121
Mississippi Home Saver Program 93 94 108
North Carolina Mortgage Payment Program -MPP1 75 63 98
Michigan Unemployment Mortgage Subsidy Program 129 129 95
Past-Due Payment Programs
Ohio Homeownership Retention Assistance 494 538 266
Florida Mortgage Loan Reinstatement Program 167 153 224
Florida Elderly Mortgage Assistance Program 280 324 199
Ohio Rescue Payment Assistance Program 474 519 197
Georgia Mortgage Reinstatement Assistance 180 182 181
Michigan Loan Rescue Program 188 219 144
Rhode Island Temporary and Immediate Homeowner Assistance * * 144
South Carolina Direct Loan Assistance Program 149 152 137
Oregon Loan Preservation Assistance Program 244 309 135
California Reverse Mortgage Assistance Program 92 102 96* State reported to Treasury either “NA” or zero activity for this program in this period.
Source: Treasury’s Q2 2015 Quarterly Performance Reports, accessed from Treasury’s Hardest Hit Fund – State by State Information website, www.treasury.gov/initiatives/financial-stability/TARP-Programs/housing/Pages/Program-Documents.aspx, accessed 10/1/2015.
SPECIAL INSPECTOR GENERAL I TROUBLED ASSET RELIEF PROGRAM8
Unemployed homeowners in New Jersey had to wait a median time longer than 6 months (188 days) to get HHF unemployment. HHF New Jersey had stopped accepting applications for its HHF unemployment program but, according to Treasury, had again begun accepting homeowner applications for HHF on a limited basis. New Jersey’s HFA continues to review homeowner applications, and in the most recent quarter ended June 30, 2015, provided assistance to 4 homeowners. New Jersey’s HFA reported to Treasury that the unemployed New Jersey homeowners who received HHF assistance in the quarter ended March 31, 2015, had waited a median of almost 2.5 years (881 days) to get that assistance. Unemployed New Jersey homeowners who received assistance in the most recent reported quarter ended June 30, 2015, had waited over 3 years (1,158 days) for that assistance.
Unemployed homeowners in Rhode Island had to wait a median of 181 days to get HHF help. In Illinois, unemployed homeowners had to wait a median of 165 days to get HHF help. HHF Illinois had stopped accepting applications for its HHF unemployment assistance program but, according to Treasury, had again begun accepting homeowner applications for HHF on a limited basis. Illinois’ HFA continues to review homeowner applications, and in the most recent quarter ended June 30, 2015, provided assistance to 40 homeowners. HHF Illinois reported to Treasury that the homeowners who finally got HHF unemployment assistance in the 2 most recent quarters had waited considerably longer: 669 and 720 days, respectively, for those who finally received help in the quarters ended March 31 and June 30, 2015. Overall, Oregon homeowners faced median delays of 159 days and 135 days in getting help from HHF unemployment and past-due programs, respectively, though those homeowners who finally received help in the most recent reported quarter had waited up to over twice as long: 279 and 309 days, respectively, to receive that help after applying.
Homeowners face similar obstacles in state HHF programs still accepting applications. Unemployed Florida homeowners seeking HHF unemployment assistance, for example, had to wait a median of 167 days to get assistance. Florida homeowners also had to wait over 7 months to get HHF past-due assistance (224 days). As of June 30, 2015, senior citizens in Florida with reverse mortgages seeking HHF help had to wait more than a median 6 months to get it (199 days) over the lifetime of the program (including the most recent quarter). However, that delay is getting worse with time. As of March 31, 2015, HHF Florida reported that the senior citizens who got HHF reverse mortgage assistance in that quarter had waited a median of 9-10 months (280 days) to get help—far longer than the median of 199 days reported over the lifetime of the program. HHF Florida reported that the seniors who got HHF reverse mortgage help in the most recent quarter ended June 30, 2015, had waited a median of almost 11 months (324 days) to get assistance.
Homeowners in 10 HHF states had to wait over 3 months to get help from HHF mortgage modification programs, the second-largest category of HHF assistance (20% of HHF funding). Rhode Island homeowners applying for HHF mortgage modification in one of HHF Rhode Island’s programs had to wait a
SIGTARP QUARTERLY REPORT TO CONGRESS I OCTOBER 28, 2015 9
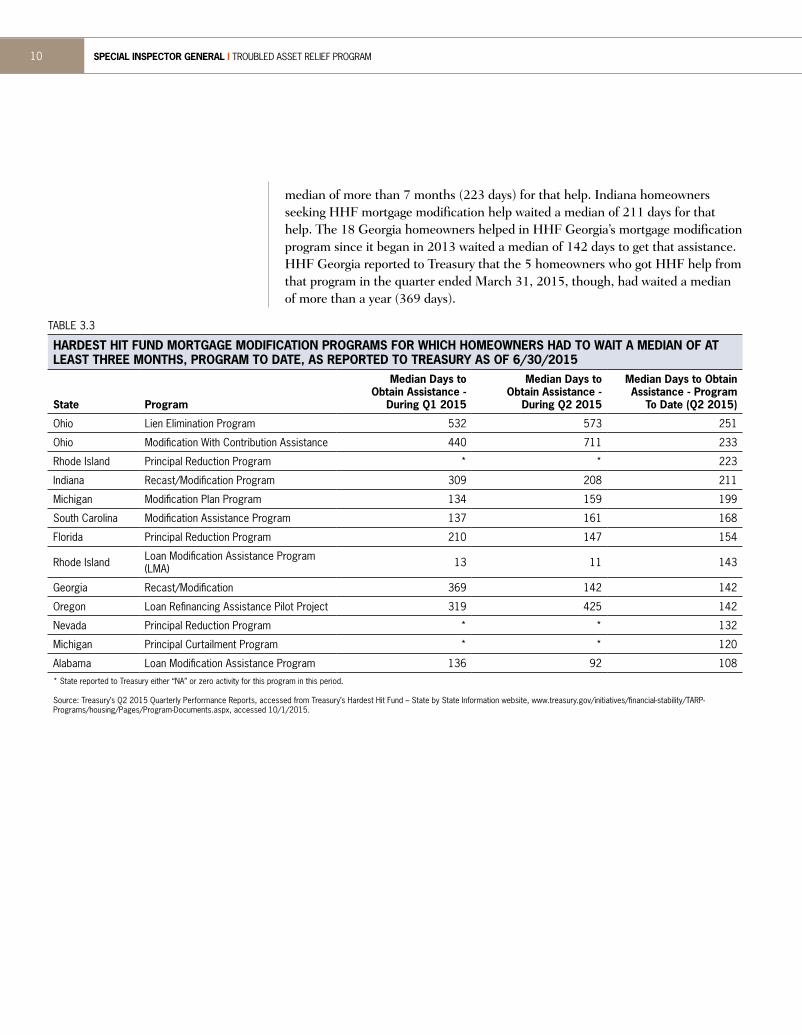
median of more than 7 months (223 days) for that help. Indiana homeowners seeking HHF mortgage modification help waited a median of 211 days for that help. The 18 Georgia homeowners helped in HHF Georgia’s mortgage modification program since it began in 2013 waited a median of 142 days to get that assistance. HHF Georgia reported to Treasury that the 5 homeowners who got HHF help from that program in the quarter ended March 31, 2015, though, had waited a median of more than a year (369 days).
TABLE 3.3
HARDEST HIT FUND MORTGAGE MODIFICATION PROGRAMS FOR WHICH HOMEOWNERS HAD TO WAIT A MEDIAN OF AT LEAST THREE MONTHS, PROGRAM TO DATE, AS REPORTED TO TREASURY AS OF 6/30/2015
State Program
Median Days to Obtain Assistance -
During Q1 2015
Median Days to Obtain Assistance -
During Q2 2015
Median Days to Obtain Assistance - Program
To Date (Q2 2015)
Ohio Lien Elimination Program 532 573 251
Ohio Modification With Contribution Assistance 440 711 233
Rhode Island Principal Reduction Program * * 223
Indiana Recast/Modification Program 309 208 211
Michigan Modification Plan Program 134 159 199
South Carolina Modification Assistance Program 137 161 168
Florida Principal Reduction Program 210 147 154
Rhode Island Loan Modification Assistance Program (LMA) 13 11 143
Georgia Recast/Modification 369 142 142
Oregon Loan Refinancing Assistance Pilot Project 319 425 142
Nevada Principal Reduction Program * * 132
Michigan Principal Curtailment Program * * 120
Alabama Loan Modification Assistance Program 136 92 108* State reported to Treasury either “NA” or zero activity for this program in this period.
Source: Treasury’s Q2 2015 Quarterly Performance Reports, accessed from Treasury’s Hardest Hit Fund – State by State Information website, www.treasury.gov/initiatives/financial-stability/TARP-Programs/housing/Pages/Program-Documents.aspx, accessed 10/1/2015.
SPECIAL INSPECTOR GENERAL I TROUBLED ASSET RELIEF PROGRAM10
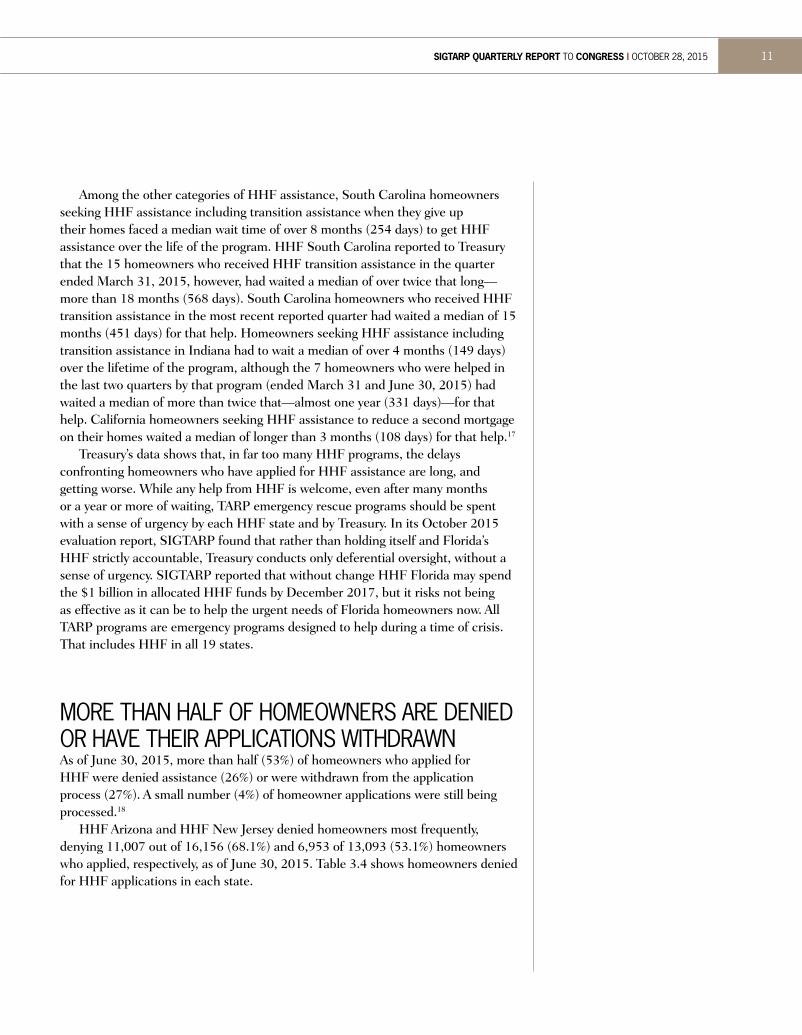
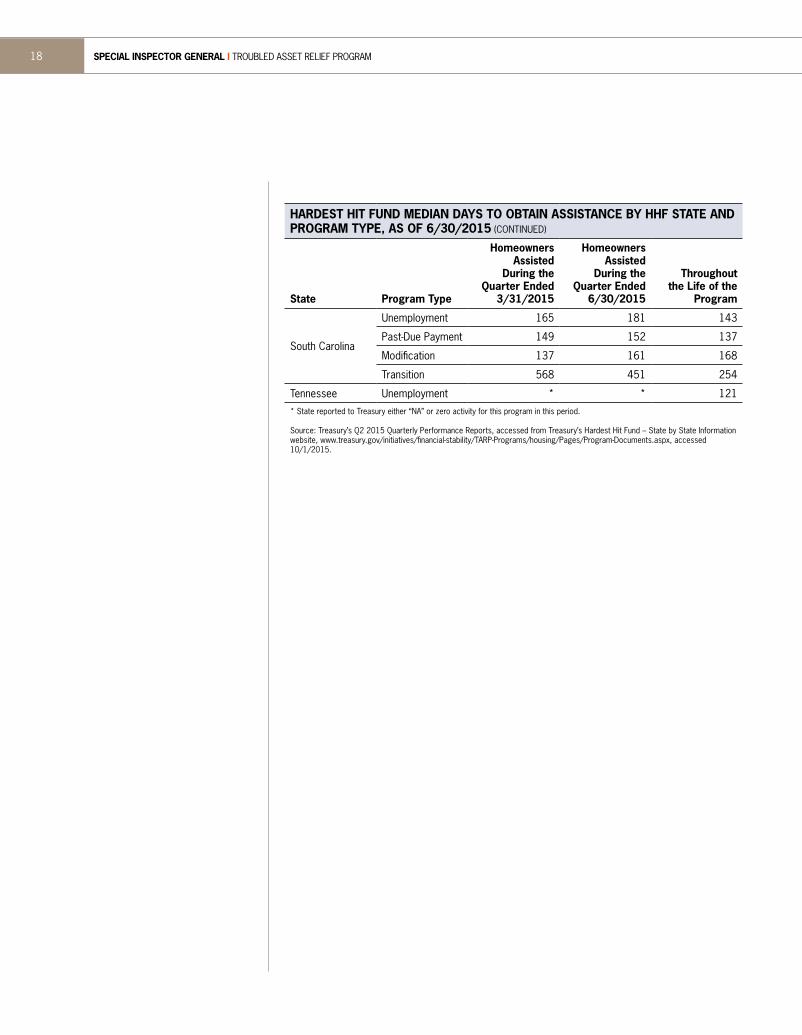
Among the other categories of HHF assistance, South Carolina homeowners seeking HHF assistance including transition assistance when they give up their homes faced a median wait time of over 8 months (254 days) to get HHF assistance over the life of the program. HHF South Carolina reported to Treasury that the 15 homeowners who received HHF transition assistance in the quarter ended March 31, 2015, however, had waited a median of over twice that long—more than 18 months (568 days). South Carolina homeowners who received HHF transition assistance in the most recent reported quarter had waited a median of 15 months (451 days) for that help. Homeowners seeking HHF assistance including transition assistance in Indiana had to wait a median of over 4 months (149 days) over the lifetime of the program, although the 7 homeowners who were helped in the last two quarters by that program (ended March 31 and June 30, 2015) had waited a median of more than twice that—almost one year (331 days)—for that help. California homeowners seeking HHF assistance to reduce a second mortgage on their homes waited a median of longer than 3 months (108 days) for that help.17
Treasury’s data shows that, in far too many HHF programs, the delays confronting homeowners who have applied for HHF assistance are long, and getting worse. While any help from HHF is welcome, even after many months or a year or more of waiting, TARP emergency rescue programs should be spent with a sense of urgency by each HHF state and by Treasury. In its October 2015 evaluation report, SIGTARP found that rather than holding itself and Florida’s HHF strictly accountable, Treasury conducts only deferential oversight, without a sense of urgency. SIGTARP reported that without change HHF Florida may spend the $1 billion in allocated HHF funds by December 2017, but it risks not being as effective as it can be to help the urgent needs of Florida homeowners now. All TARP programs are emergency programs designed to help during a time of crisis. That includes HHF in all 19 states.
MORE THAN HALF OF HOMEOWNERS ARE DENIED OR HAVE THEIR APPLICATIONS WITHDRAWN As of June 30, 2015, more than half (53%) of homeowners who applied for HHF were denied assistance (26%) or were withdrawn from the application process (27%). A small number (4%) of homeowner applications were still being processed.18
HHF Arizona and HHF New Jersey denied homeowners most frequently, denying 11,007 out of 16,156 (68.1%) and 6,953 of 13,093 (53.1%) homeowners who applied, respectively, as of June 30, 2015. Table 3.4 shows homeowners denied for HHF applications in each state.
SIGTARP QUARTERLY REPORT TO CONGRESS I OCTOBER 28, 2015 11
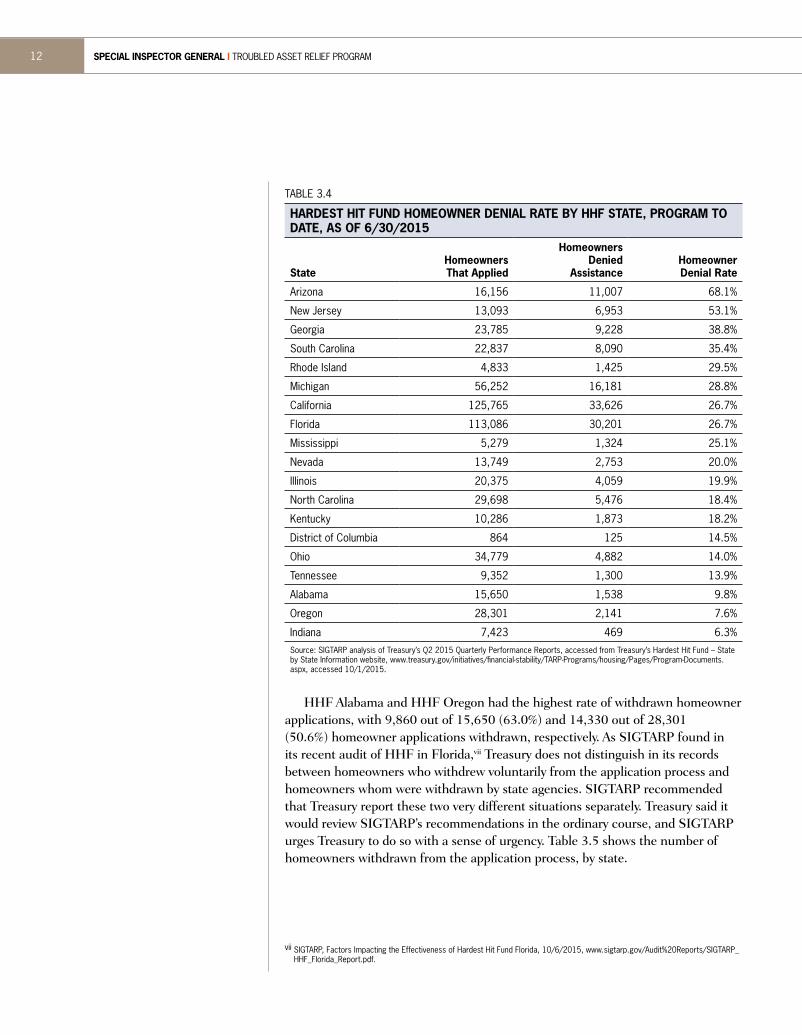
TABLE 3.4
HARDEST HIT FUND HOMEOWNER DENIAL RATE BY HHF STATE, PROGRAM TO DATE, AS OF 6/30/2015
StateHomeowners That Applied
Homeowners Denied
AssistanceHomeowner Denial Rate
Arizona 16,156 11,007 68.1%
New Jersey 13,093 6,953 53.1%
Georgia 23,785 9,228 38.8%
South Carolina 22,837 8,090 35.4%
Rhode Island 4,833 1,425 29.5%
Michigan 56,252 16,181 28.8%
California 125,765 33,626 26.7%
Florida 113,086 30,201 26.7%
Mississippi 5,279 1,324 25.1%
Nevada 13,749 2,753 20.0%
Illinois 20,375 4,059 19.9%
North Carolina 29,698 5,476 18.4%
Kentucky 10,286 1,873 18.2%
District of Columbia 864 125 14.5%
Ohio 34,779 4,882 14.0%
Tennessee 9,352 1,300 13.9%
Alabama 15,650 1,538 9.8%
Oregon 28,301 2,141 7.6%
Indiana 7,423 469 6.3%Source: SIGTARP analysis of Treasury’s Q2 2015 Quarterly Performance Reports, accessed from Treasury’s Hardest Hit Fund – State by State Information website, www.treasury.gov/initiatives/financial-stability/TARP-Programs/housing/Pages/Program-Documents.aspx, accessed 10/1/2015.
HHF Alabama and HHF Oregon had the highest rate of withdrawn homeowner
applications, with 9,860 out of 15,650 (63.0%) and 14,330 out of 28,301 (50.6%) homeowner applications withdrawn, respectively. As SIGTARP found in its recent audit of HHF in Florida,vii Treasury does not distinguish in its records between homeowners who withdrew voluntarily from the application process and homeowners whom were withdrawn by state agencies. SIGTARP recommended that Treasury report these two very different situations separately. Treasury said it would review SIGTARP’s recommendations in the ordinary course, and SIGTARP urges Treasury to do so with a sense of urgency. Table 3.5 shows the number of homeowners withdrawn from the application process, by state.
vii SIGTARP, Factors Impacting the Effectiveness of Hardest Hit Fund Florida, 10/6/2015, www.sigtarp.gov/Audit%20Reports/SIGTARP_HHF_Florida_Report.pdf.
SPECIAL INSPECTOR GENERAL I TROUBLED ASSET RELIEF PROGRAM12
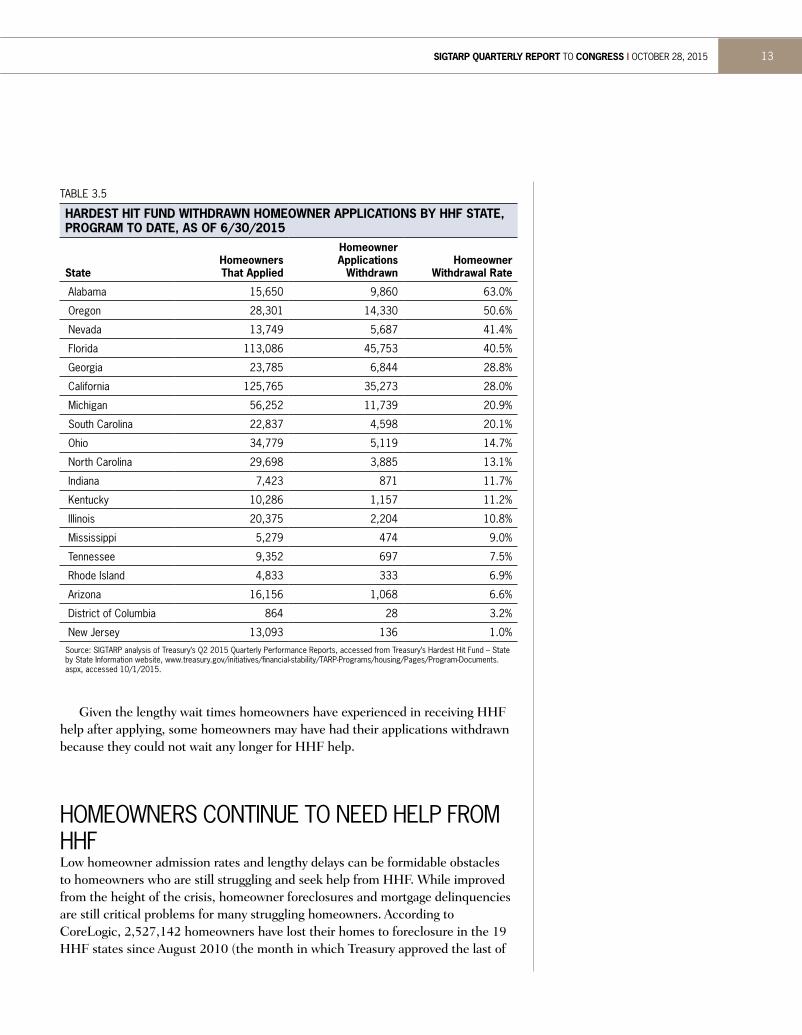
TABLE 3.5
HARDEST HIT FUND WITHDRAWN HOMEOWNER APPLICATIONS BY HHF STATE, PROGRAM TO DATE, AS OF 6/30/2015
StateHomeowners That Applied
Homeowner Applications
WithdrawnHomeowner
Withdrawal Rate
Alabama 15,650 9,860 63.0%
Oregon 28,301 14,330 50.6%
Nevada 13,749 5,687 41.4%
Florida 113,086 45,753 40.5%
Georgia 23,785 6,844 28.8%
California 125,765 35,273 28.0%
Michigan 56,252 11,739 20.9%
South Carolina 22,837 4,598 20.1%
Ohio 34,779 5,119 14.7%
North Carolina 29,698 3,885 13.1%
Indiana 7,423 871 11.7%
Kentucky 10,286 1,157 11.2%
Illinois 20,375 2,204 10.8%
Mississippi 5,279 474 9.0%
Tennessee 9,352 697 7.5%
Rhode Island 4,833 333 6.9%
Arizona 16,156 1,068 6.6%
District of Columbia 864 28 3.2%
New Jersey 13,093 136 1.0%Source: SIGTARP analysis of Treasury’s Q2 2015 Quarterly Performance Reports, accessed from Treasury’s Hardest Hit Fund – State by State Information website, www.treasury.gov/initiatives/financial-stability/TARP-Programs/housing/Pages/Program-Documents.aspx, accessed 10/1/2015.
Given the lengthy wait times homeowners have experienced in receiving HHF help after applying, some homeowners may have had their applications withdrawn because they could not wait any longer for HHF help.
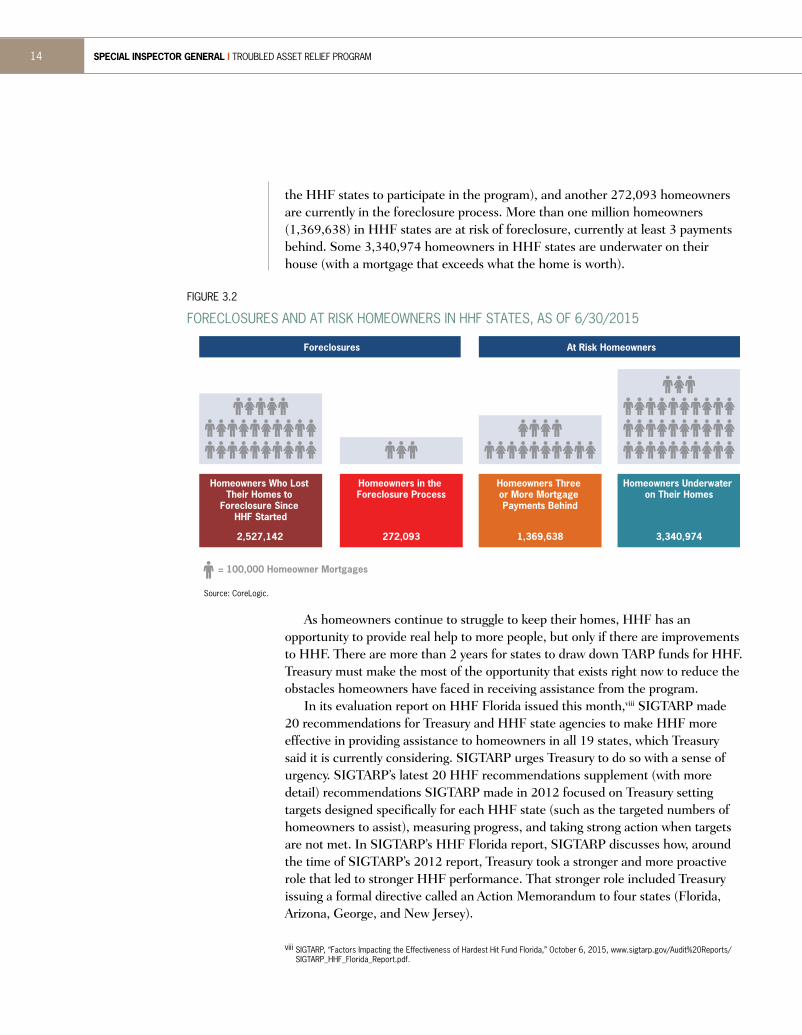
HOMEOWNERS CONTINUE TO NEED HELP FROM HHFLow homeowner admission rates and lengthy delays can be formidable obstacles to homeowners who are still struggling and seek help from HHF. While improved from the height of the crisis, homeowner foreclosures and mortgage delinquencies are still critical problems for many struggling homeowners. According to CoreLogic, 2,527,142 homeowners have lost their homes to foreclosure in the 19 HHF states since August 2010 (the month in which Treasury approved the last of
SIGTARP QUARTERLY REPORT TO CONGRESS I OCTOBER 28, 2015 13
As homeowners continue to struggle to keep their homes, HHF has an opportunity to provide real help to more people, but only if there are improvements to HHF. There are more than 2 years for states to draw down TARP funds for HHF. Treasury must make the most of the opportunity that exists right now to reduce the obstacles homeowners have faced in receiving assistance from the program.
In its evaluation report on HHF Florida issued this month,viii SIGTARP made 20 recommendations for Treasury and HHF state agencies to make HHF more effective in providing assistance to homeowners in all 19 states, which Treasury said it is currently considering. SIGTARP urges Treasury to do so with a sense of urgency. SIGTARP’s latest 20 HHF recommendations supplement (with more detail) recommendations SIGTARP made in 2012 focused on Treasury setting targets designed specifically for each HHF state (such as the targeted numbers of homeowners to assist), measuring progress, and taking strong action when targets are not met. In SIGTARP’s HHF Florida report, SIGTARP discusses how, around the time of SIGTARP’s 2012 report, Treasury took a stronger and more proactive role that led to stronger HHF performance. That stronger role included Treasury issuing a formal directive called an Action Memorandum to four states (Florida, Arizona, George, and New Jersey).
viii SIGTARP, “Factors Impacting the Effectiveness of Hardest Hit Fund Florida,” October 6, 2015, www.sigtarp.gov/Audit%20Reports/SIGTARP_HHF_Florida_Report.pdf.
the HHF states to participate in the program), and another 272,093 homeowners are currently in the foreclosure process. More than one million homeowners (1,369,638) in HHF states are at risk of foreclosure, currently at least 3 payments behind. Some 3,340,974 homeowners in HHF states are underwater on their house (with a mortgage that exceeds what the home is worth).
Foreclosures At Risk Homeowners
Homeowners Who Lost Their Homes to
Foreclosure Since HHF Started
= 100,000 Homeowner Mortgages
Homeowners in the Foreclosure Process
Homeowners Three or More Mortgage Payments Behind
Homeowners Underwater on Their Homes
2,527,142 272,093 1,369,638 3,340,974
FIGURE 3.2
FORECLOSURES AND AT RISK HOMEOWNERS IN HHF STATES, AS OF 6/30/2015
Source: CoreLogic.
SPECIAL INSPECTOR GENERAL I TROUBLED ASSET RELIEF PROGRAM14
Creativity does not matter if HHF is not effective in reaching homeowners. HHF performance numbers shown in this report (all based on Treasury data) highlight that Treasury must focus more on the word “effective” in their oversight of HHF, and must act with a sense of urgency. Although Treasury continues to say that targets for state agencies violate the fundamental principles of HHF, SIGTARP recently learned (after release of its most recent report on HHF Florida) that Treasury itself had done exactly what SIGTARP recommends. On July 10, 2015, Treasury sent another formal directive (like the ones sent in 2012) to Alabama’s housing finance agency in HHF holding Alabama’s HFA accountable to targeted numbers of homeowners to be assisted in each of four HHF programs. Treasury measured HHF Alabama’s performance against those targets, and found performance lacking and that HHF Alabama has fallen behind other states. Treasury requested a formal written plan identifying measurable targets for homeowners assisted (and blighted structures removed) over the next four quarters and specific action to reach those targets. Treasury also set a goal for the amount of HHF funds to be committed each month. This is the type of strong initial action that SIGTARP recommended that Treasury take to improve HHF so that it effectively provides assistance to homeowners. Treasury must follow through with strong action to improve the effectiveness of HHF Alabama with a sense of urgency, and take similar action with other states.
SIGTARP QUARTERLY REPORT TO CONGRESS I OCTOBER 28, 2015 15
APPENDIX 3.1
HARDEST HIT FUND MEDIAN DAYS TO OBTAIN ASSISTANCE BY HHF STATE AND PROGRAM TYPE, AS OF 6/30/2015
State Program Type
Homeowners Assisted
During the Quarter Ended
3/31/2015
Homeowners Assisted
During the Quarter Ended
6/30/2015
Throughout the Life of the
Program
Alabama
Unemployment 74 74 81
Transition * * *
Modification 136 92 108
Arizona
Modification 58 70 49
Second Lien Reduction 72 91 70
Unemployment 71 73 59
Transition 186 84 132
California
Unemployment 50 52 39
Modification 63 61 78
Past-Due Payment 71 66 68
Transition 58 63 57
Second Lien Reduction * * 108
Past-Due Payment 92 102 96
District of Columbia Unemployment 101 135 145
Florida
Past-Due Payment 167 153 224
Unemployment 174 167 167
Modification * * *
Modification 210 147 154
Past-Due Payment 280 324 199
Georgia
Unemployment 155 153 160
Past-Due Payment 180 182 181
Modification 369 142 142
Illinois
Unemployment 669 720 165
Modification * * *
Modification 60 88 48
Indiana
Unemployment 121 105 142
Modification 309 208 211
Transition 331 331 149
Kentucky Unemployment 45 45 49
Continued on next page
SPECIAL INSPECTOR GENERAL I TROUBLED ASSET RELIEF PROGRAM16

HARDEST HIT FUND MEDIAN DAYS TO OBTAIN ASSISTANCE BY HHF STATE AND PROGRAM TYPE, AS OF 6/30/2015 (CONTINUED)
State Program Type
Homeowners Assisted
During the Quarter Ended
3/31/2015
Homeowners Assisted
During the Quarter Ended
6/30/2015
Throughout the Life of the
Program
Michigan
Past-Due Payment 188 219 144
Modification * * 120
Unemployment 129 129 95
Modification 134 159 199
Mississippi Unemployment 93 94 108
Nevada
Modification * * 132
Second Lien Reduction * * 59
Transition * * 66
Unemployment 79 80 78
Unemployment * * 126
New Jersey Unemployment 881 1,158 188
North Carolina
Unemployment 75 63 98
Unemployment 73 79 71
Second Lien Reduction 105 78 101
Modification 145 66 67
Ohio
Unemployment 426 710 198
Modification 440 711 233
Past-Due Payment 474 519 197
Transition 1,367 * 366
Past-Due Payment 494 538 266
Modification * * *
Modification 532 573 251
Oregon
Unemployment 213 213 159
Past-Due Payment 244 309 135
Modification 319 425 142
Modification * * *
Rhode Island
Modification 13 11 143
Past-Due Payment * * 144
Transition * * 118
Unemployment * * 181
Modification * * 223
Continued on next page
SIGTARP QUARTERLY REPORT TO CONGRESS I OCTOBER 28, 2015 17
HARDEST HIT FUND MEDIAN DAYS TO OBTAIN ASSISTANCE BY HHF STATE AND PROGRAM TYPE, AS OF 6/30/2015 (CONTINUED)
State Program Type
Homeowners Assisted
During the Quarter Ended
3/31/2015
Homeowners Assisted
During the Quarter Ended
6/30/2015
Throughout the Life of the
Program
South Carolina
Unemployment 165 181 143
Past-Due Payment 149 152 137
Modification 137 161 168
Transition 568 451 254
Tennessee Unemployment * * 121* State reported to Treasury either “NA” or zero activity for this program in this period.
Source: Treasury’s Q2 2015 Quarterly Performance Reports, accessed from Treasury’s Hardest Hit Fund – State by State Information website, www.treasury.gov/initiatives/financial-stability/TARP-Programs/housing/Pages/Program-Documents.aspx, accessed 10/1/2015.
SPECIAL INSPECTOR GENERAL I TROUBLED ASSET RELIEF PROGRAM18
1. RealtyTrac, “Foreclosure Activity Increases 81 Percent In 2008,” 1/15/2009, www.realtytrac.com/content/press-releases/foreclosure-activity-increases-81-percent-in-2008-4551, accessed 10/20/2015.
2. Emergency Economic Stabilization Act of 2008, P.L. 110-343, 10/3/2008.3. The White House, “Help for the Hardest Hit Housing Markets,” 2/19/2010, www.
whitehouse.gov/the-press-office/help-hardest-hit-housing-markets, accessed 9/25/2015.4. Treasury, Hardest Hit Fund Performance Summary report website, www.treasury.gov/
initiatives/financial-stability/reports/Pages/HHF.aspx, accessed 10/7/2015.5. Treasury, Housing Finance Agency (HFA) Aggregate Report, 6/30/2015, www.treasury.gov/
initiatives/financial-stability/reports/Pages/Housing-Finance-Agency-Aggregate-Report.aspx, accessed 10/7/2015.
6. SIGTARP analysis of Treasury’s Q2 2015 Quarterly Performance Reports, accessed from Treasury’s Hardest Hit Fund – State by State Information website, www.treasury.gov/initiatives/financial-stability/TARP-Programs/housing/Pages/Program-Documents.aspx, accessed 10/1/2015.
7. Treasury, Hardest Hit Fund Performance Summary report website, www.treasury.gov/initiatives/financial-stability/reports/Pages/HHF.aspx, accessed 10/7/2015.
8. Treasury, Housing Finance Agency (HFA) Aggregate Report, 6/30/2015, www.treasury.gov/initiatives/financial-stability/reports/Pages/Housing-Finance-Agency-Aggregate-Report.aspx, accessed 10/7/2015.
9. Treasury, response to SIGTARP data call 10/5/2015. 10. SIGTARP analysis of Treasury’s Q2 2015 Quarterly Performance Reports, accessed from
Treasury’s Hardest Hit Fund – State by State Information website, www.treasury.gov/initiatives/financial-stability/TARP-Programs/housing/Pages/Program-Documents.aspx, accessed 10/1/2015.
11. Treasury, Housing Finance Agency (HFA) Aggregate Reports as of 6/30/2015 and 6/30/2014, www.treasury.gov/initiatives/financial-stability/reports/Pages/Housing-Finance-Agency-Aggregate-Report.aspx, accessed 10/7/2015.
12. SIGTARP, Quarterly Report to Congress, July 29, 2015, www.sigtarp.gov/Quarterly%20Reports/July_29_2015_Report_to_Congress.pdf.
13. SIGTARP, Quarterly Report to Congress, July 29, 2015, www.sigtarp.gov/Quarterly%20Reports/July_29_2015_Report_to_Congress.pdf.
14. SIGTARP analysis of Treasury’s Q2 2015 Quarterly Performance Reports, accessed from Treasury’s Hardest Hit Fund – State by State Information website, www.treasury.gov/initiatives/financial-stability/TARP-Programs/housing/Pages/Program-Documents.aspx, accessed 10/1/2015.
15. Treasury, response to SIGTARP data call 10/5/2015.16. SIGTARP analysis of Treasury’s Q2 2015 Quarterly Performance Reports, accessed from
Treasury’s Hardest Hit Fund – State by State Information website, www.treasury.gov/initiatives/financial-stability/TARP-Programs/housing/Pages/Program-Documents.aspx, accessed 10/1/2015.
17. SIGTARP analysis of Treasury’s Q2 2015 Quarterly Performance Reports, accessed from Treasury’s Hardest Hit Fund – State by State Information website, www.treasury.gov/initiatives/financial-stability/TARP-Programs/housing/Pages/Program-Documents.aspx, accessed 10/1/2015.
18. SIGTARP analysis of Treasury’s Q2 2015 Quarterly Performance Reports, accessed from Treasury’s Hardest Hit Fund – State by State Information website, www.treasury.gov/initiatives/financial-stability/TARP-Programs/housing/Pages/Program-Documents.aspx, accessed 10/1/2015.
SIGTARP QUARTERLY REPORT TO CONGRESS I OCTOBER 28, 2015 19


SIGTARP HOTLINEIf you are aware of fraud, waste, abuse, mismanagement, or misrepresentations associated with the Troubled Asset Relief Program, please contact the SIGTARP Hotline.By Online Form: www.SIGTARP.govBy Phone: Call toll free: (877) SIG-2009By Fax: (202) 622-4559By Mail: Hotline: Office of the Special Inspector General for the Troubled Asset Relief Program 1801 L Street., NW, 3rd Floor Washington, D.C. 20220
PRESS INQUIRIESIf you have any inquiries, please contact our Press Office: Troy Gravitt Director of Communications [email protected] 202-927-8940
LEGISLATIVE AFFAIRSFor Congressional inquiries, please contact our Legislative Affairs Office: Joseph Cwiklinski Director of Legislative Affairs [email protected] 202-927-9159
OBTAINING COPIES OF TESTIMONY AND REPORTSTo obtain copies of testimony and reports, please log on to our website at www.SIGTARP.gov.
TROUBLED ASSET RELIEF PROGRA
M
SPEC
IAL INSPECTOR GENERAL