home, or nursing home? the effect of medical innovation on the demand for long-term care frank r....
TRANSCRIPT

Home, or nursing home?The effect of medical innovation on
the demand for long-term care
Frank R. Lichtenberg
Columbia University and National Bureau of Economic Research

2
Nursing home residence rates, by single year of age (age 65-95): 1999 vs. 1985
0%5%
10%15%20%25%30%35%40%45%50%
65 68 71 74 77 80 83 86 89 92 95
Age
1985
1999

3
Nursing-home residence rates
4.5%
14.8%
5.5%
15.6%
4.2%
11.8%
0%
2%
4%
6%
8%
10%
12%
14%
16%
18%
Age 65 and over Age 80 and over
1985 actual
1999 predicted at 1985 age-specific rates
1999 actual

4
• According to the Consumer Expenditure Survey, per capita expenditure by community residents age 75 and over was $12,505 in 2002
• According to the National Nursing Home Survey, average annual charges to nursing home residents age 75 and over was $42,160 in 1999
• The cost of living in a nursing home was over three times as high as the cost of living in the community
• Reducing the rate of nursing home residence therefore reduces the average cost of living among the elderly

5
Relative per capita expenditure of nursing-home and community residents, by age group
1 2 3 4 5 6
Community residentsNursing home
residents 5 / 4
Age of reference person
Average annual
expenditures per
household, 2002
Average no. of people
in household
Average annual expenditure
s per person,
2002
Average annual charges,
1999
65-74 $32,243 1.5 $21,495 $41,008 191%
75 and over $23,759 1.9 $12,505 $42,160 337%

6
• In 1999, there were 9.0 million Americans age 80 and over.
• In 1999 the nursing home residence rate among people age 80 and over was 3.8 percentage points (= 15.6% - 11.8%) lower than it would have been if age-specific nursing home residence rates had remained at their 1985 levels.
• As a result of the decline in nursing home residence rates, 341 thousand (= (15.6% - 11.8%) * 9.0 million) fewer Americans age 80 and over resided in nursing homes in 1999.
• This reduced the total costs incurred by Americans age 80 and over by $10.1 billion (= 341,000 * ($42,160 - $12,505)) in 1999.
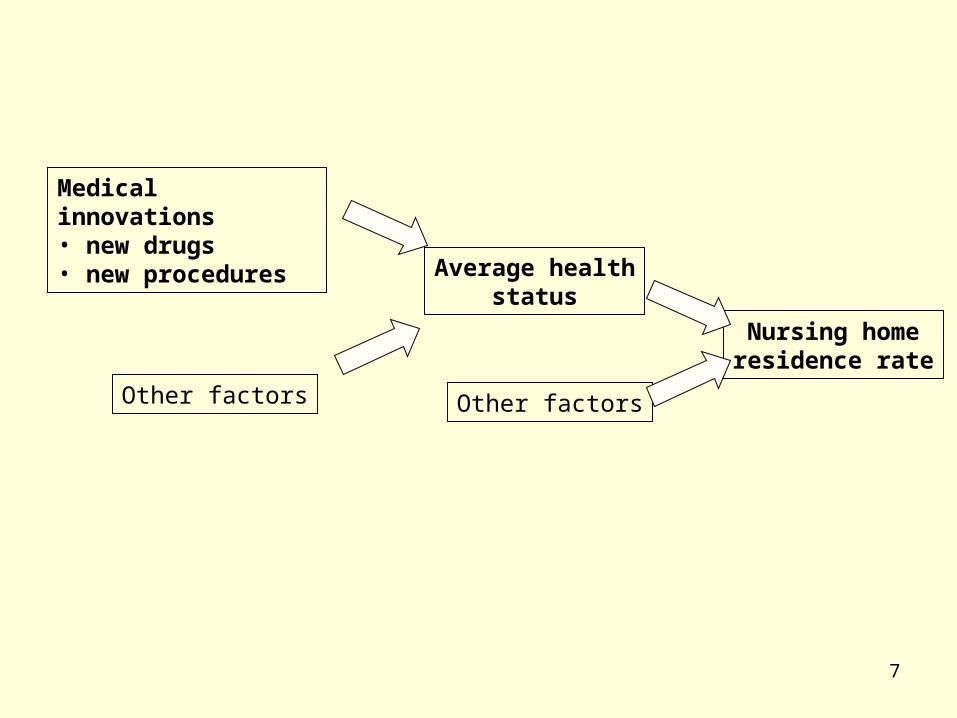
7
Nursing homeresidence rate
Average healthstatus
Other factors
Medical innovations• new drugs• new procedures
Other factors

8
New goods and economic growth
• Solow (1962): “technological progress needs to be ‘embodied’ in newly produced…goods before there can be any effect on output.” (Technical Progress, Capital Formation, and Economic Growth)
• Grossman and Helpman (1991): “innovative goods are better than older products simply because they provide more ‘product services’ in relation to their cost of production” (Innovation and Growth in the Global Economy)
• Bresnahan and Gordon (1996): “New goods are at the heart of economic progress.” (The Economics of New Goods)
• Bils (2005): “much of economic growth occurs through growth in quality as new models of consumer goods replace older, sometimes inferior, models.” (Measuring the Growth from Better and Better Goods)

9
HealthHmin

10
health distrib.vintage distrib. of med.goods & services
Hmin

11
Prob(NHit) = Φ[j j NEW%ijt + i + t] + it
Φ = the standard cumulative normal probability distribution
Prob(NHit) = the probability that an elderly person with disease i in year t (t = 1985, 1997, 1999) resides in a nursing home (as opposed to the community)
NEW%ijt = the fraction of medical goods or procedures of type j used to treat disease i in year t that were introduced after 1985
i = a fixed effect for disease i
t = a fixed effect for year t
it = a disturbance

12
• The fixed disease effects control for non-innovation determinants of nursing home residence that vary across diseases but are constant (or change slowly) over time.
• The fixed year effects control for non-innovation determinants of nursing home residence that change over time (e.g. Medicaid policy) but do not vary across diseases.
• Of course, for estimates of to be consistent, it must be the case that non-innovation determinants of nursing home residence not controlled for by the fixed disease and year effects be uncorrelated with the measures of medical innovation.

13
Measuring the shift in the vintage distribution of medical goods and services
• There are a number of possible ways to measure the shift in the vintage distribution of medical goods and services.
• An obvious way is to measure the change in the mean vintage. • I will instead use the change in the % of medical goods and services
whose vintage exceeds a certain value (1985). • There are two good reasons for this, both related to incomplete data.
– First, vintage data are left-censored: for many procedures (and some drugs), we know only that their vintage is below a certain value.
– Second, we have good data on the utilization of drugs and procedures since 1997, but not before that year. Hence, we can’t determine the mean vintage of drugs and procedures used in 1985, but we know the % of drugs and procedures used in 1985 that were introduced after 1985: zero!
• I will calculate the fraction of medical goods or procedures of type j used to treat all people, not just the elderly, with disease i in year t that were introduced after 1985. Most of the drug utilization data, and the vast majority of the procedure utilization data, I have are for people under age 65.

14
28%
7%
43%
22%DiagnosticProcedures
LaboratoryProcedures
Therapeutic andPreventiveProcedures
Prescriptionmedicines
15
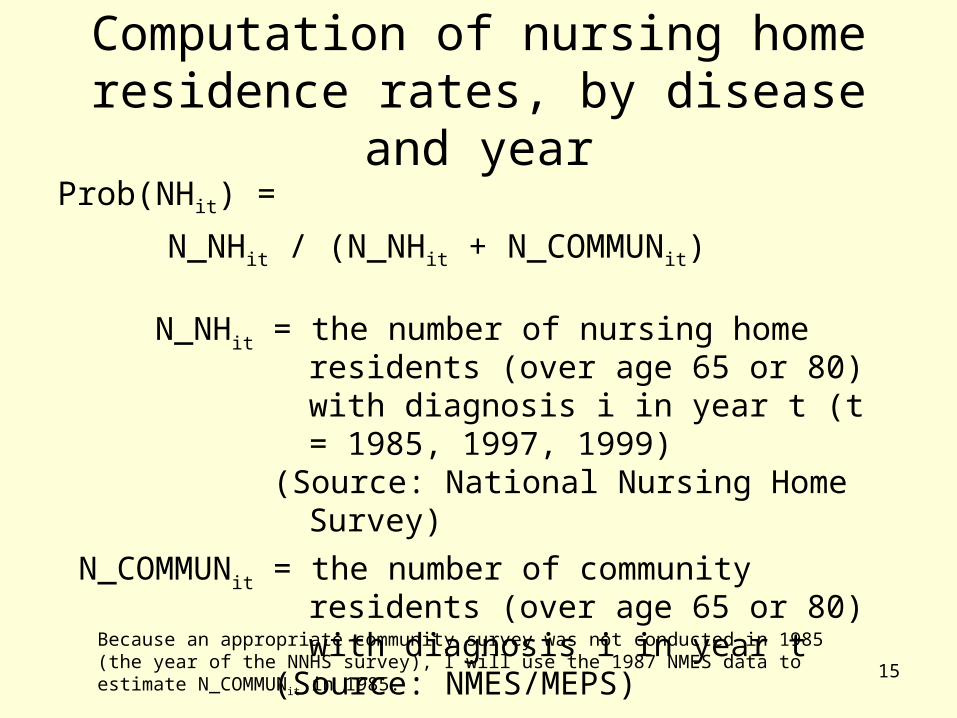
Computation of nursing home residence rates, by disease and year
Prob(NHit) =
N_NHit / (N_NHit + N_COMMUNit)
N_NHit = the number of nursing home residents (over age 65 or 80) with diagnosis i in year t (t = 1985, 1997, 1999)
(Source: National Nursing Home Survey)
N_COMMUNit = the number of community residents (over age 65 or 80) with diagnosis i in year t
(Source: NMES/MEPS)
Because an appropriate community survey was not conducted in 1985 (the year of the NNHS survey), I will use the 1987 NMES data to estimate N_COMMUN it in 1985.

16
Measuring pharma. innovation
NEW_DRUG%it
= p (POST1985p * N_RXpit) / p N_RXpit
N_RXpit = the number of prescriptions for product p used to treat condition i in year tSource: 1997 and 1999 MEPS Prescribed Medicines files
POST1985p = 1 if product p’s active ingredient was first approved by the FDA after 1985, and = 0 otherwise

17
% of prescriptions that contained ingredients approved after 1985
23%
27%
32%35%
41%45%
46%
0%
5%
10%
15%
20%
25%
30%
35%
40%
45%
50%
1996 1997 1998 1999 2000 2001 2002
18
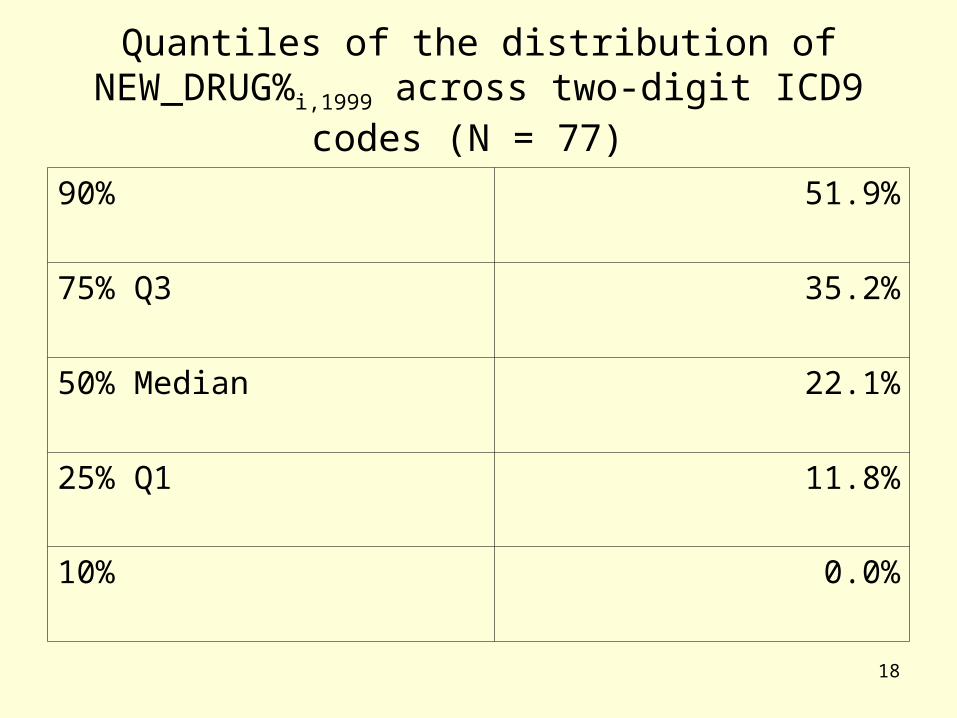
Quantiles of the distribution of NEW_DRUG%i,1999 across two-digit ICD9 codes (N = 77)
90% 51.9%
75% Q3 35.2%
50% Median 22.1%
25% Q1 11.8%
10% 0.0%
19
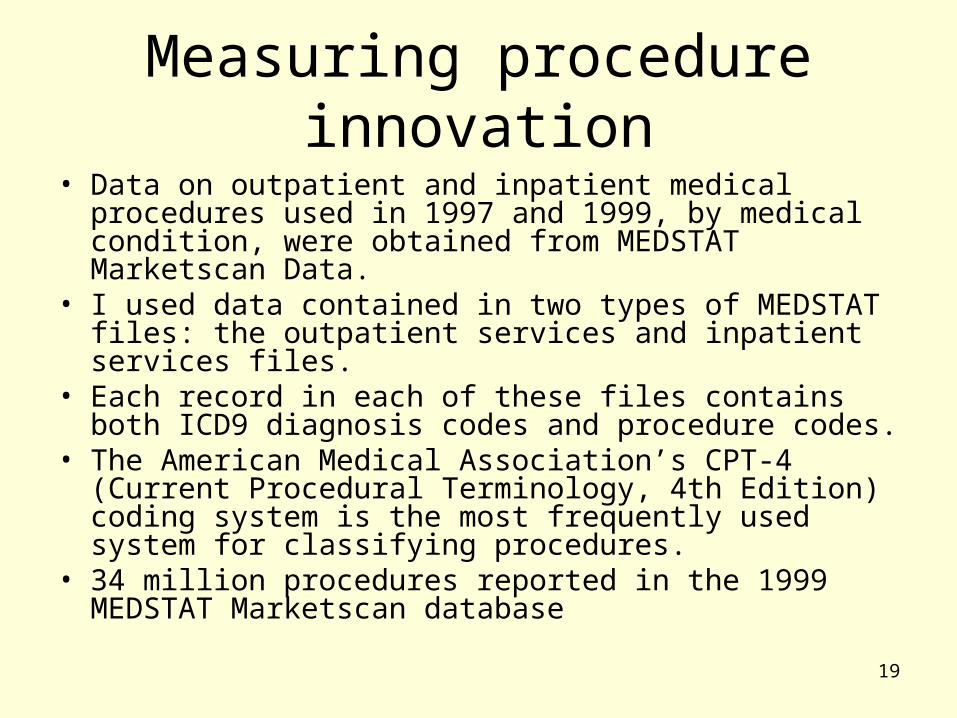
Measuring procedure innovation
• Data on outpatient and inpatient medical procedures used in 1997 and 1999, by medical condition, were obtained from MEDSTAT Marketscan Data.
• I used data contained in two types of MEDSTAT files: the outpatient services and inpatient services files.
• Each record in each of these files contains both ICD9 diagnosis codes and procedure codes.
• The American Medical Association’s CPT-4 (Current Procedural Terminology, 4th Edition) coding system is the most frequently used system for classifying procedures.
• 34 million procedures reported in the 1999 MEDSTAT Marketscan database

20
Measuring procedure vintage
• Determining the vintage of most medical procedures is much more challenging than determining the vintage of drugs, because unlike the introduction of new drugs, the introduction of new procedures is generally not regulated by the FDA.
• A noisy indicator of the vintage of a procedure is the date that the CPT code for that procedure was added to the Common Procedure Coding System established by the Centers for Medicare & Medicaid Services (CMS).
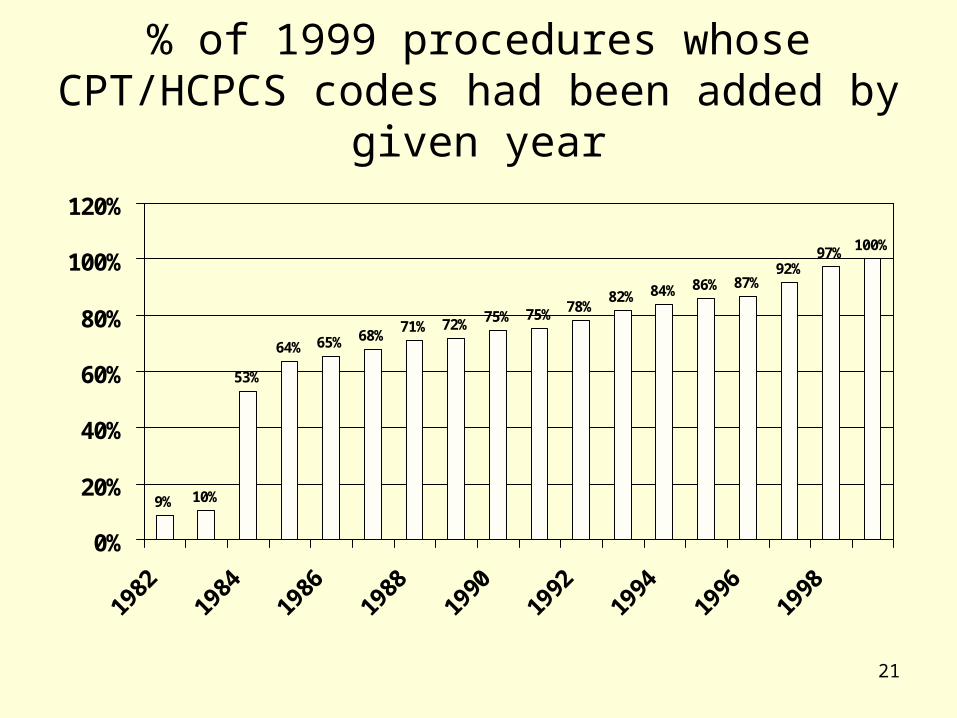
21
% of 1999 procedures whose CPT/HCPCS codes had been added by given year
9% 10%
53%
64% 65% 68%71% 72% 75% 75% 78%
82% 84% 86% 87%92%
97% 100%
0%
20%
40%
60%
80%
100%
120%
1982
1984
1986
1988
1990
1992
1994
1996
1998

22
% of outpatient and inpatient procedures performed in 1997-1999
whose codes were added to HCPCS after 1985
29%
24%27%
33%33%
25%28%
43%
37%
26%30%
48%
0%
10%
20%
30%
40%
50%
60%
All procedures Lab procedures Diagnosticprocedures
Therapeuticprocedures
1997
1998
1999

23
• Closer inspection of the data on medical procedures reveals that some “new” procedures are probably just relabeled or reclassified old procedures, rather than true innovations.
• For example, the three procedures whose codes were added in 1997 which were most frequently performed in 1997 were 98940, 98941, and 98942, which correspond to different types of chiropractic manipulative treatment of the spine. Undoubtedly, this type of treatment was performed well before 1997.
• A new CPT code should therefore be considered a necessary condition for a medical innovation, but not a sufficient condition: all innovations have new CPT codes, but some new CPT codes are not innovations.

24
• The fraction of procedures with new CPT codes exceeds the fraction of truly innovative procedures, perhaps by a significant amount, and the degree of overstatement varies across diseases.
• In the future, I hope to develop a reliable method of distinguishing between truly innovative procedures and old procedures with new CPT codes.
• For now, I will include the fraction of procedures with new CPT codes, despite the limitations of this variable. Although the coefficient on this variable is difficult to interpret, including it may provide a robustness check on the drug coefficient.

25
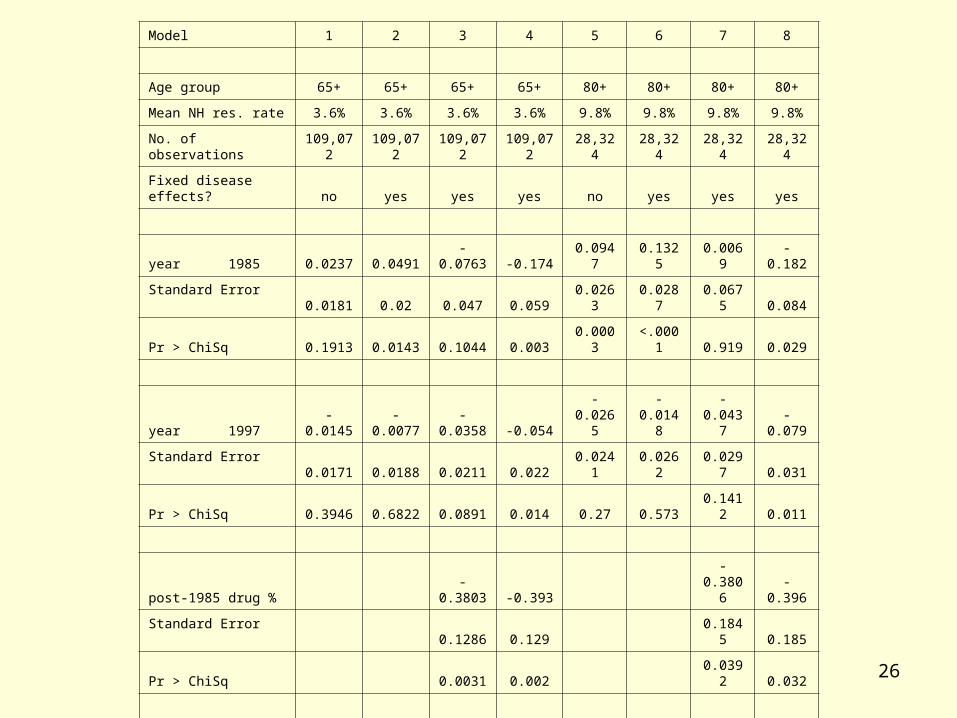
Estimates of eq. (1)
• I estimated probit models of the nursing-home residence rate (eq. (1)) for two different age groups: – people age 65 and over– people age 80 and over
• Model 3 includes drug innovation variable, but not procedure innovation variable– The coefficient on NEW_DRUG% is negative and highly
significant (p-value = .003). – This indicates that diseases with more rapid rates of
pharmaceutical innovation had larger declines in the nursing-home residence rate during the period 1985-1999.
– The 1985 dummy is not significantly different from zero in model 3, which implies that, holding constant NEW_DRUG% (i.e., in the absence of any pharmaceutical innovation), there would have been no decline in the nursing-home residence rate.
26
Model 1 2 3 4 5 6 7 8
Age group 65+ 65+ 65+ 65+ 80+ 80+ 80+ 80+
Mean NH res. rate 3.6% 3.6% 3.6% 3.6% 9.8% 9.8% 9.8% 9.8%
No. of observations 109,072 109,072 109,072 109,072 28,324 28,324 28,324 28,324
Fixed disease effects? no yes yes yes no yes yes yes
year 1985 0.0237 0.0491 -0.0763 -0.174 0.0947 0.1325 0.0069 -0.182
Standard Error 0.0181 0.02 0.047 0.059 0.0263 0.0287 0.0675 0.084
Pr > ChiSq 0.1913 0.0143 0.1044 0.003 0.0003 <.0001 0.919 0.029
year 1997 -0.0145 -0.0077 -0.0358 -0.054 -0.0265 -0.0148 -0.0437 -0.079
Standard Error 0.0171 0.0188 0.0211 0.022 0.0241 0.0262 0.0297 0.031
Pr > ChiSq 0.3946 0.6822 0.0891 0.014 0.27 0.573 0.1412 0.011
post-1985 drug % -0.3803 -0.393 -0.3806 -0.396
Standard Error 0.1286 0.129 0.1845 0.185
Pr > ChiSq 0.0031 0.002 0.0392 0.032
post-1985 procedure % -0.300 -0.591
Standard Error 0.109 0.153
Pr > ChiSq 0.006 0.000
Intercept -1.8019 -2.1766 -2.0469 -1.951 -1.3056 -1.8678 -1.7376 -1.552
Standard Error 0.0125 0.0606 0.0749 0.083 0.0177 0.0774 0.0999 0.111
Pr > ChiSq <.0001 <.0001 <.0001 <.0001 <.0001 <.0001 <.0001 <.0001

27
Evaluation of the effect of pharmaceutical innovation on the nursing home residence rate
• In 1985, the sample mean nursing home residence rate among people age 65 and over was 3.6%.
• The change in the nursing home residence rate attributable to pharmaceutical innovation is
F[F-1(3.6%) + drug mean(NEW_DRUG%)] – 3.6%
where F is the standard normal cumulative distribution and F-1 is its inverse.
28
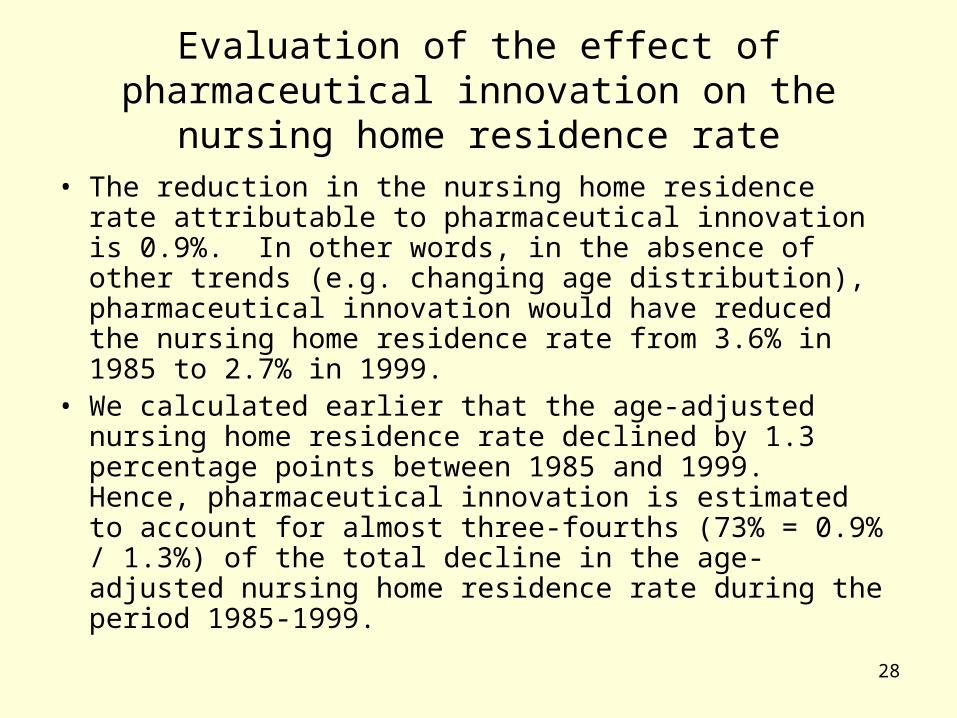
Evaluation of the effect of pharmaceutical innovation on the nursing home residence rate
• The reduction in the nursing home residence rate attributable to pharmaceutical innovation is 0.9%. In other words, in the absence of other trends (e.g. changing age distribution), pharmaceutical innovation would have reduced the nursing home residence rate from 3.6% in 1985 to 2.7% in 1999.
• We calculated earlier that the age-adjusted nursing home residence rate declined by 1.3 percentage points between 1985 and 1999. Hence, pharmaceutical innovation is estimated to account for almost three-fourths (73% = 0.9% / 1.3%) of the total decline in the age-adjusted nursing home residence rate during the period 1985-1999.

29
Cost offset• We calculated above that the average annual cost of living in a
nursing home exceeded the average annual cost of living in the community by $29,655.
• Thus the value per person age 65 and over of the reduction in the 1999 nursing-home residence rate attributable to pharmaceutical innovation might be estimated as $277 (= 0.9% * $29,655).
• This does not account for the presumably greater utility from living in the community.
• According to the Medical Expenditure Panel Survey, in 1999, average expenditure on prescription drugs by people age 65 and over was $948. I estimate that just over half (54%) of this expenditure was on drugs approved after 1985, so average expenditure on new drugs was $508 (= 54% * $948).
• This implies that over half (55% = $277 / $508) of expenditure on new drugs by people age 65 and over was offset by reduced expenditures on nursing home care.

30
Accounting for procedure innovation
• Model 4 in Table 2 includes the procedure innovation variable (NEW_PROC%)—the fraction of procedures performed that had CPT/HCPCS codes added after 1985—as well as the drug innovation variable.
• Like the coefficient on NEW_DRUG%, the coefficient on NEW_PROC% is negative and highly significant, indicating that the introduction and use of both new procedures and new drugs reduced the nursing-home residence rate.
• Controlling for NEW_PROC% has virtually no effect on the estimate of drug or its standard error.

31
Accounting for procedure innovation
• Estimates imply that, in the absence of other trends (e.g. changing age distribution), pharmaceutical and procedure innovation would have reduced the nursing home residence rate from 3.6% in 1985 to 2.0% in 1999.
• This is greater than the 1.3 percentage point decline in the age-adjusted nursing home residence rate between 1985 and 1999.
• Moreover, when we replace the fraction of all procedures that are new by its three components—the fractions of laboratory, diagnostic, and therapeutic procedures that are new—the implied impact of procedure innovation becomes even larger.
• I suspect that the implied impact of procedure innovation is implausibly large due to our inability, at present, to distinguish between truly innovative procedures and old procedures with new CPT codes.
• Even though the procedure innovation measures are imperfect, it is reassuring that controlling for them has virtually no effect on estimates of the impact of drug innovation..

32
“Oldest old” (age 80+) results• Results are qualitatively similar to age 65+ results• In the absence of other trends (e.g. changing age distribution),
pharmaceutical innovation would have reduced the nursing home residence rate from 9.8% in 1985 to 7.7% in 1999
• Hence, pharmaceutical innovation is estimated to account for 56% = (2.1% / 3.8%) of the total decline in the age-adjusted nursing home residence rate of people age 80 and over during the period 1985-1999
• Among people age 80 and over, the reduction in expenditure on nursing home care due to the use of new drugs exceeded expenditure on new drugs by 26% (= ($630 / $501) – 1).
• Implausibly large implied impact of procedure innovation. But the coefficient on the drug innovation measure is essentially unaffected by inclusion of the procedure innovation measure
33
Observation
• Medical innovation will not necessarily reduce crude nursing-home residence rate, since it probably causes movement along, as well as shift of, the age/NH-residence rate profile.