holt hydroelectric project - alabama power company...1.0 introduction the holt hydroelectric project...
TRANSCRIPT

EXHIBIT B PROJECT OPERATIONS
HOLT HYDROELECTRIC PROJECT FERC NO. 2203
DRAFT LICENSE APPLICATION
Alabama Power Company Birmingham, Alabama
Prepared by:
July 2012

EXHIBIT B PROJECT OPERATIONS
HOLT HYDROELECTRIC PROJECT FERC NO. 2203
DRAFT LICENSE APPLICATION
ALABAMA POWER COMPANY BIRMINGHAM, ALABAMA
Prepared by:
July 2012

- i -
EXHIBIT B PROJECT OPERATIONS
HOLT HYDROELECTRIC PROJECT
FERC NO. 2203
ALABAMA POWER COMPANY BIRMINGHAM, ALABAMA
DRAFT LICENSE APPLICATION
TABLE OF CONTENTS
1.0 INTRODUCTION ...............................................................................................................1
2.0 HOLT HYDROELECTRIC PROJECT ...............................................................................2 2.1 PROJECT OPERATIONS ...............................................................................................2
2.1.1 PROJECT OPERATIONS ...................................................................................2 2.1.2 PROTECTION, MITIGATION, AND ENHANCEMENT (PME) MEASURES ............3
2.1.2.1 EXHIBIT G MAP REVISIONS ....................................................... 3 2.1.2.2 CONDUCT WATER QUALITY MONITORING TO COMPLY
WITH THE REQUIREMENTS OF THE 401 WATER QUALITY CERTIFICATION .......................................................................... 4
2.1.2.3 CONTINUE LIGHT MAINTENANCE OF THE OVERLOOK PARK AND CONTINUE DISCUSSIONS WITH USACE AND ADCNR..................................................................................... 5
2.1.2.4 MAINTENANCE OF THE TRANSMISSION LINE.............................. 5 2.2 ESTIMATE OF CAPACITY AND GENERATION ..............................................................6
2.2.1 DEPENDABLE CAPACITY AND AVERAGE ANNUAL GENERATION ..................6 2.2.2 PROJECT FLOWS ............................................................................................6 2.2.3 FLOW DURATION CURVES ............................................................................7 2.2.4 AREA CAPACITY RELATIONSHIP ...................................................................7 2.2.5 POWER PLANT HYDRAULIC CAPACITY .........................................................7 2.2.6 TAILWATER CURVE ......................................................................................8 2.2.7 PLANT CAPABILITY .......................................................................................8 2.2.8 APPLICANT’S PLANS FOR FUTURE DEVELOPMENT ........................................9
3.0 LITERATURE CITED ......................................................................................................10
LIST OF FIGURES FIGURE B-1 BEFORE HOLT CONSTRUCTION .................................................................................4 FIGURE B-2 HOLT AFTER CONSTRUCTION ...................................................................................4 FIGURE B-3 HOLT AFTER CONSTRUCTION ...................................................................................7 FIGURE B-4 TAILWATER RATING CURVE .....................................................................................8 FIGURE B-5 PLANT CAPACITY CURVE ..........................................................................................9

TABLE OF CONTENTS (CONT’D.)
- ii -
LIST OF TABLES
TABLE B-1 MEAN, MAXIMUM AND MINIMUM MONTHLY FLOW STATISTICS FOR THE BLACK WARRIOR RIVER IN THE PROJECT AREA ........................................................6
LIST OF APPENDICES
APPENDIX A FIGURES J:\535\016\Docs\Exhibits\Exhibit B 07-19-12.doc
- 1 -
EXHIBIT B PROJECT OPERATIONS
HOLT HYDROELECTRIC PROJECT
FERC NO. 2203
ALABAMA POWER COMPANY BIRMINGHAM, ALABAMA
DRAFT LICENSE APPLICATION
1.0 INTRODUCTION
The Holt Hydroelectric Project (Project) is comprised of an existing, licensed hydroelectric
facility owned and operated by Alabama Power Company (Alabama Power) and is located on the
Black Warrior River at the U. S. Army Corps of Engineers (USACE) Holt Lock and Dam in
Tuscaloosa County, Alabama. The Project has an electric generating capacity of 46.9 megawatts
(MW). This exhibit provides a detailed description of Project operations in accordance with
Federal Energy Regulatory (FERC) requirements at C.F.R. Section 5.6 and 4.51(c).
The Project is an important component of Alabama Power’s power generation system. Project
generation is necessary in both the short and long term to maintain electric system reliability,
operational flexibility, black start ability, and low cost electricity for Alabama Power customers.
Project generation represents a valuable portion of Alabama Power’s total generation production
and power generated by the Project is transmitted and sold to Alabama Power's customers.

- 2 -
2.0 HOLT HYDROELECTRIC PROJECT
2.1 PROJECT OPERATIONS
2.1.1 PROJECT OPERATIONS
Alabama Power operates the Project based on the USACE’s management of Holt Lake.
USACE’s first priority at the Holt Lock and Dam is to support river navigation. Alabama Power
operates the Project using excess water provided by USACE. Since the electrical generation at
the Project is considered secondary to the USACE’s navigation use, the Project has operational
restrictions from the USACE to which Alabama Power must adhere, as described below:
POOL LEVEL
Limiting elevations for reservoir operation are a maximum of 187 ft msl and a minimum of 186
ft msl, and the reservoir will normally be maintained between these levels. Because of navigation
requirements, based on channel depths in the upper end of the reservoir, the pool must not be
drawn down below elevation 186 ft msl. The upper limit of 187 ft msl will not be exceeded,
except during floods when inflows exceed the full discharge capacity of the project, unless
otherwise directed by the Reservoir Regulation Section.
OPERATION FOR NAVIGATION
The reservoir will be operated to provide 9-foot depths in the navigation channel which extends
approximately 19 miles upstream to Bankhead Lock and Dam. It is expected that very little
maintenance dredging will be required and in general the 9-foot depth will be provided by
controlling the reservoir level at or above elevation 186 ft msl, the lower limit of drawdown.
FLOOD CONTROL OPERATIONS
There is no flood control in the Project; the USACE does implement flood control operations.
During floods, the Holt reservoir will be held at maximum operating pool, elevation 187 ft msl,
by passing the inflow through the spillway gates and/or the power plant until the full discharge
capacity of the spillway is reached. When the full capacity of the spillway is reached, free

- 3 -
overflow with all gates fully opened will prevail until the reservoir peaks and recedes to
elevation 187 ft msl.
2.1.2 PROTECTION, MITIGATION, AND ENHANCEMENT (PME) MEASURES
2.1.2.1 EXHIBIT G MAP REVISIONS
The existing Holt Project Boundary map, formerly Exhibit K, is being revised to file as Exhibit
G, to reflect what actually occurred in erecting the Holt-Holt (Holt) Transmission Line (TL)
during initial construction. Figure B-1 (Before Holt Construction) shows the original proposal to
erect the Holt TL in red (the proposed towers are marked as red circles). The existing Holt-
Gorgas (Gorgas) TL is shown in black and the existing towers are marked as black circles.
During the initial construction of the Holt TL, Alabama Power suspected that that there may be
high voltage interference with the proposed Holt TL as it intersected with the existing Gorgas
TL.
To resolve the high voltage interference, Alabama Power placed the Holt TL on the existing
Gorgas towers (marked as black circles) in Figure B-2 (Holt After Construction). The Holt-
Gorgas line was actually placed where the initial proposed Holt TL is depicted (red circles). The
placement of the Holt TL was not updated on the Exhibit K maps after construction; therefore,
Alabama Power proposes to correct and file revised Exhibit G maps to reflect the existing Holt
TL. Correcting the Project Boundary will involve removing 3.8 acres and adding 7.3 acres. The
removed and added lands are privately owned and Alabama Power has retained the necessary
rights to use these lands for Project purposes.

- 4 -
FIGURE B-1 BEFORE HOLT CONSTRUCTION
FIGURE B-2 HOLT AFTER CONSTRUCTION
2.1.2.2 CONDUCT WATER QUALITY MONITORING TO COMPLY WITH THE REQUIREMENTS OF THE 401 WATER QUALITY CERTIFICATION
Alabama Power proposes to collect dissolved oxygen (DO) and temperature data for two years
following issuance of the new FERC license in accordance with a water quality monitoring plan.
If the monitoring results do not indicate substantial compliance with the state water quality
standard for DO (maintenance of a DO concentration of 4.0 mg/l or greater in turbine releases),
Alabama Power will develop and implement additional measures to increase DO in the releases
from the Project through structural or operational modifications. These measures provide
reasonable assurance that the DO standard of 4.0 mg/l will be met at the Project.

- 5 -
Alabama Power will record DO concentrations and water temperature at 60-minute intervals
during periods of generation following one continuous hour of generation beginning June 1 and
extending through September 30 each year. During flood events, the monitoring may be
temporarily discontinued until tailrace elevations return to normal.
The turbine aeration system will be automatically activated when the intake DO concentration
declines to less than or equal to 4.5 mg/l or less. When the DO concentration rises to 5.0 mg/l or
greater, the aeration system will automatically terminate. The DO in the Holt tailrace will be
calculated as the sum of the incoming DO concentration plus the increase in DO concentration
by the turbine aeration system when it is activated (+0.25 mg/l).
Annual DO monitoring reports will be submitted with appropriate certifications to the Alabama
Department of Environmental Management (ADEM) 90 days following the cessation of
monitoring. Following the final year of monitoring, the complete set of data will be submitted to
ADEM for review and comment prior to submittal to the FERC.
2.1.2.3 CONTINUE LIGHT MAINTENANCE OF THE OVERLOOK PARK AND CONTINUE DISCUSSIONS WITH USACE AND ADCNR
Alabama Power proposes to continue operating and maintaining the recreation area (Overlook
Park and picnic tables) at the Scenic Overlook near the powerhouse. Alabama Power will mow
the grass at the Overlook Park, empty the trash cans, maintain the picnic tables, and preserve the
security (lock the gates) of the Overlook Park. In addition, Alabama Power will continue
discussions with the USACE and ADCNR regarding opportunities to provide additional
recreation access in the tailrace area.
2.1.2.4 MAINTENANCE OF THE TRANSMISSION LINE
Alabama Power will maintain the transmission lines at the Project. Alabama Power will remove
dangerous trees, trim the side of the area, mow the grass, and apply herbicide as needed in
accordance with applicable application guidelines.

- 6 -
2.2 ESTIMATE OF CAPACITY AND GENERATION
2.2.1 DEPENDABLE CAPACITY AND AVERAGE ANNUAL GENERATION
The Project has a dependable capacity of 46.9 MW. The 10 yr historical average annual energy
production is 158,629,700 KWh. The Project will consume approximately 394,000 KWh
annually in station service.
2.2.2 PROJECT FLOWS
Maximum monthly flow in the Black Warrior River has historically occurred in March, while the
minimum monthly flow has historically occurred in October. Mean, maximum, and minimum
monthly flow statistics for the Project, as recorded at the Holt Lock and Dam gage, are presented
in Table B-1. The peak instantaneous daily flow at the Holt Lock and Dam gage was 178,000 cfs
on April 13, 1979 (United States Geological Survey (USGS), 2012).
TABLE B-1 MEAN, MAXIMUM AND MINIMUM MONTHLY FLOW STATISTICS FOR THE
BLACK WARRIOR RIVER IN THE PROJECT AREA (Source: USGS Gage No. 02462951 – Holt Lock and Dam (Period of Record: 1976-2011, 2012))
MONTH MEAN
DISCHARGE (CFS)
MAXIMUM DISCHARGE
(CFS)
MINIMUM DISCHARGE
(CFS) January 12,400 26,030 941.3 February 13,400 46,480 2,869 March 15,300 38,490 2,560 April 11,500 26,820 952.0 May 7,490 33,160 484.8 June 4,160 24,760 787.9 July 3,490 17,140 1,244 August 2,210 4,800 1,203 September 2,970 11,460 864.4 October 2,700 19,010 99.6 November 4,670 20,630 57.7 December 8,520 27,650 98.7

- 7 -
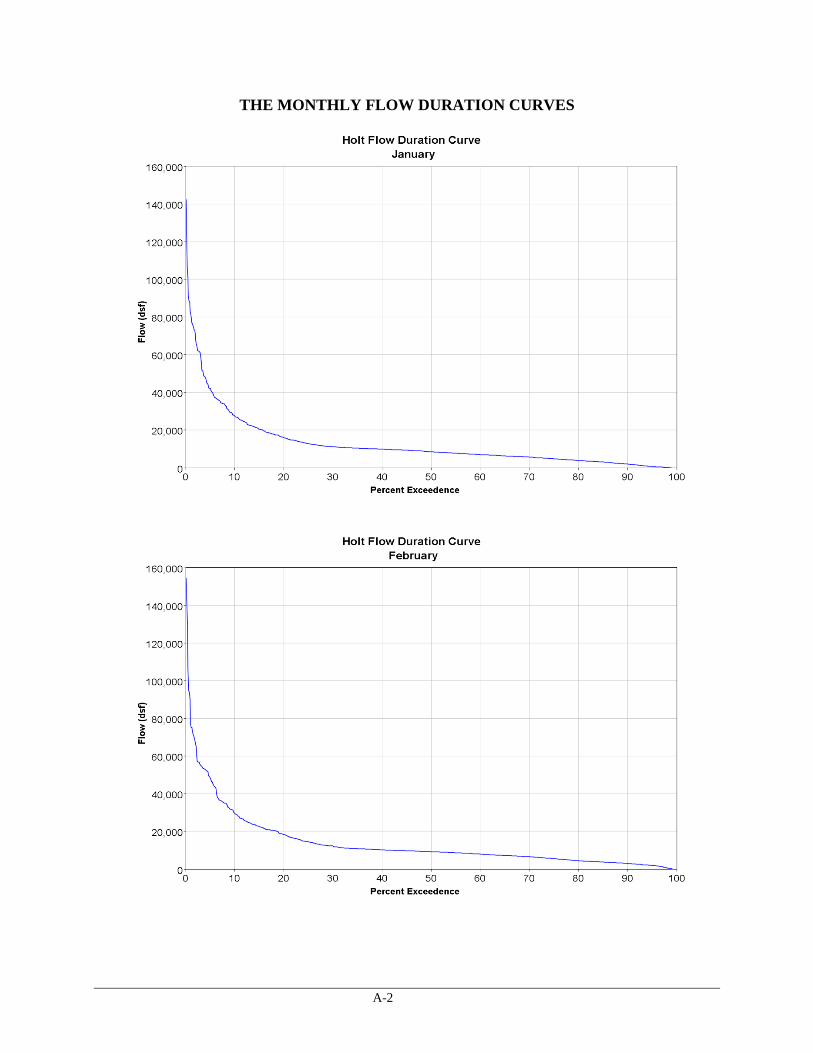
2.2.3 FLOW DURATION CURVES
Monthly flow duration curves are provided in Appendix A.
2.2.4 AREA CAPACITY RELATIONSHIP
Figure B-3 shows the area-capacity relationship for the Holt reservoir, which is operated by the
USACE.
FIGURE B-3 HOLT AFTER CONSTRUCTION
2.2.5 POWER PLANT HYDRAULIC CAPACITY
Holt Project has one 6-blade vertical “diagonal flow” design turbine. The flow off the turbine has
a diagonal pattern, and is also referred to as a “mixed-flow” turbine. A diagonal flow turbine is
somewhat of a mix between a Francis turbine and a propeller turbine. The diagonal flow turbine
has longer blades than a propeller, which results in the blades overlapping. The turbine has a

- 8 -
rated minimum hydraulic capacity of 1,000 cfs, and rated maximum hydraulic capacity of 11,200
cfs1
2.2.6 TAILWATER CURVE
. Between 1984 and 2010, daily inflow into Holt Lake has exceeded maximum hydraulic
capacity approximately 16 % of the time. The total spillway capacity of the dam is 393,000 cfs at
pool elevation 187 ft msl, and 639,500 cfs at pool elevation 206.4 ft msl.
Figure B-4 shows the tailwater rating curve for the Project.
FIGURE B-4 TAILWATER RATING CURVE
2.2.7 PLANT CAPABILITY
The plant capability is the plant output, in megawatts, over a range of gross heads. A curve
depicting the Project power plant capability in MW versus head is provided below (Figure B-5).
1 The actual minimum hydraulic capacity is 9,451 cfs (due to vibration) and actual maximum hydraulic capacity is
11, 044.

- 9 -
Maximum (64 ft), normal (60 ft), and minimum (58 ft) heads are specified. The new turbine was
tested at the normal head of 60 ft (Figure B-5).
FIGURE B-5 PLANT CAPACITY CURVE
2.2.8 APPLICANT’S PLANS FOR FUTURE DEVELOPMENT
Alabama Power does not have any plans to develop any additional capacity at the Project.

- 10 -
3.0 LITERATURE CITED
U.S. Geological Survey (USGS). 2012. http://nwis.waterdata.usgs.gov/usa/nwis/peak/?site_no =02462951, accessed April 20, 2012.
U.S. Geological Survey (USGS). 1976-2011, 2012. USGS Gage No. 02462951 – Holt Lock and Dam (Period of Record: 1976-2011, 2012. (www.nwis.waterdata.usgs.gov) accessed April 2012.

APPENDIX A
FIGURES

A-1
A-2
THE MONTHLY FLOW DURATION CURVES

A-3

A-4

A-5

A-6

A-7