holston valley medical center: community health needs
TRANSCRIPT

Holston Valley Medical Center:
Community Health Needs
Assessment
Ballad Health
June 30, 2021

1 | P a g e
Table of Contents
1 INTRODUCTION ....................................................................................................................................... 3
2 EXECUTIVE SUMMARY ............................................................................................................................ 6
3 HOLSTON VALLEY MEDICAL CENTER ................................................................................................. 8
3.1 FACILITY DESCRIPTION ................................................................................................................................ 8 3.2 SCOPE OF SERVICES ...................................................................................................................................... 8 3.3 PRIMARY SERVICE AREA ............................................................................................................................... 9
4 COMMUNITY ASSESSMENT PROCESS SUMMARY ............................................................................... 10
4.1 MARKET OVERVIEW .................................................................................................................................. 10 4.2 METHODOLOGY FOR COLLECTING COMMUNITY INPUT .......................................................................... 11
4.2.1 Model/Framework Selection .................................................................................................................. 11 4.2.2 Secondary Data Compilation .................................................................................................................. 13 4.2.3 Key Stakeholder Survey Design .............................................................................................................. 13 4.2.4 Key Stakeholder Focus Group Design ................................................................................................... 15
5 IDENTIFICATION OF KEY PRIORITY AREAS ..................................................................................... 17
5.1 PRIORITY AREA MEASURES WITH COUNTY VS. BALLAD HEALTH GSA AVERAGE FOR NE TN COUNTIES VS.
STATE COMPARISONS (WHEN APPLICABLE): ........................................................................................................... 21 5.1.1 Substance Abuse .................................................................................................................................... 21 5.1.2 Mental Health ........................................................................................................................................ 22 5.1.3 Transportation........................................................................................................................................ 22
6 ROOT CAUSES OF KEY PRIORITY AREAS ....................................................................................................... 23
6.1 SUBSTANCE ABUSE: .................................................................................................................................... 23 6.2 MENTAL HEALTH: ..................................................................................................................................... 24 6.3 TRANSPORTATION: .................................................................................................................................... 24
7 COMMUNITY AND HOSPITAL RESOURCES: CURRENT AND NEEDED ......................................... 25
7.1 CURRENT RESOURCES ................................................................................................................................ 25 7.1.1 Substance Abuse: ................................................................................................................................... 25 7.1.2 Mental Health: ....................................................................................................................................... 25 7.1.3 Transportation: ....................................................................................................................................... 25
7.2 NEEDED RESOURCES .................................................................................................................................. 26 7.2.1 Substance Abuse: ................................................................................................................................... 26 7.2.2 Mental Health: ....................................................................................................................................... 26 7.2.3 Transportation........................................................................................................................................ 26
8 IDEAS AND SUGGESTIONS FOR FUTURE IMPROVEMENT EFFORTS TO ADDRESS KEY
PRIORITY AREAS ............................................................................................................................................. 27
8.1 MULTI-SECTOR IDEAS AND SUGGESTIONS FOR IMPROVEMENT EFFORTS ................................................. 27 8.1.1 Substance Abuse: ................................................................................................................................... 27 8.1.2 Mental Health: ....................................................................................................................................... 27 8.1.3 Transportation: ....................................................................................................................................... 28
8.2 IDEAS AND SUGGESTIONS FOR IMPROVEMENT EFFORTS SPECIFIC TO BALLAD HEALTH AND HOLSTON
VALLEY MEDICAL CENTER...................................................................................................................................... 28 8.2.1 Substance Abuse: ................................................................................................................................... 28 8.2.2 Mental Health: ....................................................................................................................................... 28

2 | P a g e
8.2.3 Transportation: ....................................................................................................................................... 28
9 COVID-19 PANDEMIC .............................................................................................................................. 29
10 CONCLUSION ...................................................................................................................................... 30
11 APPENDIX ............................................................................................................................................ 31
11.1 SG2 2021 POPULATION PROFILE ................................................................................................................ 31 11.2 AMERICA’S HEALTH RANKINGS GRAPHIC ................................................................................................. 32 11.3 COUNTY HEALTH RANKINGS GRAPHIC ..................................................................................................... 33 11.4 SECONDARY DATA TABLES ........................................................................................................................ 34 11.5 SURVEY QUESTION DATA .......................................................................................................................... 39 11.6 FOCUS GROUP FACILITATION GUIDE ........................................................................................................ 46 11.7 DATA SOURCES AND REFERENCES ............................................................................................................. 47

3 | P a g e
1 Introduction
Holston Valley Medical Center, an acute care hospital in Kingsport, TN, is one of the
hospitals within the Ballad Health system. Ballad Health is an integrated healthcare system serving
29 counties of Northeast Tennessee, Southwest Virginia, Northwest North Carolina, and Southeast
Kentucky. Ballad was created upon the merger of two large regional health systems, Mountain
States Health Alliance and Wellmont Health System, on February 1st, 2018. Through rigorous
state oversight, these two competitors have been granted the ability to merge into an integrated
healthcare delivery system with a simple and concise mission: to improve the health of the people
we serve.
Ballad Health operates a family of 21 hospitals, including three tertiary care facilities, a
dedicated children’s hospital, community hospitals, three critical access hospitals, a behavioral
health hospital, an addiction treatment facility, long-term care facilities, home care and hospice
services, retail pharmacies, outpatient services and a comprehensive medical management
corporation.
Ballad’s hospitals include:
• Bristol Regional Medical Center
• Dickenson Community Hospital
• Franklin Woods Community Hospital
• Greeneville Community Hospital
• Hancock County Hospital
• Hawkins County Memorial Hospital
• Holston Valley Medical Center
• Indian Path Community Hospital
• Johnson City Medical Center
• Johnson County Community Hospital
• Johnston Memorial Hospital
• Lonesome Pine Hospital
• Mountain View Regional Hospital
• Niswonger Children’s Hospital
• Norton Community Hospital
• Russell County Hospital
• Smyth County Community Hospital
• Sycamore Shoals Hospital
• Unicoi County Hospital
• Woodridge Hospital
Providing care across
the continuum
Operating 21
hospitals
Servicing parts of TN, VA, KY, and
NC

4 | P a g e
Ballad Health Mission:
Ballad Health is committed to honoring those we serve by delivering the best possible care.
Ballad Health Vision:
To build a legacy of superior health by listening to and caring for those we serve.
The tagline of Ballad Health - “It’s your story. We’re listening.” - is more than a marketing tool.
Through the comprehensive state oversight and merger processes, Ballad Health system was
created to meet and address local health needs. Realizing that people want to receive care from
someone who really listens to them, the organization’s name and tagline speak to the fact that good
health is about more than healthcare – it’s the story of people’s lives. Located in the heart of
Appalachia, Ballad Health pays homage to the traditions and stories that have shaped people’s
lives; yet, the organization also looks for new ways to partner with individuals and communities to
make the region a healthier place to live and work.
Nearly 1 Million Residents across the
Ballad service area
$75 Million Commitment to
Population Health over 10
years
16,000+
Team Members

5 | P a g e
With hospitals and services strategically placed throughout the region, Ballad Health is
positioned to be the region’s largest health care provider. The system’s primary service area is
comprised of 21 counties across Northeast Tennessee and Southwest Virginia, with a secondary
service area encompassing an additional six counties in Western North Carolina and two counties
in Southeastern Kentucky.

6 | P a g e
2 Executive Summary
Ballad Health is heavily invested in the health and well-being of its communities. In addition to its
enhanced focus on population health management through the merger of the two legacy health
systems, Ballad is also the largest employer in the region and the fourth largest employer in the
State of Tennessee. Being such a prominent member of the regional economic community, Ballad
has a strong desire to improve the health of the region, as well as its employees and their families.
Realizing that health is tied to more than just genetics, Ballad is working towards a deeper
understanding of the socioeconomic issues that face the population’s ability to improve their overall
health status. Social determinants of health related to topics such as access to care and the ability
to understand complex health conditions often times go hand in hand with people’s capacity to
make optimal health decisions. Nevertheless, Ballad Health views the current health disparities of
the Appalachian region as the opportunity to go beyond the walls of the hospital and work hand-in-
hand with communities to make sustainable change happens for generations to come.
As part of the state oversight process, Ballad Health and its hospitals and entities have committed
to improving the health status of its service area counties by agreeing to focus on an index of
access, quality and population health measures. The population health metrics create a platform
for Ballad Health to further engage the efforts of its hospitals in partnership with the surrounding
communities in order to drive change in a region that has a number of health disparities and access
challenges. Leveraging the community health needs assessment (community health needs
assessment) process has helped Ballad to further understand and educate on the health disparities
that appear across the individual communities within its service area and has also helped the
organization prioritize those issues that are most important in each hospital’s community.
In order for Ballad to serve its region most effectively, it is essential to understand each
community’s individual needs. As such, Ballad Health conducted community health needs
assessments guided by frameworks and best practices in order to successfully profile the health of
the residents within its service areas. Activities associated with the development of this assessment
have taken place from summer of 2020 through the spring of 2021. Primary data was obtained
through key stakeholder surveys and focus groups with participants from the local communities,
while secondary data was collated from national, state, regional, and county-specific data sources.

7 | P a g e
Throughout this community health needs assessment process, high priority was given to
determining the health disparities and available resources within each community. Key
stakeholders from each county participated in focus groups where discussion was centered around
the prioritization of current health priorities and identification of potential solutions. The
information gathered from a local perspective, paired with county, state, and national data, help to
communicate the region’s health situation in order to begin formulating solutions for
improvement.
According to the 2020 America’s Health Rankings, Tennessee ranked 45th
and Virginia ranked 19th
out of 50 states for overall health outcomes. Both states had high rates of obesity, heart
disease, addiction, and mental health concerns. Though Virginia’s overall ranking is significantly
higher than that of Tennessee’s ranking, the health outcomes in Southwest Virginia counties,
where Ballad facilities are located, resembles those of Tennessee. After compiling the various
sources of information and using population health index as a starting point for discussion, the top
health priorities were identified for the communities that each of the hospitals serve. This effort
has led to the determination of the top three priority areas for Sullivan County to include
substance abuse, mental health, and transportation. There are certainly a number of other health
challenges in this community, but these rise to the top based on the assessment.

8 | P a g e
3 Holston Valley Medical Center
3.1 Facility Description
Holston Valley Medical Center in Kingsport, Tennessee, is a not-for-profit hospital that has been
serving the region for over 80 years. Holston Valley is one of the regions trauma centers and has
been recognized as one of the nation’s best hospitals for interventional carotid care, neurological
care, orthopedics, and women’s health.
Holston Valley Medical Center provides advanced facilities such as, updated intensive care units
and expanded operating suites, and expanded emergency and radiology departments. Holston
Valley continues to be recognized among the nation’s best hospitals, most recently being named a
Top 50 Cardiovascular Hospital by IBM Watson Health. This is the fifth time Holston Valley has
been received this honor. Additionally, Holston Valley was the first site in Tennessee to offer
transcatheter aortic valve replacement (TAVR) surgery for patients who are at higher risk for open-
heart surgery. Along with the IBM Watson recognition, Holston Valley holds many accolades and
recognitions for cardiac care and cardiovascular research, including:
▪ Gold-level recognition from the American Heart Association for heart attack treatment
(2018)
▪ Platinum-level recognition from the American College of Cardiology for heart attack
treatment quality measures (2018)
▪ Leader in cardiovascular research and training, with annual visits from Harvard fellows who
come to learn the techniques offered by Holston Valley’s prominent cardiologists
3.2 Scope of Services
A full range of specialty and subspecialty care services and some of the most advanced diagnostic
and surgical techniques are available at Holston Valley, including:
▪ 24/7 emergency department
▪ Accredited comprehensive breast center
▪ Advanced primary stroke center
▪ Cardiopulmonary rehabilitation

9 | P a g e
▪ Christine LaGuardia cancer center
▪ Comprehensive weight management center
▪ Every Step joint replacement center
▪ Heart and vascular care
▪ Imaging services
▪ Inpatient and outpatient rehabilitation
▪ Intensive care unit
▪ Orthopedics
▪ Pulmonology
▪ Surgical services (inpatient and outpatient)
o General surgery
o Robotic surgery
o Minimally invasive surgery
▪ Trauma care
▪ Urology
▪ Wound care and hyperbarics
3.3 Primary Service Area
Holston Valley Medical Center’s Primary Service Area covers Western Sullivan County and
Hawkins County in Northeast Tennessee, as well as Scott County, Lee County, and Wise County
in Southwest Virginia.

10 | P a g e
4 Community Assessment Process Summary
4.1 Market Overview
Holston Valley Medical Center, located in Kingsport, TN, primarily serves Western Sullivan and
Hawkins counties in rural Northeast Tennessee and Scott, Lee, and Wise counties in rural
Southwest Virginia. In 2021, Western Sullivan County had a population of 87,367 people. The
population projections for Sullivan County over the next five years show that the county will likely
experience little population growth overall. However, the age 65+ population for Western Sullivan
County is projected to experience the most population change over the next five years, as it moves
from 23.7% of the total population in 2021 to 26.0% of the population in 2026. The aging population
of the county presents opportunities for earlier identification and better management of health
conditions that oftentimes affect elderly populations in rural areas.
Additionally, the median household income for Sullivan County is $46,000, which ranks below the
Tennessee state average of $52,400. Other demographic factors influencing health status in the
county also includes education levels. A large portion of Western Sullivan County residents do not
have an education past high school (46.6%). The remaining portion of the population reports having
some college/associates degree (30.7%) or a bachelor’s degree of greater (22.7%).
According to the 2021 County Health Rankings, Sullivan County, where Holston Valley Medical
Center is located, is ranked 28th in Tennessee for health outcomes and 17th for health factors out
of 95 counties. Sullivan County also ranked 19th in health behaviors, 7th in clinical care, and 25th
in social and economic factors. A graphical representation of the 2021 County Health Rankings for
Sullivan County components can be found in the appendix.

11 | P a g e
4.2 Methodology for Collecting Community Input
4.2.1 Model/Framework Selection
In the earliest stages of the 2021 community health needs assessment process design for all Ballad
Health facilities, numerous guiding frameworks, models, and toolkits were reviewed and analyzed
for their potential to serve as the planning model for the assessment. Following in-depth
discussions with Ballad Health leadership, it was decided the 2021 community health needs
assessment process would be guided by the Mobilizing for Action Through Planning and
Partnerships (MAPP) model, with an understanding that aspects of the model may have to be
adapted due to the purpose of the assessment for Ballad Health and constraints related to the
COVID-19 pandemic. In coordination with the MAPP model, concepts from both Community-
Based Participatory Research (CBPR) and the Arkansas Center for Health Improvement (ACHI)
Community Health Assessment Toolkit were also utilized for the assessments.
The MAPP model, developed by the National Association of County and City Health Officials
(NACCHO) in coordination with the Centers for Disease Control and Prevention (CDC),
functions as a six-phase, strategic planning process for communities with the primary aim of
improving health. Broadly speaking, the MAPP model allows for the identification of pressing
community issues, provides understanding of the current state of resources within a community,
and provides the foundational pillars needed to develop action plans for health improvement.
The completion of the process outlined in the MAPP model results in two deliverables: (1)
Community Health Needs Assessment and (2) Community Health Improvement Plan. As
mentioned, components of the MAPP model will be slightly adapted to meet the needs of Ballad
Health’s community health needs assessments. For a summary of how Ballad Health’s 2021
community health needs assessment process will align with the MAPP model phases, please view
Table 2 below.
As shown in Table 2, the first step in the planning process was the creation of a Regional
Assessment Workgroup between Ballad Health, all local health departments in Ballad Health’s
geographic service area (GSA), Tennessee Department of Health County Health Councils, and
local health coalitions. This regional workgroup was tasked with the creation of core indicators to
be included and assessed, shared processes and practices for methodology, and the identification
of synergies and paths to collaborate between Ballad Health and all other entities represented in
the regional workgroup in terms of community health needs assessment efforts. The goal of this
collaborative effort for the community health needs assessment process is to minimize community
assessment fatigue and leverage efforts and resources utilized during the assessment process.
Ballad Health utilized a mixed-methods approach for primary and secondary data collection to
gather regional information to inform the 2021 community health needs assessments. The
secondary data collection entailed the compilation of secondary data pertaining to agreed upon
metrics and indicators from an array of verified sources. The primary data collection component
involved both a key stakeholder survey and key stakeholder focus groups. Findings from both
research methods were used to prioritize the needs of the community served by each Ballad
Health facility and determine priority focus areas for future improvement efforts.

12 | P a g e
Table 2
MAPP Model Phase Ballad Health 2021 Community Health Needs
Assessment Process
1. Organize for Success/Partnership
Development
Stakeholders within the community gather to form
partnerships and foster collaboration for assessments
guided by the MAPP model.
▪ Development of Regional Assessment
Workgroup between Ballad Health, all local
health departments in Ballad Health’s
geographic service area (GSA), Tennessee
Department of Health County Health Councils,
and local health coalitions.
2. Visioning
Individuals from Phase One determine the primary
focus and vision for the MAPP process.
▪ Development of core indicators, shared
processes, and practices.
▪ Identification of synergies and paths to
collaborate.
▪ Creation of shared vision for the overall health
and well-being of Northeast Tennessee and
Southwest Virginia Communities.
3. MAPP Assessments
Quantitative and qualitative data from both primary
and secondary data sources are compiled for the
purpose of understanding the current state of the
overall health and well-being of the community.
▪ Development of secondary data packages for
community data.
▪ Distribution of Key Stakeholder Survey.
▪ Facilitation of facility-based focus groups.
4. Identify Strategic Issues
Data are analyzed to determine issues within the
community that serve as impediments to reaching the
vision detailed in Phase Two.
▪ Statistical and thematic analysis for survey results
and focus group findings performed to identify
issues within communities.
▪ Further prioritization of community issues with
key stakeholders from each community.
5. Formulate Goals and Strategies
Goals and strategies are identified by the community
to address the strategic issues identified in Phase Five.
▪ Potential goals and strategies are identified by
key stakeholders in each focus group.
▪ Facilitation of another round of focus groups for
each facility to further parse out action plan
components.
▪ Potential goals and strategies inform the
development of Community Health Needs
Assessment Implementation Plans to be brought
to leadership at each facility.
▪ Finalization of Implementation Plans.
6. Action Cycle
Based on the goals and strategies from Phase Five,
action plans for the achievement of the vision
outlined in Phase Two are implemented and
evaluated.
▪ Community Health Needs Assessment
Implementation Plans are implemented and
evaluated for each facility.

13 | P a g e
4.2.2 Secondary Data Compilation
In accordance with the MAPP model, once desired metrics were identified and agreed upon
by all members of the regional workgroup, comprehensive data packages were created for all
counties in Ballad Health’s GSA. In knowing that research estimates that at least 80% of a person’s
health is related to non-medical factors, the data packages were designed to incorporate both
medical and non-medical factors with equal importance in terms of their role in the overall health
and well-being of the community. The data packages include approximately 60 metrics for each
county in Ballad Health’s GSA concerning each of the following overarching topics: health
outcomes (15 metrics), health behaviors (14 metrics), health determinants (12 metrics), physical
environment (3 metrics), clinical care and health resources (11 metrics), maternal and infant health
(3 metrics), and adverse childhood experiences (2 metrics).
The data packages were shared with key stakeholders in the community in an excel workbook
format. Two separate excel workbooks were created, one for the Northeast Tennessee counties
and one for the Southwest Virginia Counties. Within each workbook, an instruction tab detailing
how to interpret and utilize the data was included, as well as separate, alphabetized tabs for each
county in those associated areas. Within each tab, metrics were organized into tables based on the
seven topics listed above. For each metric, the following components were presented in the
associated table:
▪ Metric name
▪ Metric definition
▪ Metric value for the associated county
▪ Metric value for associated state
▪ Hyperlink to data source where metric was found
4.2.3 Key Stakeholder Survey Design
Following guidance from the MAPP model, the Key Stakeholder Survey was designed with the
primary aim of identifying the most-pressing community issues. In aligning with principles of
CBPR, the key stakeholder survey was designed to allow key stakeholders to frame community
issues in their own words through the use of open-ended questions. In addition to the
identification of community issues, the key stakeholder survey was also designed to discern why
survey respondents believed the community issues they selected had the greatest effect on the
overall health and wellbeing of their community. Questions related to ideas and suggestions for
improvement efforts, gauging the success of efforts after the previous community health needs
assessments, and community struggles related to the COVID-19 pandemic were also included in
the survey.
Data from the key stakeholder survey was coded and analyzed via MAXQDA Analytics Pro 2020.
Data was coded and analyzed by primary and secondary coders who are team members of the
Division of Population Health within Ballad Health.

14 | P a g e
4.2.3.1 Key Stakeholder Survey Demographics
The survey was comprised of thirteen questions, with those being a combination of both close-
ended and open-ended questions. Both statistical analysis and thematic analysis were performed
on survey results dependent on the question type (statistical analysis for close-ended questions and
thematic analysis for open-ended questions) in order to obtain frequencies and percentages. The
survey was distributed via Survey Monkey from the Division of Population Health at Ballad Health
to key stakeholders in Northeast Tennessee and Southwest Virginia that were identified by
leadership at Ballad Health. Stakeholders were selected due to their involvement in the health of
the community and their direct relationship to the communities served. The survey was distributed
to approximately 350 stakeholders, who each represent unique organizations in Northeast
Tennessee and Southwest Virginia.
One hundred and sixty-nine (n=169) organizations completed the survey, for a response rate of
48%. In terms of the geographical breakdown of survey respondents, 36% of survey respondents
listed at least one county in Southwest Virginia as part of their service area, and 64% of survey
respondents listed at least one county in Northeast Tennessee as part of their service area. There
was some overlap in terms of the geographical breakdown of survey respondents for individuals
who work in both Northeast Tennessee and Southwest Virginia; those individuals are represented
in both categories. Survey respondents represented an array of different sectors in the community,
which included the following:
▪ Law Enforcement
▪ Religious Communities/Churches
▪ School Systems
▪ Governmental Organizations
▪ Health Departments
▪ Non-Profit Organizations
▪ Academic Institutions
▪ Businesses
▪ Health Care System.
All key stakeholder survey questions and associated findings are listed in the Appendix. Findings
are filtered to reflect the responses of key stakeholders in the state in which the facility is located.
Because Sullivan County is located in Northeast Tennessee, survey findings presented in the
report and the Appendix are from the 64% of survey respondents who listed at least one county in
Northeast Tennessee as part of their service area.

15 | P a g e
4.2.4 Key Stakeholder Focus Group Design
Independent focus groups were conducted for each Ballad Health facility in order to provide
specific and unique information for each community being served. The MAPP model and
questions from the key stakeholder survey were used to guide the development and construction
of the focus groups. Because the key stakeholder survey primarily dealt with the identification of
community issues, the focus groups were primarily designed to prioritize community issues
identified through the key stakeholder survey and discuss actionable items around how to best
address these community issues. Questions related to root causes of community issues, the current
state of resources to address community issues, needed resources to initiate improvement efforts
and be successful, and community struggles related to the COVID-19 pandemic were also
included in the focus group facilitation guide.
The focus groups were organized into three main components as outlined below:
▪ Data Presentation: Focus group facilitators led the focus group participants through a
thorough review of the secondary data compiled for each service area and the findings
from the key stakeholder survey.
▪ Prioritization: Focus group facilitators led focus group participants through the
prioritization of the community issues that were identified in the key stakeholder survey for
their specific community.
▪ Discussion: Focus group facilitators helped engage focus group participants in rich
discussion concerning the priority focus areas identified via a structured facilitation guide.
Multiple team members from the Division of Population Health within Ballad Health attended
each focus group and were assigned one of the following roles:
▪ Facilitator: Present secondary data and key stakeholder survey findings, lead focus group
through prioritization process, and facilitate discussion surrounding priority focus areas
identified by the focus group.
▪ Notetaker: Take detailed notes on the discussion surrounding the priority areas.
▪ Chat Box Moderator: Monitor the chat box on the WebEx platform to ensure all
communications were acknowledged and addressed.
Following the conclusion of the focus group, the facilitator, notetaker, and chat box monitor
collectively reviewed the notes to ensure accuracy and address any areas of confusion. Once focus
group notes were finalized and approved, focus group data was coded and analyzed by primary
and secondary coders who are team members of the Division of Population Health within Ballad
Health.

16 | P a g e
4.2.4.1 Key Stakeholder Focus Group Demographics
The key stakeholder focus groups were conducted virtually via WebEx and were one hour and
thirty minutes in length. For Holston Valley Medical Center, there were eighteen (n=18) focus
group participants. Similar to the key stakeholder survey representation, focus group participants
represented an array of different sectors in Sullivan County, which included: the school system,
businesses, the health care system, and more. For stakeholders who were not able to attend the
focus group in real-time, blank facilitation guide templates with questions concerning the three
priority areas identified by the focus group participants were sent to them immediately after the
conclusion of the focus group. This allowed key stakeholders who were not able to attend the
focus group in real-time to still provide input and Ballad Health to ensure the involvement of
diverse stakeholders.

17 | P a g e
5 Identification of Key Priority Areas
Analysis of secondary data for Sullivan County, findings from the key stakeholder survey, and the
perspectives of diverse key stakeholders led to the prioritization of community issues for Holston
Valley Medical Center as depicted in the graphic below.
As discussed in the section concerning the design of the key stakeholder survey, three of the
thirteen survey questions dealt with the identification of the most pressing community issues. The
first of the three questions dealt with asking key stakeholders to frame in their own words what the
top three health-related issues their community was facing. The second of the three questions was
handled in the same manner as the first, except now the survey question asked key stakeholders to
identify the top three social or environmental issues their community was facing. The last of the
three questions sought to incorporate the voice of the community to the extent possible through
asking stakeholders to identify the issues they believe residents in their community would like to
see efforts prioritized around. Results of these three survey questions from respondents who work
in Northeast Tennessee are shown in the graphs below. The percentages on the bar graphs
represent the percentage of Northeast Tennessee respondents who mentioned a particular
community issue or concern.
3 Priority Areas for
Holston Valley Medical Center
Diverse multi-sector stakeholders
Secondary Data
Key Stakeholder
Survey Findings

18 | P a g e
15.6%
17.2%
18.9%
27.4%
0.0% 5.0% 10.0% 15.0% 20.0% 25.0% 30.0%
Access to Care
Mental Health
Chronic Disease
Substance Abuse
PLEASE LIST THE THREE MOST IMPORTANT HEALTH-RELATED ISSUES THAT AFFECT THE OVERALL HEALTH OF YOUR COMMUNITY.
6.7%
12.2%
19.3%
19.3%
19.7%
0.0% 5.0% 10.0% 15.0% 20.0% 25.0%
Education
Housing
Food Insecurity
Transportation
ACEs
PLEASE LIST THE THREE MOST IMPORTANT SOCIAL/ENVIRONMENTAL ISSUES THAT AFFECT THE OVERALL HEALTH OF YOUR COMMUNITY.
*Other health-related issues that were mentioned by respondents were physical inactivity, unintended pregnancy,
COVID-19, and dental health.
*Other social/environmental issues that were mentioned by respondents were poverty, discrimination, and safe water
sources.

19 | P a g e
From these three survey questions, the top ten community issues identified for Northeast Tennessee
communities were found to be the following:
6.9%
8.6%
11.2%
16.4%
16.8%
0.0% 2.0% 4.0% 6.0% 8.0% 10.0% 12.0% 14.0% 16.0% 18.0%
Employment
Transportation
Mental Health
Substance Abuse
Children/Youth
FROM THE PERSPECTIVE OF THOSE WHO LIVE IN YOUR COMMUNITY, WHAT ISSUES DO YOU BELIEVE THE RESIDENTS WOULD LIKE TO SEE
EFFORTS PRIORITIZED AROUND?
ACEs
Discrimination Chronic
Disease Housing Transportation
Education Mental
Health
Substance
Abuse
Access to
Care
Food
Insecurity/
Lack of
Proper
Nutrition
*Other community that were mentioned by respondents were childcare, ACEs, and COVID-19.

20 | P a g e
After being presented with the secondary data specific to Sullivan County, focus group participants
were asked to vote for three of the ten community issues listed above that they felt should be priority
focus areas for future improvement efforts in Sullivan County. The three issues that obtained the
majority of the votes were the three priority areas selected and became the focus of the facilitated
discussion. For Holston Valley Medical Center, the three priority areas for future improvement
efforts that were selected by key stakeholders in Sullivan County are substance abuse, mental health,
and transportation. Table 3 below highlights some of the secondary data measures used for both
gathering baseline data and measuring change for the three priority areas selected for Holston Valley
Medical Center.
Table 3
Priority Focus
Area
Sub-Measure
Substance Abuse ▪ Drug Overdose Deaths
▪ Nonfatal Drug Overdose
▪ Children with NAS
▪ Alcohol-Impaired Driving Deaths
▪ Excessive Drinking
Mental Health ▪ Frequent Mental Distress
▪ Suicide Rate
Transportation *None available*
As evidenced by the county-level vs. state-level data represented for each of the priority measures
selected by Sullivan County focus group participants, opportunity for improvement exists across all
priority measures within the local community. Although not all metrics compare unfavorably to the
overall state data, opportunity still exists, as the Tennessee data is not intended as a benchmark, but
merely as a comparison. In addition to state-level comparisons, priority measures for Sullivan County
are also compared to the average of the Northeast Tennessee counties in Ballad Health’s GSA.
By identifying these priority areas, Holston Valley Medical Center, in conjunction with Ballad Health
and other local community organizations, can begin to implement targeted programs and efforts to
improve the overall health and well-being of citizens of Sullivan County.

21 | P a g e
5.1 Priority Area Measures with County vs. Ballad Health GSA Average for NE TN
Counties vs. State Comparisons (when applicable):
5.1.1 Substance Abuse
36
.0
14
.9
27
.0
S U L L I V A N C O U N T Y
B A L L A D H E A L T H G S A
A V E R A G E
T E N N E S S E E
(RATE OF DRUG OVERDOSE DEATHS PER 100,000 TENNESSEANS)
DRUG OVERDOSE DEATHS
19
7.0
13
3.3
10
2.0
S U L L I V A N C O U N T Y
B A L L A D H E A L T H T N G S A A V E R A G E
T E N N E S S E E
(RATE OF INPATIENT STAYS INVOLVING NON-FATAL DRUG OVERDOSE PER 100,000
TENNESSEANS )
NONFATAL DRUG OVERDOSE
47
.1
43
.8
11
.5
S U L L I V A N C O U N T Y
B A L L A D H E A L T H T N G S A A V E R A G E
T E N N E S S E E
(RATE OF NAS CASES PER 1,000 LIVE BIRTHS)
CHILDREN WITH NAS
22
.0%
37
.0%
25
.0%
S U L L I V A N C O U N T Y
B A L L A D H E A L T H T N G S A A V E R A G E
T E N N E S S E E
(PERCENTAGE OF DRIVING DEATHS WITH ALCOHOL INVOLVEMENT )
ALCOHOL-IMPAIRED DRIVING DEATHS

22 | P a g e
5.1.2 Mental Health
5.1.3 Transportation
13
.0% 1
3.2
%
14
.0%
S U L L I V A N C O U N T Y
B A L L A D H E A L T H T N G S A A V E R A G E
T E N N E S S E E
(PERCENTAGE OF ADULTS REPORTING BINGE OR HEAVY DRINKING )
EXCESSIVE DRINKING1
5.0
% 15
.3%
14
.0%
S U L L I V A N C O U N T Y
B A L L A D H E A L T H T N G S A A V E R A G E
T E N N E S S E E
(PERCENTAGE OF ADULTS REPORTING 14 OR MORE DAYS OF POOR MENTAL HEALTH PER
MONTH )
FREQUENT MENTAL DISTRESS
18
.4
18
.0
17
.1
S U L L I V A N C O U N T Y
B A L L A D H E A L T H T N G S A
A V E R A G E
T E N N E S S E E
(RATE OF DEATHS FROM SUICIDES PER 100,000 POPULATION )
SUICIDE

23 | P a g e
6 Root Causes of Key Priority Areas Because health is more than just a result of behaviors or individual pre-disposition to disease, Ballad
Health realizes that it must also evaluate social determinants such as the environment and
community in which people live, the access to care they have, and the policy issues that exist/are
absent in order to be able to make effective strides in improvement. For this reason, root causes for
each of three priority focus areas were discussed in the focus group to better understand the
relationships between various community issues. Utilizing more upstream ways of thinking and
better understanding the true root causes of community issues will allow Ballad Health to better
understand how to design future efforts and determine which community partners are needed for a
collective effort to truly bring about a measurable change.
To help understand the true root causes of three priority focus areas selected for Holston Valley
Medical Center, participants in the focus group identified the causes they believe must be
addressed and accounted for in future improvement efforts in order to truly make impactful
progress and change. The identified root causes for the priority focus areas for Holston Valley
Medical Center include:
6.1 Substance Abuse:
▪ ACEs
▪ Poverty (generational)
▪ Lack of transportation
▪ Lack of in-patient programs and education
▪ Cross addiction from peers
▪ Lack of positive parent/caregiver/mentor

24 | P a g e
6.2 Mental Health:
▪ ACEs
▪ Genetics
▪ Isolation
▪ Genetics
▪ Undiagnosed learning disabilities
▪ Lack of transportation
▪ Stigma surrounding mental health
▪ Limited access to mental health treatment
▪ Lack of cooperation between law enforcement and health care providers
▪ Lack of long-term treatment facilities
6.3 Transportation:
▪ Poverty
▪ Lack of public/rural transportation services
▪ Low income
▪ Lack of community awareness concerning available transportation options
▪ Lack of education
▪ Fear of contracting COVID-19 and desires to isolate

25 | P a g e
7 Community and Hospital Resources: Current and Needed
7.1 Current Resources
To help improve the identified health priorities for Sullivan County, focus group participants were
also asked to help identify current programs/organizations/individuals/services from the local
community that may be of assistance with the population health efforts in their county. Because
multiple resources working together for the same cause can help to drive change faster, having the
inventory of local resources with whom Ballad Health can partner with is key. There are many
resources currently in existence in Sullivan County through both the hospital and local organizations.
The current and available resources identified for each of the three priority focus areas in the focus
groups are as follows:
7.1.1 Substance Abuse:
▪ Creekside Behavioral Health Hospital for detox (only available for insured persons)
▪ Celebrate Recovery
▪ Frontier Health
▪ Sullivan County Anti-Drug (SCAD) Coalition
▪ United Way of Greater Kingsport
▪ AveNew
▪ Local churches have groups
▪ Sullivan County Overdose Response Team (SCORT)
▪ Oxford House
▪ Families Free
▪ Holston Counseling
7.1.2 Mental Health:
▪ Frontier Health
▪ Comprehensive Community Services (CCS)
▪ Creekside Behavioral Health Hospital
▪ Camelot of Northeast Tennessee
▪ Families Free
▪ Covenant Counseling
▪ Youth Villages
7.1.3 Transportation:
▪ Kingsport Area Transit Service (KATS)
▪ MyRide
▪ NetTrans
▪ UBER/Lyft/Taxi Cab
▪ Medicaid Transport
▪ 211
▪ Friends, Neighbors, Family

26 | P a g e
▪ Faith based organizations
▪ Pilot program in the planning stages that would coordinate network of providers pulling together
services to fill gaps in smaller healthcare facilities
7.2 Needed Resources
In addition to identifying current resources, focus group participants were also asked to identify
needed resources that do not currently exist in their local community that could be of assistance with
the population health efforts in their county. The identification of needed resources will help to
bridge gaps and overcome barriers to care when addressing these priority focus areas. The needed
resources identified for each of the three priority focus areas in the focus groups are as follows:
7.2.1 Substance Abuse:
▪ Resources for community education (especially youth)
▪ Community partnerships
▪ Funding
▪ Financial assistance resources (payment assistance) for those seeking treatment
7.2.2 Mental Health:
▪ Financial assistance resources (payment assistance) for those seeking treatment
▪ Funding
▪ Increased housing options (intensive, long-term housing options and permanent supportive
housing options)
▪ Resources in jails
▪ Positive mentors
▪ Process for juveniles to be assessed with the least amount of trauma involved
▪ Streamlined process for Respond/Mobile Crisis
7.2.3 Transportation
▪ Funding
▪ Resources to increase community awareness of transportation options

27 | P a g e
8 Ideas and Suggestions for Future Improvement Efforts to Address Key
Priority Areas
8.1 Multi-Sector Ideas and Suggestions for Improvement Efforts
Foundational to any population health improvement effort is the identification of actionable
priorities. Now that this has been accomplished, the hospital can begin to formulate targeted
implementation plans to help address the disparities plaguing parts of its population. By identifying
these priority areas, Holston Valley Medical Center in conjunction with Ballad Health and other
local community organizations can begin to implement targeted programs and efforts to improve the
overall health and well-being of citizens of Sullivan County. To best plan for and design improvement
efforts that address the three priority focus areas, focus group participants offered ideas and
suggestions for potential improvement efforts and solutions that can be incorporated into the
Community Health Needs Assessment Implementation Plan for Holston Valley Medical Center.
Focus group participants were not asked to formulate entire initiatives or improvement efforts, but
were instead asked to offer ideas and suggestions for crucial elements to be included in a larger,
overarching improvement effort. The ideas and suggestions for potential improvement efforts for
each of the three priority areas are as follows:
8.1.1 Substance Abuse:
▪ Transitional placement between detox and transitional housing
▪ More treatment/recovery services offered in jails
▪ Referring overdose patients in emergency department to Sullivan County Overdose Response
Team (SCORT) and Certified Peer Recovery Specialist
▪ Strong programs in schools geared towards substance abuse prevention
▪ Needle Exchange Programs
▪ More engagement at touch points with the community and pointing patients in the right direction
for outpatient treatment
▪ Warm hand-offs with community stakeholder programs
▪ Outreach into housing developments
▪ Mobilize treatment options and services (take treatment services to the patient)
8.1.2 Mental Health:
▪ Creation of dedicated community partnerships
▪ Appropriate discharge from acute stabilization so that follow-up appointments can be
maintained
▪ Easier access to medications/treatment for vulnerable populations (homeless and incarcerated)
▪ Supportive housing for individuals with mental health issues
▪ Wrap-around services
▪ Expansion of SAP in schools
▪ Transportation assistance to mental health services

28 | P a g e
8.1.3 Transportation:
▪ After hours and weekend transportation options
▪ Utilizing faith-based organizations more
▪ Education on what transportation is available and when
▪ Utilizing current service providers and evaluating how they can work together
▪ Car repair services
▪ Expand age range for MyRide eligibility
▪ Aligning employment with available transportation
▪ Central phone number to obtain transportation
▪ Mobile health for homebound
8.2 Ideas and Suggestions for Improvement Efforts Specific to Ballad Health and
Holston Valley Medical Center
In addition to discussing ideas and suggestions for protentional improvement efforts, the focus group
participants also discussed possibilities for how Holston Valley Medical Center and Ballad Health
can continue or enhance programs/services to provide local resources to support the identified
priorities and best be a community partner in future improvement efforts. Several of the ideas and
suggestions for potential improvement efforts for each of the priority areas were repeated by focus
group participants again here, signifying that the participants believe Ballad Health and Holston
Valley Medical Center should either lead or be largely involved in the improvement effort.
Suggestions as to how Ballad Health and Holston Valley Medical Center can improve the previously
identified priority focus areas are listed below:
8.2.1 Substance Abuse:
▪ Holistic transitional housing
▪ Treatment-based long-term recovery (longer than one year)
▪ Treatment/recovery support in jails
▪ Avenue to enter treatment (not through emergency department)
▪ Referring overdose patients in emergency department to Sullivan County Overdose Response
Team (SCORT) and Certified Peer Recovery Specialist
▪ Partner with reentry and workforce development programs
8.2.2 Mental Health:
▪ Bring together community stakeholders to have a conversation to better understand how each
entity can best collaborate and work together in future improvement efforts
▪ Get someone trained in SSI/SSDI Outreach, Access, and Recovery (SOAR) to assess disability
needs/determination
8.2.3 Transportation:
▪ Implement pilot transportation program and learn from it before branching out
▪ Mobile health services for homebound patients
▪ Creation and utilization of a transportation phone app
29 | P a g e
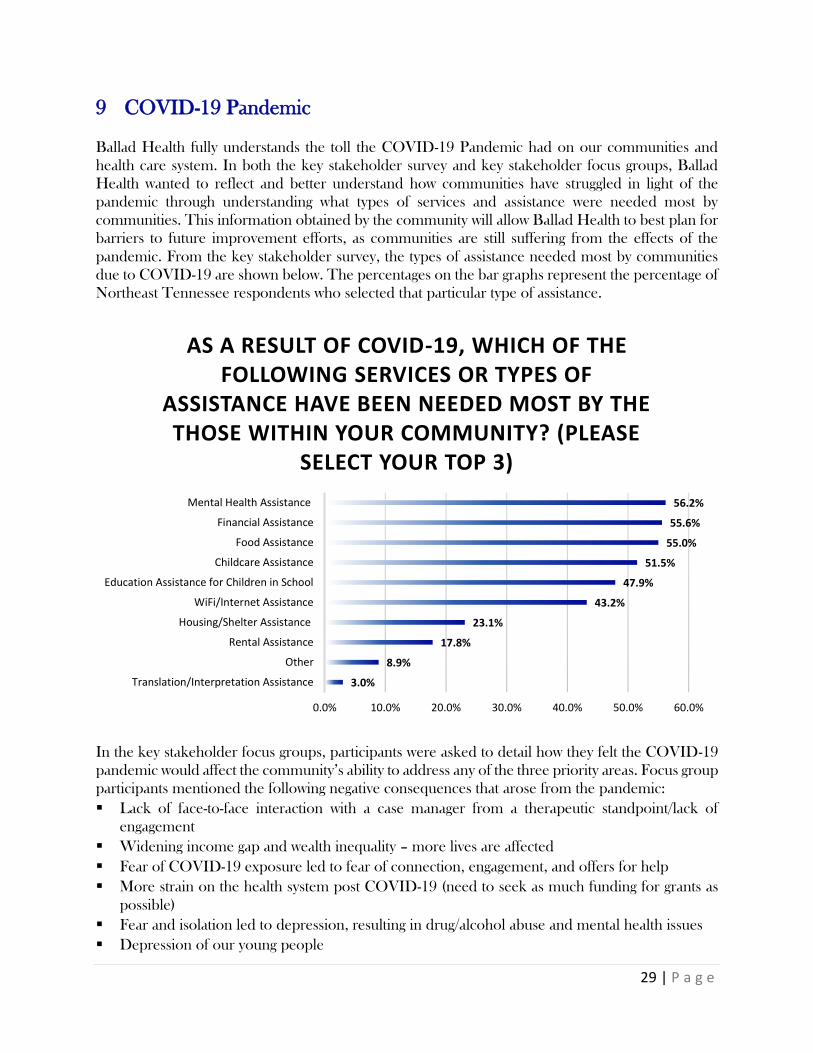
9 COVID-19 Pandemic
Ballad Health fully understands the toll the COVID-19 Pandemic had on our communities and
health care system. In both the key stakeholder survey and key stakeholder focus groups, Ballad
Health wanted to reflect and better understand how communities have struggled in light of the
pandemic through understanding what types of services and assistance were needed most by
communities. This information obtained by the community will allow Ballad Health to best plan for
barriers to future improvement efforts, as communities are still suffering from the effects of the
pandemic. From the key stakeholder survey, the types of assistance needed most by communities
due to COVID-19 are shown below. The percentages on the bar graphs represent the percentage of
Northeast Tennessee respondents who selected that particular type of assistance.
In the key stakeholder focus groups, participants were asked to detail how they felt the COVID-19
pandemic would affect the community’s ability to address any of the three priority areas. Focus group
participants mentioned the following negative consequences that arose from the pandemic:
▪ Lack of face-to-face interaction with a case manager from a therapeutic standpoint/lack of
engagement
▪ Widening income gap and wealth inequality – more lives are affected
▪ Fear of COVID-19 exposure led to fear of connection, engagement, and offers for help
▪ More strain on the health system post COVID-19 (need to seek as much funding for grants as
possible)
▪ Fear and isolation led to depression, resulting in drug/alcohol abuse and mental health issues
▪ Depression of our young people
3.0%
8.9%
17.8%
23.1%
43.2%
47.9%
51.5%
55.0%
55.6%
56.2%
0.0% 10.0% 20.0% 30.0% 40.0% 50.0% 60.0%
Translation/Interpretation Assistance
Other
Rental Assistance
Housing/Shelter Assistance
WiFi/Internet Assistance
Education Assistance for Children in School
Childcare Assistance
Food Assistance
Financial Assistance
Mental Health Assistance
AS A RESULT OF COVID-19, WHICH OF THE FOLLOWING SERVICES OR TYPES OF
ASSISTANCE HAVE BEEN NEEDED MOST BY THE THOSE WITHIN YOUR COMMUNITY? (PLEASE
SELECT YOUR TOP 3)

30 | P a g e
In future efforts to address each of the priority areas, focus group participants believe special
attention to the above list of negative consequences should be given as a result of the pandemic.
Focus group participants also mentioned the fact that telehealth services were utilized more because
of the pandemic, which is a service they hope to continue to utilize in order to enhance the
accessibility of services offered.
10 Conclusion
As hospitals and health systems continue to work to make the communities they serve healthier,
the identification of prioritized population health issues has become an area of strategic
importance. Because Holston Valley Medical Center is located in a region with many health and
social challenges, that prioritization becomes even more important so that focused actions can be
developed and implemented with strategic purpose. The allocation of hospital resources to the
prioritized issues, coupled with partnerships with other community organizations, will continue to
build momentum toward the building of a healthier Sullivan County.

31 | P a g e
11 Appendix
11.1 Sg2 2021 Population Profile
The table below highlights key demographic statistics for Western Sullivan County, TN:

32 | P a g e
11.2 America’s Health Rankings Graphic
The infographic below summarizes strength and challenges for the state of Tennessee in 2020:

33 | P a g e
11.3 County Health Rankings Graphic
The infographic below shows the 2021 rankings for Sullivan County for each of the County Health
Ranking model components out of the 95 Tennessee counties.

34 | P a g e
11.4 Secondary Data Tables The seven data tables below showcase the secondary data metrics compiled for Sullivan County,
TN. Metric definitions, the associated metric value for Tennessee, and data source reference are
also included in the tables.
Health Outcomes
Metric Metric Definition Sullivan
County
Ballad
Health
GSA
Average
Ballad
Health
TN GSA
Average
Tennessee Reference
Infant Mortality
Number of infant deaths (under
one year of age) per 1,000 live
births
4.6 6.9 7.2 6.9
Tennessee
Commission on
Children &
Youth
Low Birthweight
Percentage of live born infants
with birth weight less than 5
pounds, 8 ounces
8.2% 9.3% 8.3% 9.3% Kids Count
Children with NAS Rate of NAS cases per 1,000 live
births 47.1 64.4 43.8 11.5
Tennessee
Commission on
Children &
Youth
Poor or Fair Health Percentage of adults reporting
fair or poor health (age-adjusted) 21.0% 18.7% 22.4% 20.0%
County Health
Rankings
Cardiovascular Deaths Rate of deaths from diseases of
the heart per 100,000 population 348.2 527.8 347.7 242.5
Tennessee
Department of
Health
Cancer Deaths Number of cancer deaths (all
sites) per 100,000 population 177.8 192.7 189.6 177.4 CDC
Diabetes Mellitus
Deaths
Rate of deaths from diabetes per
100,000 population 24.7 32.4 33.6 29.9
Tennessee
Department of
Health
Cerebrovascular
Deaths
Rate of deaths from
cerebrovascular disease per
100,000 population
67.2 73.2 55.5 51.7
Tennessee
Department of
Health
Suicide Rate Rate of deaths from suicides per
100,000 population 18.4 22.5 18.0 17.1
Tennessee
Department of
Health
Lung Cancer Deaths
Number of lung and bronchus
cancer deaths per 100,000
population
51.9 57.8 58.7 51.3 CDC
Female Breast Cancer
Deaths
Number of female breast cancer
deaths per 100,000 women 21.5 21.7 20.7 22.0 CDC
Prevalence of
Diabetes
Percentage of adults aged 20
and above with diagnosed
diabetes
15.0% 15.2% 17.1% 13.0% County Health
Rankings
Mammography
Screening
Percentage of female Medicare
enrollees ages 65-74 that
received an annual
mammography screening
45.0% 40.1% 41.5% 41.0% County Health
Rankings
Frequent Mental
Distress
Percentage of adults reporting 14
or more days of poor mental
health per month
15.0% 13.8% 15.3% 14.0% County Health
Rankings
Premature Deaths
Number of deaths among
residents under age 75 per
100,000 population (age-
adjusted)
470.0 526.4 535.0 450.0 County Health
Rankings

35 | P a g e
Health Behaviors
Metric Metric Definition Sullivan
County
Ballad
Health
GSA
Average
Ballad
Health
TN GSA
Average
Tennessee Reference
Alcohol-Impaired
Driving Deaths
Percentage of driving deaths with
alcohol involvement 22.0% 22.0% 37.0% 25.0%
County Health
Rankings
Excessive Drinking Percentage of adults reporting
binge or heavy drinking 13.0% 16.4% 13.2% 14.0%
County Health
Rankings
Adult Smoking Percentage of adults who are
current smokers 22.0% 19.0% 22.8% 23.0%
County Health
Rankings
Adult Obesity
Percentage of the adult
population (age 20 and older)
that reports a body mass index
(BMI) greater than or equal to 30
kg/m2
34.0% 33.6% 33.8% 33.0% County Health
Rankings
TN Public School
Students Measured as
Overweight or Obese
Percentage of public school
students who were measured as
overweight or obese
36.6% 45.3% 39.3%
Tennessee
Commission on
Children &
Youth
Physical Inactivity
Percentage of adults age 20 and
over reporting no leisure-time
physical activity
30.0% 60.3% 30.1% 27.0% County Health
Rankings
Access to Exercise
Opportunities
Percentage of population with
adequate access to locations for
physical activity
78.0% 33.3% 63.8% 70.0% County Health
Rankings
Teen Births Number of live births per 1,000
females aged 15-17 years old 7.3 8.9 11.2 9.6 Kids Count
Drug Overdose Deaths Rate of drug overdose deaths per
100,000 Tennesseans 36.0 14.9 27.0
Tennessee
Department of
Health
Nonfatal Drug
Overdose
Rate of inpatient stays involving
non-fatal drug overdose per
100,000 Tennesseans
197.0 162.9 133.3 102.0
Tennessee
Department of
Health
Opioid Prescription
Rate of opioid prescriptions per
1,000 Tennesseans (at least one
opioid for pain prescription)
972.0 17.6 1091.8 793.0
Tennessee
Department of
Health
Violent Crime Number of reported violent crime
offenses per 100,000 population 484.0 14.5 376.3 621.0
County Health
Rankings
Firearm Fatalities Number of deaths due to firearms
per 100,000 population 14.0 15.8 17.0
County Health
Rankings
Motor Vehicle Crash
Deaths
Number of motor vehicle crash
deaths per 100,000 population 15.0 18.2 15.0
County Health
Rankings

36 | P a g e
Health Determinants
Metric Metric Definition Sullivan
County
Ballad
Health
GSA
Average
Ballad
Health
TN GSA
Average
Tennessee Reference
Uninsured Adults Percentage of adults under age
65 without health insurance 13.0% 13.6% 14.6% 14.0%
County Health
Rankings
Uninsured Children Percent of uninsured children
under the age of 19 4.1% 5.3% 4.7% 5.1% Kids Count
Median Household
Income
The income where half of
households in a county earn more
and half of households earn less
$46,000 $40,863 $41,140 $52,400 County Health
Rankings
Children Eligible for
Free or Reduced
Lunch
Percentage of students who are
eligible for the free or reduced-
price meals program during a
school year
57.7% 56.8% 71.6% 62.1% Kids Count
Children in Single-
Parent Household
Percentage of children that live in
a household headed by single
parent
34.0% 34.8% 34.5% 35.0% County Health
Rankings
Children In Poverty
Percent of children under age 18
living with an income below the
official poverty threshold
23.0% 25.3% 28.0% 19.4% Kids Count
High School
Graduation
Percentage of students
graduating within four years of
entering high school, and
graduation in more than four
years for students with an
Individual Education Plan
94.6% 55.1% 89.7% 89.6% Kids Count
College Going Rate
Percentage of high school
students who were part of the
high school freshman cohort and
graduated during the winter,
spring, or summer preceding the
summer or fall they enrolled in
higher education
71.8% 94.4% 59.4% 61.8% Kids Count
College
Enrollment/Completio
n
Exact data definition not
provided by source 68.1% 4.0% 64.0% 62.5%
Tennessee
Commission on
Children &
Youth
Unemployment
Percentage of population ages
16 and older unemployed but
seeking work
3.7% 11.9% 4.2% 3.5% County Health
Rankings
Food Insecurity Percentage of population who
lack adequate access to food 12.0% 80.4% 13.9% 14.0%
County Health
Rankings
TNReady English
Language Arts for 3rd
to 8th graders
Percentage of students from 3rd
to 8th grade who achieved on-
track or mastered score in English
Language Arts (ELA) during a
school year
37.0% 5.0% 31.9% 33.7% Kids Count

37 | P a g e
Clinical Care and Health Resources
Metric Metric Definition Sullivan
County
Ballad
Health
GSA
Average
Ballad
Health
TN GSA
Average
Tennessee Reference
Hospital Staffed Beds
Total number of hospital staffed
beds available (in the Ballad Health
system for county data)
626 19,756
Tennessee
Department of
Health
Licensed Beds
Total number of licensed beds
available (in the Ballad Health
system for county data)
1,056 24,649
Tennessee
Department of
Health
Medical Doctors Rate of medical doctors per 100,000
residents 237.2 103 229.1
Tennessee
Commission on
Children &
Youth
Mental Health
Providers
Ratio of population to mental health
providers 830:1 660:1
County Health
Rankings
Dentists Rate of dentists per 100,000 residents 60.3 26 50.1
Tennessee
Commission on
Children &
Youth
Preventable Hospital
Stays
Rate of hospital stays for
ambulatory-care sensitive conditions
per 100,000 Medicare enrollees
5,497 5,829 5,064 5,320 County Health
Rankings
Flu Vaccinations
Percentage of fee-for-service (FFS)
Medicare enrollees that had an
annual flu vaccination
50.0% 43.8% 41% 49.0% County Health
Rankings
Medicaid Enrollees Percent of population enrolled in
TennCare 20.5% 34.8% 24% 20.7% Kids Count
Food Stamp Eligible
Participants
Percent of population who receive
food stamps under SNAP 13.9% 18% 13.4% Kids Count
Children on SNAP Percent of children on SNAP out of
total child population 29.9% 35% 28.2%
Tennessee
Commission on
Children &
Youth
Infants and Children
on WIC
Percent of infants on WIC out of
total infant population 34.8% 48% 30.6%
Tennessee
Commission on
Children &
Youth

38 | P a g e
Physical Environment
Metric Metric Definition Sullivan
County
Ballad
Health
GSA
Average
Ballad
Health
TN GSA
Average
Tennessee Reference
Severe Housing Problems
Percentage of households
with at least 1 of 4 housing
problems: overcrowding,
high housing costs, lack of
kitchen facilities, or lack of
plumbing facilities
11.0% 11.6% 13.1% 15.0%
County
Health
Rankings
Median Home Sale Price
The home sale price where
half of homes in a county sell
for more and half of homes
sell for less
$144,250 $132,548 $128,501 $146,000
Tennessee
Commission
on Children
& Youth
Air Pollution - particulate matter
Average daily density of fine
particulate matter in
micrograms per cubic meter
(PM2.5)
10.2 9.4 9.7 10.0
County
Health
Rankings
Maternal Infant Health
Metric Metric Definition Sullivan
County
Ballad
Health
GSA
Average
Ballad
Health
TN
GSA
Average
Tennessee Reference
Birth Rate Number of births per 1,000
women ages 15-44 9.6 58.8 10.2 11.9
Tennessee
Commission
on Children
& Youth
Adequate Prenatal Care
Percent of live births in a
given calendar year
where mother received
adequate prenatal care
55.8% 41.0% 56.1% 58.8%
Tennessee
Commission
on Children
& Youth
Mothers Who Smoke During Pregnancy
Percent of total births for
which the mother
indicated she smoked
while pregnant
20.3% 25.2% 12.1%
Tennessee
Commission
on Children
& Youth
Adverse Childhood Experiences
Metric Metric Definition Sullivan
County
Ballad
Health
GSA
Average
Ballad
Health
TN
GSA
Average
Tennessee Reference
Reported Child Abuse Cases
Percentage of reported
child abuses cases out of
total child population
8.0% 6.7% 4.7%
Tennessee
Commission
on Children
& Youth
Commitment to State Custody
Rate of commitment to
state custody per 1,000
children
4.8 4.4 6.0 4.1
Tennessee
Commission
on Children
& Youth

39 | P a g e
11.5 Survey Question Data
The first two questions (Q1 and Q2) on the key stakeholder survey were used to identify the
service area of the respondent and determine what organization they were representing. Findings
from Northeast Tennessee respondents for questions three through thirteen (Q1 – Q13) are given
below:
Below are some of the specifics given by survey respondents for each of the vulnerable populations
listed above:
8.0%
8.5%
11.2%
15.6%
19.6%
0.0% 5.0% 10.0% 15.0% 20.0% 25.0%
Uninsured/Underinsured
Individuals with Substance Abuse Issue
Individuals who are Economically Disadvantaged
Children/Youth
Elderly
Q3) WHEN THINKING OF THE HEALTH OF
YOUR COMMUNITY, WHAT VULNERABLE
POPULATIONS DO YOU THINK DESERVE
OUR PARTICULAR ATTENTION?
*Other vulnerable populations that were mentioned by respondents were homeless individuals, veterans, maternal
women, and marginalized populations.

40 | P a g e
15.6%
17.2%
18.9%
27.4%
0.0% 5.0% 10.0% 15.0% 20.0% 25.0% 30.0%
Access to Care
Mental Health
Chronic Disease
Substance Abuse
Q4) PLEASE LIST THE THREE MOST
IMPORTANT HEALTH-RELATED ISSUES
THAT AFFECT THE OVERALL HEALTH
OF YOUR COMMUNITY.
6.7%
12.2%
19.3%
19.3%
19.7%
0.0% 5.0% 10.0% 15.0% 20.0% 25.0%
Education
Housing
Food Insecurity
Transportation
ACEs
Q6) PLEASE LIST THE THREE MOST
IMPORTANT SOCIAL/ENVIRONMENTAL
ISSUES THAT AFFECT THE OVERALL
HEALTH OF YOUR COMMUNITY.
*Other health-related issues that were mentioned by respondents were physical inactivity, unintended pregnancy,
COVID-19, and dental health.
*Other social/environmental issues that were mentioned by respondents were poverty, discrimination, and safe water
sources.

41 | P a g e
Q5 and Q7) PLEASE ELABORATE ON WHY YOU
SELECTED THOSE THREE HEALTH-RELATED AND
SOCIAL/ENVIRONMENTAL ISSUES TO BE THE MOST
IMPORTANT.
Three overarching themes were identified:
42 | P a g e
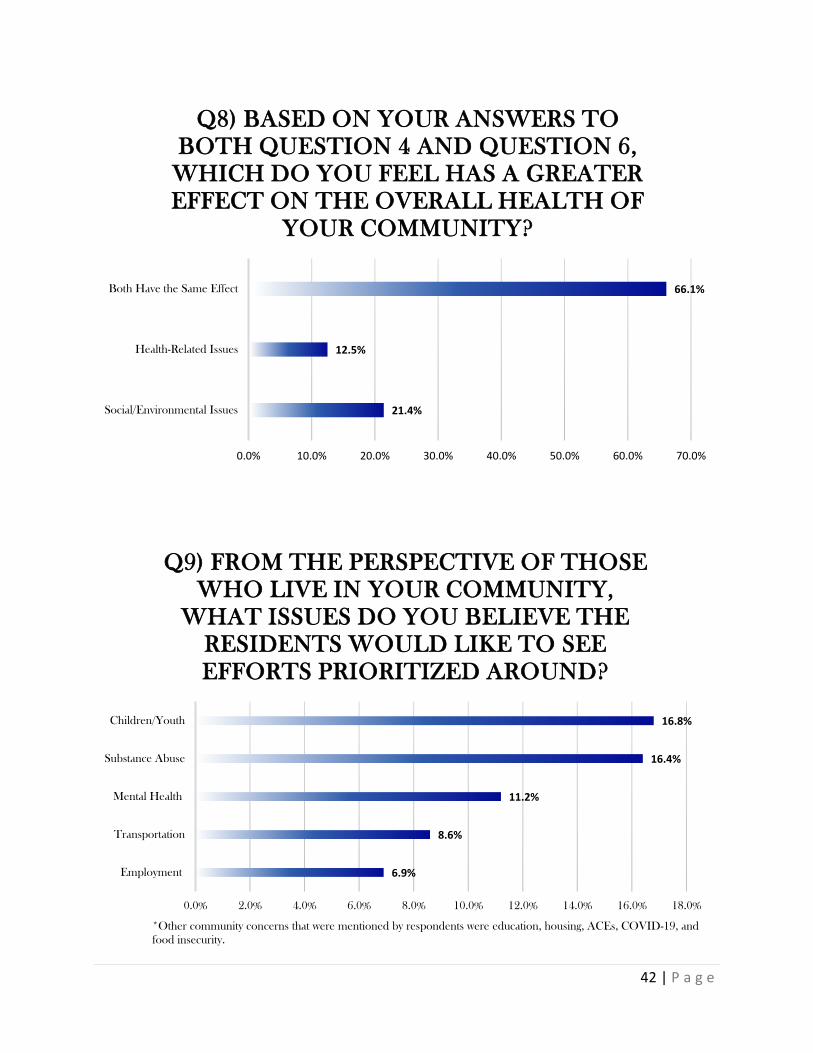
21.4%
12.5%
66.1%
0.0% 10.0% 20.0% 30.0% 40.0% 50.0% 60.0% 70.0%
Social/Environmental Issues
Health-Related Issues
Both Have the Same Effect
Q8) BASED ON YOUR ANSWERS TO
BOTH QUESTION 4 AND QUESTION 6,
WHICH DO YOU FEEL HAS A GREATER
EFFECT ON THE OVERALL HEALTH OF
YOUR COMMUNITY?
6.9%
8.6%
11.2%
16.4%
16.8%
0.0% 2.0% 4.0% 6.0% 8.0% 10.0% 12.0% 14.0% 16.0% 18.0%
Employment
Transportation
Mental Health
Substance Abuse
Children/Youth
Q9) FROM THE PERSPECTIVE OF THOSE
WHO LIVE IN YOUR COMMUNITY,
WHAT ISSUES DO YOU BELIEVE THE
RESIDENTS WOULD LIKE TO SEE
EFFORTS PRIORITIZED AROUND?
*Other community concerns that were mentioned by respondents were education, housing, ACEs, COVID-19, and
food insecurity.

43 | P a g e
Q10) WHAT IDEAS OR SUGGESTIONS DO YOU HAVE
TO IMPROVE THE OVERALL HEALTH OF YOUR
COMMUNITY?
Four overarching themes were identified:

44 | P a g e
Q12) BASED ON YOUR ANSWER TO THE PREVIOUS
QUESTION, PLEASE ELABORATE ON WHY YOU
SELECTED THE ANSWER YOU CHOSE.
8.9%
24.3%
49.1%
17.8%
0.0% 10.0% 20.0% 30.0% 40.0% 50.0% 60.0%
Improved
Stayed the Same
Worsened
Do Not Know
Q11) BASED ON THE PRIORITIES
IDENTIFIED IN PREVIOUS
COMMUNITY ASSESSMENTS, DO YOU
FEEL AS THOUGH THINGS HAVE
IMPROVED, STAYED THE SAME, OR
WORSENED?

45 | P a g e
3.0%
8.9%
17.8%
23.1%
43.2%
47.9%
51.5%
55.0%
55.6%
56.2%
0.0% 10.0% 20.0% 30.0% 40.0% 50.0% 60.0%
Translation/Interpretation Assistance
Other
Rental Assistance
Housing/Shelter Assistance
WiFi/Internet Assistance
Education Assistance for Children in School
Childcare Assistance
Food Assistance
Financial Assistance
Mental Health Assistance
Q13) AS A RESULT OF COVID-19, WHICH
OF THE FOLLOWING SERVICES OR
TYPES OF ASSISTANCE HAVE BEEN
NEEDED MOST BY THE THOSE WITHIN
YOUR COMMUNITY? (PLEASE SELECT
YOUR TOP 3)

46 | P a g e
11.6 Focus Group Facilitation Guide
Top 10 Community Issues Identified via Community Stakeholder Survey (in no
particular order): *Both health-related and social/environmental issues are listed.
Transportation
Adverse Childhood Experiences (ACEs)
Food Insecurity/Lack of Proper Nutrition
Housing
Education
Discrimination
Access to Care
Substance Abuse
Mental Health
Chronic Disease
Prioritization of Community Issues: *Attendees will be asked to vote on which 3 community issues they believe should have priority. Selection of the top 3
community issues will be based on majority of votes.
Question: Out of 10 community issues listed above, which 3 do you believe should be
priority focus areas for improvement efforts moving forward?
Focus Group Discussion Questions: *These discussions will be tailored to the 3 focus areas selected by the group.
Questions for Focus Area #1, #2, and #3: *Each of the 7 questions below will be asked independently for each of the 3 focus areas identified. One focus area will
be discussed at a time, meaning Questions 1-7 will be asked for Focus Area #1 before moving on to Focus Area #2, and
so on.
1) What do you believe the potential root causes are for this focus area?
2) What resources currently exist in your community to address this focus area?
(programs, services, etc.)
3) What are some possible solutions to address this focus area?
4) What resources are needed that don’t currently exist in your community to address
this focus area?
5) Who should lead the effort to address this focus area?
6) Who else should be involved in the effort to address this focus area?
If not already mentioned,
7) What ideas do you have for the health system to address this focus area?
Question for ALL 3 Focus Areas: *Question is for any or all of the 3 focus areas identified.
8) How will COVID-19 affect the community's ability to address any of the focus areas
identified?

47 | P a g e
11.7 Data Sources and References
▪ Centers for Disease Control and Prevention
▪ America’s Health Rankings
▪ County Health Rankings
▪ Sg2 Analytics
▪ Kids Count
▪ Tennessee Department of Health
▪ Tennessee Commission on Children & Youth
▪ National Association of County and City Health Officials