holiday recap and 2015 outlook webinar
TRANSCRIPT

Holiday Recap and 2015 Outlook
.
February 4, 2015
©2014 IBM Corporation

2
Today’s presenters
Sucharita MulpuruPrincipal Analyst
Forrester@smulpuru
Leah PaschallIBM Digital Analytics Benchmark
IBM ExperienceOne@leahpaschall
©2014 IBM Corporation
Agenda
› 2014 Recap
› Key US dates and trends› Mega sale days around the world
› Insights for 2015
3 ©2014 IBM Corporation

Thousands of participants
Aggregate index– Compare against industry– Compare against peers
Geographic coverage– US, UK, France, Germany, Europe,
Australia, World Wide
Industry specific– Retail– Content– Financial Services– Travel
Segment specific– Apparel– Department Stores– Health and Beauty– And 12 others. . .
Compare performance against industry peers withIBM Digital Analytics Benchmark
©2014 IBM Corporation4

www.ibm.com/benchmark New! Real-time interactive
application:– IBM ExperienceOne Benchmark Live
Benchmark Reporting– Reports pulled on key dates and within key date
ranges for intra-day, DtD, WtW and YtY comparisons
– Key Messages, Graphs and Tables included in outputs including Press Alerts, Releases and Reports
US Retail & Retail sub-verticals– Black Friday, Cyber Monday and Recap reports
UK Retail– Recap report with UK Black Friday and UK Cyber
Monday highlights
Other Geography Reporting– AU Nov 19-20 Click Frenzy– 2014 Holiday Mobile report featuring US, UK,
Germany, France and AU – coming soon!
Wide range of free holiday benchmark resources available
©2014 IBM Corporation5
© 2015 Forrester Research, Inc. Reproduction Prohibited 6
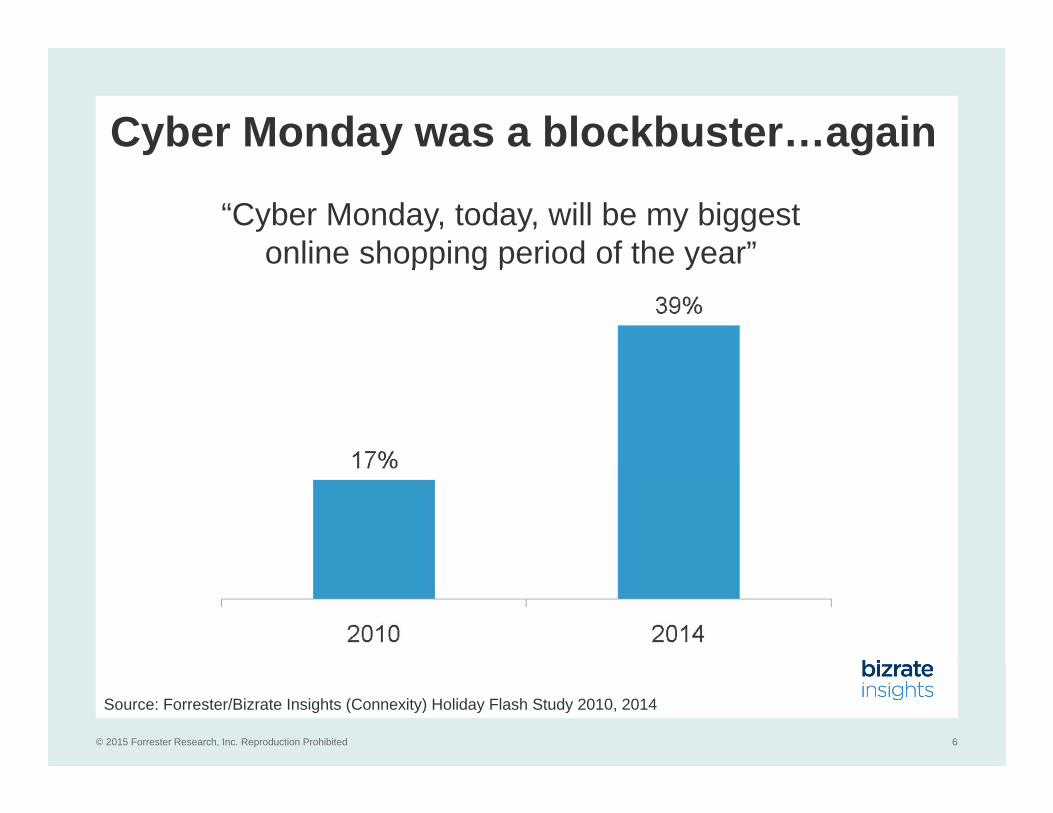
Cyber Monday was a blockbuster…again
“Cyber Monday, today, will be my biggest online shopping period of the year”
Source: Forrester/Bizrate Insights (Connexity) Holiday Flash Study 2010, 2014

Online Sales over the Holiday Weekend
7
14.3% YoY increase in online retail sales on Thanksgiving with 32.3% mobile sales
9.5% YoY increase in online retail sales on Black Friday with 27.9% mobile sales
8.5% YoY increase in online retail sales On Cyber Monday with 22% mobile sales
Cyber Monday continues
to outpace Thanksgiving and
Black Friday in online retail
sales, however, Thanksgiving
had the highest mobile
percentage of sales and traffic.©2014 IBM Corporation

© 2015 Forrester Research, Inc. Reproduction Prohibited 8
Though it’s still no Singles DayEstimated total gross merchandise value
generated online 2014 ($B)
Source: Forrester estimates
© 2015 Forrester Research, Inc. Reproduction Prohibited 9
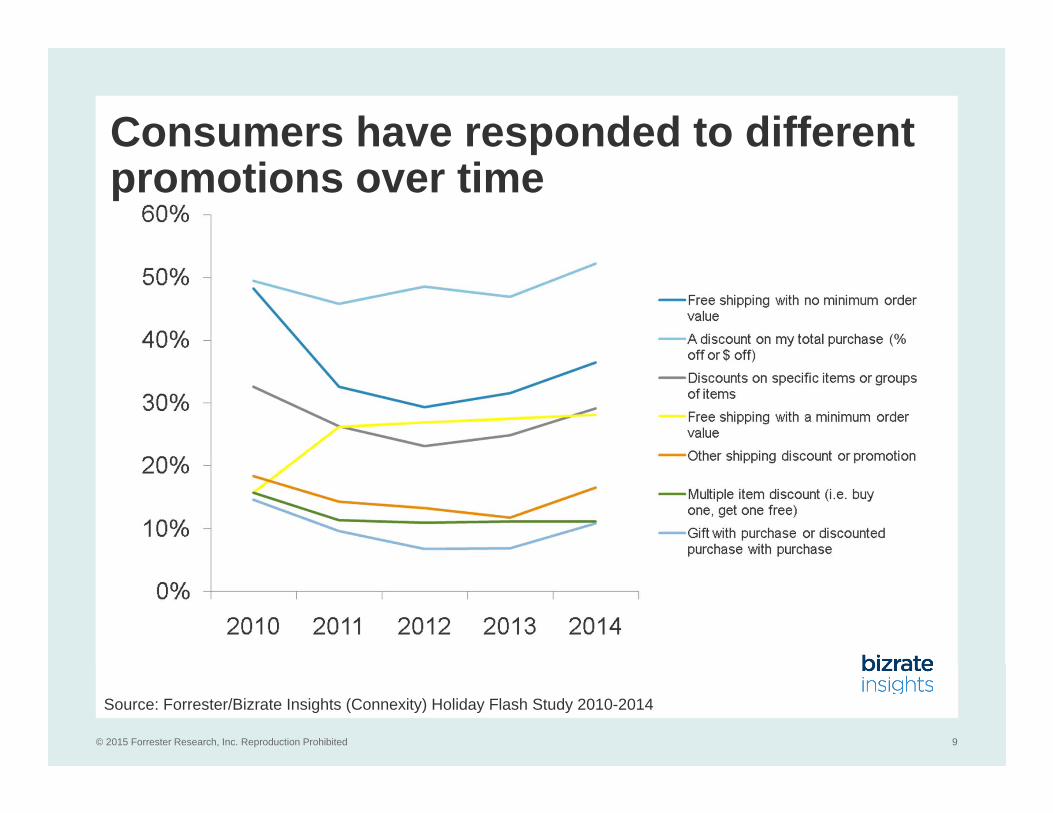
Consumers have responded to different promotions over time
Source: Forrester/Bizrate Insights (Connexity) Holiday Flash Study 2010-2014

Cyber Monday 2010

Cyber Monday 2014

Cyber Monday 2010

Cyber Monday 2014

Cyber Monday 2010

Cyber Monday 2014

© 2015 Forrester Research, Inc. Reproduction Prohibited 16
Mobile is enormous on key dates
Online buyers who used mobile devices to shop
Source: Forrester/Bizrate Insights (Connexity) Holiday Flash Study 2014
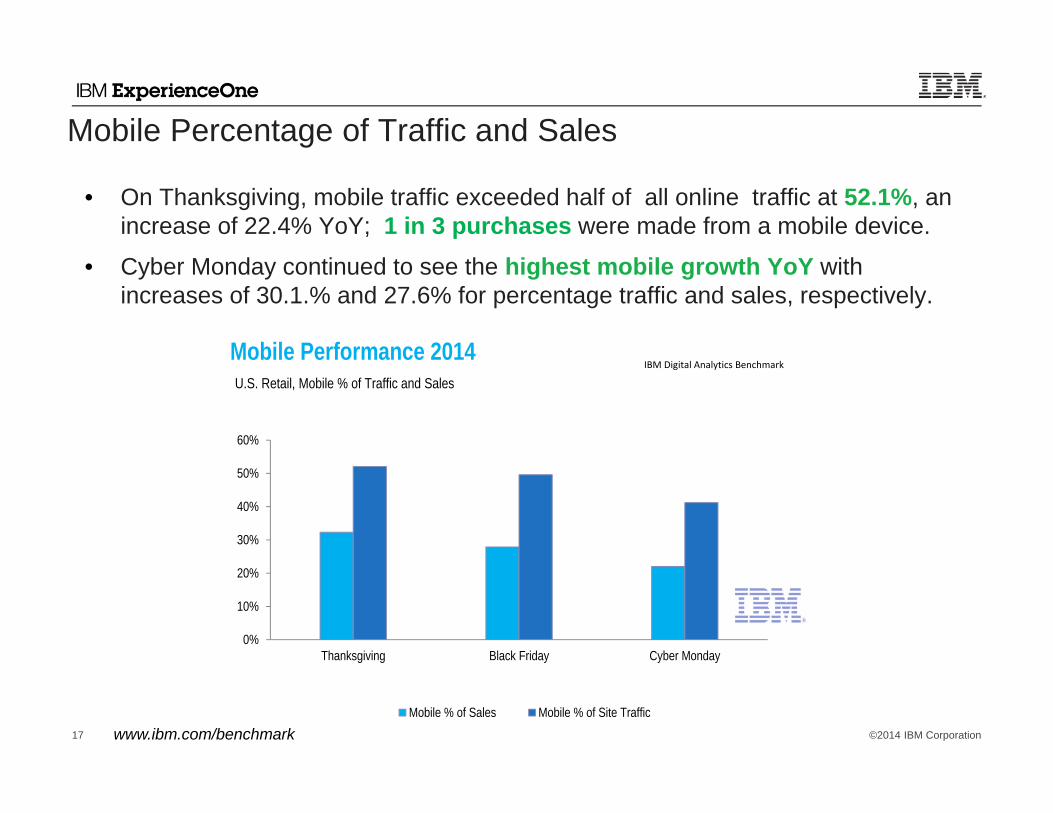
Mobile Percentage of Traffic and Sales
• On Thanksgiving, mobile traffic exceeded half of all online traffic at 52.1%, an increase of 22.4% YoY; 1 in 3 purchases were made from a mobile device.
• Cyber Monday continued to see the highest mobile growth YoY with increases of 30.1.% and 27.6% for percentage traffic and sales, respectively.
17
0%
10%
20%
30%
40%
50%
60%
Thanksgiving Black Friday Cyber Monday
Mobile Performance 2014
Mobile % of Sales Mobile % of Site Traffic
U.S. Retail, Mobile % of Traffic and SalesIBM Digital Analytics Benchmark
©2014 IBM Corporationwww.ibm.com/benchmark

Device Performance
18
Mobile continues to grow in double digits, however, desktop is still predominant in key eCommerce metrics.
$99.31
5.86
40.63%
1.17%
9.13%
31.15%
$112.73
7.54
33.64%
3.53%
13.43%
13.40%
$125.12
7.74
32.00%
4.48%
77.33%
54.80%
Average Order Value
Average Page Views
Bounce Rate
Conversion Rate
% of Sales
% of Traffic
November and December 2014U.S. Retail, Performance by Device/Platform
Smartphone Tablet Desktop
IBM Digital Analytics Benchmark
©2014 IBM Corporationwww.ibm.com/benchmark

Mobile traffic eclipsed desktop on Thanksgiving
• Mobile traffic exceeded that of desktop for the first time on Thanksgiving and continued to do so on subsequent weekends and during Christmas week.
19
0%
10%
20%
30%
40%
50%
60%
70%
80%
90%
100%
11/1/2014 11/8/2014 11/15/2014 11/22/2014 11/29/2014 12/6/2014 12/13/2014 12/20/2014 12/27/2014Day
U.S. Retail Daily Traffic and Sales: Desktop and Mobile
Desktop % of Sales Desktop % of Traffic Mobile % of Sales Mobile % of Traffic
November 1st to December 31st 2014 IBM Digital Analytics Benchmark
Mobile traffic % exceeded desktop traffic % for the
first time on Thanksgiving
©2014 IBM Corporationwww.ibm.com/benchmark

Sales from smartphones encroaching on tablets
• The margin narrowed significantly throughout the holiday season as percentage sales from smartphones was only slightly lower than that of tablets by Christmas week.
20
0%
5%
10%
15%
20%
25%
30%
11/1/2014 11/8/2014 11/15/2014 11/22/2014 11/29/2014 12/6/2014 12/13/2014 12/20/2014 12/27/2014Day
U.S. Retail Daily Sales: Smartphones and Tablets
Smartphones Tablets
November 1st to December 31st 2014 IBM Digital Analytics Benchmark
©2014 IBM Corporationwww.ibm.com/benchmark

Mobile os: Android vs iOS
21
iOS outpaced Android in most key metrics except average page views per session .
Average Order Value
Average Page Views
Bounce Rate
Conversion Rate
% of Online Sales
% of Online Site Traffic
November and December 2014U.S. Retail, Performance by Mobile OS
Android iOSIBM Digital Analytics Benchmark
14.32% 24.51%
4.87% 14.33%
1.55% 2.05%
40.33% 36.49%
6.60 6.42
$87.26 $116.13
©2014 IBM Corporationwww.ibm.com/benchmark

Agenda
› 2014 Recap
› Key US dates and trends
› Mega sale days from around the world› Insights for 2015
©2014 IBM Corporation22
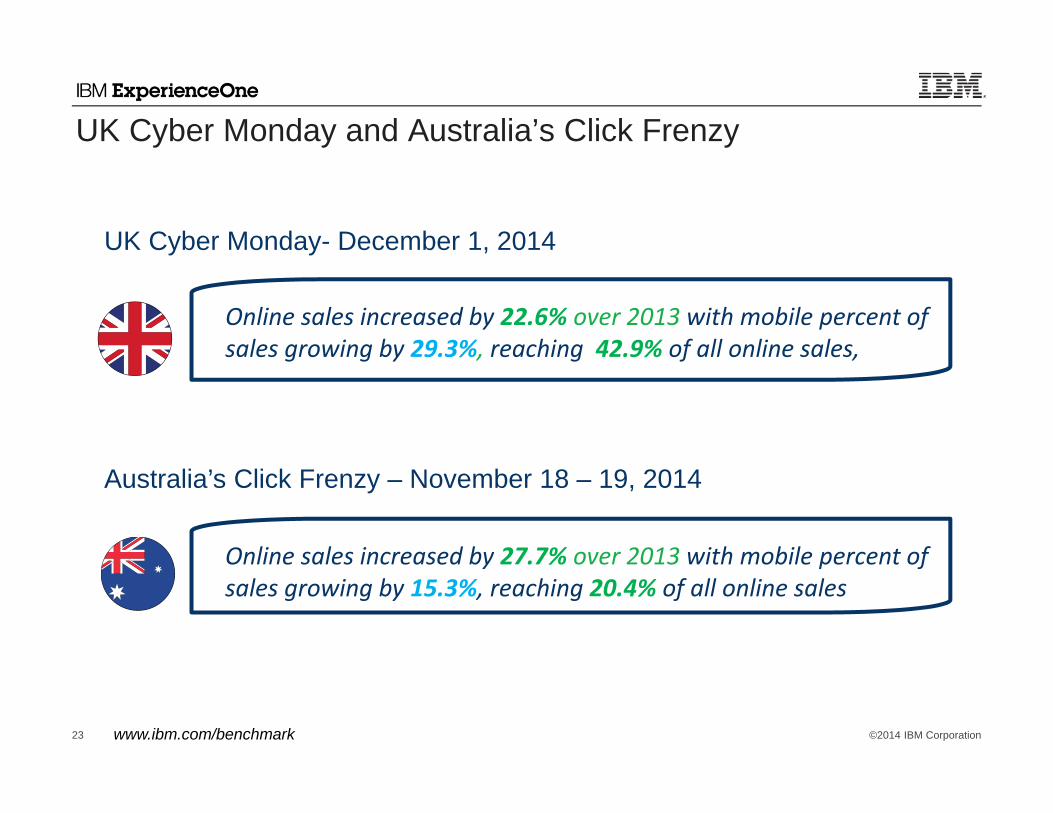
UK Cyber Monday and Australia’s Click Frenzy
Online sales increased by 22.6% over 2013 with mobile percent of sales growing by 29.3%, reaching 42.9% of all online sales,
Australia’s Click Frenzy – November 18 – 19, 2014
Online sales increased by 27.7% over 2013 with mobile percent of sales growing by 15.3%, reaching 20.4% of all online sales
UK Cyber Monday- December 1, 2014
©2014 IBM Corporation23 www.ibm.com/benchmark

Mobile Use By Country: Australia, UK and US
24
Mobile traffic and sales grew in double digits on mega shopping days in US, UK and Australia.
As a percentage of all online traffic and sales, the UK was highest at 56.2% and 42.9%, respectively.
0%
10%
20%
30%
40%
50%
60%
AU Click Frenzy UK Cyber Monday US Cyber Monday
Mobile Performance 2014
Mobile % of Sales Mobile % of Site Traffic
Mobile % of Traffic and SalesIBM Digital Analytics Benchmark
©2014 IBM Corporationwww.ibm.com/benchmark

Mobile Use By Country: Australia, US and UK
25
0%
10%
20%
30%
AU Click Frenzy UK Cyber Monday US Cyber Monday
Mobile Percentage of Sales 2014
Tablets Smartphones
AU, UK, USIBM Digital Analytics Benchmark
0%
10%
20%
30%
40%
AU Click Frenzy UK Cyber Monday US Cyber Monday
Mobile Percentage of Traffic 2014
Tablets Smartphones
AU, UK, USIBM Digital Analytics Benchmark
©2014 IBM Corporation
Tablets to buy
Smartphones to browse
www.ibm.com/benchmark

Mobile Use By Country: Australia, US and UK
26
iOS led in all three countries for both mobile % of traffic and sales but by a wider margin in Australia than in US or UK
Android, 2.73% Android, 4.37%Android, 10.91%
iOS, 17.47%iOS, 17.39%
iOS, 31.34%
0%
10%
20%
30%
40%
50%
AU Click Frenzy US Cyber Monday UK Cyber Monday
Mobile Percent of Sales by OS 2014 IBM Digital Analytics Benchmark
©2014 IBM Corporationwww.ibm.com/benchmark

Agenda
› 2014 Recap
› Key US dates and trends
› Mega sale days from around the world
› Insights for 2015
27 ©2014 IBM Corporation

© 2015 Forrester Research, Inc. Reproduction Prohibited 28
The onus is on stores to retain traffic and sales
Thanksgiving Weekend Cyber Monday Cyber Week
I prefer to shop online rather than go to crowded stores during the Thanksgiving weekend
85% 80% 78%
I shopped online instead of in stores for this purchase because there were better deals online
70% 77% 66%
Percent of online shoppers agreeing
Source: Forrester/Bizrate Insights (Connexity) Holiday Flash Study 2014

© 2015 Forrester Research, Inc. Reproduction Prohibited 29
Package panic does change behavior
Source: Forrester/Bizrate Insights (Connexity) Holiday Flash Study 2014
© 2015 Forrester Research, Inc. Reproduction Prohibited 30
What to expect in 2015
› More mobile momentum…but what it means for investment remains TBD
› Lackluster digital wallet numbers
› Continued anemic social marketing performance but with some pockets of intrigue
› Omnichannel standards; Omnichannel 2.0 for leaders

© 2015 Forrester Research, Inc. Reproduction Prohibited 31
These numbers haven’t changed drastically

© 2015 Forrester Research, Inc. Reproduction Prohibited 32
What to expect in 2015
› More mobile momentum…but what it means for investment remains TBD
› Lackluster digital wallet numbers
› Continued anemic social marketing performance but with some pockets of intrigue
› Omnichannel standards; Omnichannel 2.0 for leaders

© 2015 Forrester Research, Inc. Reproduction Prohibited 33
NFC is still a work in progress

© 2015 Forrester Research, Inc. Reproduction Prohibited 34
What to expect in 2015
› More mobile momentum…but what it means for investment remains TBD
› Lackluster digital wallet numbers
› Continued anemic social marketing performance but with some pockets of intrigue
› Omnichannel standards; Omnichannel 2.0 for leaders

© 2015 Forrester Research, Inc. Reproduction Prohibited 35
Social tactics still aren’t that effective for web sales
Top 3 Customer Acquisition Tactics for eCommerce
Source: State of Retailing Online 2014: Marketing

© 2015 Forrester Research, Inc. Reproduction Prohibited 36
What to expect in 2015
› More mobile momentum…but what it means for investment remains TBD
› Lackluster digital wallet numbers
› Continued anemic social marketing performance but with some pockets of intrigue
› Omnichannel standards; Omnichannel 2.0 for leaders

© 2015 Forrester Research, Inc. Reproduction Prohibited 37
Omnichannel extends beyond inventory
› E-receipts in stores/email collection in stores
› Scheduling store visits
› Monitoring parking lots
› Remote customer service including stores-within-stores
› Store traffic flow and monitoring
› Texting from stores

IBM Digital Analytics Benchmark Hub – www.ibm.com/benchmark
Holiday Reports
Press alerts, press releases and bylines
Blogs
LIVE social feed
Link to product information
Best practice guides
Access to IBM ExperienceOne Benchmark Live
38
One stop shop for analysis, product information and best practice guides
©2014 IBM Corporation

39
IBM ExperienceOne Benchmark Live gives you instant access to real-time online shopping trends with customizable visuals that you can download and share. In addition, you'll find infographics and year-over-year comparison charts on key shopping days.
IBM ExperienceOne Benchmark Live
©2014 IBM Corporation


Our solutions are flexible, so users can begin anywhere and grow in any direction
©2014 IBM Corporation41

Who Should Attend ExperienceOne | Amplify: Executives and practitioners in marketing,
commerce and customer analytics
Why Attend ExperienceOne | Amplify: Network with over 2,800 industry leaders,
executives and practitioners in marketing, commerce and customer analytics.
Discover the latest trends and innovative solutions that demonstrate measurable business results.
Get hands-on with the latest technologies and solutions.
Experience the newest innovations from IBM through 200+ sessions and workshops plus the latest product demos.
Anticipate behavior and deliver flawless customer service.
Capitalize on opportunities with mobile, social, cloud and analytics.
ExperienceOne | Amplify Tracks: Commerce - create a unique brand experience
across all channels for both B2B and B2C omni-channel commerce
Customer analytics - acquire the right customers, optimize the customer experience, understand the customer journey, and minimize fraud
Marketing - target, engage and win customers across multiple channels by combining proven best practices with innovative technologies
Register by February 28th to save $200 off the standard rate.For more details, visit ibm.com/ibmexperienceone
©2014 IBM Corporation

43
Questions?
Sucharita MulpuruPrincipal AnalystForrester
@smulpuru
Leah PaschallIBM Digital Analytics Benchmark LeadIBM ExperienceOne
@leahpaschall
www.ibm.com/benchmark
©2014 IBM Corporation