holding company with sustainable - grupo argos corporate vf.… · •partnership with conconcreto...
TRANSCRIPT
Holding Company with
INVESTMENTS IN INFRASTRUCTURE
SUSTAINABLE
January 2017

2
Principles of our Strategy
Investment focus Searching Allowing
With long
business cycles
Capital
intensive
With natural
entry barriers
Basic sectors
of the economy Returns above
the cost of capital
Efficient
capital allocation Limit negative effects
of economical, political
and regulatory events
Geography
and industry diversification
Exploit possibilities within the
investment focus
Acting according
to sustainability principlesGood corporate governance
and social responsibility practices Respect for the environment
Contributing to its
subsidiariesAccess to capital markets
in better conditions
Mobility of
human capital
Dialogue and relationship
with public entities
Knowledge of target markets
through other subsidiaries
Generating value Through Capital Arbitrage Active participation in strategy DNA of business group

3
Grupo Argos as a Strategic Architect
SUSTAINABLE GROWTH AND VALUE GENERATION
Strategic / Transformer
Financial Strategy
Management
Institutional
Focused on defining the Group's FUTURE
Controls and makes financial decisions to ensure
correct capital allocationFocused on managing TODAY. How does the group
work toward its interior and inter-branch transactional
services
Focused on the Group's relationship with the exterior
• Defines Corporate Strategy.
• Ensures alignment with the Competitive Strategies of
the subsidiaries.
• Promotes innovation and monitors opportunities for
synergies according to the business models.
• Efficient capital allocation.
• Proposes and evaluates jointly with subsidiary
opportunities for merger, acquisition, divestment, and
partnership.
• Insurance management strategy
• Fiscal and tax guidelines
• Define, coordinate and control of the Government Model.
• Control and Risk Management Systems.
• Ethics standards and Corporate Governance.
• Find synergies between operations.
• Corporate comptroller role.
• Talent management and corporate culture.
• Sustainability agenda at the corporate level
• Relationships with stakeholders at the corporate level
• Government / Regulators relations
• Corporate Social Responsibility management
• External communication strategy
30% acquisition of OPAIN guaranteeing the consolidation strategy
of ODINSA
Financial closing Pacifico II with a more efficient capital structure*SUMMA – creation of intercompany services subsidiary to capture synergies
*Acquisition of Odinsa and reshaping of portfolio

4
Grupo Argos’ Portfolio
****The participation corresponds to
that one that includes Grupo Argos and
its related.
55,3%**52,5% 98,55% 50%
40%*** 100% 35,9%**** 9,8%
Cement Energy Concessions
Roads and
airports
Ports Real Estate
Fund
Real Estate
Urban
Development
Financial
Services
PORTFOLIOSTRATEGIC
In Infrastructure
Protein
Chain
• Pure cement player in key
markets in the America.
• Logistical synergies.
• Efficiency seeking
• Potential for per-capita
consumption growth.
• Risk balance – exposure
to economies with
different economic cycles.
• Presence in 3
countries.
• Integrated (Gx,
transmission
distribution and
commercialization).
• Road and Airport
concession focus.
• Portfolio Optimization
• Multi-purpose
terminals
• Strategic alliances
• Ports in the Atlantic
and the Pacific
• ~ 2.000 Ha in
Barranquilla
and Barú.
• Synergy
opportunities for
groups land
development
• Real estate
developers.
• > 450.000 m2 of GLA
in operation.
• Private Capital fund
• Partnership with
Conconcreto and
Proteccion Pension
Fund
** Cementos Argos 55.3% ordinary shares
and 46,83% of outstanding shares
EBITDA*
USD 1,1 bn
Revenue*
USD 4,9 bn
Mkt Cap1
USD 5,3 bn
(1 USD = 2,974 COP)
1 Mkt Cap in USD at 11/01/2017
Revenues & EBITDA are 3Q16 LTM in USD
*** 50% participation in the
investment vehicle, 40% Economic
Right
30%
• Additional to 35%
participation of ODINSA
• 3dr Airport in PAX and
1st in Cargo in LATAM.

5
History
Eight cement-producing companies are merged
under the name Cementos Argos
Cementos Argos changes its corporate name to
Inversiones Argos
Cementos Argos expands -acquires
mixing plants in the United States
and Colombia
Acquisition of Holcim’s plants in Panama, the
Dominican Republic, and Haiti
Acquisition of EPSA in Colombia
Acquisition of a 16% stake in Colinversiones
(currently Celsia)
Acquisition of Termoflores, a thermal plant in
Barranquilla
Expansion in the United States
through the acquisition of
Lafarge’s assets
Spin-off of Cementos Argos’ non-cement assets and creation of three
new businesses: Ports, urban development and coal
Acquisition of Lafarge’s assets in Honduras
Acquisition of assets in Florida,
United States; and in French Guiana
Expansion of Colombia and United
States plants
Acquisition of energy assets in
Panama and Costa Rica
Strategic alliance with Conconcreto
Entry into concession
business through the
acquisition of a 54.7%
stake in Odinsa
Divestment of coal mines1934
Steady organic
growth
complemented by a
track record of value-
creating acquisitions
Founding of Compañía
de Cementos Argos
(currently Grupo Argos)
Acquisition Martinsburg Plant
in West Virginia (US)
Odinsa increase stake in ADN
and BTA in Dominican
Republic
Increase stake in Quiport
2005 2006 2007 2009 2011 2012 2013 2014 2015 2016
Grupo Argos acquires 30% of
OPAIN
Grupo Argos increases its
participation in Odinsa to
98,55% though a successful
tender offer.
6
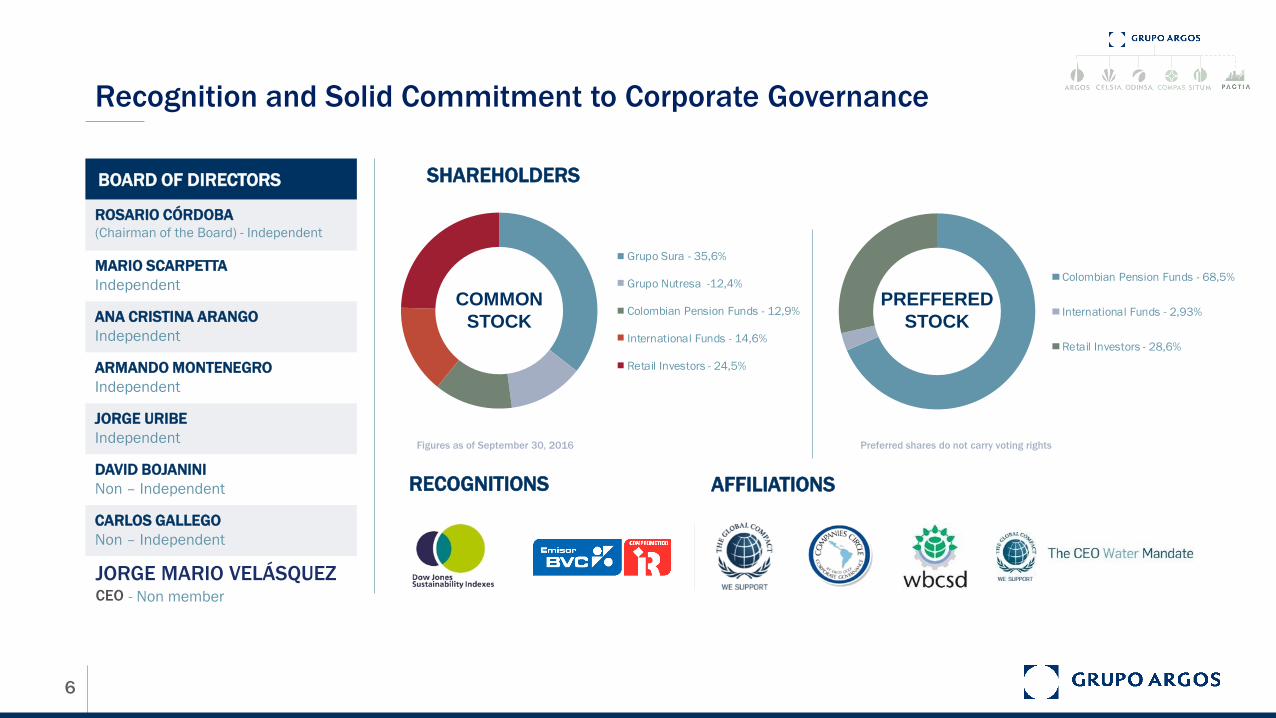
Colombian Pension Funds - 68,5%
International Funds - 2,93%
Retail Investors - 28,6%
Grupo Sura - 35,6%
Grupo Nutresa -12,4%
Colombian Pension Funds - 12,9%
International Funds - 14,6%
Retail Investors - 24,5%
Recognition and Solid Commitment to Corporate Governance
SHAREHOLDERS
COMMON
STOCK
Figures as of September 30, 2016
BOARD OF DIRECTORS
JORGE MARIO VELÁSQUEZCEO
Preferred shares do not carry voting rights
RECOGNITIONS AFFILIATIONS
ROSARIO CÓRDOBA(Chairman of the Board) - Independent
MARIO SCARPETTA
Independent
ANA CRISTINA ARANGO
Independent
ARMANDO MONTENEGRO
Independent
JORGE URIBE
Independent
DAVID BOJANINI
Non – Independent
CARLOS GALLEGO
Non – Independent
- Non member
PREFFERED
STOCK

Performance
GRUPO ARGOS CEMARGOS CELSIA IGBC ODINSA
Grupo Argos’ Advantages
as a Holding Company
Correlation among its
businesses, enabling synergies
Access to better
financing terms
Strategic alignment among
subsidiaries
Optimal resource allocation
0
50
100
150
200
250
ma
y.-1
2
jul.-1
2
se
p.-
12
nov.
-12
en
e.-1
3
ma
r.-1
3
ma
y.-1
3
jul.-1
3
se
p.-
13
nov.
-13
en
e.-1
4
ma
r.-1
4
ma
y.-1
4
jul.-1
4
se
p.-
14
nov.
-14
en
e.-1
5
ma
r.-1
5
ma
y.-1
5
jul.-1
5
se
p.-
15
nov.
-15
en
e.-1
6
ma
r.-1
6
ma
y.-1
6
jul.-1
6
se
p.-
16
nov.
-16

8
1.616
1.907
2.225
2.640
963
892
883
-
500
1.000
1.500
2.000
2.500
3.000
2012 2013 2014 2015 3Q16
6.681 7.629
9.296
12.580
4.056
3.396
3.362
-
2.000
4.000
6.000
8.000
10.000
12.000
14.000
2012 2013 2014 2015 3Q16
Cement - 46%
Energy - 22%
Land Bank - 19%
Concessions - 7%
Property - 3%
Other - 3%
Cement - 76%
Energy - 24%Cement - 100%
Portfolio Growth*
Revenues (COP bn) EBITDA (COP bn)
2010 3Q2016
16,4COP
10,6COP
4,6billion
billionbillion
COP
* Doesn´t include stakes in Grupo Sura, Nutresa and Bancolombia
Strategic Portfolio Diversification
2005
1Q 2Q 3Q
US$4,193 bn US$880 bn
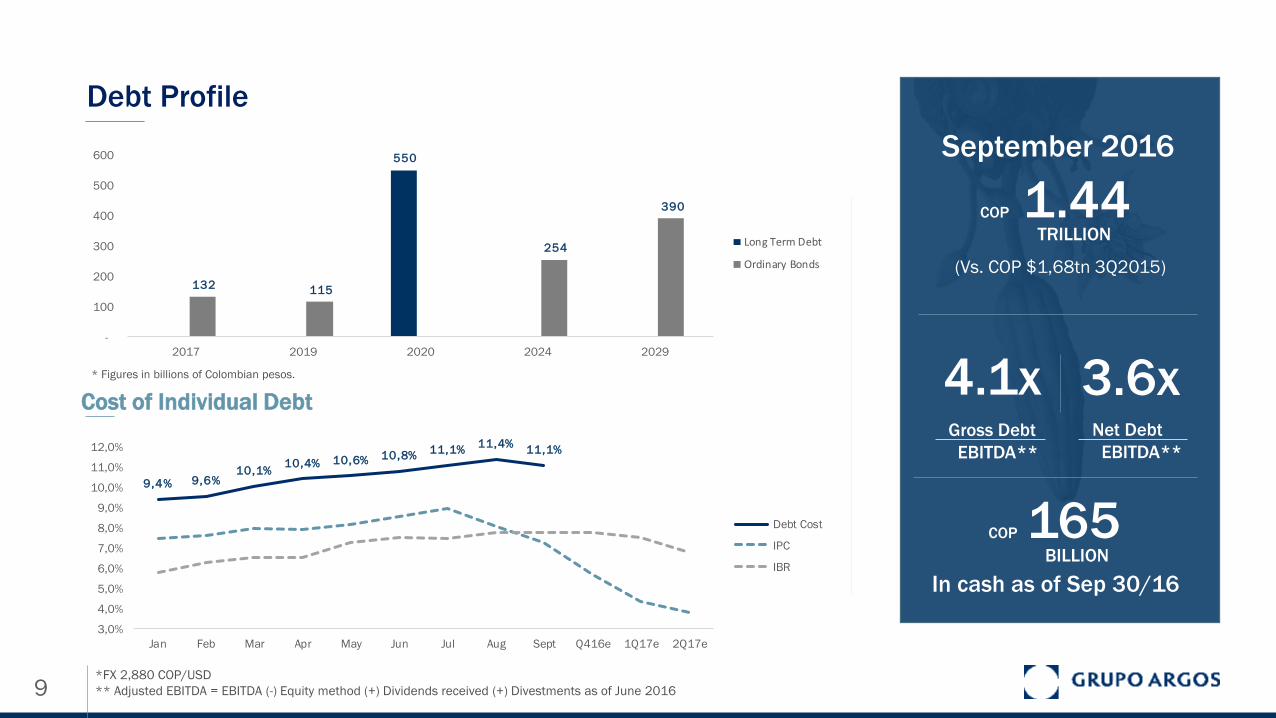
Debt Profile
4.1xGross Debt
EBITDA**
1.44TRILLION
Cost of Individual Debt
*FX 2,880 COP/USD
** Adjusted EBITDA = EBITDA (-) Equity method (+) Dividends received (+) Divestments as of June 2016
* Figures in billions of Colombian pesos.
COP 165BILLION
In cash as of Sep 30/16
Net Debt
EBITDA**
3.6x
COP
9
September 2016
(Vs. COP $1,68tn 3Q2015)
550
132 115
254
390
-
100
200
300
400
500
600
2017 2019 2020 2024 2029
Long Term Debt
Ordinary Bonds
9,4% 9,6%10,1%
10,4% 10,6% 10,8%11,1%
11,4%11,1%
3,0%
4,0%
5,0%
6,0%
7,0%
8,0%
9,0%
10,0%
11,0%
12,0%
Jan Feb Mar Apr May Jun Jul Aug Sept Q416e 1Q17e 2Q17e
Debt Cost
IPC
IBR
Cement BUSINESS
11
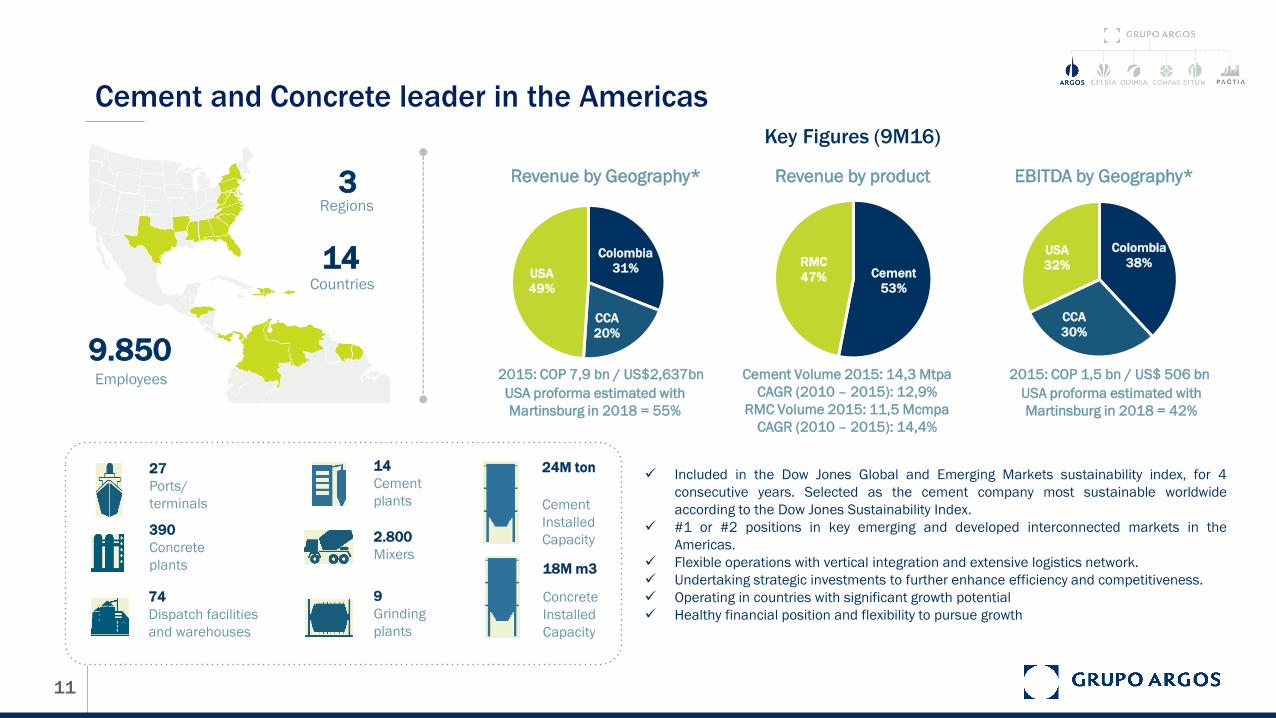
Cement and Concrete leader in the Americas
14
Cement
plants
2.800
Mixers
9
Grinding
plants
390
Concrete
plants
74
Dispatch facilities
and warehouses
27
Ports/
terminals
24M ton
18M m3
Cement
Installed
Capacity
Concrete
Installed
Capacity
Included in the Dow Jones Global and Emerging Markets sustainability index, for 4
consecutive years. Selected as the cement company most sustainable worldwide
according to the Dow Jones Sustainability Index.
#1 or #2 positions in key emerging and developed interconnected markets in the
Americas.
Flexible operations with vertical integration and extensive logistics network.
Undertaking strategic investments to further enhance efficiency and competitiveness.
Operating in countries with significant growth potential
Healthy financial position and flexibility to pursue growth
Key Figures (9M16)
Revenue by Geography* Revenue by product EBITDA by Geography*
Colombia
31%
CCA
20%
USA
49%
Cement
53%
RMC
47%
Colombia
38%
CCA
30%
USA
32%
2015: COP 7,9 bn / US$2,637bn
3Regions
14Countries
9.850Employees 2015: COP 1,5 bn / US$ 506 bnCement Volume 2015: 14,3 Mtpa
CAGR (2010 – 2015): 12,9%
RMC Volume 2015: 11,5 Mcmpa
CAGR (2010 – 2015): 14,4%
USA proforma estimated with
Martinsburg in 2018 = 55%
USA proforma estimated with
Martinsburg in 2018 = 42%

12
Profitability of the strategy supported by increase in demand
#1 or #2 Positions in Key Emerging and Developed Interconnected Markets in the Americas
Flexible Operations with Vertical Integration and Extensive Logistics Network
Operating in Countries with Significant Growth Potential
Strategic Investments Further Enhance Efficiency and Competitiveness
Track Record of Successfully Implementing Disciplined Growth Strategy
Healthy Financial Position and Flexibility to Pursue Growth
Focus on Innovation and Sustainability
Strategy
Privileged footprint with strategically
located plants close to high demand
centers
Strategically located ports further
enhance vertical integration.
Leadership in concrete – Leverage
cement demand
Cement consumption to reach pre-
crisis levels in 2020 (+24% vs
2016E).
Public infrastructure plans (FAST +
Trump plans)
Higher capacity factors could benefit
prices.
Consolidation of recent Martinsburg
plant acquisition.
Efficiency optimization through BEST
program: cash cost reduction target
USD 6/ton seeking to be the most
competitive.
Undisputable market leader in a
growing market.
Value proposal (retail and
infrastructure).
Public and private infrastructure
projects materialization: 4G Concession
Plan will demand ~5M ton of cement,
starting in 2H17.
Housing deficit (quantitative of 0.6M
and qualitative of 1.1M.
High long term growth prospects
Strategic interconnection of all regions
USA recovery driving growth in
remittances across the region.
Scalable investment due to logistic
synergies
Successful trading strategy in the region
with efficiencies.
Contribution to
Grupo Argos
EBITDA
USD 425
DIVIDENDS - 2016
USD 40bn
million as of 3Q16
Mature Operation
Stable dividend stream
Internationalization
Know How
Successful growth
strategy
CCA
Drivers & Competitive Advantages
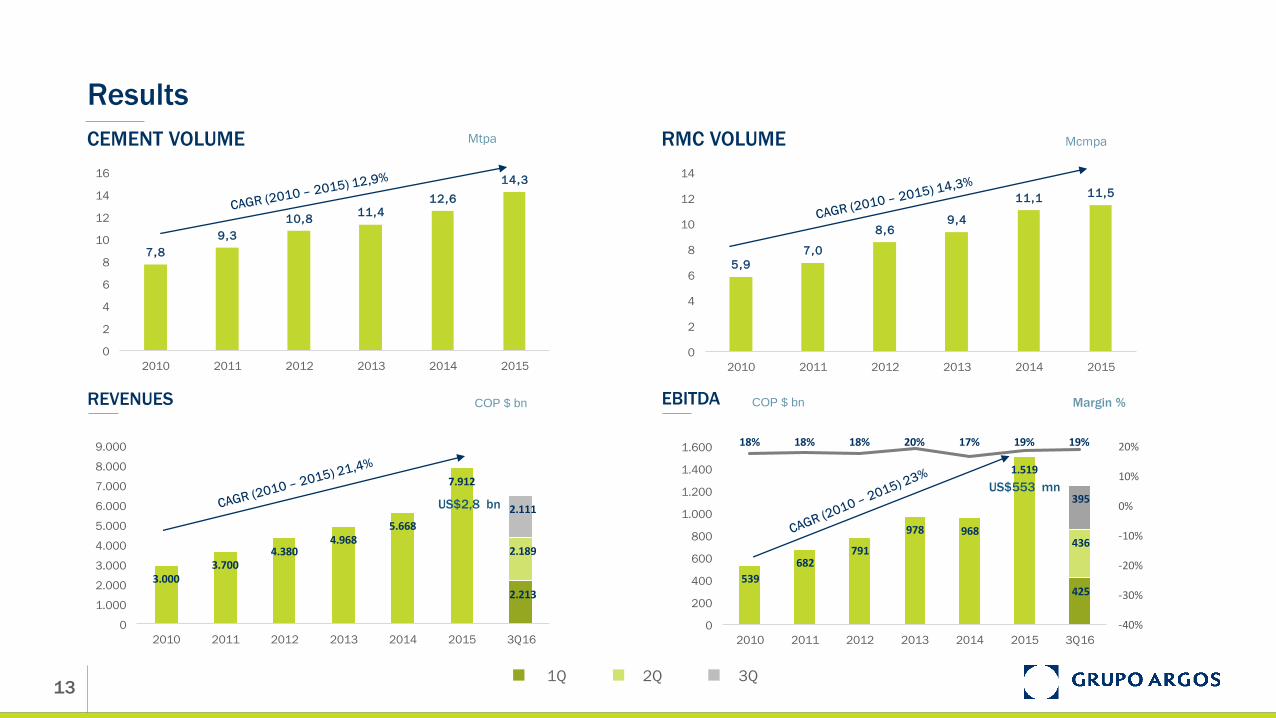
13
539
682791
978 968
1.519
425
436
395
18% 18% 18% 20% 17% 19% 19%
-40%
-30%
-20%
-10%
0%
10%
20%
0
200
400
600
800
1.000
1.200
1.400
1.600
2010 2011 2012 2013 2014 2015 3Q16
3.0003.700
4.3804.968
5.668
7.912
2.213
2.189
2.111
0
1.000
2.000
3.000
4.000
5.000
6.000
7.000
8.000
9.000
2010 2011 2012 2013 2014 2015 3Q16
Results
COP $ bn Margin %COP $ bnEBITDAREVENUES
US$2,8 bn
US$553 mn
RMC VOLUMECEMENT VOLUME Mtpa Mcmpa
7,8
9,3
10,811,4
12,6
14,3
0
2
4
6
8
10
12
14
16
2010 2011 2012 2013 2014 2015
5,9
7,0
8,69,4
11,1 11,5
0
2
4
6
8
10
12
14
2010 2011 2012 2013 2014 2015
1Q 2Q 3Q
Energy BUSINESS
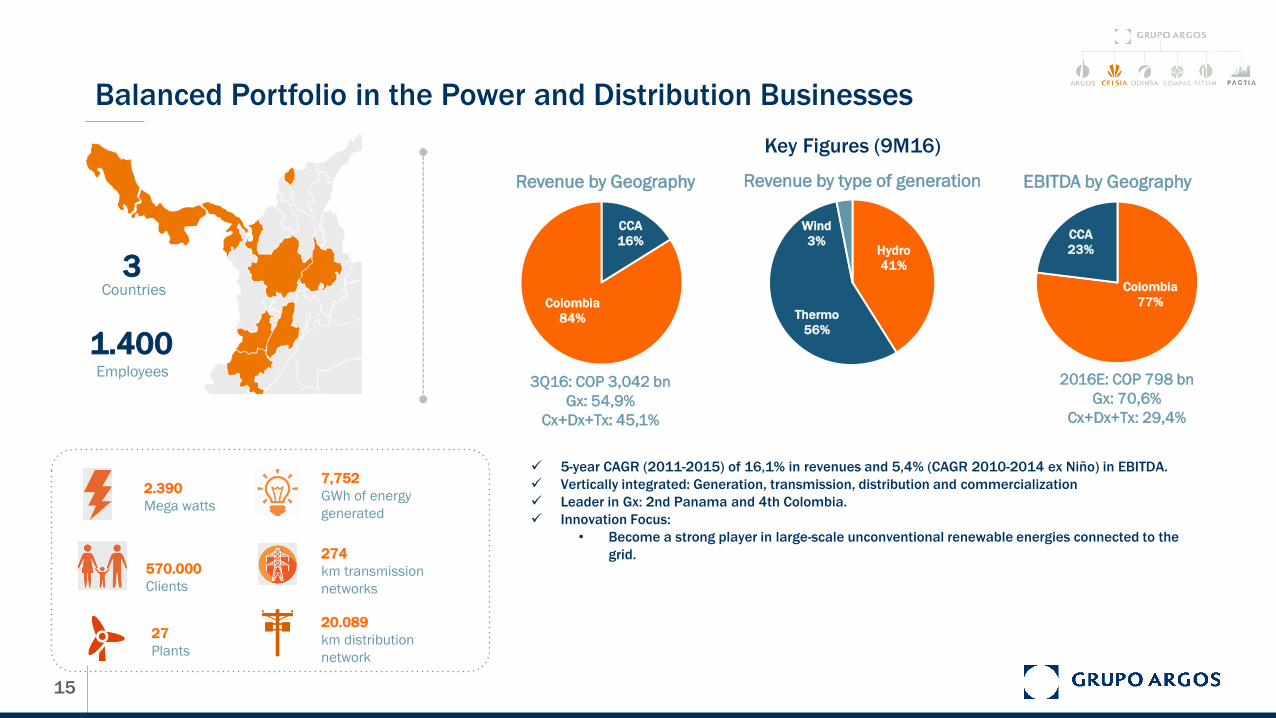
15
Balanced Portfolio in the Power and Distribution Businesses
7,752
GWh of energy
generated
274
km transmission
networks
20.089
km distribution
network
5-year CAGR (2011-2015) of 16,1% in revenues and 5,4% (CAGR 2010-2014 ex Niño) in EBITDA.
Vertically integrated: Generation, transmission, distribution and commercialization
Leader in Gx: 2nd Panama and 4th Colombia.
Innovation Focus:
• Become a strong player in large-scale unconventional renewable energies connected to the
grid.
Revenue by Geography EBITDA by Geography
3Q16: COP 3,042 bn
Gx: 54,9%
Cx+Dx+Tx: 45,1%
2016E: COP 798 bn
Gx: 70,6%
Cx+Dx+Tx: 29,4%
3Countries
1.400Employees
Hydro
41%
Thermo
56%
Wind
3%
Colombia
77%
CCA
23%
CCA
16%
Colombia
84%
570.000
Clients
2.390
Mega watts
27
Plants
Revenue by type of generation
Key Figures (9M16)
16
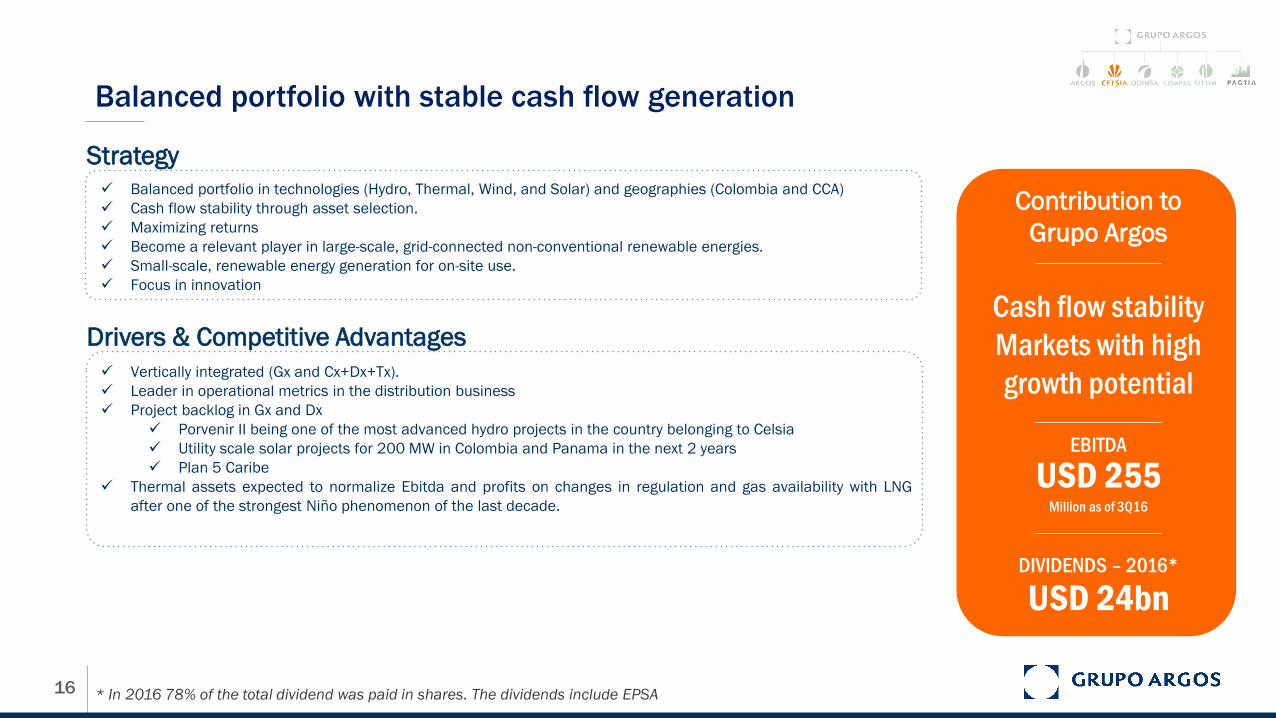
Balanced portfolio with stable cash flow generation
Balanced portfolio in technologies (Hydro, Thermal, Wind, and Solar) and geographies (Colombia and CCA)
Cash flow stability through asset selection.
Maximizing returns
Become a relevant player in large-scale, grid-connected non-conventional renewable energies.
Small-scale, renewable energy generation for on-site use.
Focus in innovation
Strategy
Drivers & Competitive Advantages
Contribution to
Grupo Argos
EBITDA
USD 255
DIVIDENDS – 2016*
USD 24bn
Million as of 3Q16
Vertically integrated (Gx and Cx+Dx+Tx).
Leader in operational metrics in the distribution business
Project backlog in Gx and Dx
Porvenir II being one of the most advanced hydro projects in the country belonging to Celsia
Utility scale solar projects for 200 MW in Colombia and Panama in the next 2 years
Plan 5 Caribe
Thermal assets expected to normalize Ebitda and profits on changes in regulation and gas availability with LNG
after one of the strongest Niño phenomenon of the last decade.
Cash flow stability
Markets with high
growth potential
* In 2016 78% of the total dividend was paid in shares. The dividends include EPSA
17
732 714 731
865905
683
267
263
246
41% 39% 36% 36% 35%
18%
26%
-0,5
-0,4
-0,3
-0,2
-0,1
0
0,1
0,2
0,3
0,4
0
100
200
300
400
500
600
700
800
900
1.000
2010 2011 2012 2013 2014 2015 3Q16
1.805 1.8502.024
2.3812.589
3.692
1.363
862
777
0
500
1.000
1.500
2.000
2.500
3.000
3.500
4.000
2010 2011 2012 2013 2014 2015 3Q16
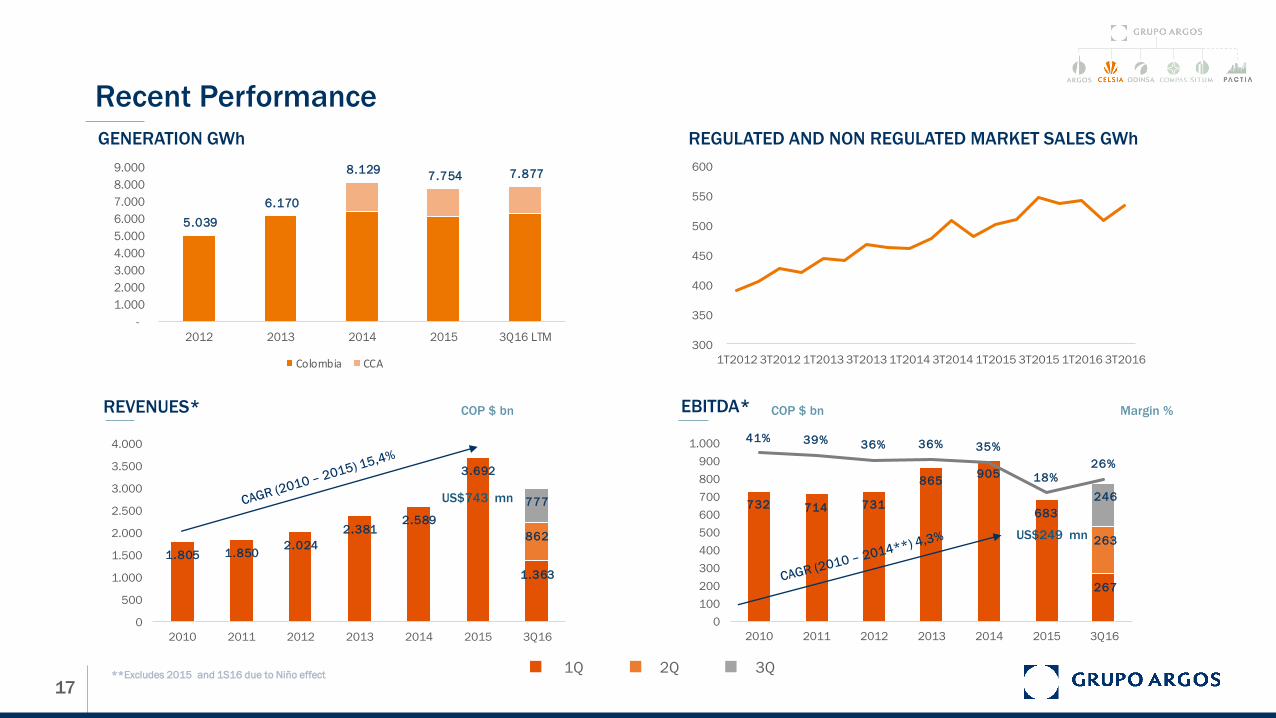
Recent Performance
GENERATION GWh
EBITDA*REVENUES*
REGULATED AND NON REGULATED MARKET SALES GWh
**Excludes 2015 and 1S16 due to Niño effect
COP $ bn Margin %COP $ bn
US$743 mn
US$249 mn
5.039
6.170
8.129 7.754 7.877
-
1.000
2.000
3.000
4.000
5.000
6.000
7.000
8.000
9.000
2012 2013 2014 2015 3Q16 LTM
Colombia CCA
300
350
400
450
500
550
600
1T2012 3T2012 1T2013 3T2013 1T2014 3T2014 1T2015 3T2015 1T2016 3T2016
1Q 2Q 3Q
Concessions Roads & airports
19
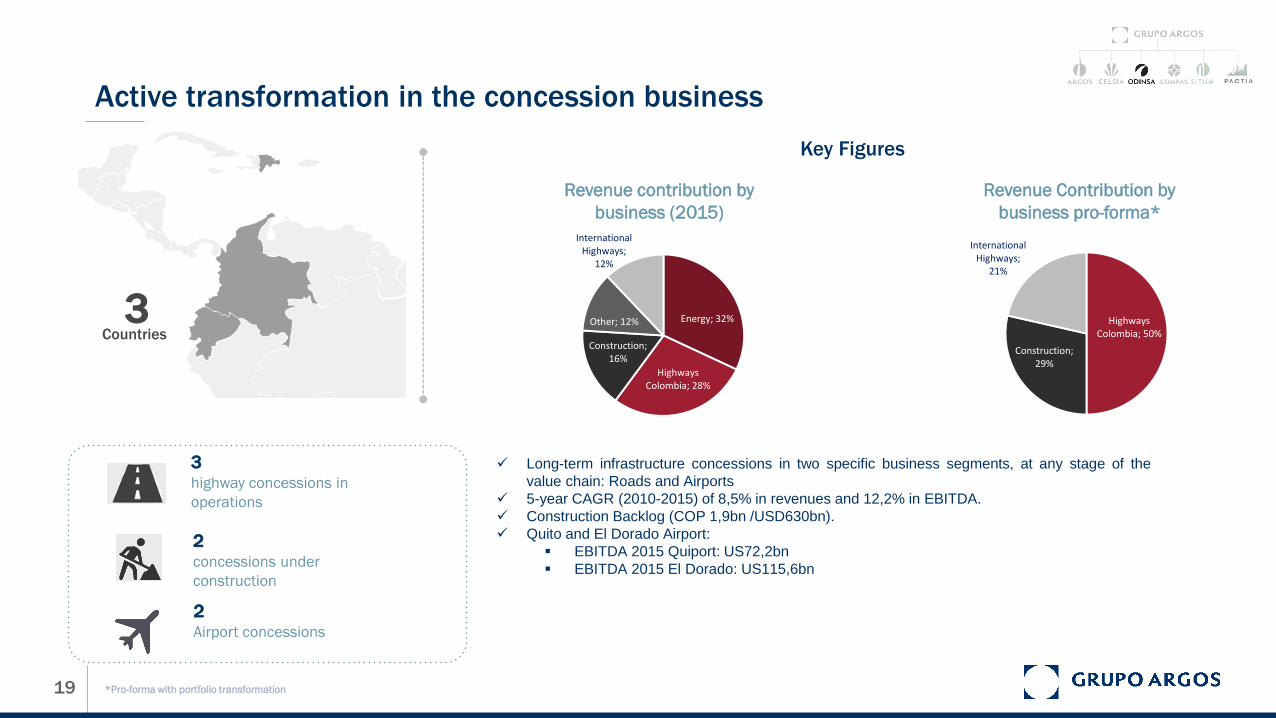
Active transformation in the concession business
2concessions under
construction
2Airport concessions
3highway concessions in
operations
Long-term infrastructure concessions in two specific business segments, at any stage of the
value chain: Roads and Airports
5-year CAGR (2010-2015) of 8,5% in revenues and 12,2% in EBITDA.
Construction Backlog (COP 1,9bn /USD630bn).
Quito and El Dorado Airport:
EBITDA 2015 Quiport: US72,2bn
EBITDA 2015 El Dorado: US115,6bn
3Countries
Revenue contribution by
business (2015)
Revenue Contribution by
business pro-forma*
Key Figures
Energy; 32%
Highways Colombia; 28%
Construction; 16%
Other; 12%
International Highways;
12%
Highways Colombia; 50%
Construction; 29%
International Highways;
21%
*Pro-forma with portfolio transformation
20
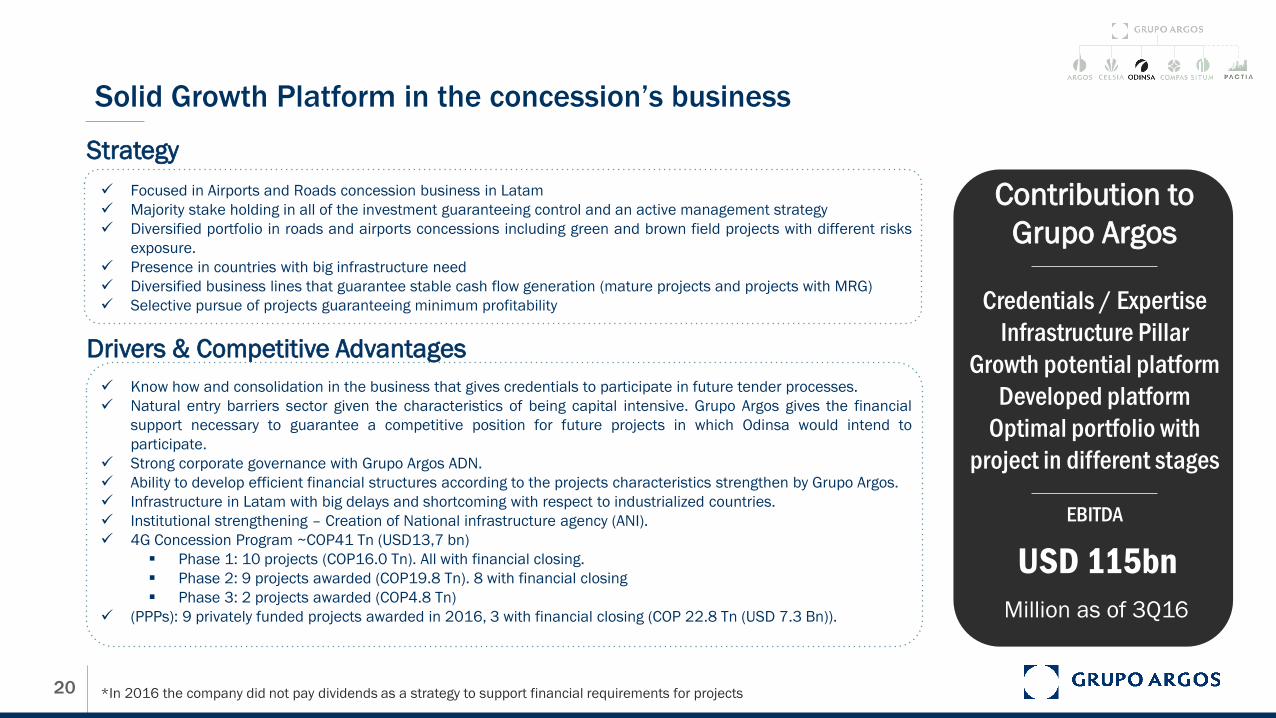
Solid Growth Platform in the concession’s business
Focused in Airports and Roads concession business in Latam
Majority stake holding in all of the investment guaranteeing control and an active management strategy
Diversified portfolio in roads and airports concessions including green and brown field projects with different risks
exposure.
Presence in countries with big infrastructure need
Diversified business lines that guarantee stable cash flow generation (mature projects and projects with MRG)
Selective pursue of projects guaranteeing minimum profitability
Strategy
Drivers & Competitive Advantages
Contribution to
Grupo Argos
EBITDA
USD 115bn
Know how and consolidation in the business that gives credentials to participate in future tender processes.
Natural entry barriers sector given the characteristics of being capital intensive. Grupo Argos gives the financial
support necessary to guarantee a competitive position for future projects in which Odinsa would intend to
participate.
Strong corporate governance with Grupo Argos ADN.
Ability to develop efficient financial structures according to the projects characteristics strengthen by Grupo Argos.
Infrastructure in Latam with big delays and shortcoming with respect to industrialized countries.
Institutional strengthening – Creation of National infrastructure agency (ANI).
4G Concession Program ~COP41 Tn (USD13,7 bn)
Phase 1: 10 projects (COP16.0 Tn). All with financial closing.
Phase 2: 9 projects awarded (COP19.8 Tn). 8 with financial closing
Phase 3: 2 projects awarded (COP4.8 Tn)
(PPPs): 9 privately funded projects awarded in 2016, 3 with financial closing (COP 22.8 Tn (USD 7.3 Bn)).
Credentials / Expertise
Infrastructure Pillar
Growth potential platform
Developed platform
Optimal portfolio with
project in different stages
*In 2016 the company did not pay dividends as a strategy to support financial requirements for projects
Million as of 3Q16
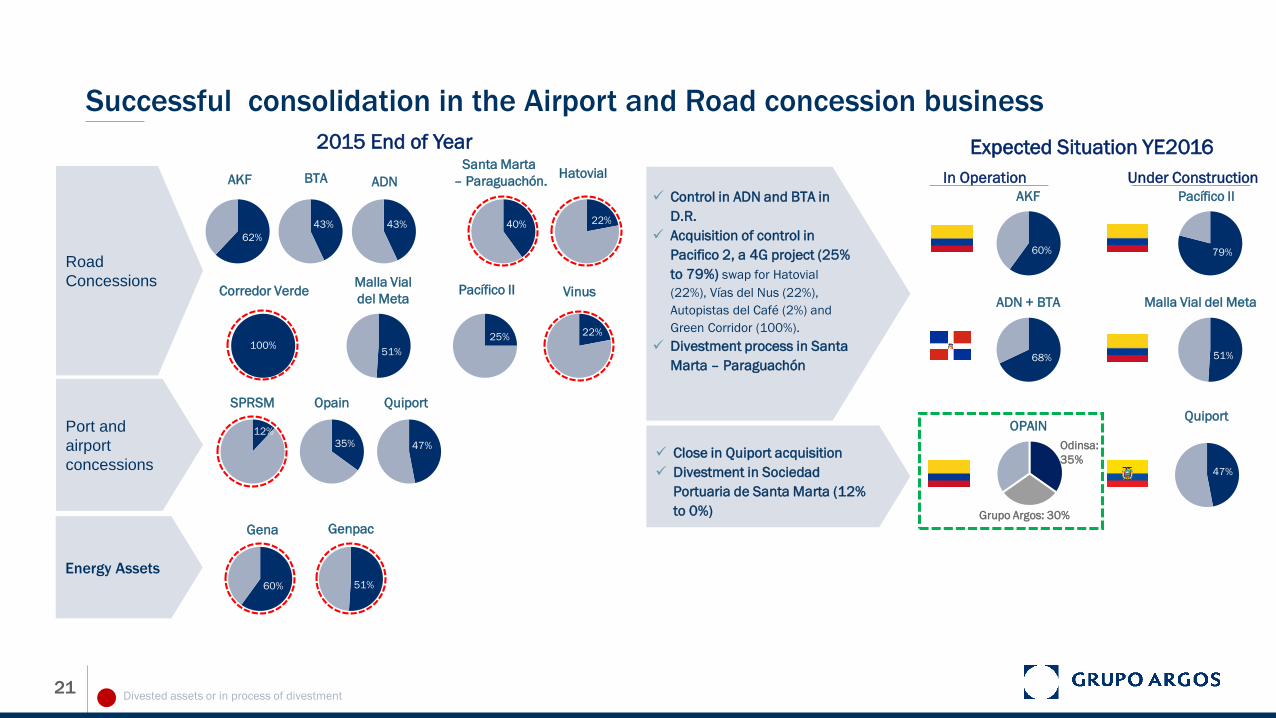
21
Road
Concessions
Port and
airport
concessions
Energy Assets
Control in ADN and BTA in
D.R.
Acquisition of control in
Pacifico 2, a 4G project (25%
to 79%) swap for Hatovial
(22%), Vías del Nus (22%),
Autopistas del Café (2%) and
Green Corridor (100%).
Divestment process in Santa
Marta – Paraguachón
2015 End of Year Expected Situation YE2016
Close in Quiport acquisition
Divestment in Sociedad
Portuaria de Santa Marta (12%
to 0%)
Divested assets or in process of divestment
Successful consolidation in the Airport and Road concession business
60% 51%
43% 43%
51%
35% 47%
12%
100%
22%
40% 22%
Hatovial
Vinus
AKF BTA ADN
Santa Marta
– Paraguachón.
Corredor VerdeMalla Vial
del MetaPacífico II
SPRSM Opain Quiport
Gena Genpac
62%
25%
60%
AKF
68%
ADN + BTA
Pacífico II
51%
OPAIN
47%
Quiport
79%
In Operation Under Construction
60% 79%
68% 51%
47%
Malla Vial del Meta
Grupo Argos: 30%
Odinsa:
35%

22
214
299 276228
288
131
123
118
36%42%
32%28%
32%
51%
-30%
-20%
-10%
0%
10%
20%
30%
40%
50%
0
50
100
150
200
250
300
350
400
2011 2012 2013 2014 2015 3Q16
598704
874 817898
252
221
261
0
100
200
300
400
500
600
700
800
900
1.000
2011 2012 2013 2014 2015 3Q16
33.609
5.630
9.041
9.906
AKF Pacífico II Sta. Marta - Para. ADN + BTA
REVENUES*
Recent Performance
PASSENGERSM pax
TRAFFIC 2015
EBITDACOP $ bn COP $ bn Margin %
US$301 mnUS$103 mn
CAGR (2011 – 2015) 7,6%
18,8 20,1 22,4 25,0 27,631,0
5,0 5,45,4
5,55,5
5,4
0,0
5,0
10,0
15,0
20,0
25,0
30,0
35,0
40,0
2010 2011 2012 2013 2014 2015
Opain Quiport
1Q 2Q 3Q

Real - Estate
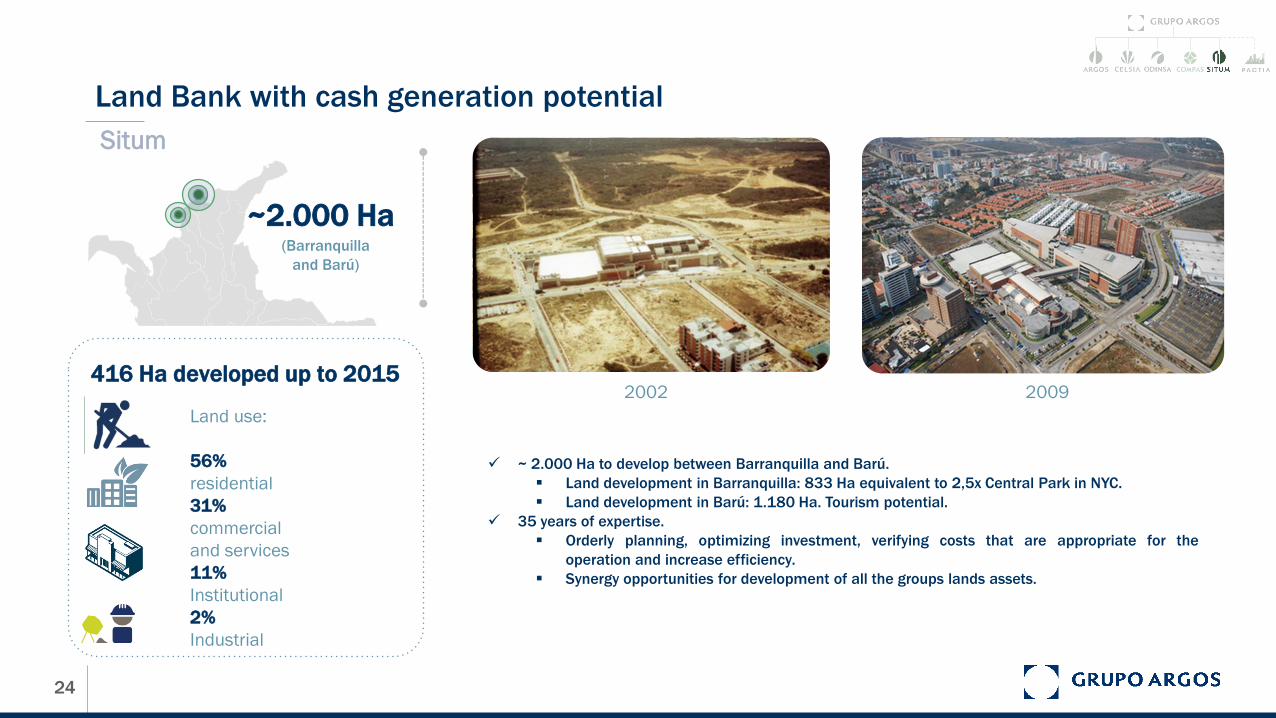
24
416 Ha developed up to 2015
Land use:
56%
residential
31%
commercial
and services
11%
Institutional
2%
Industrial
~ 2.000 Ha to develop between Barranquilla and Barú.
Land development in Barranquilla: 833 Ha equivalent to 2,5x Central Park in NYC.
Land development in Barú: 1.180 Ha. Tourism potential.
35 years of expertise.
Orderly planning, optimizing investment, verifying costs that are appropriate for the
operation and increase efficiency.
Synergy opportunities for development of all the groups lands assets.
~2.000 Ha(Barranquilla
and Barú)
2002
Land Bank with cash generation potential
2009
Situm

25
~ 450.000 m2
Shopping centers, offices,
warehouses, self-storage and
hotels
USD 680
million in assets
>1800
commercial units
2Countries
14Colombian
States
EBITDA CAGR projected 2016 – 2026:16%
~ 260.000 m2 in pipeline to reach 711.000 m2 in GLA in the next 4 years.
Assets:
16 shopping centers
14 industrial projects
10 corporate buildings
1.117 rooms in 6 properties
+ 3.000 self-storage units in 8 properties
Property Joint Venture with growth potential
89 152 160
258 345
31
434 482
710
2010 2011 2012 2013 2014 2015 2016 … 2019 -
2022
Conconcreto Grupo Argos Pactia
PactiaEvolution of Conconcreto and Grupo Argos
GLA m2 (000’)
Concessions Ports
27
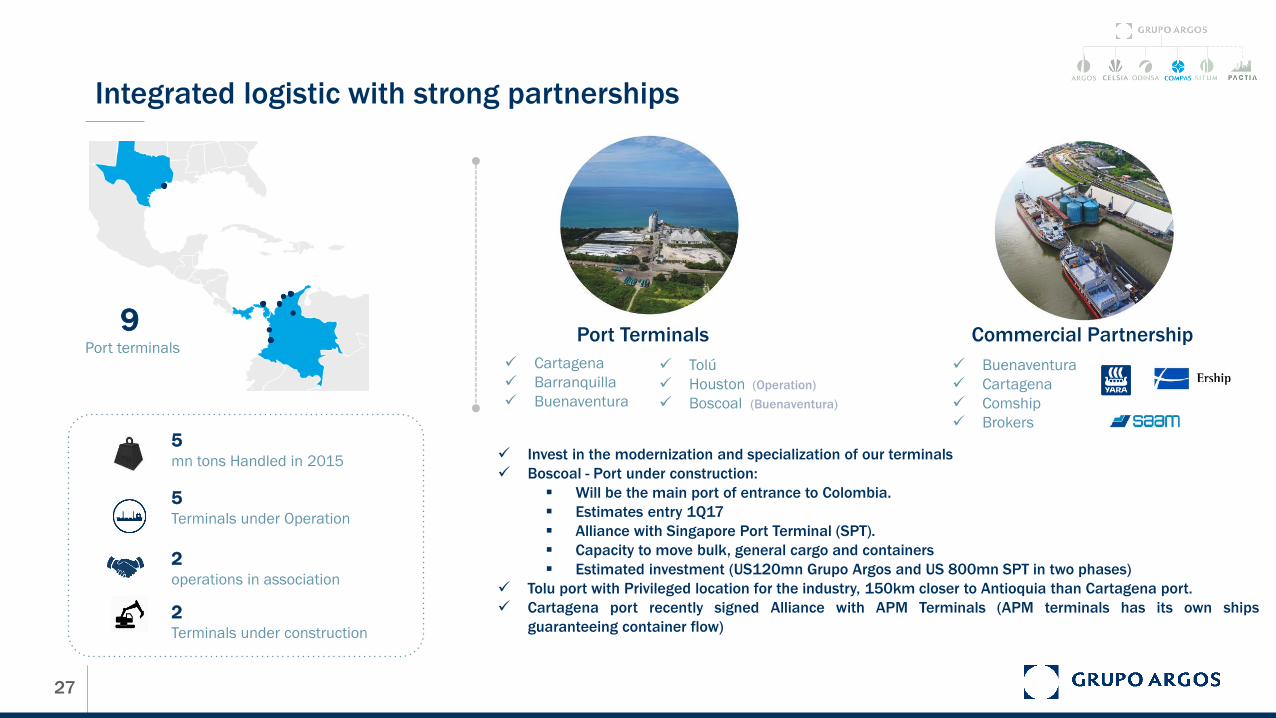
Integrated logistic with strong partnerships
Cartagena
Barranquilla
Buenaventura
Tolú
Houston (Operation)
Boscoal (Buenaventura)
Buenaventura
Cartagena
Comship
Brokers
5 Terminals under Operation
2 operations in association
2 Terminals under construction
5 mn tons Handled in 2015 Invest in the modernization and specialization of our terminals
Boscoal - Port under construction:
Will be the main port of entrance to Colombia.
Estimates entry 1Q17
Alliance with Singapore Port Terminal (SPT).
Capacity to move bulk, general cargo and containers
Estimated investment (US120mn Grupo Argos and US 800mn SPT in two phases)
Tolu port with Privileged location for the industry, 150km closer to Antioquia than Cartagena port.
Cartagena port recently signed Alliance with APM Terminals (APM terminals has its own ships
guaranteeing container flow)
9Port terminals
Port Terminals Commercial Partnership
28
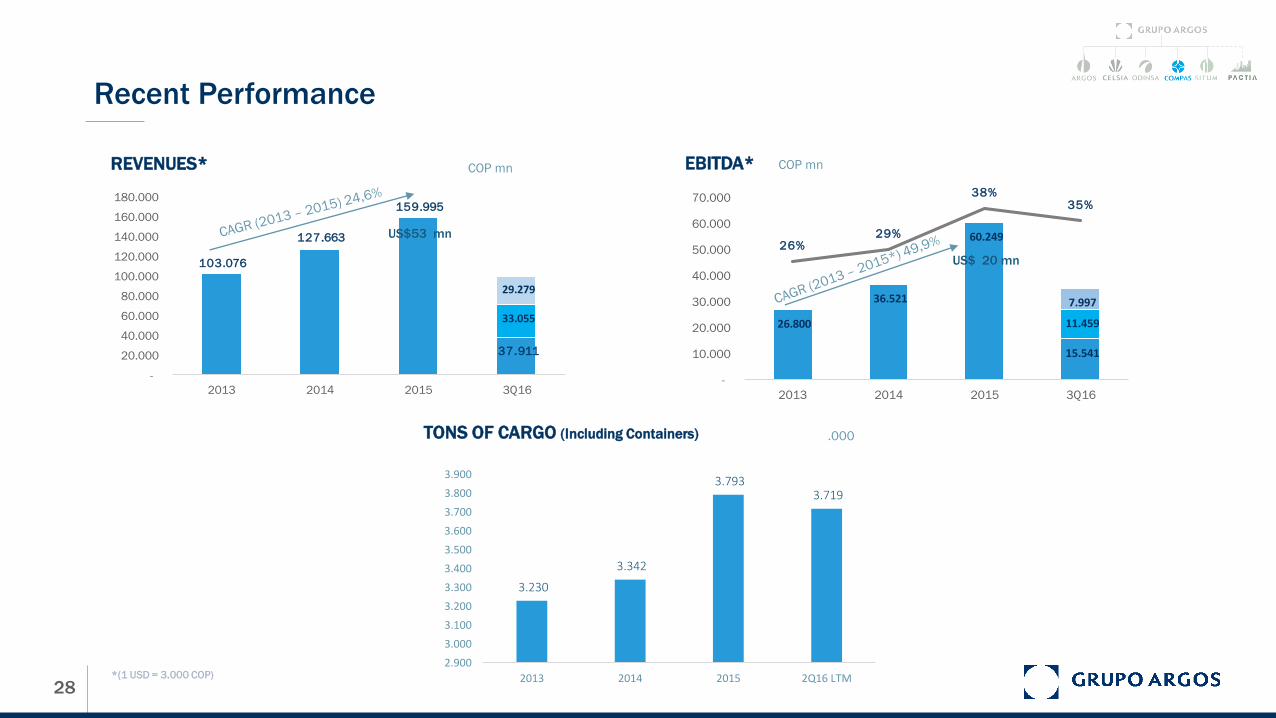
26.800
36.521
60.249
15.541
11.459
7.997
26%29%
38%35%
0%
5%
10%
15%
20%
25%
30%
35%
40%
-
10.000
20.000
30.000
40.000
50.000
60.000
70.000
2013 2014 2015 3Q16
103.076
127.663
159.995
37.911
33.055
29.279
-
20.000
40.000
60.000
80.000
100.000
120.000
140.000
160.000
180.000
2013 2014 2015 3Q16
Recent Performance
TONS OF CARGO (Including Containers)
EBITDA*REVENUES* COP mn
.000
3.230
3.342
3.793 3.719
2.900
3.000
3.100
3.200
3.300
3.400
3.500
3.600
3.700
3.800
3.900
2013 2014 2015 2Q16 LTM*(1 USD = 3.000 COP)
COP mn
US$ 20 mn
US$53 mn
29
Contact
NATALIA AGUDELO
Investor Relation Director
Grupo Argos
Phone: (57) 4 3198712
ALEJANDRO PIEDRAHITA
CFO
Grupo Argos