hold - bet site
TRANSCRIPT
1
EQUITY RESEARCH – RABA
EQUITY RESEARCH: Hold 15 December 2017
Sources: Rába, Bloomberg
RÁBA AUTOMOTIVE HOLDING
Highlights
We initiate the coverage of Rába Automotive Holding Plc (RABA
HB; RABA.BU) with a HOLD recommendation with a target price
of 1,380 HUF/share on a 12-month horizon, 9,9 % higher than
the latest HUF 1,255 closing price on December 14, 2017, while
considering future potential dividend payment Rába stocks may
offer 12% total return.
Summary and price drivers
With improving economic conditions in the eurozone and
in the CIS countries, the strongly pro-cyclical demand for
Raba’s products is expected to rise. Over the medium
term, defence expenditure in Hungary could also rise
closer to NATO's defence spending target.
The recent investment programme will boost capacities,
improve efficiency and mitigate labour shortage.
Operating expenditures will increase due to raw material
and labour costs.
Rába’s financial indicators have improved significantly in
recent years, by now they are in-line with or look better,
than the indicators of the Hungarian vehicle-peer group.
Our DCF model shows a modest upward potential
compared to the current market price.
Main risks to our target price
As a consequence of low free cash-flow, the share price
is heavily dependent on the terminal value. If profit
growth will diverge from the forecasted 3%, pricing could
change sharply.
Faster normalisation of yield environment could be a
pressure on the share price as well.
Labour shortage could be a drag on production
Rába vs. Stoxx 300 EM Automotives index (2015.12.31=100)

2
EQUITY RESEARCH – RABA
Company profile
Rába Automotive Holding Plc (“Rába”) is a Tier1 and Tier2
automotive manufacturer with more than 120 years of history,
located in Győr, North-Western Hungary, with plants in the Trans-
Danubia region. The company’s main profile is the manufacturing
of axles, axle spare parts, vehicle components and vehicles of
military and civilian use. Rába’s main focus is the export, with
sales to the USA and the EU making up the largest part of its
revenue. Its buyers include high-profile machinery manufacturers
like John Deere, Claas, Volvo and Scania.
Business units:
Rába’s manufacturing operation is shared among its three fully-
owned affiliates: the Axle Business Unit, the Components
Business Unit, and the Vehicle Business Unit.
1) Axle Business Unit (ABU) or officially Rába Axle Ltd. (Rába
Futómű Kft.), the flagship unit of Rába Holding, produces
complete axles and axle components to medium- and heavy-duty
trucks, military trucks, and specialty vehicles (tractor,
construction equipment, buses).
ABU sells:
• special axles to the USA,
• machined and forged axle spare parts for trucks in
European markets,
• axles for buses and commercial vehicles in Eastern Europe
(mainly CIS).
Main current customers:
• John Deere, Meritor, Marmon-Herrington (USA)
• Claas, Volvo, Scania, Dana, MAN (EU)
• KAMAZ, GAZ Group (RUS)
• Rába Vehicles Ltd., BPW (HU)
ABU delivers roughly half of Rába Holding’s sales income and 55%
of the Group's EBITDA. The Axle Business Unit has the biggest
export share among the three subsidiaries; 84-86% of net sales
are sold outside the domestic market. The US sales have a 14%
share, while more than half of the unit’s production was
marketed in the EU. ABU had a very strong growth potential in
the period between 2006 and 2013; however, sales income has
not returned to pre-crisis levels yet. Since 2014 the axle
business’s sales has been declining, mainly in the USA, particularly

3
EQUITY RESEARCH – RABA
those to USA, primarily due to the weakness of the US agricultural
machinery market. Our sales forecast expects US sales to decline
further, while European markets seem to be in very good shape,
so we expect growing sales there in the coming years.
2) Components Business Unit (CBU) or Rába Automobile Parts
Ltd. (Rába Járműalkatrész Kft.): Tier1 and Tier2 supplier of the
automotive supply chain in CEE and EU markets. The CBU
produces seat frames, cut and sewn components for passenger
and commercial vehicles and machined parts. It operates in Mór,
Esztergom (in the vicinity of the Suzuki production base), and
Sárvár. Its main customers are Magyar Suzuki, Magyar Toyo Seat,
NAF GmbH, Rába Axle Ltd., Deutz, Claas, and Fehrer Hungária
(VW and Suzuki parts).
The Component Business Unit delivers over 20% of Rába’s total
sales and one quarter of the consolidated EBITDA. Export at CBU
is pronounced as well; about half of sales revenues comes from
European markets while the other half is domestic sales income.
Interestingly, in spite of the decades-long collaboration with its
business partners, neither the export sales nor the domestic
income show steady growth or balanced moves; sales revenues
are volatile in yearly comparison in both segments. The CBU only
sells to European markets outside Hungary; in our sales forecast
we expect a very dynamic sales growth (CAGR: 7%) in the next
five years.
3) Vehicle Business Unit (VBU) or Rába Vehicle Ltd. (Rába Jármű
Kft.): exclusive supplier of off-road vehicles to the Hungarian
Defence Forces until 2018, supplier of the fire-service under a
three-year project worth of HUF 1.5bn (fire-engine chassis),
buses, bus chassis, chassis for trailers. State orders have around
10% share in the sales of the vehicle unit, army orders amount to
about HUF 2.7bn per year. In line with Hungary’s commitment to
NATO, to raise defence spending closer to the 2.0% target, from
its current level of 0.8% of GDP, sales in this segment have room
for slight uptick but are not expected to gain more than HUF 3bn
in the short term.
As the supplier of army vehicles and fire engines and also buses,
this unit has traditionally the smallest exposure to foreign
markets; domestic sales had an around 70% share in the past
years. In 2017, orders from new European customers
considerably boosted the share of exports (over 40% in Q1-Q3,
YoY). Changes in sales volume are hectic, but EBIT and EBITDA are
both steadily rising.

4
EQUITY RESEARCH – RABA
Industry Overview
Demand for vehicles, which are durable goods with a longer
amortisation cycle, is usually highly income-sensitive, so growth
potential and cyclicality (and the beta) is above one. Longer
amortisation period means higher beta, so demand for heavy
trucks strongly correlates with the business cycle. Competition in
the industry is strong, stimulated also by regulation to mitigate
the negative impact on the environment and to improve safety.
In Hungary, vehicle production (manufacture of motor vehicles,
trailers, semi-trailers and of other transport equipment) is an
important industry – just like in the Czech Republic and Slovakia,
companies are usually parts of the German automotive product
chains. Roughly 90% of the production is exported. The structure
of vehicle production looks like a pyramid, with a few original
equipment manufacturers – like VW – on the top. Tightening
regulation and increasing fixed cost of R&D put heavy pressure on
original equipment manufacturers to consolidate, so their
numbers are decreasing. Their suppliers are the Tier 1-2-3 level
players in the automotive sector, specialized in a given car
equipment.
Rába mainly caters for the manufacturers of medium and heavy
commercial vehicles (trucks and buses). Demand for these
vehicles shows strong cyclical fluctuations. Road freight is driven
strongly by construction, which is in turn determined by
investment in buildings and other structures. Demand for these
fixed assets typically shows large and long cycles.
However, long-term growth prospects of the heavy vehicle
industry appear limited, particularly in developed economies.
Contrary to GDP, road freight volumes show no clear upward
trend in the European Union. Demography can have some effect
on long-term demand for buildings and structures, but economic
development (in terms of per capita GDP growth) need not. First,
economic growth is driven more and more by services, which
create only limited demand for heavy transport equipment.
Second, supply chain management and logistics underwent
massive efficiency improvements (driven partly by sustained high
oil prices, aided by the container technology and the IT
revolution), which means that a fixed amount of vehicles can
transport a higher volume of goods than before. Such efficiency
increases may continue in the future (e.g. with self-driving

5
EQUITY RESEARCH – RABA
trucks).
As a result of these trends, annual sales of medium and heavy
vehicles have fluctuated around a long-term average of around
380,000 in the European Union since the 1990s, according to
ACEA. Longer series (since 1967) for the United States confirm
that heavy truck sales are strongly cyclical but do not grow in the
long term.
These trends suggest that the overall economic environment will
be supportive of Rába’s revenue growth as long as the European
construction sector recovers. However, the long-term growth
potential based on macroeconomic factors alone is limited.
Instead, long-term revenue growth may come from entry into
new markets as well as moving up the value chain.

6
EQUITY RESEARCH – RABA
Macroeconomic & interest rate environment
The demand for Raba's products is strongly pro-cyclical, and right
now the growth outlook of the main export markets looks
promising. Decent growth is forecast for the EU, USA and Hungary
as well, while the recovery in Russia could go on after the country
emerged from recession in 2017.
Europe's GDP could reach 2.2% this year, outperforming
expectations of only 1.4% at the beginning of the year. Not only did
growth accelerate, but it also became synchronized among
countries, and broad-based, as both exports and domestic demand
are strong. The improvement is driven by the labour market:
employment rose to all-time highs, while unemployment fell below
9%. Accordingly, household and business confidence, consumer
spending, investment activity, loan demand and building permits all
revived. Looking ahead, the market expects growth to moderate to
2% in 2018 and to 1.5% until 2020. However, risks are on the
upside as economic policies could remain supportive, interest rates
will be kept low and there is no need for fiscal tightening.
The USA's growth is also expected to fluctuate between 2% and
2.4% in the coming years. However, the risk profile is less positive
than in the eurozone, as after seven years of continuous growth,
the probability of a slowdown in the USA should not be mitigated,
even taking into account the positive effects of the tax reform,
likely to be passed by Congress and the Senate in a short time.
However overseas demand for Rába products is also influenced by
the prices of agricultural commodities, which may have hit bottom
and are expected to pick up from the current low levels, according
to the forecasts of the World Bank.
In Hungary, after a temporary slowdown to 2% in 2016 caused by
the short-lived fall in EU-funds-related public investments, the
economy gained traction again in 2017. GDP growth accelerated
back to the 3-4% range (GDP grew by 3.9% YoY in Q3). The business
cycle has reached maturity stage and growth is broad-based,
therefore exports, consumption, public and private investments
posted decent growth rates. GDP growth could reach 3.8% in 2017
as a whole, while the consensus expects growth to moderate to
3.4% in 2018, 2.8% in 2019, and to 2% until 2022 (OTP Research
forecasts 3.7% for 2018, 2.6% for 2019, and then a slowdown to 2%
as the growth contribution of real estate and EU-fund-related
investments is expected to moderate, with upward risks.

7
EQUITY RESEARCH – RABA
The business cycle of Russia lags behind Europe, as Russia was
severely hit by the fall in commodity prices that started in 2014,
which pushed the economy into recession in 2015 and 2016. After
a serious rebalancing, the recovery started in the second half of
2016. In 2017 as a whole GDP could grow by around 1.7%. In the
coming years growth could fluctuate in the 1.6-2% range, as tight
fiscal policy and hawkish interest rate policy is expected to remain
a drag on the economy. In our view, exchange rate is an important
driver of Raba’s sales to Russia, where the market expects some
further depreciation in the medium term.
FINANCIAL ANALYSIS
Promising sales outlook
The total consolidated sales income of Rába declined by 8% in
2016 as the market conditions weakened in some of Rába’s main
export markets, and domestic sales income also shrank. However,
in a longer term we expect Rába’s sales to recover as demand
strengthens due to improving economic conditions. CAGR for the
period 2018-2022 is expected to reach about 4% compared to the
3% average annual growth after the crisis. The main contributor
to the forecasted sales growth is the CIS market (CAGR: 11%),
while European markets (EU and other Europe) also did its bit. We
forecast EU sales to grow by an average 7%, while our model
estimates an annual average growth of 9% in other, residual
markets of Rába.
Margins
Permanently high steel prices and labour costs put profitability
under pressure. Rába’s historical margin level ranges between
19% and 23% of net sales in the past ten years and we do not
expect significant changes in the explicit forecast period.
However, rising steel prices weigh on profitability at the
production level, and only partly are offset by declining energy
prices. EBITDA margin fluctuates in a wider range; it averaged
about 14% in the past five years. Labour shortage and labour cost
put a downside risk on corporate profitability, like in almost every
sector of the Hungarian economy, and it especially applies to the
manufacturing industry and the region where Rába is located.
Relatively high taxes (corporate tax + industry tax) still weigh on
the company’s profitability in spite of the lower corporate tax rate
effective from January 1, 2017. Rába’s effective tax rate is

8
EQUITY RESEARCH – RABA
considerably higher than the official rate, and the mid-year data
indicate that nothing has changed in this respect.
Financial structure
Being an automotive manufacturer, Rába has very cyclical
operation. When the global financial crisis started in 2008, Rába
was in a very good shape in terms of profitability and financial
soundness. But all of a sudden, the crisis almost halved Rába's
export sales, its operation turned into huge losses and leverage
increased above the healthy level at consolidated level. The
company, just like the whole industry in general, recovered soon,
although sales have never returned to pre-crisis levels. In the
post-crisis years Rába’s leverage significantly improved: it is below
the sector’s and the Hungarian economy’s average, profitability
returned and remained stable, though it is below the industry
average. After scaling down the company’s consolidated debt in
the past few years, Rába announced this year a strategic
investment programme worth of HUF 12.4bn. The investment
program covers the high-value development and capacity
expansion in the Axle Business Unit at first, and the two other
units as well. Rába applied to the Hungarian Large Enterprise
Investment Support Program announced by the government, in
order to get help to finance the new capital expenditures. The
financial support obtained varies by business units and
establishments, and is between 25% and 35%, amounting to HUF
3.2 billion at group level. As a result, we assume that the
company's now conservative debt structure may relax in the
medium term.
Cash Flow
Looking forward, the capex program announced this year results
in higher negative investment cash flow in the 2017-2019 period.
Operating cash flow in 2017 is expected to increase but at a
slower pace than before, due the slower gain of current assets
than that of short term non-debt liabilities. Financial cash flow is
expected to contribute to the positive financial cash flow through
the higher leverage. We expect a net positive change in the
equity, with profit reserves growing bigger. Our forecast does not
calculate with dividend payment in the coming years, even
though the stable, profitable operations of Rába and the
composition of the equity allow it.
In the main indicators – margins, profitability, liquidity and
leverage – the Hungarian vehicle industry outperforms other
industries. After the hard years, Rába improved a lot in these
indicators and by now is in line with the Hungarian vehicle
9
EQUITY RESEARCH – RABA
industry as a whole.
VALUATION
We evaluate Rába by applying two techniques: Discounted Cash Flow and Multiple Analysis. Although Rába
itself is a holding company, and its operation is outsourced to three companies as business units, all of them
are so closely linked to the holding company’s management and to each other, that we evaluate them as
one. We do not think Rába's three business units have company-specific issues that would remain
undiscovered under this kind of approach.
DCF
Our DCF values Rába at 1,306 HUF/share, or HUF 17,6bn, in respect of total corporate value by end-2018.
Cash flow statement shows negative FCFF in 2015 and 2016 according to the available data, and as
investment intensifies the same happens in the first half of the forecast period, in line with the company
capex program. As a result, the low volume of FCFF weighs on Rába’s equity value, while terminal value
contributes more.
For the estimation of WACC, we used the current ten-year government bond yield as the risk free rate. The
reason is that in the current interest rate environment the five-year bond rate seems unrealistically low.
Equity premium was estimated at 5.5% using the average of the historical and the forward-looking
estimations. Finally, we used a 3% add-on to account for illiquidity and small-stock premium. Beta was
estimated at 1.65x. Using the CAPM model, it gives 11% as the required rate of return on equity. Interest
rate on debt was forecasted at 1.6%, and the debt to equity ratio is 15%.
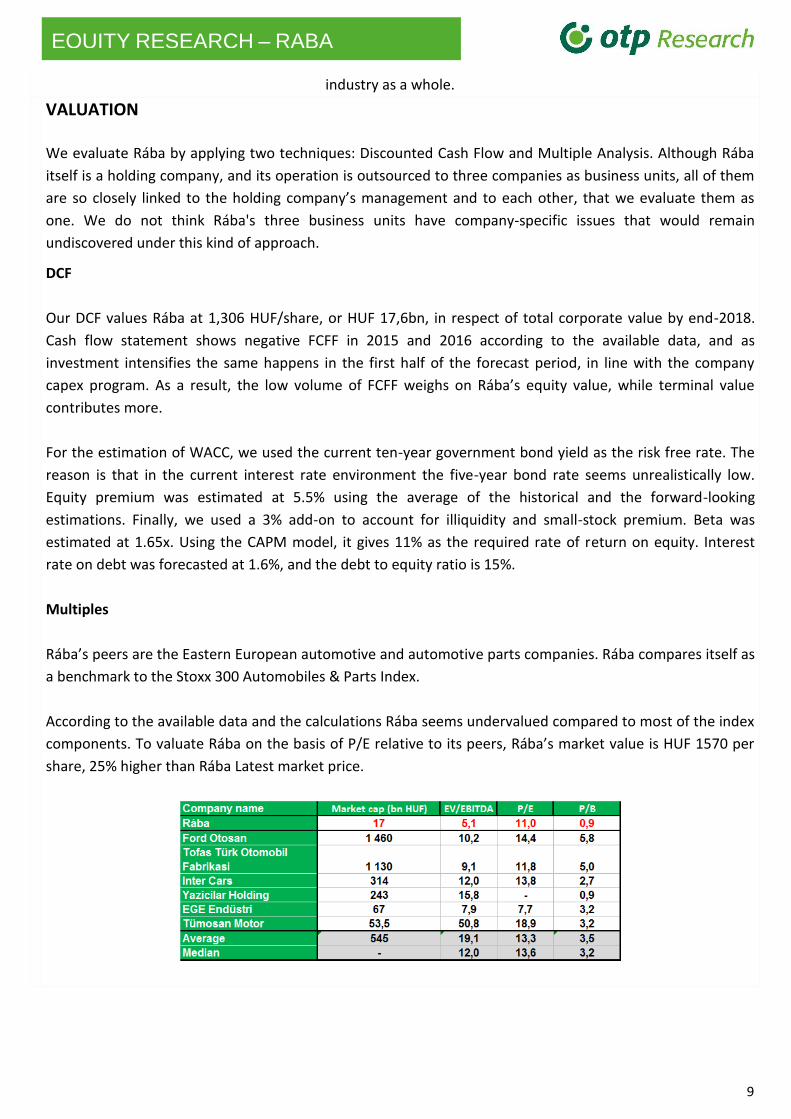
Multiples
Rába’s peers are the Eastern European automotive and automotive parts companies. Rába compares itself as
a benchmark to the Stoxx 300 Automobiles & Parts Index.
According to the available data and the calculations Rába seems undervalued compared to most of the index
components. To valuate Rába on the basis of P/E relative to its peers, Rába’s market value is HUF 1570 per
share, 25% higher than Rába Latest market price.

10
EQUITY RESEARCH – RABA
Risks to the target price
FX risk: As export sales have a dominant share in Rába’s sales performance, the company is exposed to
exchange rate fluctuations. About 60% of the total sales revenue is FX-dominated, which is estimated to
grow from 62% in 2016 to 67% in 2022.
Raw material & energy prices: Although raw material (steel) prices did not increase further in Q3, prices
stabilized at relative high levels.
Labour supply: The present labour market developments, particularly the prevailing labour shortage may
arrive at a point when it may harm the companies’ growth potential, and result in higher labour costs, or
extra capex need to substitute labour force with robotisation, or may lead to chronic capacity shortage. Rába
is located in Western Hungary, where unemployment practically vanished, and the local labour market is
supply-driven.
Ownership: Apparently, the state-owned MNV’s 75% ownership in Rába made no palpable changes to the
company’s operation or strategy. A significant part of MNV’s asset portfolio consists of companies linked to
public services – from this point of view Rába, an industrial manufacturer that operates under market
conditions, does not seem to fit the owner’s portfolio. MNV has not published a comprehensive strategy or a
clear view on its goals with Rába except the declaration at the time of the buyout on the strengthening of the
state’s presence in strategic sectors like the automotive industry. A further risk is that directives centrally
declared on the operation of state-owned companies make no difference between companies, and do not
take into consideration the sector characteristics. Although we consider the dominant state ownership a real
risk, this research does not factor it in.

11
EQUITY RESEARCH – RABA
CONSOLIDATED INCOME STATEMENT HUFm
2014 2015 2016 2017E 2018E 2019E
Domestic sales 19 526 17 838 16 216 16 678 2 180 1 899
Export sales 28 390 28 315 26 413 26 971 43 565 46 545
Total sales revenue 47 916 46 154 42 629 43 649 45 744 48 444
Direct cost of sales -38 725 -36 317 -33 200 -34 046 -36 596 -38 271
Gross profit 9 191 9 837 9 429 9 603 9 149 10 173
Indirect costs of sales -7 299 -7 640 -7 429 -7 682 -7 319 -8 139
EBIT 1 891 2 196 2 000 1 921 1 830 2 035
EBITDA 4 122 4 463 4 122 4 281 4 349 4 503
Net financial profit/loss -584 -104 -11 -140 183 203
Profit before tax 1 308 2 093 1 989 1 781 2 013 2 238
Tax -456 -410 -612 -489 -503 -560
After-tax profit 852 1 682 1 378 1 291 1 510 1 679
Dividend 0 0 269 404 579 674
EPS 65 127 102 96 112 125
DPS 20 30 40 50
Balance Sheet 2014 2015 2016 2017E 2018E 2019E
Property, plant, equipment 14 977 14 832 14 410 15 355 16 363 18 581
Intangible assets 1 071 789 500 384 433 404
Non-current assets 17 276 16 723 15 799 16 535 17 471 19 614
Inventories 6 629 6 211 5 728 7 948 7 356 8 831
Recievables 11 304 8 375 10 075 8 418 9 149 8 851
Cash and cash equivalents 1 025 3 199 1 900 1 807 1 601 2 422
Current Assets 18 976 17 807 17 703 18 209 18 106 20 105
TOTAL ASSETS 36 252 34 530 33 502 34 745 35 577 39 718
CONSOLIDATED CASH FLOW HUFm
2014 2015 2016 2017E 2018E 2019E
EBITDA 4 122 4 463 4 122 4 281 4 349 4 503
Cash flow from operation 3778 6641 3244 1 925 3 084 2 899
Cash flow from investment -3 261 -1 784 -1 196 -3 097 -3 455 -4 611
FCFF 517 4 858 2 048 -1 172 -371 -1 712
FCFE 1 124 1 930 -1 549 -77 31 1 463
12
EQUITY RESEARCH – RABA
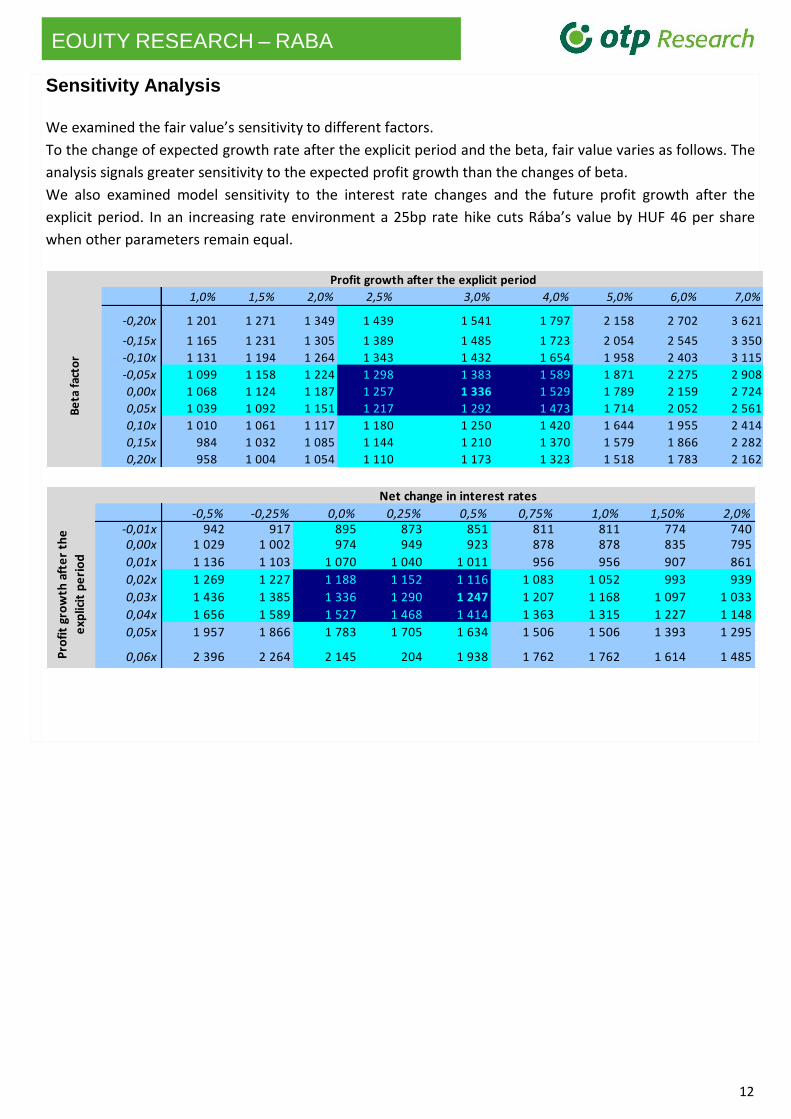
Sensitivity Analysis
We examined the fair value’s sensitivity to different factors.
To the change of expected growth rate after the explicit period and the beta, fair value varies as follows. The
analysis signals greater sensitivity to the expected profit growth than the changes of beta.
We also examined model sensitivity to the interest rate changes and the future profit growth after the
explicit period. In an increasing rate environment a 25bp rate hike cuts Rába’s value by HUF 46 per share
when other parameters remain equal.
0 1,0% 1,5% 2,0% 2,5% 3,0% 4,0% 5,0% 6,0% 7,0%
-0,20x 1 201 1 271 1 349 1 439 1 541 1 797 2 158 2 702 3 621
-0,15x 1 165 1 231 1 305 1 389 1 485 1 723 2 054 2 545 3 350
-0,10x 1 131 1 194 1 264 1 343 1 432 1 654 1 958 2 403 3 115
-0,05x 1 099 1 158 1 224 1 298 1 383 1 589 1 871 2 275 2 908
0,00x 1 068 1 124 1 187 1 257 1 336 1 529 1 789 2 159 2 724
0,05x 1 039 1 092 1 151 1 217 1 292 1 473 1 714 2 052 2 561
0,10x 1 010 1 061 1 117 1 180 1 250 1 420 1 644 1 955 2 414
0,15x 984 1 032 1 085 1 144 1 210 1 370 1 579 1 866 2 282
0,20x 958 1 004 1 054 1 110 1 173 1 323 1 518 1 783 2 162
Be
ta f
acto
r
Profit growth after the explicit period
-0,5% -0,25% 0,0% 0,25% 0,5% 0,75% 1,0% 1,50% 2,0%-0,01x 942 917 895 873 851 811 811 774 7400,00x 1 029 1 002 974 949 923 878 878 835 795
0,01x 1 136 1 103 1 070 1 040 1 011 956 956 907 861
0,02x 1 269 1 227 1 188 1 152 1 116 1 083 1 052 993 939
0,03x 1 436 1 385 1 336 1 290 1 247 1 207 1 168 1 097 1 033
0,04x 1 656 1 589 1 527 1 468 1 414 1 363 1 315 1 227 1 148
0,05x 1 957 1 866 1 783 1 705 1 634 1 506 1 506 1 393 1 295
0,06x 2 396 2 264 2 145 204 1 938 1 762 1 762 1 614 1 485
Net change in interest rates
Pro
fit
gro
wth
aft
er
the
exp
licit
pe
rio
d

13
EQUITY RESEARCH – RABA
History
Rába Járműipari Holding (Rába Automotive Holding Plc) is one of the first modern manufacturing companies
of the Hungarian industrial heritage. It was established in 1896, when the spill-over of the mid-19th century
industrial revolution in Western Europe reached Hungary.
By the end of the 19th century the importance of agriculture declined, while demand for transport and
machinery production emerged. That was the idea behind the establishment of Rába’s predecessor, the
Hungarian Railway Carriage and Machine Works Plc. In terms of the level of mechanisation, the Carriage
Works was a leading edge of the Hungarian industrial production at that time and also remained in the
consecutive decades.
By 1898 the company manufactured 8-10 wagons a day, the number of employees expended to 1,200, from
the initial 200. The company also successfully entered the international markets by delivering urban tram cars,
passenger railway carriages to Western Europe, Africa and India – even the trainsets of the London
underground were manufactured in Győr. At the time of motorisation, the company did not lag behind in the
development automobiles, powered by steam engine first, and soon by combustion. The company registered
officially under the name “Rába” in 1913 manufactured both passenger cars and high-efficiency trucks. This
latter was first made to the army and later adjusted to civilian needs.
Well after WWI, the management set new directions. Ending the production of passenger vehicles, the
construction of quick trucks and buses, engines and agricultural machinery got into the focus. Licence
agreements with prestigious international manufacturers of the time, like Praga, Austro-Fiat and MAN
supported the continuous product development. The years prior to WWII brought the revival of vehicle
manufacturing, mainly to fulfil military orders.
Following WWII, car manufacturing discontinued. Rába, now as a state-owned company, gained a prominent
role in the restoration of transport in Hungary (construction of bridge and iron structures), as well as in the
redemption. From the 1960s vehicle production returned to the production portfolio, both for commercial
transport and military use. Due to the fast and ongoing expansion of the production capacities by 1980, Rába
became one of the biggest manufacturing companies in Hungary with nearly 20,000 employees and seven
production plants nationwide. Axles represented 40% of the production; engine manufacturing had a 30%
stake, while truck and power machinery, along with agricultural machinery made up 7.5% each.
During the Communist era, Rába was an important supplier of the Soviet Union, the COMECON, Yugoslavia
and the Arab world. After the political and economic changes starting in 1989 in Eastern Europe, Rába lost a
significant part of its export markets. It was the time of redesign again. As Rába had a potential in the market
of axles and axle parts, the company set the strategic goal to maintain and improve the competitiveness of
this division even at the expense of other units.
In 1992 Rába became a joint stock company. As a result of the privatisation process, Rába’s shares were listed
on the Budapest Stock Exchange (BSE) on December 17, 1997. In 1999 the company outsourced a substantial
part of its activity and continued its operation as a holding company. In 2001 the engine division was divested
and bus manufacturing was also discontinued.
14
EQUITY RESEARCH – RABA
The global financial crisis took its toll on Rába, just like on other automotive manufacturers. As a Tier1/Tier2
supplier, Rába pulled through the crisis in better shape than other suppliers at the other end of the purchasing
chain.
In 2011 the state-owned Hungarian National Asset Management Inc. (MNV) made a public offering for the
outstanding Rába shares at 815 HUF/share or 30% premium over the then market price. MNV became a
74.35% owner of Rába, while the remaining part is practically free float.

15
EQUITY RESEARCH – RABA
Disclaimer 1.
This research/commentary was prepared by the assignment of the Budapest Stock Exchange Ltd. (registered seat: 1054 Budapest, Szabadság tér 7. Platina torony I. ép. IV. emelet; company registration number: 01-10-044764, hereinafter: BSE) under the agreement that was concluded by and between BSE and OTP Bank Plc (registered seat: H-1051 Budapest, Nádor utca 16., Hungary, company registration number: 01-10-041585, hereinafter: OTP Bank or Investment Service Provider). The BSE shall not be liable for the content of this research/commentary, especially for the accuracy and completeness of the information therein and for the forecasts and conclusions. The Service Provider is entitled to all copyrights regarding this research/commentary however BSE is entitled to use and advertise/disseminate it without amending its content. This research/commentary shall not be qualified as investment advice specified in Point 9 Section 4 (2) of Act No. CXXXVIII of 2007 on Investment Firms and Commodity Dealers and on the Regulations Governing their Activities. Furthermore, this document shall not be qualified as an offer or call to tenders for the purchase, sale or hold of the financial instrument(s) concerned by the research/commentary.
Disclaimer 2.
This document contains investment research, therefore this document is considered an investment recommendation made in accordance with Act CXX of 2001 on the Capital Market (Hungary) relating to financial instruments or the issuers of financial instruments, excluding investment advice. OTP Bank Plc (in Hungarian: OTP Bank Nyrt.) (“OTP Bank”) intends to present this document as an objective and independent explanation of the matters contained therein. OTP Bank produces or arranges the document of investment research - which is intended or likely to be subsequently disseminated to clients of the firm or to the public may suggest - as an objective and independent explanation. This document is prepared in accordance with legal requirements designed to promote the independence of investment research. OTP Bank declares that the financial analysts and the employees participating in the production of the investment research are subject to the conditions set out in Subsection (4) of Section 110 of Act CXXXVIII of 2007 (Hungary). Although the information in this document has been prepared in good faith from sources that OTP Bank reasonably believes to be reliable, we do not represent or warrant its accuracy and such information may be incomplete or condensed. The issuer of this report does not claim that the information presented herein is perfectly accurate or complete. However it is based on sources available to the public and widely believed to be reliable. Also the opinions and estimates presented herein reflect a professional subjective judgment at the original date of publication and are therefore subject to change thereafter without notice. Furthermore there can be no guarantees that any market developments will unfold as forecasted. Opinions and estimates constitute our judgment and are subject to change without notice. This communication is provided for information purposes only and does not represent an offer for sale or any offer to buy or sell any securities, furthermore does not contain a comprehensive analysis of the described issues. This document is not intended to provide the basis for any evaluation of the financial instruments discussed herein. In particular, information in this document regarding any issue of new financial instruments should be regarded as indicative, preliminary and for illustrative purposes only, and evaluation of any such

16
EQUITY RESEARCH – RABA
financial instruments is made solely on the basis of information contained in the relevant offering circular and pricing supplement when available. OTP Bank does not act as a fiduciary for or an advisor to any prospective purchaser of the financial instruments discussed herein and is not responsible for determining the legality or suitability of an investment in the financial instruments by any prospective purchaser. This communication is not intended as investment advice, an offer or solicitation for the purchase or sale of any financial instrument, and it does not constitute legal, tax or accounting advice. This report is issued as investment research and should contain an analysis or any other information relating to financial instruments and/or exchange-traded instruments, and their issuers, but it does not constitute investment advice, legal, tax or accounting advice. Also it is not and should not be considered an investment advice for investment in financial instruments according to Act CXXXVIII of 2007 (Hungary) or Commission Delegated Regulation (EU) 2017/565. Information herein reflects the market situation at the time of writing. It provides only momentary information and may change as market conditions and circumstances develop. Additional information may be available on request. Where a figure relates to a period on or before the date of communication, the figure relates to the past and indicates a historic data. Past performance is not a reliable indicator of future results and shall be not treated as such. OTP Bank makes no representation or warranty, express or implied, is made regarding future performance of any financial instrument mentioned in this communication. OTP Bank shall have no liability for the information contained in this for any loss or damage whether direct, indirect, financial, economic, or consequential, whether or not caused by the negligent act or omission of OTP Bank, provided that such limitation of liability shall not apply to any liability which cannot be excluded or limited under the applicable law. OTP Bank may have issued reports that are different or inconsistent with the information expressed within this report and is under no obligation to update or keep current the information contained herein. Before purchasing or selling financial instruments or engaging investment services, please examine the prospectuses, regulations, terms, agreements, notices, fee letters, and any other relevant documents regarding financial instruments or investment services described herein in order to be capable of making a well-advised investment decision. Please also speak to a competent financial adviser for advice on the risks, fees, taxes, potential losses and any other relevant conditions before you make your investment decision regarding financial instruments or investment services described herein. The financial instruments mentioned in this communication may not be suitable for all types of investors. This communication does not take into account the investment objectives, financial situation or specific needs of any specific client. This communication and any of the financial instruments and information contained herein are not intended for the use of private investors in the UK and US. OTP Bank is not allowed to provide direct investment services to US investors. Any individual decision or investment made based on this publication is made solely at the risk of the client and OTP Bank shall not be held responsible for the success of the investment decisions or for attaining the Client's target. OTP Bank may hold a position or act as market maker in the financial instrument of any issuer discussed herein or act as advisor or lender to such issuer. This report is not intended to influence in any way or to be considered a substitute to research and advice centred on the specific investment objectives and constraints of the recipient (including tax concerns) therefore investors should obtain individual financial advice. OTP Bank in compliance with the applicable law, assumes no responsibility, obligation, warranty or guarantee whatsoever for any direct or indirect damage (including losses arising from investments), or for the costs or expenses, detrimental legal consequences or other sanctions (including punitive and consequential damage) sustained by any natural or legal person as a result of the purchase or sale of financial instruments or

17
EQUITY RESEARCH – RABA
engaging investment services described herein, even if OTP Bank was warned of the possibility of such occurrences. Figures described herein refer to the past and past performance is not a reliable indicator of future results. Investments in financial instruments carry a certain degree of risk (fluctuation of share prices, uncertainty of dividend, yields and / or profits, exchange rate fluctuations, etc.). The capital invested is not guaranteed, investment gains, usually assumed proportionate to risk, and past performance of financial instruments is not a guarantee for future performance. Please note that the Internet is not a secure environment and OTP Bank does not accept any liability for any loss caused by the result of using this report in a form altered or delayed by the wilful or accidental interception, corruption or virus infection. OTP Bank Plc (registered seat: Nádor utca 16., Budapest H-1051, Hungary; authorised by the Hungarian Financial Supervisory Authority (Pénzügyi Szervezetek Állami Felügyelete, (the “PSZÁF”), with PSZÁF licence numbers: III/41.003-22/2002 and E-III/456/2008. Supervisory authority: Magyar Nemzeti Bank (National Bank of Hungary – H-1054 Budapest, Szabadság tér 9.; financial customer services: H-1013 Budapest, Krisztina krt. 39.sz. For more information, please refer to the website: https://www.otpbank.hu). The terms and conditions of this disclaimer shall be governed by and construed in accordance with Hungarian law. If you received this document from OTP Bank Plc, then it was sent to you with your previous consent. You may withdraw this permission by sending an e-mail to [email protected] or writing a letter addressed to "Research Center”, Hungary 1051, Budapest, Nádor utca 21. Please refer to your name and e-mail address in both cases.