hmrc tax & nic receipts - … · cycle, though the recent ... for some revenue streams...
TRANSCRIPT
1
l
Coverage: United Kingdom Theme: The Economy Released: 21st July 2016 Next Release: 19th August 2016 Frequency of release: Published monthly on the 15th working day except if it falls on a Monday, in which case publication would be on the 16th working day Media contact: HMRC Press Office (Individuals) 03000 585020 (Business) 03000 585028 Out-of-hours: 07860 359544 Statistical contacts: Karen Mason Tel: 03000 586203 [email protected] Juliet Clarke Tel: 03000 589402 [email protected] KAI Data, Policy & Coordination HM Revenue and Customs 100 Parliament Street London SW1A 2BQ Website: https://www.gov.uk/government/collections/hm-revenue-customs-receipts
KAI – Knowledge, Analysis & Intelligence
KAI Data Policy and Coordination
HMRC TAX & NIC RECEIPTS
Monthly and annual historical record
2
HM Revenue and Customs Tax and NICs receipts
HM REVENUE AND CUSTOMS TAX AND NICS RECEIPTS ............................................................................................................ 2
INTRODUCTION ............................................................................................................................................................... 3
HMRC tax receipts .......................................................................................................................................................... 3 Table 1 Contributions by tax to total HMRC receipts 1980–2016 (%) ................................................................. 3 Figure 1 Total HMRC Receipts, 1980-2016 ............................................................................................................ 4 Figure 2 Total HMRC Receipts, by category, 1980-2016 ....................................................................................... 5
METHODOLOGY AND DATA QUALITY ................................................................................................................................... 6
Methodology .................................................................................................................................................................. 6 Data quality ..................................................................................................................................................................... 6 www.gov.uk/government/collections/hmrcs-annual-report-and-accounts ............................................................... 6 Payovers to the consolidated fund compared with total receipts ................................................................................. 6
NATIONAL STATISTICS DATASET – HM REVENUE AND CUSTOMS RECEIPTS .................................................................................... 7
COMMENTARY ON RECEIPTS .............................................................................................................................................. 8
AMENDMENTS TO “HM REVENUE AND CUSTOMS TAX AND NICS RECEIPTS” ................................................................................ 8
INCOME TAX, CAPITAL GAINS TAX & NATIONAL INSURANCE CONTRIBUTIONS ............................................................................... 9
Figure 3 Income Tax receipts, 1980-2016 ............................................................................................................. 9 Figure 4 Income Tax receipts ................................................................................................................................ 9
VALUE ADDED TAX (VAT) ................................................................................................................................................11
Figure 5 Value Added Tax receipts, 1980-2016 ................................................................................................... 11 Figure 6 Value Added Tax receipts ...................................................................................................................... 11
CORPORATION TAX, BANK SURCHARGE, BANK LEVY & PETROLEUM REVENUE TAX .......................................................................12
Figure 7 Corporation Tax receipts, 1980-2016 .................................................................................................... 12 Figure 8 Corporation Tax, Bank Levy & Petroleum Revenue Tax receipts ........................................................... 12
STAMP TAXES (INCLUDING ATED) ......................................................................................................................................13
Figure 9 Receipts from Stamp taxes, 1980-2016 ................................................................................................ 13
HYDROCARBON OIL DUTY RECEIPTS .....................................................................................................................................14
Figure 11 Receipts from Hydrocarbon oils, 1980-2016 ......................................................................................... 14 Figure 12 Receipts from Hydrocarbon oils ............................................................................................................ 14
TOBACCO DUTY RECEIPTS .................................................................................................................................................15
Figure 13 Tobacco Duty receipts, 1980-2015 ........................................................................................................ 15 Figure 14 Tobacco Duty receipts ........................................................................................................................... 15
ALCOHOL DUTY RECEIPTS .................................................................................................................................................16
Figure 15 Alcohol Duty receipts, 1980-2016 ......................................................................................................... 16 Figure 16 Alcohol Duty receipts ............................................................................................................................ 16
ENVIRONMENTAL RECEIPTS ..............................................................................................................................................17
Figure 17 Receipts from Environmental taxes, 1980-2016 ................................................................................... 17 Figure 18 Receipts from Environmental taxes ...................................................................................................... 17
AIR PASSENGER DUTY RECEIPTS ........................................................................................................................................18
Figure 19 Air Passenger Duty receipts, 1980-2016 ............................................................................................... 18 Figure 20 Air Passenger Duty receipts .................................................................................................................. 18
INHERITANCE TAX RECEIPTS ..............................................................................................................................................19
Figure 21 Inheritance Tax receipts, 1980-2016 ..................................................................................................... 19 Figure 22 Inheritance Tax receipts ........................................................................................................................ 19
PUBLICATION DATES .......................................................................................................................................................20
3
Introduction
This bulletin only presents information on the taxes collected by HMRC. For complete coverage of all central government tax receipts (including business rates, Vehicle Excise Duty and Television licence) please refer to the Public Sector Finances publication from the Office for National Statistics1. For complete coverage of all UK tax receipts, including those from local government, please refer to the Blue Book publication from the Office for National Statistics2.
HMRC tax receipts
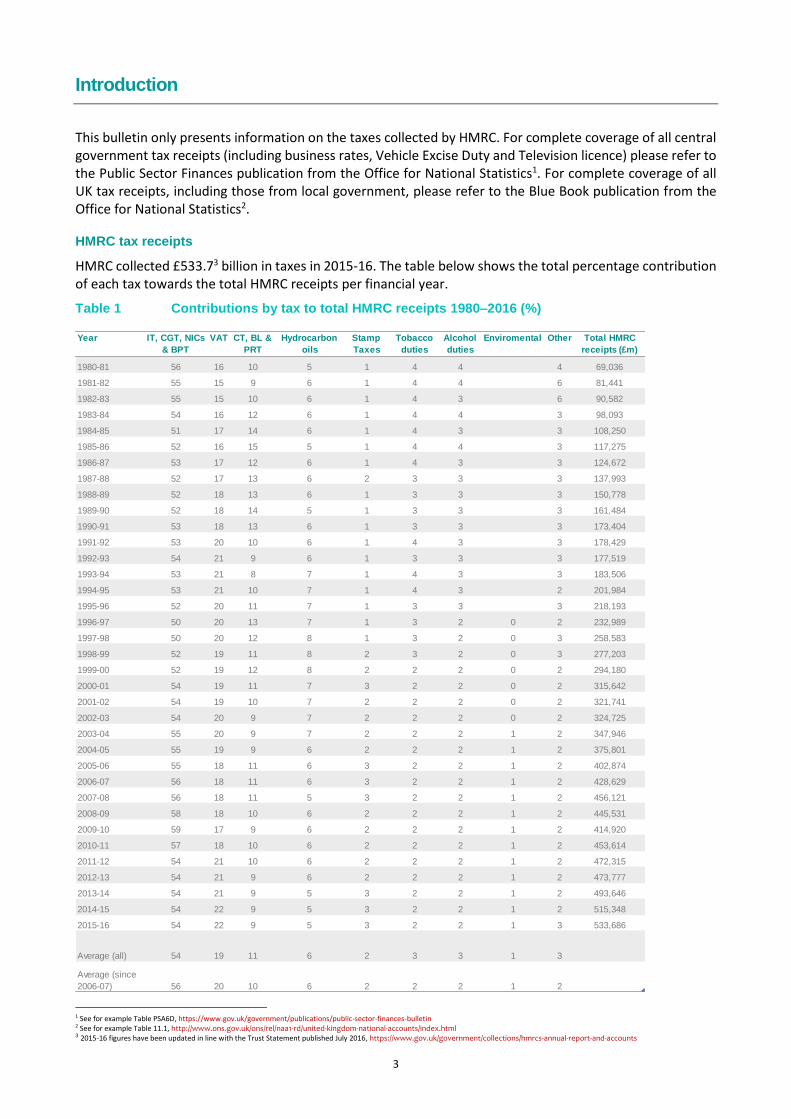
HMRC collected £533.73 billion in taxes in 2015-16. The table below shows the total percentage contribution of each tax towards the total HMRC receipts per financial year.
Table 1 Contributions by tax to total HMRC receipts 1980–2016 (%)
1 See for example Table PSA6D, https://www.gov.uk/government/publications/public-sector-finances-bulletin 2 See for example Table 11.1, http://www.ons.gov.uk/ons/rel/naa1-rd/united-kingdom-national-accounts/index.html 3 2015-16 figures have been updated in line with the Trust Statement published July 2016, https://www.gov.uk/government/collections/hmrcs-annual-report-and-accounts
Year IT, CGT, NICs
& BPT
VAT CT, BL &
PRT
Hydrocarbon
oils
Stamp
Taxes
Tobacco
duties
Alcohol
duties
Enviromental Other Total HMRC
receipts (£m)
1980-81 56 16 10 5 1 4 4 4 69,036
1981-82 55 15 9 6 1 4 4 6 81,441
1982-83 55 15 10 6 1 4 3 6 90,582
1983-84 54 16 12 6 1 4 4 3 98,093
1984-85 51 17 14 6 1 4 3 3 108,250
1985-86 52 16 15 5 1 4 4 3 117,275
1986-87 53 17 12 6 1 4 3 3 124,672
1987-88 52 17 13 6 2 3 3 3 137,993
1988-89 52 18 13 6 1 3 3 3 150,778
1989-90 52 18 14 5 1 3 3 3 161,484
1990-91 53 18 13 6 1 3 3 3 173,404
1991-92 53 20 10 6 1 4 3 3 178,429
1992-93 54 21 9 6 1 3 3 3 177,519
1993-94 53 21 8 7 1 4 3 3 183,506
1994-95 53 21 10 7 1 4 3 2 201,984
1995-96 52 20 11 7 1 3 3 3 218,193
1996-97 50 20 13 7 1 3 2 0 2 232,989
1997-98 50 20 12 8 1 3 2 0 3 258,583
1998-99 52 19 11 8 2 3 2 0 3 277,203
1999-00 52 19 12 8 2 2 2 0 2 294,180
2000-01 54 19 11 7 3 2 2 0 2 315,642
2001-02 54 19 10 7 2 2 2 0 2 321,741
2002-03 54 20 9 7 2 2 2 0 2 324,725
2003-04 55 20 9 7 2 2 2 1 2 347,946
2004-05 55 19 9 6 2 2 2 1 2 375,801
2005-06 55 18 11 6 3 2 2 1 2 402,874
2006-07 56 18 11 6 3 2 2 1 2 428,629
2007-08 56 18 11 5 3 2 2 1 2 456,121
2008-09 58 18 10 6 2 2 2 1 2 445,531
2009-10 59 17 9 6 2 2 2 1 2 414,920
2010-11 57 18 10 6 2 2 2 1 2 453,614
2011-12 54 21 10 6 2 2 2 1 2 472,315
2012-13 54 21 9 6 2 2 2 1 2 473,777
2013-14 54 21 9 5 3 2 2 1 2 493,646
2014-15 54 22 9 5 3 2 2 1 2 515,348
2015-16 54 22 9 5 3 2 2 1 3 533,686
Average (all) 54 19 11 6 2 3 3 1 3
Average (since
2006-07) 56 20 10 6 2 2 2 1 2

4
Over the last decade IT, CGT & NICs (Income tax, Capital Gains Tax and National Insurance Contributions) combined made up on average 56 per cent of total receipts. VAT (Value Added Tax) and Corporation Tax (CT) are the next biggest, contributing an average 20 per cent and 10 per cent of total receipts respectively.
Figure 1 shows annual revenue for total HMRC Receipts, and revenue as a percentage of GDP since 1980-81.
In cash terms, HMRC receipts have grown fairly steadily over the period, but as a percentage of GDP there has been quite a degree of variation. From 1984-85 to 1993-94 the proportion fell from around 30.5% of GDP to around 25.5% of GDP. This was initially due to the economy growing faster than tax receipts and then a drop off in receipts after the economic slowdown of the early 1990s. There was then a sharp rebound to 2000-01 as the proportion rose back to around 30.4%. Since then they have mostly followed the economic cycle, though the recent upturn has been slower than previous recoveries.
Figure 1 Total HMRC Receipts, 1980-2016
25%
26%
27%
28%
29%
30%
31%
£0bn
£100bn
£200bn
£300bn
£400bn
£500bn
£600bn
19
80
-81
19
81
-82
19
82
-83
19
83
-84
19
84
-85
19
85
-86
19
86
-87
19
87
-88
19
88
-89
19
89
-90
19
90
-91
19
91
-92
19
92
-93
19
93
-94
19
94
-95
19
95
-96
19
96
-97
19
97
-98
19
98
-99
19
99
-00
20
00
-01
20
01
-02
20
02
-03
20
03
-04
20
04
-05
20
05
-06
20
06
-07
20
07
-08
20
08
-09
20
09
-10
20
10
-11
20
11
-12
20
12
-13
20
13
-14
20
14
-15
20
15
-16
Total HMRC Receipts
Receipts as a percentage of GDP
5
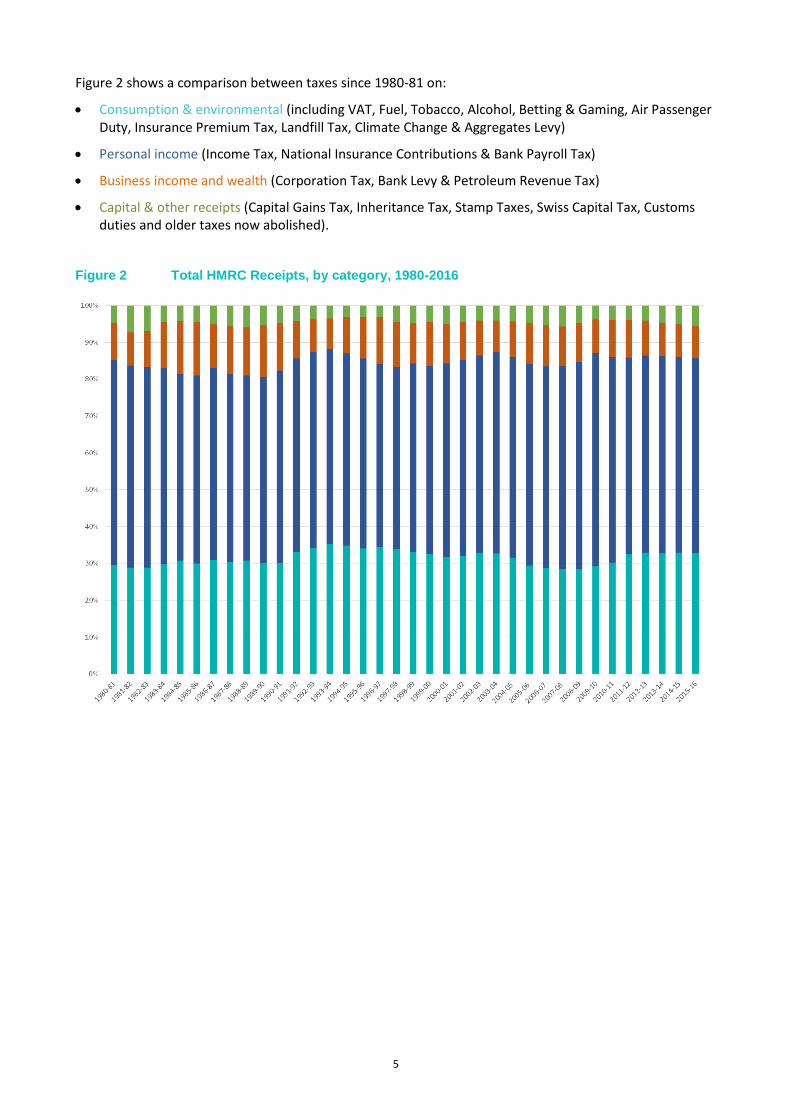
Figure 2 shows a comparison between taxes since 1980-81 on:
Consumption & environmental (including VAT, Fuel, Tobacco, Alcohol, Betting & Gaming, Air Passenger Duty, Insurance Premium Tax, Landfill Tax, Climate Change & Aggregates Levy)
Personal income (Income Tax, National Insurance Contributions & Bank Payroll Tax)
Business income and wealth (Corporation Tax, Bank Levy & Petroleum Revenue Tax)
Capital & other receipts (Capital Gains Tax, Inheritance Tax, Stamp Taxes, Swiss Capital Tax, Customs duties and older taxes now abolished).
Figure 2 Total HMRC Receipts, by category, 1980-2016
6
Methodology and Data Quality
Methodology
HMRC accounts form the basis of these statistics. For some revenue streams adjustments are made to the figures to ensure the definitions align with EuroStat requirements. Adjustments are made to the following taxes:
National Insurance Contributions - adjustments are made to the accounts for amounts paid out in pension contributions and statutory sick/maternity/paternity pay recoveries.
For all other taxes the definitions used in the accounts align with EuroStat requirements so no adjustments are necessary.
Data quality
The HMRC accounts, which are audited by the National Audit Office (NAO), form the basis of these statistics.
The HMRC accounts are published on an accruals basis and differ from these, which are on a cash basis. Following publication of the accounts, our statistics are reviewed against the audited annual accounts and adjustments are made to bring them in line with the cash based account. This month’s publication includes such revisions for 2015-16.
www.gov.uk/government/collections/hmrcs-annual-report-and-accounts
Payovers to the consolidated fund compared with total receipts
The consolidated fund is essentially a general bank account for the Government. The total paid over to the consolidated fund is the value received by HMRC.
Total receipts are the amount recorded on HMRC accounting systems.
The two figures are different due to varying methods of payment and the speed at which HMRC systems are updated. Total HMRC Receipts includes all payments into the Consolidated Fund and all payovers of NICs including those of Northern Ireland.

7
National Statistics dataset – HM Revenue and Customs receipts
This dataset forms the basis of both the cash and accrued receipts in the public sector finances - https://www.gov.uk/government/publications/public-sector-finances-bulletin
There is an Excel version of this table also available on our website with historical monthly data back to April 2008.
Amounts: £ million
Year Total
Paid
Over 1
Total HMRC
receipts 2,3,10
Total
Income
Tax 4
Of which:
PAYE
Income Tax**
Of which:
SA Income
Tax**
Capital
Gains
Tax
NICs VAT Total
Corporation
Tax 5
Of which
offshore** 6
Bank
Levy
Bank
payroll
tax
Petroleum
Revenue
Tax
Fuel duties IHT 7 Shares Stamp
Duty
Land Tax
Annual Tax
on Enveloped
Dw ellings
Tobacco
duties
Spirits
duties
Beer
duties
Wines
duties
Cider
duties
Betting &
Gaming
Air
Passenger
Duty
Insurance
Premium
Tax
Landfill
Tax
Climate
Change
Levy8
Aggregates
Levy
Sw iss
Capital
Tax
Misc Customs
Duties
Child and
Working Tax
Credits
Corporation
Tax Credits11
Child Benefit
Payments 9
MIZX BKMR LISB BKLO ABLP EYOO N445 JT2R ACCJ ACDD ACCH BKST BKSU ACDE ACDF ACDG ACDH ACDI ACDJ ACDP ACDO DOLC LSNS MDUP ADET
2006-07 406,337 428,629 147,712 124,799 20,306 3,830 87,274 77,360 44,875 6,709 2,155 23,585 3,545 3,757 9,635 8,149 2,256 3,072 2,385 200 1,391 971 2,314 804 712 321 1 2,325 18,684 715 10,156
2007-08 431,800 456,121 151,738 126,760 22,443 5,268 100,410 80,599 47,036 5,728 1,680 24,905 3,824 4,167 9,958 8,094 2,374 3,067 2,641 220 1,481 1,994 2,306 877 688 339 0 2,456 20,030 918 10,603
2008-09 416,512 445,531 153,442 128,470 22,531 7,852 96,882 78,439 43,927 9,826 2,567 24,615 2,839 3,203 4,796 8,219 2,358 3,127 2,741 244 1,474 1,862 2,281 954 716 334 0 2,659 24,099 1,181 11,262
2009-10 382,331 414,920 144,881 122,584 21,708 2,491 95,517 70,160 36,628 4,998 923 26,197 2,384 3,017 4,886 8,813 2,570 3,182 2,949 311 1,439 1,856 2,259 842 695 275 0 2,646 27,601 1,147 11,824
2010-11 419,580 453,614 153,491 132,263 22,108 3,601 96,548 83,502 43,040 6,864 3,416 1,458 27,256 2,717 2,971 5,961 9,144 2,675 3,296 3,101 324 1,533 2,155 2,400 1,065 674 288 0 2,998 28,879 1,313 12,160
2011-12 437,603 472,315 150,939 132,189 20,334 4,337 101,617 98,292 43,130 8,840 1,612 -2 2,032 26,800 2,903 2,794 6,125 9,551 2,889 3,463 3,356 329 1,633 2,607 2,941 1,090 676 290 0 0 2,912 29,830 1,399 12,177
2012-13 437,357 473,777 152,030 132,433 20,550 3,927 102,037 100,572 40,482 4,412 1,595 0 1,737 26,571 3,105 2,234 6,907 9,681 2,931 3,426 3,537 326 1,680 2,791 3,021 1,092 635 265 342 0 2,854 29,888 1,471 12,167
2013-14 456,500 493,646 156,898 134,686 20,854 3,908 107,690 104,718 40,327 3,556 2,200 0 1,118 26,881 3,402 3,108 9,273 100 9,531 3,056 3,346 3,713 340 2,098 3,013 3,014 1,189 1,068 285 466 0 2,901 29,710 1,582 11,438
2014-15 476,633 515,348 163,109 139,506 23,645 5,559 110,406 111,363 43,005 2,073 2,748 0 77 27,156 3,804 2,926 10,738 116 9,548 3,023 3,310 3,837 320 2,116 3,175 2,965 1,144 1,491 342 66 0 3,007 29,732 2,033 11,582
2015-1612 494,864 533,686 168,451 145,652 24,327 7,060 113,701 115,415 44,410 538 3,392 0 -562 27,623 4,650 3,320 10,682 178 9,485 3,147 3,271 3,973 296 2,666 3,077 3,293 919 1,763 356 32 0 3,089 28,539 2,334 11,681
Apr-14 46,696 50,002 15,344 14,822 103 2 10,001 11,192 5,181 - 485 0 83 2,303 362 233 872 40 1,751 271 257 371 28 191 232 184 184 115 35 58 0 228 2,654 n/a 1,023
May-14 33,140 36,299 10,754 11,463 -128 5 8,212 9,426 1,587 - - 0 70 2,231 296 363 828 51 229 178 300 255 28 220 255 512 53 201 21 0 0 224 2,453 n/a 980
Jun-14 29,219 32,757 10,467 10,859 -113 6 8,376 6,347 1,590 - - 0 80 2,317 288 219 898 6 576 218 333 302 33 136 267 30 16 2 16 1 0 234 2,442 n/a 904
Jul-14 50,178 54,263 18,499 11,610 6,666 5 10,630 11,076 6,599 - 734 0 -52 2,245 324 235 1,091 3 667 241 289 298 29 210 270 209 224 153 47 1 0 237 2,882 n/a 1,006
Aug-14 37,064 39,574 11,903 10,868 1,349 2 8,726 9,975 1,585 - - 0 -13 2,375 336 256 994 2 933 218 295 324 33 196 301 544 64 241 25 1 0 256 2,286 n/a 1,007
Sep-14 30,805 33,643 10,647 10,900 48 3 8,768 5,834 2,232 860 - 0 82 2,238 343 151 1,074 2 657 212 271 304 26 137 334 20 21 12 18 1 0 258 2,410 n/a 919
Oct-14 43,878 46,850 11,511 10,865 -50 2 8,750 11,238 7,388 - 783 0 54 2,271 335 319 965 2 940 277 259 315 26 242 294 207 222 122 49 0 0 281 2,510 n/a 970
Nov-14 34,530 37,704 10,521 10,654 -84 4 8,467 9,991 1,349 - - 0 66 2,374 309 192 893 2 835 376 287 392 27 217 283 518 67 222 25 0 0 285 2,209 n/a 937
Dec-14 32,627 36,656 11,310 10,844 495 -2 8,849 6,601 3,462 657 - 0 85 2,322 338 225 1,016 2 589 410 298 448 27 121 229 23 17 6 20 4 0 257 2,748 n/a 974
Jan-15 62,655 67,005 24,671 11,876 12,213 4,258 10,563 12,155 8,368 - 747 0 -201 2,064 273 247 717 1 994 240 305 326 21 153 254 186 200 175 46 0 0 244 2,221 n/a 983
Feb-15 41,295 42,911 14,170 11,699 2,819 1,101 9,414 10,238 1,685 - - 0 39 2,297 306 236 666 1 600 175 186 240 18 213 234 516 63 236 24 0 0 254 2,263 n/a 898
Mar-15 34,546 37,684 13,311 13,046 326 172 9,652 7,291 1,978 556 - 0 -216 2,119 292 249 724 4 778 205 230 261 25 82 223 18 14 6 17 0 0 251 2,656 n/a 981
Apr-1512 48,302 51,511 15,237 14,762 -90 2 11,122 10,921 6,117 - 587 0 19 2,300 379 274 792 77 1,453 251 279 332 25 174 261 195 166 223 42 28 0 258 2,436 n/a 967
May-1512 34,276 37,656 11,521 12,162 -219 4 8,472 9,492 1,545 - - 0 18 2,301 364 367 753 58 237 220 292 324 28 364 232 517 53 241 27 0 0 226 2,299 n/a 1,004
Jun-1512 31,365 34,351 11,517 12,094 -51 2 8,821 6,462 1,797 - - 0 -103 2,341 426 176 800 7 572 239 283 308 27 116 260 24 14 12 19 0 0 232 2,497 n/a 954
Jul-1512 51,861 56,979 19,510 12,124 7,586 4 10,798 11,517 6,941 - 998 0 -136 2,322 445 280 1,075 5 757 270 296 329 27 352 274 221 172 210 50 1 0 260 2,761 n/a 1,009
Aug-1512 37,655 39,689 11,872 11,584 629 2 8,877 10,020 1,368 - - 0 -47 2,360 371 248 885 4 1,217 222 304 337 29 201 304 556 59 207 27 0 0 265 2,241 n/a 939
Sep-1512 32,468 35,613 11,396 11,704 20 4 8,912 6,921 2,524 258 - 0 7 2,278 360 210 960 4 467 229 275 305 26 111 303 25 9 4 14 0 0 267 2,336 n/a 1,032
Oct-1512 44,790 48,114 11,857 11,387 -72 21 8,933 11,883 7,314 - 964 0 20 2,324 444 270 902 8 846 274 269 313 26 283 271 200 175 181 49 0 0 287 2,334 n/a 1,160
Nov-1512 36,284 40,003 11,171 11,394 -30 9 8,653 10,905 1,761 - - 0 30 2,383 369 214 908 5 840 378 269 400 27 261 293 562 58 193 27 0 0 289 2,245 n/a 745
Dec-1512 33,938 36,772 11,545 11,440 625 3 8,913 6,392 3,533 120 - 0 18 2,327 354 253 1,095 1 508 414 297 475 27 106 211 23 4 4 19 0 0 251 2,683 n/a 969
Jan-1612 64,015 68,572 24,875 12,113 12,447 5,397 10,511 12,539 7,740 - 843 0 -80 2,140 315 298 804 2 915 246 314 330 22 280 253 222 152 169 46 3 0 237 2,033 n/a 992
Feb-1612 44,780 45,964 15,278 12,307 3,150 1,371 9,726 10,876 1,886 - - 0 -269 2,279 435 495 801 1 634 156 164 235 14 320 200 719 49 312 22 0 0 260 2,272 n/a 916
Mar-1612 35,129 38,462 12,672 12,581 333 241 9,965 7,488 1,882 160 - 0 -39 2,267 388 238 906 5 1,039 247 229 284 17 100 215 30 8 8 15 0 0 258 2,401 n/a 994
Apr-16* 48,486 51,853 16,086 15,627 -112 8 10,676 11,087 5,796 - 554 0 -15 2,366 418 246 1,172 88 1,074 239 286 346 26 265 224 239 144 237 40 0 0 252 2,476 n/a 1,034
May-16* 37,767 40,992 11,947 12,542 -176 2 9,306 10,957 1,940 - - 0 -3 2,314 392 241 713 51 269 235 290 301 25 308 257 883 46 253 22 0 0 243 2,335 n/a 916
Jun-16* 32,669 35,465 11,433 11,926 -20 0 9,882 6,058 1,879 - - 0 -1 2,425 433 278 816 10 625 277 320 343 29 85 262 36 9 -3 20 0 0 248 2,382 n/a 970
1 Comprises of payments into the Consolidated Fund and all payovers of NICs excluding those of Northern Ireland.
4 Gross of tax credits and includes other smaller elements of income tax.5 Receipts gross of all tax credits. As of November 2014 Bank Levy receipts are show n seperately and no longer included w ithin the CT total.6 The majority of UK Oil & Gas companies payments are due in three instalments, (Jul, Oct and Jan): receipts are reported in a similar pattern follow ing each instalment.
9 From April 2011, the Child Benefit series has been revised to ensure consistency w ith HMRC Resource Accounts.10 Total of columns D, G to J, and L to AG11 Monthly Data unavailable.
* Provisional
** Figures in italic are included w ith the relevant total for either income tax or corporation tax
12 2015-16 f igures have been updated in line w ith the Trust Statement published July 2016.
2 Total HMRC Receipts includes payments into the Consolidated Fund and all payovers of NICs including those of Northern Ireland. Receipts are gross of Tax Credits (Expenditure): this follow s the changes generated by revisions to the European System of Accounts (ESA2010) and the Public Sector Finances Review . 3 Consistent w ith the OBR defintiion published in the supplementary f iscal table 2.8 i.e. on a cash basis.
7 Excludes non cash elements w hich are show n in the table Inheritance Tax: Analysis of Receipts8 From April 2013, includes receipts from Carbon Price Floor.

8
Commentary on Receipts
The following pages include commentary for the main taxes on the total receipts over the last five years and as a proportion of nominal GDP and also the year to date receipts compared against the same period last year. GDP for 2014-15 is the most recent forecast from the Office for Budget Responsibility (OBR).
Statistics and analysis of HMRC receipts disaggregated between England, Wales, Scotland and Northern Ireland can be found at https://www.gov.uk/government/statistics/disaggregation-of-hmrc-tax-receipts
Our publications have moved to the GOV.UK site where you can also find publications by other Government bodies.
https://www.gov.uk/
If you wish to see more statistics on your area of interest there are also links at the bottom of each page which will take you to that area on our website. Or if you wish to view all of HMRC taxes areas go to the main menu:
https://www.gov.uk/government/organisations/hm-revenue-customs/about/statistics
Our publications are mainly used for media commentary, policy development and research. A recent survey was completed on our publications, which can be accessed via the link below.
https://www.gov.uk/government/publications/hmrc-tax-nics-receipts-survey-results
Archived tables can be found here: https://www.gov.uk/government/collections/hm-revenue-customs-receipts
Amendments to “HM Revenue and Customs Tax and NICs receipts”
Reason for Revisions
The June monthly release contains figures that replace incorrect certain incorrect figures included in specific previous editions.
The May 2016 release was published at 9.30am on 24th May 2016 containing incorrect tax credit figures relating to the monthly data from April 2015 to March 2016. This was corrected in a revised version of the May release issued shortly afterwards.
The March and April 2016 releases were published containing incorrect Corporation Tax figures relating to 2002-03 to 2013-14. These have been corrected.
The releases for May and June 2015 published in June and July 2015 contained incorrect tax credit figures relating to monthly data from April 2014 to April/ May 2015. These figures were corrected in a revised version of the June 2015 release. (See: https://www.gov.uk/government/statistics/hmrc-tax-and-nics-receipts-for-the-uk#history)
In May/ June 2016, a full review of the production and quality assurance process of this publication was performed internally and improvements to the production process implemented. A National Statistics breach report covering these errors has been published on the web page for this release.
In case of any queries about these revisions please contact the statistical contacts named on the cover of this report.

9
Income Tax, Capital Gains Tax & National Insurance Contributions
The graph below shows annual revenue and revenue as a percentage of GDP since 1980-81. Receipts in 2015-16 have continued to increase following the economic slowdown in 2009-10. In 2015-16 receipts as a proportion of the OBR’s forecast GDP level were 15.4 per cent compared to 17.2 per cent in 2008-09; this fall can be mostly attributed to the reduction in economic activity and some structural changes such as above-inflation increases in the personal allowance. Revenues in 2010-11 also include Bank Payroll Tax receipts.
Figure 3 Income Tax receipts, 1980-2016
Monthly receipts in the current and 4 previous years are shown below. The peaks in July and January reflect the bi-annual due dates for self-assessment (SA) (31st Jan, 31st Jul). January to April typically also capture PAYE bonus-related receipts, particularly from the financial sector. Receipts for April to June 2016 are 4.0 per cent higher when compared to the same period last year. Part of this increase is due to ceasing of contracting out leading to increased NIC1 receipts.
Figure 4 Income Tax receipts
For more statistics about income tax receipts and liabilities (on an annual basis) click here to go to the income tax and personal incomes section of our website.

10

11
Value added tax (VAT)
The graph below shows annual revenue and revenue as a percentage of GDP since 1980-81. Receipts are now at a peak of £115.1 billion up from £70.2bn in 2009-10. The fall in 2009-10 and then the subsequent upturn can be explained by the reduction in the standard rate of VAT to 15 per cent in December 2008 then increasing to 17.5 per cent in January 2010, and to 20 per cent in January 2011. Receipts as a percentage of nominal GDP have increased from 4.7 per cent in 2009-10 to 6.0 per cent in 2011-12 reflecting changes in the VAT rate. In 2015-16 receipts as a proportion of the OBR’s forecast GDP level are 6.1 per cent.
Figure 5 Value Added Tax receipts, 1980-2016
Monthly receipts in the current and 4 previous years are shown below. Most VAT receipts are paid quarterly hence the large figures in particular months. Many traders opt to pay in April, July, October and January (stagger 1) as it corresponds with the end of the financial and calendar year. Receipts for April to June 2016 are 4.6 per cent higher than in the same period last year.
Figure 6 Value Added Tax receipts
For more information on VAT receipts, click here to go to the business taxes section of our website.
12
Corporation Tax, Bank Surcharge, Bank Levy & Petroleum Revenue Tax
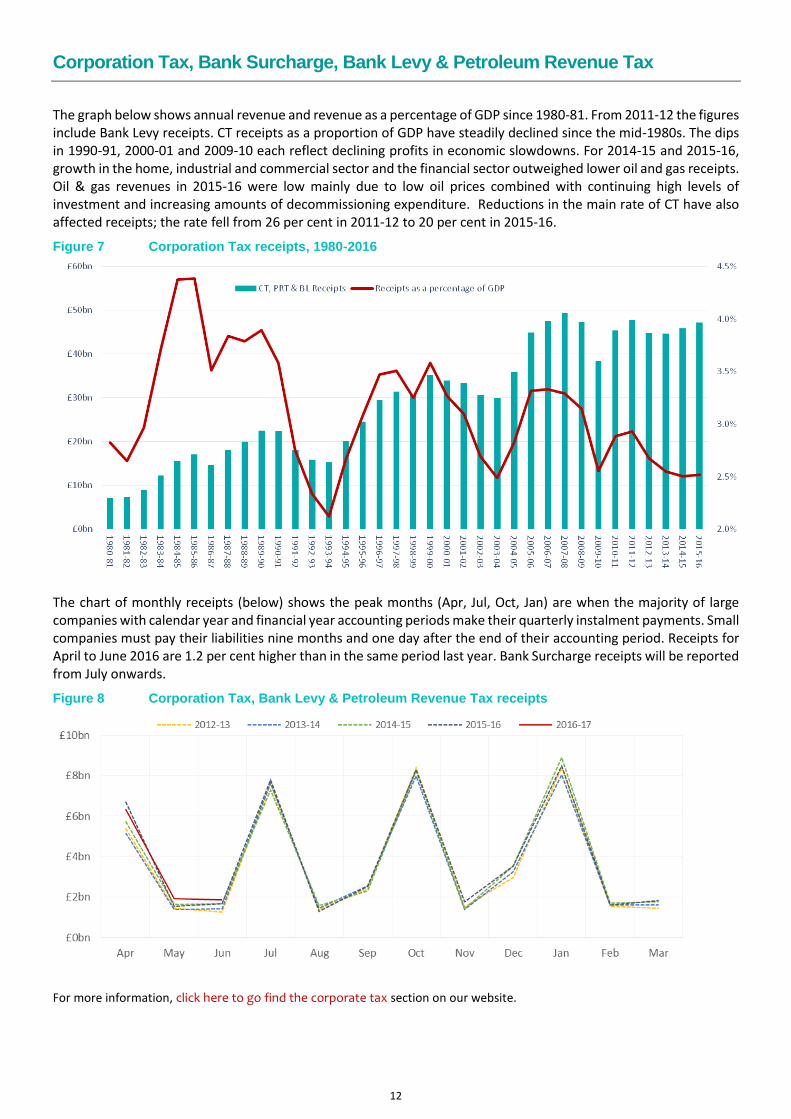
The graph below shows annual revenue and revenue as a percentage of GDP since 1980-81. From 2011-12 the figures include Bank Levy receipts. CT receipts as a proportion of GDP have steadily declined since the mid-1980s. The dips in 1990-91, 2000-01 and 2009-10 each reflect declining profits in economic slowdowns. For 2014-15 and 2015-16, growth in the home, industrial and commercial sector and the financial sector outweighed lower oil and gas receipts. Oil & gas revenues in 2015-16 were low mainly due to low oil prices combined with continuing high levels of investment and increasing amounts of decommissioning expenditure. Reductions in the main rate of CT have also affected receipts; the rate fell from 26 per cent in 2011-12 to 20 per cent in 2015-16.
Figure 7 Corporation Tax receipts, 1980-2016
The chart of monthly receipts (below) shows the peak months (Apr, Jul, Oct, Jan) are when the majority of large companies with calendar year and financial year accounting periods make their quarterly instalment payments. Small companies must pay their liabilities nine months and one day after the end of their accounting period. Receipts for April to June 2016 are 1.2 per cent higher than in the same period last year. Bank Surcharge receipts will be reported from July onwards.
Figure 8 Corporation Tax, Bank Levy & Petroleum Revenue Tax receipts
For more information, click here to go find the corporate tax section on our website.
13
Stamp taxes (including ATED)
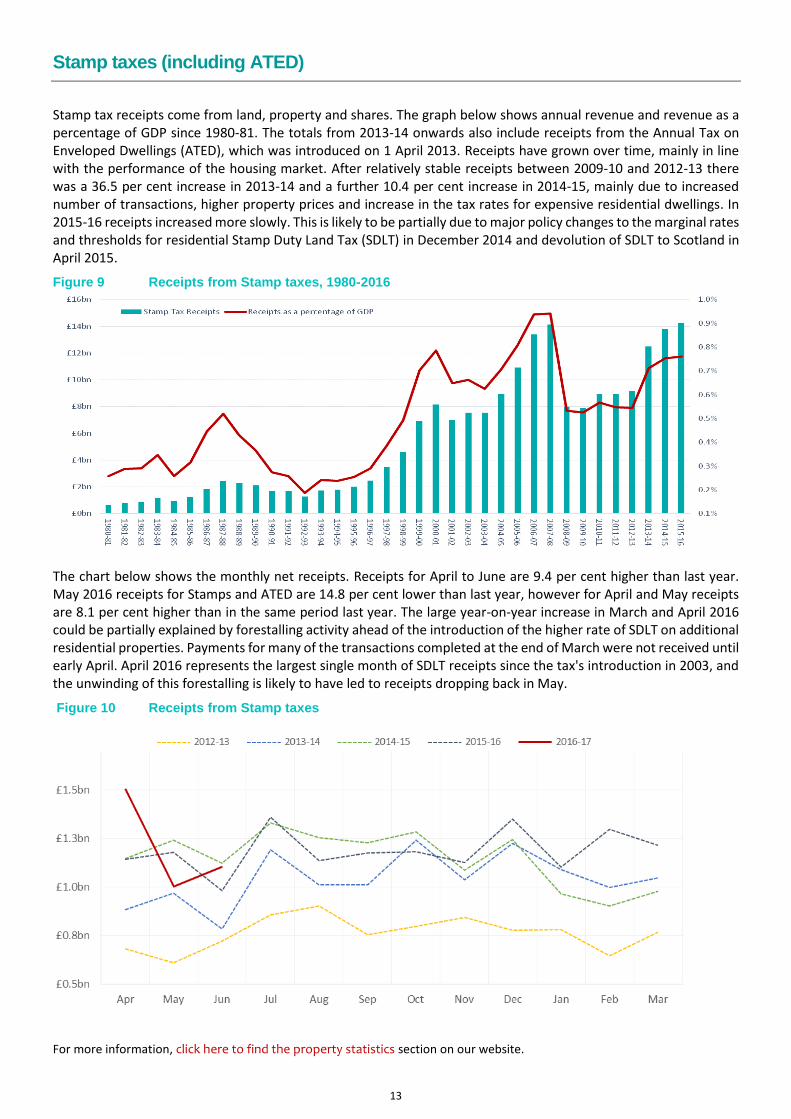
Stamp tax receipts come from land, property and shares. The graph below shows annual revenue and revenue as a percentage of GDP since 1980-81. The totals from 2013-14 onwards also include receipts from the Annual Tax on Enveloped Dwellings (ATED), which was introduced on 1 April 2013. Receipts have grown over time, mainly in line with the performance of the housing market. After relatively stable receipts between 2009-10 and 2012-13 there was a 36.5 per cent increase in 2013-14 and a further 10.4 per cent increase in 2014-15, mainly due to increased number of transactions, higher property prices and increase in the tax rates for expensive residential dwellings. In 2015-16 receipts increased more slowly. This is likely to be partially due to major policy changes to the marginal rates and thresholds for residential Stamp Duty Land Tax (SDLT) in December 2014 and devolution of SDLT to Scotland in April 2015.
Figure 9 Receipts from Stamp taxes, 1980-2016
The chart below shows the monthly net receipts. Receipts for April to June are 9.4 per cent higher than last year. May 2016 receipts for Stamps and ATED are 14.8 per cent lower than last year, however for April and May receipts are 8.1 per cent higher than in the same period last year. The large year-on-year increase in March and April 2016 could be partially explained by forestalling activity ahead of the introduction of the higher rate of SDLT on additional residential properties. Payments for many of the transactions completed at the end of March were not received until early April. April 2016 represents the largest single month of SDLT receipts since the tax's introduction in 2003, and the unwinding of this forestalling is likely to have led to receipts dropping back in May.
Figure 10 Receipts from Stamp taxes
For more information, click here to find the property statistics section on our website.
14
Hydrocarbon oil duty receipts
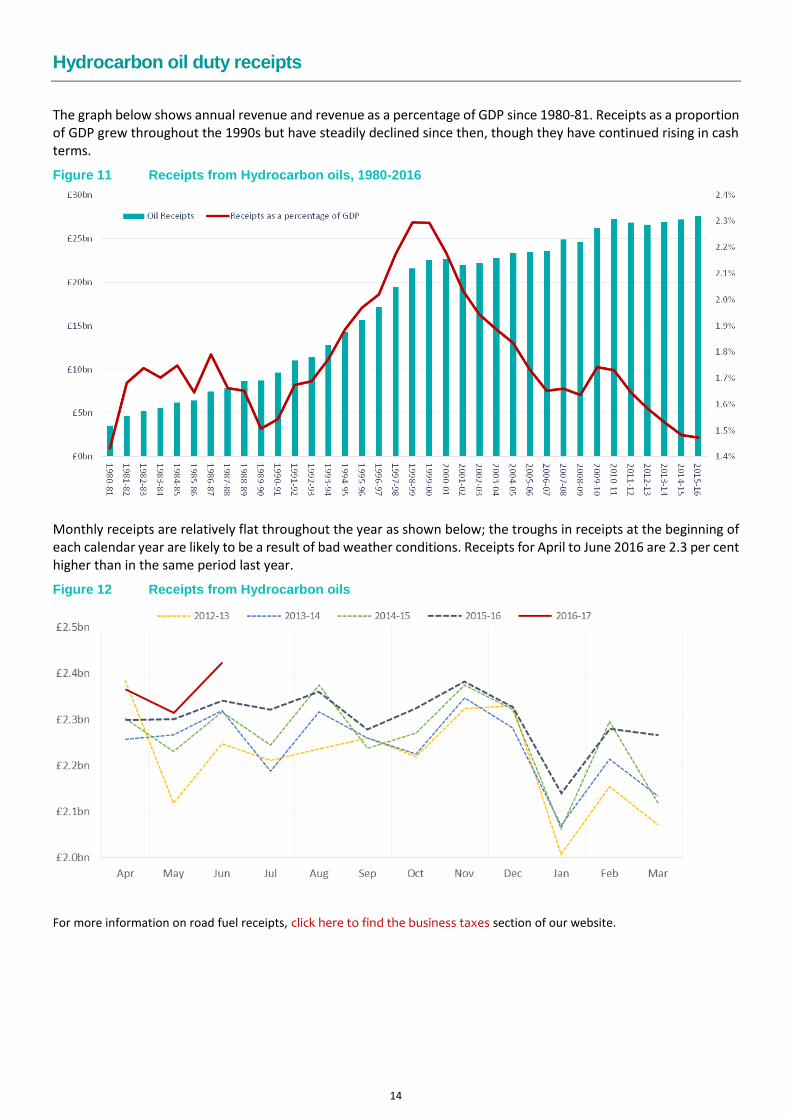
The graph below shows annual revenue and revenue as a percentage of GDP since 1980-81. Receipts as a proportion of GDP grew throughout the 1990s but have steadily declined since then, though they have continued rising in cash terms.
Figure 11 Receipts from Hydrocarbon oils, 1980-2016
Monthly receipts are relatively flat throughout the year as shown below; the troughs in receipts at the beginning of each calendar year are likely to be a result of bad weather conditions. Receipts for April to June 2016 are 2.3 per cent higher than in the same period last year.
Figure 12 Receipts from Hydrocarbon oils
For more information on road fuel receipts, click here to find the business taxes section of our website.
15
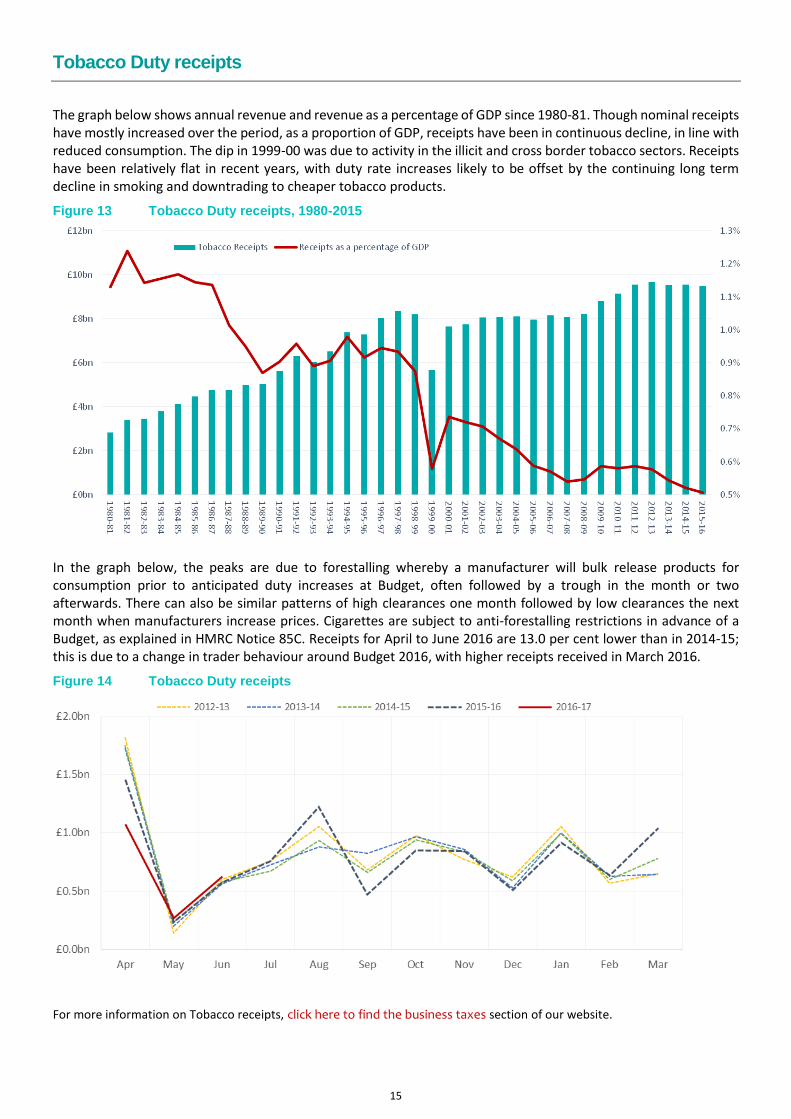
Tobacco Duty receipts
The graph below shows annual revenue and revenue as a percentage of GDP since 1980-81. Though nominal receipts have mostly increased over the period, as a proportion of GDP, receipts have been in continuous decline, in line with reduced consumption. The dip in 1999-00 was due to activity in the illicit and cross border tobacco sectors. Receipts have been relatively flat in recent years, with duty rate increases likely to be offset by the continuing long term decline in smoking and downtrading to cheaper tobacco products.
Figure 13 Tobacco Duty receipts, 1980-2015
In the graph below, the peaks are due to forestalling whereby a manufacturer will bulk release products for consumption prior to anticipated duty increases at Budget, often followed by a trough in the month or two afterwards. There can also be similar patterns of high clearances one month followed by low clearances the next month when manufacturers increase prices. Cigarettes are subject to anti-forestalling restrictions in advance of a Budget, as explained in HMRC Notice 85C. Receipts for April to June 2016 are 13.0 per cent lower than in 2014-15; this is due to a change in trader behaviour around Budget 2016, with higher receipts received in March 2016.
Figure 14 Tobacco Duty receipts
For more information on Tobacco receipts, click here to find the business taxes section of our website.
16
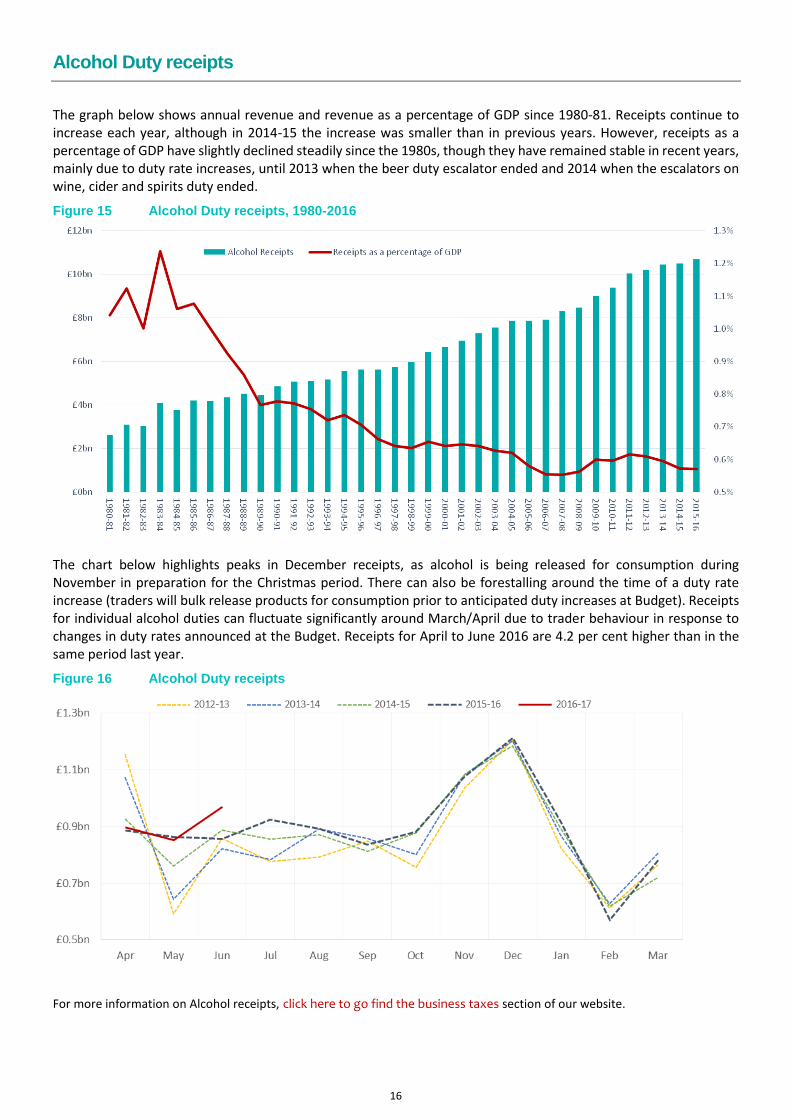
Alcohol Duty receipts
The graph below shows annual revenue and revenue as a percentage of GDP since 1980-81. Receipts continue to increase each year, although in 2014-15 the increase was smaller than in previous years. However, receipts as a percentage of GDP have slightly declined steadily since the 1980s, though they have remained stable in recent years, mainly due to duty rate increases, until 2013 when the beer duty escalator ended and 2014 when the escalators on wine, cider and spirits duty ended.
Figure 15 Alcohol Duty receipts, 1980-2016
The chart below highlights peaks in December receipts, as alcohol is being released for consumption during November in preparation for the Christmas period. There can also be forestalling around the time of a duty rate increase (traders will bulk release products for consumption prior to anticipated duty increases at Budget). Receipts for individual alcohol duties can fluctuate significantly around March/April due to trader behaviour in response to changes in duty rates announced at the Budget. Receipts for April to June 2016 are 4.2 per cent higher than in the same period last year.
Figure 16 Alcohol Duty receipts
For more information on Alcohol receipts, click here to go find the business taxes section of our website.
17
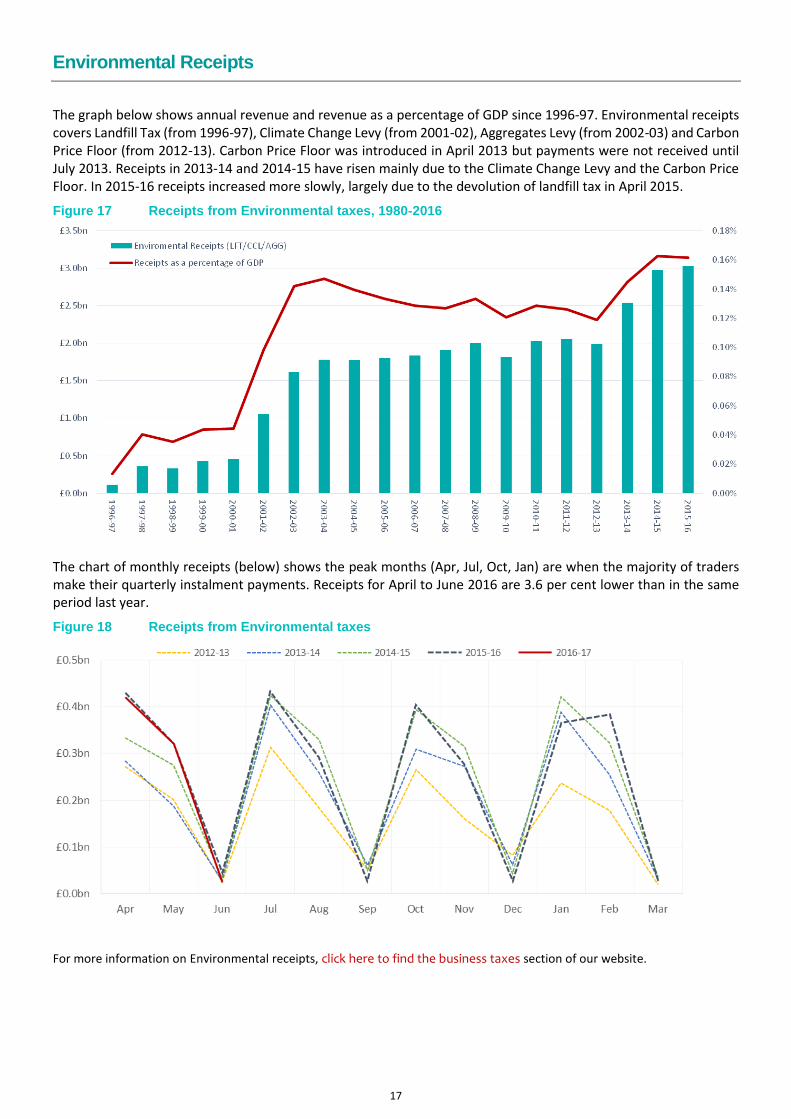
Environmental Receipts
The graph below shows annual revenue and revenue as a percentage of GDP since 1996-97. Environmental receipts covers Landfill Tax (from 1996-97), Climate Change Levy (from 2001-02), Aggregates Levy (from 2002-03) and Carbon Price Floor (from 2012-13). Carbon Price Floor was introduced in April 2013 but payments were not received until July 2013. Receipts in 2013-14 and 2014-15 have risen mainly due to the Climate Change Levy and the Carbon Price Floor. In 2015-16 receipts increased more slowly, largely due to the devolution of landfill tax in April 2015.
Figure 17 Receipts from Environmental taxes, 1980-2016
The chart of monthly receipts (below) shows the peak months (Apr, Jul, Oct, Jan) are when the majority of traders make their quarterly instalment payments. Receipts for April to June 2016 are 3.6 per cent lower than in the same period last year.
Figure 18 Receipts from Environmental taxes
For more information on Environmental receipts, click here to find the business taxes section of our website.

18
Air Passenger Duty Receipts
The graph below shows annual revenue and revenue as a percentage of GDP since the introduction of Air Passenger Duty in 1994-95. The sharp rises in receipts in 1998-99, 2007-08 and from 2010-11 onwards, and the decrease in 2015-16 have all been related to policy changes including rate, exemption and banding changes. Receipts as a proportion of GDP have generally followed nominal receipts.
Figure 19 Air Passenger Duty receipts, 1980-2016
The chart below shows monthly receipts throughout the year. Receipts tend to rise in summer months and fall during winter, other than an upturn in January receipts, reflecting increased travel during December. Receipts for April to June 2016 are 1.4 per cent lower than in the same period last year.
Figure 20 Air Passenger Duty receipts
For more information on APD receipts, click here to find the business taxes section of our website.

19
Inheritance Tax Receipts
The graph below shows annual revenue and revenue as a percentage of GDP since 1980-81. Receipts rose steadily until 2007-08 due to increases in the value of tax-liable assets in this period, particularly in the value of residential property. Receipts then fell sharply due to both the introduction of the Transferable Nil Rate Band for deaths occurring from October 2007 and a fall in the value of residential property in the second half of 2008 and in most of 2009. Since 2009-10, receipts have increased both in terms of annual revenue and as a proportion of GDP.
Figure 21 Inheritance Tax receipts, 1980-2016
The chart below shows monthly receipts throughout the year. Receipts for April to June 2016 are 6.4 per cent higher than in the same period last year. This is due to increases in the values of assets left in estates over time and, to a lesser extent, the number of deaths between December 2014 and March 2015 was significantly higher than in the same period in previous years: there is a lag between time of death and receipts from estates being realised.
Figure 22 Inheritance Tax receipts
For more information on IHT receipts, click here to find the personal taxes section of our website.

20
Publication Dates
2016
22 Jan
19 Feb
22 Mar
21 Apr
24 May
21 Jun
21 Jul
19 Aug
21 Sep
21 Oct
22 Nov
21 Dec
2017
24 Jan
21 Feb
21 Mar
25 Apr
23 May
21 Jun
21 Jul
22 Aug
21 Sep
20 Oct
21 Nov
21 Dec
This is a National Statistics Publication
National Statistics are produced to high professional standards set out in the Code of Practice for Official Statistics. They undergo regular quality assurance reviews to ensure that they meet customer needs and are free from any political interference.
For general enquiries about National Statistics contact the National Statistics Public Enquiry Service. You can also find National Statistics on the internet at www.statistics.gov.uk.
Telephone: 0845 601 3034 Overseas: +44 (1633) 653 599 Minicom: 01633 812399 Email: [email protected] Fax: 01633 652747 Letters: Customer Contact Centre, Room 1.015, Cardiff Road, Newport, NP10 8XG