hla-dr+ cd38+ cd4+ t lymphocytes have elevated …jvi.asm.org/content/85/19/10189.full.pdf ·...
TRANSCRIPT
JOURNAL OF VIROLOGY, Oct. 2011, p. 10189–10200 Vol. 85, No. 190022-538X/11/$12.00 doi:10.1128/JVI.02529-10Copyright © 2011, American Society for Microbiology. All Rights Reserved.
HLA-DR� CD38� CD4� T Lymphocytes Have Elevated CCR5Expression and Produce the Majority of R5-Tropic
HIV-1 RNA In Vivo�
Amie L. Meditz,1 Michelle K. Haas,1† Joy M. Folkvord,1 Kelsey Melander,1 Russ Young,1Martin McCarter,2 Samantha MaWhinney,3 Thomas B. Campbell,1 Yolanda Lie,4
Eoin Coakley,4‡ David N. Levy,5 and Elizabeth Connick1*Division of Infectious Diseases, Department of Medicine, University of Colorado Denver, Aurora, Colorado1; Department of
Surgery, University of Colorado Denver, Aurora, Colorado2; Department of Biostatistics and Informatics, University ofColorado Denver, Aurora, Colorado3; Monogram Biosciences, South San Francisco, California4; and
New York University, College of Dentistry, New York, New York5
Received 3 December 2010/Accepted 13 July 2011
Percentages of activated T cells correlate with HIV-1 disease progression, but the underlying mechanismsare not fully understood. We hypothesized that HLA-DR� CD38� (DR� 38�) CD4� T cells produce themajority of HIV-1 due to elevated expression of CCR5 and CXCR4. In phytohemagglutinin (PHA)-stimulatedCD8-depleted peripheral blood mononuclear cells (PBMC) infected with HIV-1 green fluorescent protein(GFP) reporter viruses, DR� 38� T cells constituted the majority of CCR5 (R5)-tropic (median, 62%) andCXCR4 (X4)-tropic HIV-1-producing cells (median, 61%), although cell surface CCR5 and CXCR4 were notelevated in this subset of cells. In lymph nodes from untreated individuals infected with R5-tropic HIV-1,percentages of CCR5� cells were elevated in DR� 38� CD4� T cells (median, 36.4%) compared to other CD4�
T-cell subsets (median values of 5.7% for DR� 38� cells, 19.4% for DR� 38� cells, and 7.6% for DR� 38� cells;n � 18; P < 0.001). In sorted CD8� lymph node T cells, median HIV-1 RNA copies/105 cells was higher for DR�
38� cells (1.8 � 106) than for DR� 38� (0.007 � 106), DR� 38� (0.064 � 106), and DR� 38� (0.18 � 106)subsets (n � 8; P < 0.001 for all). After adjusting for percentages of subsets, a median of 87% of viral RNAwas harbored by DR� 38� cells. Percentages of CCR5� CD4� T cells and concentrations of CCR5 moleculesamong subsets predicted HIV-1 RNA levels among CD8� DR/38 subsets (P < 0.001 for both). Median HIV-1DNA copies/105 cells was higher in DR� 38� cells (5,360) than in the DR� 38� (906), DR� 38� (814), and DR�
38� (1,984) subsets (n � 7; P < 0.031). Thus, DR� 38� CD4� T cells in lymph nodes have elevated CCR5expression, are highly susceptible to infection with R5-tropic virus, and produce the majority of R5-tropicHIV-1. PBMC assays failed to recapitulate in vivo findings, suggesting limited utility. Strategies to reducenumbers of DR� 38� CD4� T cells may substantially inhibit HIV-1 replication.
Activated T lymphocytes, identified by expression of CD38(38) alone or in combination with HLA-DR (DR), are stronglyimplicated in the pathogenesis of HIV-1 infection. Susceptibil-ity to HIV-1 infection has been linked to the percentages ofactivated CD4� T cells in peripheral blood (1, 24). Further-more, the percentages of activated lymphocytes in peripheralblood (14, 21, 23) and lymph nodes (2, 35) are increased duringHIV-1 infection, correlated with plasma HIV-1 RNA concen-tration (9, 19), and associated with disease progression (9, 16)and death (15, 30). The mechanisms underlying the strongassociation between activated lymphocytes and HIV-1 suscep-tibility and disease progression are not fully understood; bothdirect infection and replication of HIV-1 by activated CD4�
lymphocytes and indirect effects of immune activation resulting
in CD4� T-cell depletion have been hypothesized to play a role(44).
Knowledge of the proportion of virus replication that issupported by activated CD4� T cells could provide insight intothe relative importance of direct infection of activated cellsversus indirect effects of immune activation in HIV-1 immu-nopathogenesis. One study reported that HIV-1 gag DNA iselevated in activated peripheral blood memory CD4� T cells(defined as 38�, DR�, or Ki67� cells that also expressedCD45RO) than in other memory CD4� T cells (31), suggestingthat activated cells may be preferentially infected in vivo. Nev-ertheless, neither the proportion of gag DNA nor the amountof HIV-1 RNA produced by activated memory CD4� T cellswas determined in this study. Furthermore, it is unclear ifperipheral blood measurements reflect those in lymphoid tis-sues, where the majority of HIV-1 replication occurs in vivo(12, 42, 45, 47). Most HIV-1 RNA in lymphoid tissues is pro-duced by T lymphocytes (42, 47, 50). In situ analyses of lymphnodes from 5 HIV-1-infected humans in early HIV-1 infectionrevealed that approximately half of the HIV-1 RNA-producingcells expressed DR (59%) or Ki67 (43%), and in 10 subjectswith AIDS, even higher proportions of virus-producing cellswere found in DR� (85%) and Ki67� (76%) cells (50). Nev-
* Corresponding author. Mailing address: Division of InfectiousDiseases, Department of Medicine, University of Colorado Denver,12700 E. 19th Avenue, Box B168, Aurora, CO 80045. Phone: (303)724-4930. Fax: (303) 724-4926. E-mail: [email protected].
† Present address: HIV Care and Support Program, Botswana-UPenn Partnership, Gaborone, Botswana.
‡ Present address: Abbott Laboratories, Abbott Park, IL.� Published ahead of print on 3 August 2011.
10189
on May 27, 2018 by guest
http://jvi.asm.org/
Dow
nloaded from

ertheless, the magnitude of HIV-1 RNA and DNA harboredby DR� 38� T cells, which are more strongly linked to viralload and disease progression than either DR� cells or Ki67�
cells alone, has never been quantified. Furthermore, mecha-nisms underlying infection and replication of HIV-1 by acti-vated lymphocytes in lymphoid tissues, such as HIV-1 chemo-kine coreceptor expression, have not been evaluated. Thepurpose of the present study was to measure the amount ofHIV-1 produced by DR� 38� CD4� T cells in peripheralblood mononuclear cells (PBMC) in vitro and in lymphoidtissues in vivo and to investigate whether HIV-1 infection ofthese cells is related to the levels of HIV-1 chemokine core-ceptors. We hypothesized that DR� 38� CD4� T cells producethe majority of HIV-1 and that this is related to increasedsusceptibility of these cells to HIV-1 infection conferred byelevated levels of cell surface CCR5 and CXCR4.
(Part of this research was presented at the 16th Conferencefor Retroviruses and Opportunistic Infections in 2009 [abstract311].)
MATERIALS AND METHODS
Study subjects and clinical specimens. Individuals at low risk for HIV-1infection donated peripheral blood specimens for in vitro HIV-1 replicationassays. Inguinal lymph nodes were obtained as previously described (12) fromindividuals with documented HIV-1 infection for at least 6 months, who were notreceiving antiretroviral therapy and had CD4� T-cell counts of �300/mm3. Noneof these subjects had an opportunistic infection, malignancy, or acute illness atthe time of lymph node excision. Inguinal lymph nodes were also obtained fromHIV-1-seronegative individuals while they underwent a nonemergent surgicalprocedure in the groin area. Peripheral blood specimens were obtained at thesame time as lymph node specimens. Informed consent was obtained from allsubjects, and the study was approved by the Colorado Multiple InstitutionalReview Board.
Peripheral blood mononuclear cells (PBMC) were isolated by density centrif-ugation using lymphocyte separation medium (Mediatech, Herndon, VA) ac-cording to the manufacturer’s instructions. Inguinal lymph nodes were disaggre-gated as previously described (12), and cells were either used immediately inassays or cryopreserved for future studies. In HIV-1-seropositive subjects, pe-ripheral blood CD4� T-cell counts were determined by flow cytometry, plasmaHIV-1 RNA concentration was measured by Roche COBAS TaqMan 96 HIV-1test (Indianapolis, IN), and HIV-1 coreceptor tropism was assayed by the Trofiletest (Monogram Biosciences, South San Francisco, CA). For seronegative lymphnode donors, HIV-1 serostatus was confirmed by an enzyme-linked immunosor-bent assay (ELISA).
In vitro infection with HIV-1 GFP reporter viruses. The HIV-1 NL4-3-basedCXCR4 (X4)-tropic green fluorescent protein (GFP) reporter virus NLENG1-IRES has been described elsewhere (28). A CCR5 (R5)-tropic GFP reportervirus called NLYUV3-GFP was constructed from NLENG1-IRES by replacingthe envelope V3 region with the V3 loops from the YU-2 HIV-1 molecular clone.CCR5 tropism was demonstrated by successful infection of CCR5-GHOST cells,but not CXCR4-GHOST cells (NIH AIDS Research and Reference ReagentProgram) (33). Virus stocks were generated by transfection of 293T cells usingEffectene (Qiagen, Valencia, CA), and p24 concentration was determined byELISA (PerkinElmer, Shelton, CT). Freshly isolated PBMC from individuals atlow risk for HIV-1 infection were depleted of CD8� cells using anti-CD8 anti-body-coated magnetic beads (Invitrogen, Carlsbad, CA). The cells were stimu-lated with phytohemagglutinin (PHA) (5 �g/ml, Sigma) in RPMI 1640 (Medi-atech, Inc., Manassas, VA) with 10% fetal bovine serum (FBS) (Invitrogen LifeScience, San Diego, CA) and 10 U/ml interleukin 2 (IL-2) (Roche, Indianapolis,IN) for 60 h, and then 1 � 107 to 3 � 107 cells were incubated with 0.5 ml to 1.5ml of either CCR5-tropic reporter virus stock (ranging from 400 to 1,050 ng ofp24 antigen/ml) or CXCR4-tropic reporter virus stock (ranging from 380 to 1,050ng of p24 antigen/ml) for 2 h at 37°C. The cells were diluted to 1 � 106 cells/mlin RPMI 1640 with 10% FBS and 10 U/ml IL-2 and incubated for 2 days at 37°Cwith 5% CO2. The cells were then stained with monoclonal antibodies, CD3-PE(phycoerythrin [PE]-conjugated CD3), CD4-APC-H7 (allophycocyanin [APC]H7-conjugated CD4), HLA-DR-APC (APC-conjugated HLA-DR), CD38-PE-Cy5 (PE- and Cy5-conjugated CD38) (all obtained from BD Biosciences, San
Diego, CA), and CD8-AF405 (Alexa Fluor 405 [AF405]-conjugated CD8) (In-vitrogen Life Science). Data were acquired on an LSR II flow cytometer (BDImmunocytometry System, San Jose, CA) and analyzed using FlowJo (Tree Star,Ashland, OR). For a control, a well containing uninfected cells was included ineach experiment.
HIV-1 chemokine coreceptor flow cytometry analyses. Lymph node and wholeblood cells were incubated with 1% normal goat serum to block nonspecificstaining and then treated with antibodies to CD3-PE-Cy5 (BD Biosciences, SanJose, CA), CD4-APC-H7, CD8-AF405, CD38-fluorescein isothiocyanate (FITC)(Invitrogen Life Science), HLA-DR-APC, and CCR5-PE or CXCR4-PE (man-ufactured by BD Biosciences with known 1:1 PE/antibody ratio) for 30 min atroom temperature. Red blood cells were lysed with fluorescence-activated cellsorting (FACS) lysis buffer (BD Biosciences) from whole-blood samples, and allcells were washed with phosphate-buffered saline (PBS) (Mediatech, Inc.) con-taining 1% bovine serum albumin (Sigma, St. Louis, MO) and fixed in 2%paraformaldehyde. Data were acquired using an LSR II flow cytometer (BDImmunocytometry Systems) and analyzed using FlowJo (Tree Star, Ashland,OR). QuantiBRITE beads (BD Biosciences, San Diego, CA) were used todetermine the mean number of CCR5 or CXCR4 molecules on the surfaces oflymphocyte subsets as previously described (32). The linear range of these mea-surements was 474 to 69,045 PE molecules/cell.
Sorting of lymph node cells into subsets. Cryopreserved lymph node cells werethawed, stained, and sorted on a FACSAria (BD Immunocytometry Systems, SanJose, CA). To determine the amount of HIV-1 RNA in CD4� and CD8�
lymphocyte subsets, cells were stained with antibodies to CD3-PE-Cy5, CD4-APC-H7 (BD Biosciences) and CD8-AF405 (Invitrogen Life Science), gated onthe CD3� population, and sorted into the following subsets: CD4� CD8�, CD4�
CD8�, CD4� CD8�, and CD4� CD8�. To determine the amount of HIV-1RNA and DNA harbored by subsets defined by HLA-DR and CD38, the cellswere stained with antibodies to CD3-FITC, CD38–PE-Texas Red HLA-DR-APC (BD Biosciences) and CD8-PE (Invitrogen Life Science), gated on theCD3� CD8� population, and sorted into the following subsets: DR� 38�, DR�
38�, DR� 38�, and DR� 38�. Aliquots of 100,000 sorted cells were stored at�70°C as a dry pellet.
Quantification of HIV-1 RNA within lymph node cell subsets. Cellular RNAwas extracted using a RNA blood extraction kit (Qiagen, Gaithersburg, MD).HIV-1 RNA was quantified by a nested PCR amplification of the HIV-1 longterminal repeat (LTR) by previously described methods (8, 40). HIV-1 RNAstandards were included in each PCR by dilution of known amounts of the HIV-1BAL strain in a background of 105 HIV-1 uninfected tonsil cells ranging from100 to 106 HIV copies/ml to obtain a range of 5 to 50,000 HIV copies perfirst-round PCR. A standard curve was constructed by plotting the cycle thresh-old in the second PCR (cutoff, fluorescence �10 times the background) versusRNA concentration of HIV-1 RNA standards. All HIV-1 RNA measurementswere corrected for HIV-1 DNA contamination of the RNA preparations. HIV-1DNA concentration in the RNA preparations was determined by PCR amplifi-cation without reverse transcription. The HIV-1 DNA concentration was sub-tracted from the measured HIV-1 RNA concentration to obtain a correctedHIV-1 RNA concentration. RNA recovery was measured by adding 50 to500,000 copies of HIV-1 RNA (HIV-1 BAL strain) to tonsil cells from HIV-seronegative donors at the time of RNA extraction. Mean HIV-1 RNA recoverywas 74% (95% confidence interval [CI], 33 to 115%).
Quantification of HIV-1 DNA within lymph node cell subsets. HIV-1 DNAwas extracted using a DNeasy blood and tissue kit (Qiagen, Gaithersburg, MD).Cell-associated HIV-1 DNA was quantified by nested PCR amplification of theHIV-1 long terminal repeat. A total of 105 sorted lymph node cells were resus-pended in 200 �l of phosphate-buffered saline, and DNA was extracted andpurified with the QIAamp blood kit (Qiagen, Inc., Chatsworth, CA). Purified cellDNA was quantitated by absorption spectroscopy at 260 nm and by real-timePCR quantification of human �-actin DNA using TaqMan reagents according tothe manufacturer’s instructions (Applied Biosystems, Carlsbad, CA). HIV-1DNA was quantified by a two-step PCR amplification by previously describedmethods (8, 40). HIV-1 DNA standards were included in each PCR by dilutionof HIV-1-infected U1 cells (7) in a background of HIV-1 uninfected MT-2 cells(17) to obtain a range of HIV-1 DNA concentrations from 1.5 to 150,000 genomecopies per first-round PCR. To determine the HIV-1 DNA concentration insamples, a standard curve was constructed by plotting the cycle threshold in thesecond PCR (cutoff, fluorescence of �10 times the background) versus DNAconcentration of HIV-1 DNA standards. All PCRs were performed by a personwho was blinded to the identity of the samples, and all measurements were themeans of triplicate analyses. HIV-1 DNA recovery was measured by extractingtotal cellular DNA from 10 to 106 chronically HIV-1-infected U1 cells (2 copies
10190 MEDITZ ET AL. J. VIROL.
on May 27, 2018 by guest
http://jvi.asm.org/
Dow
nloaded from
of HIV-1 proviral DNA/cell) (11, 26). Mean HIV-1 DNA recovery was 50%(95% CI, 22 to 78%).
Statistical analysis. All analyses assumed a two-sided test of hypothesis. Fish-er’s exact test and Wilcoxon rank sum tests were used for comparing demo-graphic data between groups. Spearman correlations were used. NonparametricFriedman tests were used to obtain overall P values for analysis of DR/38 subsetsnested within subject. Assuming overall significance (� � 0.05), Wilcoxon signed-rank tests were used for subsequent pairwise comparisons under a Bonferroni’scorrected significance level of � � 0.017 (0.05/3). Analyses of log10 HIV-1 RNAcopies/ml as a function of subset percentage and density utilized the mixedprocedure in SAS (SAS Institute, Inc., Cary, NC) with the repeated option forDR/38 subsets nested within subject. An unstructured variance/covariance matrixwas chosen based on Akaike’s information criterion (25).
RESULTS
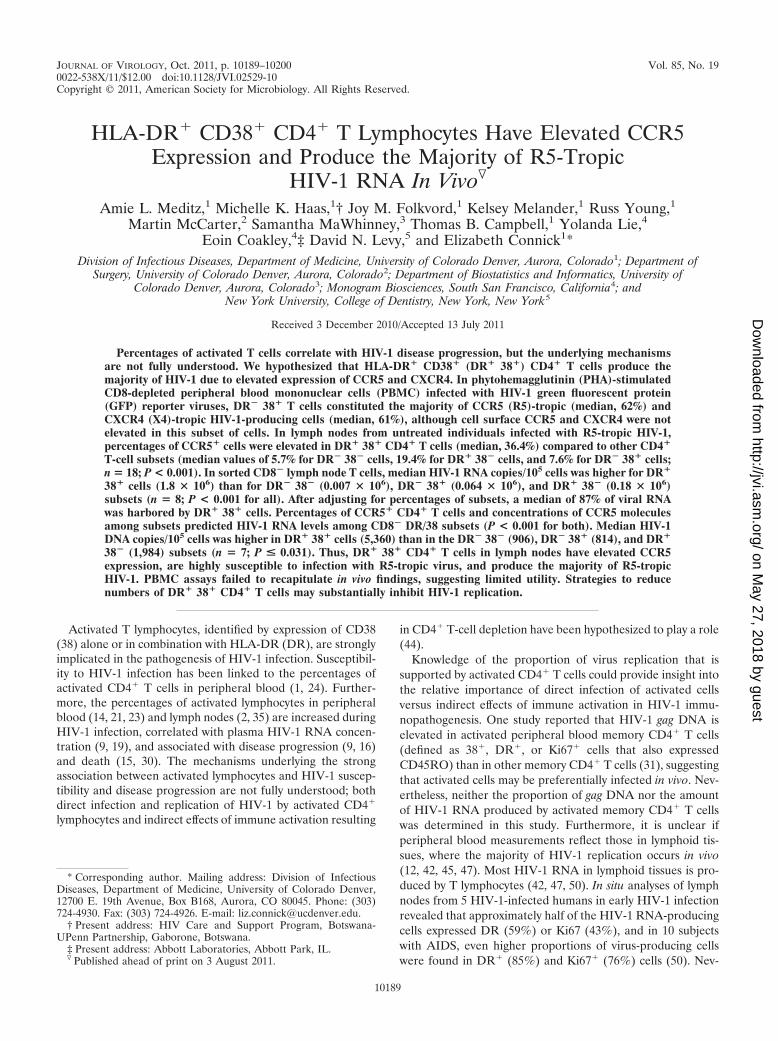
HIV-1 replication is concentrated within DR� 38� lympho-cytes in cultured PBMC. To determine whether the majority ofHIV-1 is produced by DR� 38� CD4� T cells in vitro, phyto-hemagglutinin (PHA)-stimulated peripheral blood mononu-clear cells (PBMC) from 10 individuals at low risk for HIV-1infection were infected with CCR5 (R5)- and CXCR4 (X4)-tropic HIV-1 green fluorescent protein (GFP) reporter viruses.It has previously been shown that replication of the X4-tropicreporter virus decreases CD4 expression (25), and we con-firmed that this is also true for the R5-tropic reporter virus, asshown in a representative flow cytometry plot (Fig. 1). For thisreason, PBMC were first depleted of CD8� cells, resulting in amedian of 92% (range, 65% to 96%) of CD4� cells within theCD3� population. The cells were cultured with PHA for 2days, then infected with R5- and X4-tropic HIV-1 GFP re-porter viruses, and analyzed for GFP expression in the lym-phocyte population 48 h later. The median percentages ofGFP-positive (GFP�) lymphocytes were 0.07 (range, 0.03 to1.25) for R5-tropic virus cultures and 0.19 (range, 0.06 to 1.82)for X4-tropic virus cultures (P � 0.006). Medians of 25% and21% of GFP� cells in R5-tropic and X4-tropic cultures, re-
spectively, expressed cell surface CD4 even when CD4 dimcells were included in the CD4� population (Fig. 1).
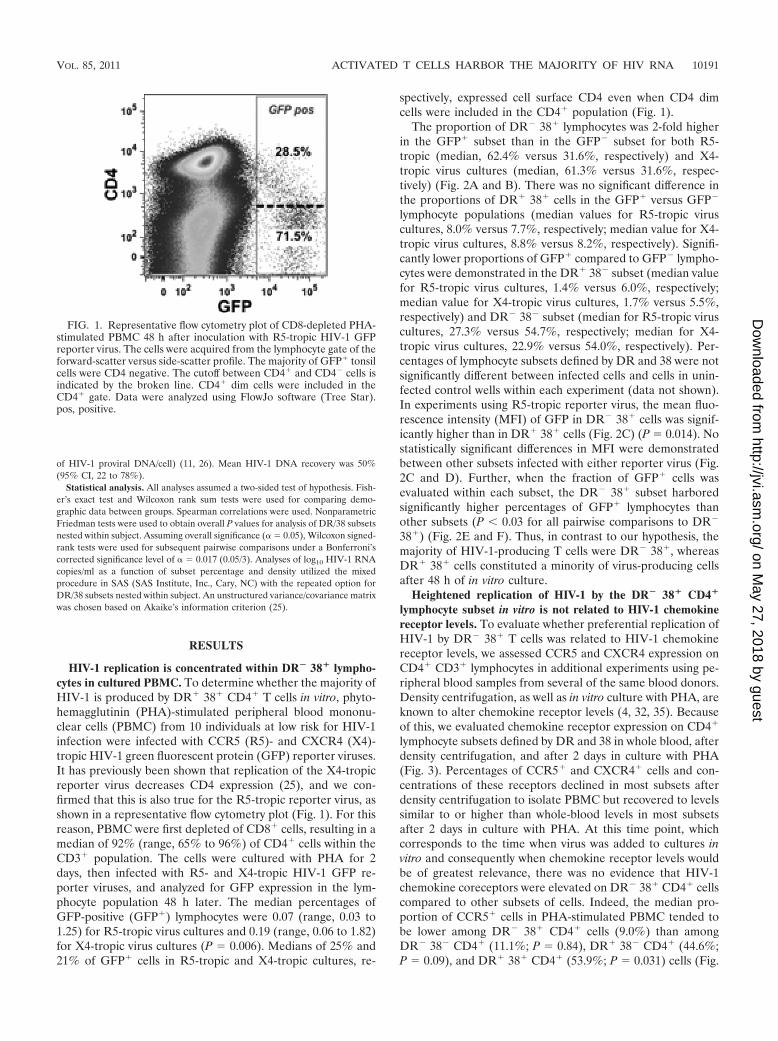
The proportion of DR� 38� lymphocytes was 2-fold higherin the GFP� subset than in the GFP� subset for both R5-tropic (median, 62.4% versus 31.6%, respectively) and X4-tropic virus cultures (median, 61.3% versus 31.6%, respec-tively) (Fig. 2A and B). There was no significant difference inthe proportions of DR� 38� cells in the GFP� versus GFP�
lymphocyte populations (median values for R5-tropic viruscultures, 8.0% versus 7.7%, respectively; median value for X4-tropic virus cultures, 8.8% versus 8.2%, respectively). Signifi-cantly lower proportions of GFP� compared to GFP� lympho-cytes were demonstrated in the DR� 38� subset (median valuefor R5-tropic virus cultures, 1.4% versus 6.0%, respectively;median value for X4-tropic virus cultures, 1.7% versus 5.5%,respectively) and DR� 38� subset (median for R5-tropic viruscultures, 27.3% versus 54.7%, respectively; median for X4-tropic virus cultures, 22.9% versus 54.0%, respectively). Per-centages of lymphocyte subsets defined by DR and 38 were notsignificantly different between infected cells and cells in unin-fected control wells within each experiment (data not shown).In experiments using R5-tropic reporter virus, the mean fluo-rescence intensity (MFI) of GFP in DR� 38� cells was signif-icantly higher than in DR� 38� cells (Fig. 2C) (P � 0.014). Nostatistically significant differences in MFI were demonstratedbetween other subsets infected with either reporter virus (Fig.2C and D). Further, when the fraction of GFP� cells wasevaluated within each subset, the DR� 38� subset harboredsignificantly higher percentages of GFP� lymphocytes thanother subsets (P 0.03 for all pairwise comparisons to DR�
38�) (Fig. 2E and F). Thus, in contrast to our hypothesis, themajority of HIV-1-producing T cells were DR� 38�, whereasDR� 38� cells constituted a minority of virus-producing cellsafter 48 h of in vitro culture.
Heightened replication of HIV-1 by the DR� 38� CD4�
lymphocyte subset in vitro is not related to HIV-1 chemokinereceptor levels. To evaluate whether preferential replication ofHIV-1 by DR� 38� T cells was related to HIV-1 chemokinereceptor levels, we assessed CCR5 and CXCR4 expression onCD4� CD3� lymphocytes in additional experiments using pe-ripheral blood samples from several of the same blood donors.Density centrifugation, as well as in vitro culture with PHA, areknown to alter chemokine receptor levels (4, 32, 35). Becauseof this, we evaluated chemokine receptor expression on CD4�
lymphocyte subsets defined by DR and 38 in whole blood, afterdensity centrifugation, and after 2 days in culture with PHA(Fig. 3). Percentages of CCR5� and CXCR4� cells and con-centrations of these receptors declined in most subsets afterdensity centrifugation to isolate PBMC but recovered to levelssimilar to or higher than whole-blood levels in most subsetsafter 2 days in culture with PHA. At this time point, whichcorresponds to the time when virus was added to cultures invitro and consequently when chemokine receptor levels wouldbe of greatest relevance, there was no evidence that HIV-1chemokine coreceptors were elevated on DR� 38� CD4� cellscompared to other subsets of cells. Indeed, the median pro-portion of CCR5� cells in PHA-stimulated PBMC tended tobe lower among DR� 38� CD4� cells (9.0%) than amongDR� 38� CD4� (11.1%; P � 0.84), DR� 38� CD4� (44.6%;P � 0.09), and DR� 38� CD4� (53.9%; P � 0.031) cells (Fig.
FIG. 1. Representative flow cytometry plot of CD8-depleted PHA-stimulated PBMC 48 h after inoculation with R5-tropic HIV-1 GFPreporter virus. The cells were acquired from the lymphocyte gate of theforward-scatter versus side-scatter profile. The majority of GFP� tonsilcells were CD4 negative. The cutoff between CD4� and CD4� cells isindicated by the broken line. CD4� dim cells were included in theCD4� gate. Data were analyzed using FlowJo software (Tree Star).pos, positive.
VOL. 85, 2011 ACTIVATED T CELLS HARBOR THE MAJORITY OF HIV RNA 10191
on May 27, 2018 by guest
http://jvi.asm.org/
Dow
nloaded from
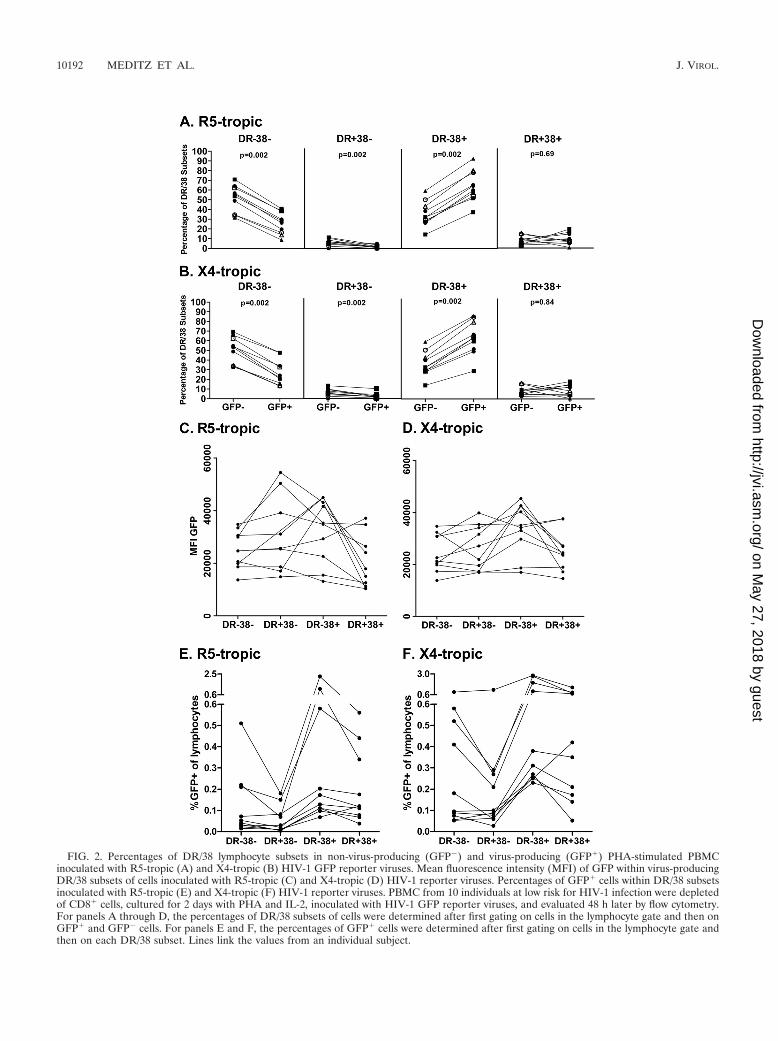
FIG. 2. Percentages of DR/38 lymphocyte subsets in non-virus-producing (GFP�) and virus-producing (GFP�) PHA-stimulated PBMCinoculated with R5-tropic (A) and X4-tropic (B) HIV-1 GFP reporter viruses. Mean fluorescence intensity (MFI) of GFP within virus-producingDR/38 subsets of cells inoculated with R5-tropic (C) and X4-tropic (D) HIV-1 reporter viruses. Percentages of GFP� cells within DR/38 subsetsinoculated with R5-tropic (E) and X4-tropic (F) HIV-1 reporter viruses. PBMC from 10 individuals at low risk for HIV-1 infection were depletedof CD8� cells, cultured for 2 days with PHA and IL-2, inoculated with HIV-1 GFP reporter viruses, and evaluated 48 h later by flow cytometry.For panels A through D, the percentages of DR/38 subsets of cells were determined after first gating on cells in the lymphocyte gate and then onGFP� and GFP� cells. For panels E and F, the percentages of GFP� cells were determined after first gating on cells in the lymphocyte gate andthen on each DR/38 subset. Lines link the values from an individual subject.
10192 MEDITZ ET AL. J. VIROL.
on May 27, 2018 by guest
http://jvi.asm.org/
Dow
nloaded from
3A). The numbers of cell surface CCR5 molecules per cellwere higher on DR� 38� cells (median, 4,094) than on DR�
38� cells (median, 1,938; P � 0.03) but did not differ signifi-cantly from those on DR� 38� cells (median, 4,685; P � 1.0)or DR� 38� cells (median, 3,607; P � 0.09) (Fig. 3B). Nosignificant differences among subsets were observed in CXCR4percentages (Fig. 3C; overall P � 0.49) or concentrations (Fig.3D; overall P � 0.36). Thus, heightened replication of HIV-1within the DR� 38� lymphocyte subset in vitro was not relatedto HIV-1 chemokine receptor expression.
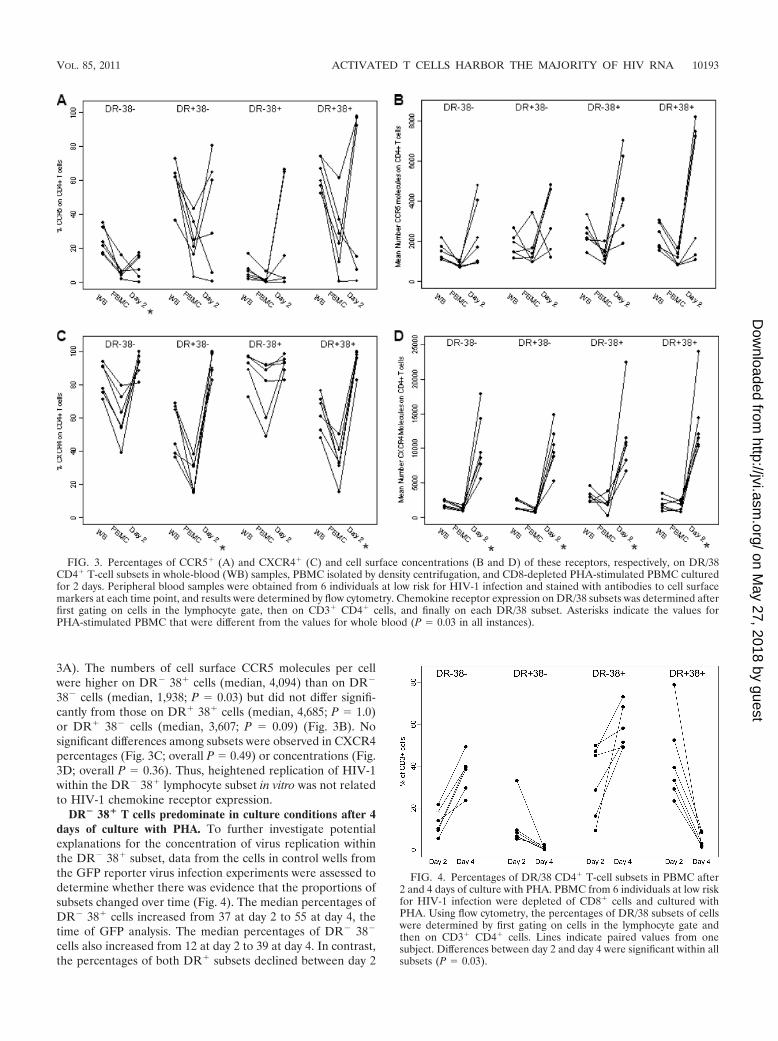
DR� 38� T cells predominate in culture conditions after 4days of culture with PHA. To further investigate potentialexplanations for the concentration of virus replication withinthe DR� 38� subset, data from the cells in control wells fromthe GFP reporter virus infection experiments were assessed todetermine whether there was evidence that the proportions ofsubsets changed over time (Fig. 4). The median percentages ofDR� 38� cells increased from 37 at day 2 to 55 at day 4, thetime of GFP analysis. The median percentages of DR� 38�
cells also increased from 12 at day 2 to 39 at day 4. In contrast,the percentages of both DR� subsets declined between day 2
FIG. 3. Percentages of CCR5� (A) and CXCR4� (C) and cell surface concentrations (B and D) of these receptors, respectively, on DR/38CD4� T-cell subsets in whole-blood (WB) samples, PBMC isolated by density centrifugation, and CD8-depleted PHA-stimulated PBMC culturedfor 2 days. Peripheral blood samples were obtained from 6 individuals at low risk for HIV-1 infection and stained with antibodies to cell surfacemarkers at each time point, and results were determined by flow cytometry. Chemokine receptor expression on DR/38 subsets was determined afterfirst gating on cells in the lymphocyte gate, then on CD3� CD4� cells, and finally on each DR/38 subset. Asterisks indicate the values forPHA-stimulated PBMC that were different from the values for whole blood (P � 0.03 in all instances).
FIG. 4. Percentages of DR/38 CD4� T-cell subsets in PBMC after2 and 4 days of culture with PHA. PBMC from 6 individuals at low riskfor HIV-1 infection were depleted of CD8� cells and cultured withPHA. Using flow cytometry, the percentages of DR/38 subsets of cellswere determined by first gating on cells in the lymphocyte gate andthen on CD3� CD4� cells. Lines indicate paired values from onesubject. Differences between day 2 and day 4 were significant within allsubsets (P � 0.03).
VOL. 85, 2011 ACTIVATED T CELLS HARBOR THE MAJORITY OF HIV RNA 10193
on May 27, 2018 by guest
http://jvi.asm.org/
Dow
nloaded from
and day 4; in particular, DR� 38� CD3� cells declined from amedian of 36% at day 2 to a median of 3% at day 4 (P � 0.031).Thus, significant fluctuations in lymphocyte subsets were ob-served between days 2 and 4 of in vitro culture, resulting inrelative expansion of the DR� 38� subset and profound re-ductions in the percentages of DR� 38� cells.
Clinical characteristics of human lymph node donors. Toinvestigate the relationship between DR� 38� CD4� T cells andHIV-1 replication in vivo, lymph nodes and peripheral bloodsamples from 22 HIV-1-seropositive individuals not receiving an-tiretroviral therapy and 6 HIV-1-seronegative individuals wereevaluated. Demographic and clinical characteristics of these sub-jects are shown in Table 1. Overall, 55% of HIV-1-seropositivesubjects and 45% of seronegative subjects were women (P � 1.0).Compared to seronegative individuals, seropositive individualswere younger (median age, 34 versus 51 years; P � 0.006) andmore likely to be nonwhite (75% versus 17%; P � 0.03). Amongseropositive subjects, the median CD4� T-cell count was 621(range, 256 to 1,117) cells/mm3, and the median plasma viral loadwas 4.36 (range, 1.70 to 5.88) log10 copies/ml. All HIV-1-infectedsubjects harbored only R5-tropic virus.
The percentages of DR� 38� CD4� T cells are elevated inlymph nodes of HIV-1-seropositive subjects and correlate withCD4� T-cell counts and plasma viral load. The percentages of
lymph node DR� 38� CD4� T cells were higher in HIV-1-seropositive subjects (median, 14.9; range, 2.1 to 32.8; n � 18)than in seronegative subjects (median, 2.4; range, 1.3 to 10.5;n � 6; P � 0.004), consistent with previous studies (35, 49). Inseropositive subjects, the percentages of DR� 38� CD4� Tcells were higher in lymph nodes (median, 20.6) than in wholeblood (median, 6.9; n � 11; P � 0.001), as previously reportedby others (35, 49). The percentages of lymph node DR� 38�
CD4� T cells correlated inversely with CD4� T cell counts (r ��0.74; 95% CI, �0.9 to �0.41; P � 0.002) and directly withplasma HIV-1 RNA (r � 0.53; 95% CI, 0.08 to 0.8, P � 0.03).
Lymph node DR� 38� CD4� T cells have elevated levels ofcell surface HIV-1 chemokine coreceptors. To assess whetherDR� 38� CD4� T cells have increased expression of HIV-1chemokine receptors compared to other CD4� T-cell subsets,the percentages of cells that expressed HIV-1 chemokine re-ceptors and numbers of cell surface chemokine receptors weredetermined in lymph node cells from 18 HIV-1-seropositiveand 6 HIV-1-seronegative individuals. Representative flow cy-tometry plots of the gating strategy used for stained lymphnode cells are pictured in Fig. 5. Among HIV-1-seropositivesubjects, the proportions of CCR5� cells were significantlyhigher in DR� 38� lymph node CD4� T cells (median, 36.4%)than in all other subsets (median values of 5.7% DR� 38�
cells, 19.4% for DR� 38� cells, and 7.6% for DR� 38� cells)(Fig. 6A), whereas the percentages of CXCR4� cells did notsignificantly differ among subsets (Fig. 6B). The numbers ofboth CCR5 molecules and CXCR4 molecules per cell werealso elevated on DR� 38� cells (Fig. 6C and D). Similarpatterns of HIV-1 chemokine receptor expression were ob-served in seronegative subjects, although differences amongsubsets were not statistically significant after adjusting for mul-tiple comparisons. There was a trend for higher percentages ofCCR5� cells in the DR� 38� CD4� T-cell subset in HIV-1-seropositive versus HIV-1-seronegative subjects (median, 36.4versus 22.5, respectively; P � 0.06). However, there were nosignificant differences between seropositive and seronegativesubjects in the proportions of CXCR4� cells (median value of64.1 versus 78%, respectively; P � 0.16), numbers of CCR5molecules (median, 3,986 versus 4,364 mol/cell, respectively;P � 0.67) or numbers of CXCR4 molecules (median, 2,933versus 3,834 mol/cell, respectively; P � 0.67) in the DR� 38�
CD4� T-cell subset.The majority of HIV-1-producing cells in vivo do not dem-
onstrate cell surface CD4 expression. Our in vitro experi-ments demonstrated that CD4 is expressed on only a minor-ity of virus-producing cells. To determine the extent towhich CD4 is downregulated on virus-producing cells invivo, we sorted CD3� lymph node cells from 6 untreatedHIV-1-infected subjects into subsets defined by CD4 andCD8 expression. As shown in Fig. 7A, significantly moreHIV-1 RNA copies/105 cells were found in CD4� CD8� Tcells (median, 3.1 � 106) than in CD4� CD8� (median,0.18 � 106), CD4� CD8� (median, 0.5 � 106), and CD4�
CD8� (median, 0.035 � 106) (overall P � 0.001; for allpairwise comparisons P � 0.03) subsets. After adjusting forthe proportion contributed by each subset (Fig. 7B), theCD4� CD8� fraction contributed a median of 48% of thetotal HIV-1 RNA copies compared to CD4� CD8� (me-dian, 15%), CD4� CD8� (median, 29%), and CD4� CD8�
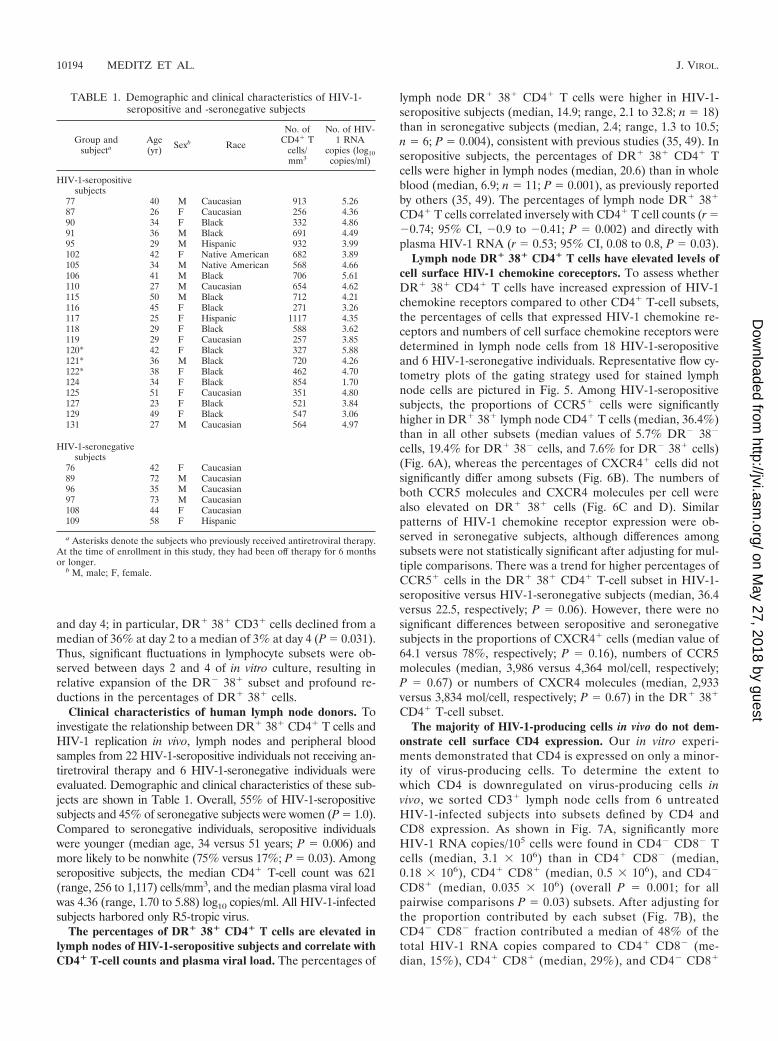
TABLE 1. Demographic and clinical characteristics of HIV-1-seropositive and -seronegative subjects
Group andsubjecta
Age(yr) Sexb Race
No. ofCD4� T
cells/mm3
No. of HIV-1 RNA
copies (log10copies/ml)
HIV-1-seropositivesubjects
77 40 M Caucasian 913 5.2687 26 F Caucasian 256 4.3690 34 F Black 332 4.8691 36 M Black 691 4.4995 29 M Hispanic 932 3.99102 42 F Native American 682 3.89105 34 M Native American 568 4.66106 41 M Black 706 5.61110 27 M Caucasian 654 4.62115 50 M Black 712 4.21116 45 F Black 271 3.26117 25 F Hispanic 1117 4.35118 29 F Black 588 3.62119 29 F Caucasian 257 3.85120* 42 F Black 327 5.88121* 36 M Black 720 4.26122* 38 F Black 462 4.70124 34 F Black 854 1.70125 51 F Caucasian 351 4.80127 23 F Black 521 3.84129 49 F Black 547 3.06131 27 M Caucasian 564 4.97
HIV-1-seronegativesubjects
76 42 F Caucasian89 72 M Caucasian96 35 M Caucasian97 73 M Caucasian108 44 F Caucasian109 58 F Hispanic
a Asterisks denote the subjects who previously received antiretroviral therapy.At the time of enrollment in this study, they had been off therapy for 6 monthsor longer.
b M, male; F, female.
10194 MEDITZ ET AL. J. VIROL.
on May 27, 2018 by guest
http://jvi.asm.org/
Dow
nloaded from

(median, 8%) (P � 0.14 overall) subsets (Fig. 7C). Furtheranalyses revealed that a strategy based on gating on CD4�
T cells would include only 41% (range, 25 to 53%) of HIV-1RNA, whereas a strategy based on gating on CD8� cellswould include a median of 58% (range, 56 to 78%). Thus, onthe basis of these data, we opted to sort CD8� rather thanCD4� DR/38 T-cell subsets, as described below.
HIV-1 RNA is concentrated in DR� 38� T cells in lymphnodes. To evaluate whether DR� 38� T cells produce the ma-jority of HIV-1 in vivo, HIV-1 RNA was measured in lymph nodeCD8-T-cell subsets defined by DR and 38 from 8 HIV-1-seropos-itive subjects. As shown in Fig. 8A, significantly more HIV-1RNA copies/105 cells were found in CD3� CD8� T cells thatwere DR� 38� (median, 1.8 � 106) than in DR� 38� (median,0.064 � 106), DR� 38� (median, 0.18 � 106), and DR� 38�
subsets (median, 0.007 � 106) (overall P 0.001; for all pairwisecomparisons to DR� 38�, P � 0.008). After adjusting for theproportion contributed by each subset (Fig. 8B), the DR� 38�
fraction contributed a median of 86% (range, 61% to 100%), ofthe total HIV-1 RNA copies (P 0.001 overall; P � 0.008 for allpairwise comparisons to DR� 38�) (Fig. 8C).
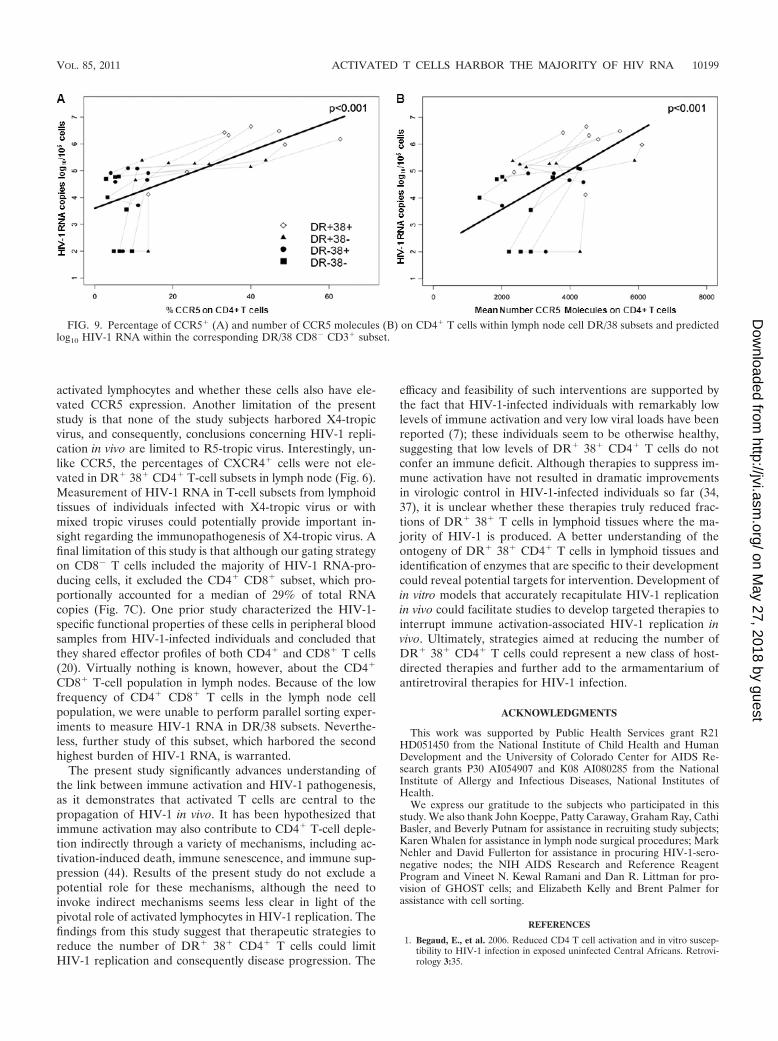
CCR5 expression on CD4� T cell DR/38 subsets predictscell-associated HIV-1 RNA concentration within CD8� T-cellDR/38 subsets. We evaluated whether CCR5 expression onCD4� T cell DR/38 subsets predicted cell-associated HIV-1RNA concentration within the sorted CD8� DR/38 subsets.The rationale for evaluating CCR5 expression on CD4� ratherthan CD8� subsets was that CD4� cells are the target cells forHIV-1, and both CD4 and CCR5 are downregulated on cellsafter infection with HIV-1 (6, 22, 48). The percentages ofCCR5� CD4� T cells and concentrations of CCR5 receptors
on the surfaces of CD4� T-cell subsets were significantly re-lated to concentrations of virus within the subsets; log10 HIV-1RNA/105 cells increased 0.54 (95% CI, 0.33 to 0.74) for each10% increase in the percentage of CCR5 (Fig. 9A) and 0.73(95% CI, 0.38 to 1.11) for each increase of 1,000 in the numberof CCR5 molecules per cell (Fig. 9B). CCR5 expression onCD8� T cells was less strongly related to HIV-1 RNA withinCD8� DR/38 subsets; log10 HIV-1 RNA/105 cells increased0.85 (95% CI, �0.14 to 1.82; P � 0.088) for each 10% increasein the number of CCR5 molecules per cell and 0.61 (95% CI,�0.25 to 1.48; P � 0.16) for each increase of 1,000 in thenumber of CCR5 molecules per cell.
HIV-1 DNA is concentrated in DR� 38� T cells in lymphnodes. To evaluate whether elevated levels of HIV-1 RNA inDR� 38� cells were related to increased infection of thesecells, HIV-1 DNA measurements were performed in lymphnode CD8� T-cell subsets from 7 subjects. Significantly moreHIV-1 DNA copies/105 cells was found in lymph node DR�
38� CD8� T cells (median, 5,360; n � 7) than in DR� 38�
(median, 814; n � 6; P � 0.031), DR� 38� (median, 1,984; n �6; P � 0.031), and DR� 38� (median, 906; n � 7; P � 0.016)subsets (Fig. 8D). After adjusting for the proportion of totalcells contributed by each subset (Fig. 8B), DR� 38� cellsharbored a median of 64% (range, 19 to 87%) of CD8� T-cell-associated HIV-1 DNA in 5 subjects for whom DNA data wereavailable for all 4 subsets (P � 0.16) (Fig. 8E).
DISCUSSION
This is the first study to quantify HIV-1 RNA and chemo-kine coreceptor levels in activated T cells from human lym-
FIG. 5. Representative flow cytometry plots of lymph node cells. The cells were acquired from the lymphocyte gate of the forward- versusside-scatter profile. A dot plot was used to define CD3� CD4� cells (A) and gates for CD38 (B) and HLA-DR (C) set with fluorescence minusone (FMO) controls. CD4� CD3� lymphocytes were evaluated in a CD38 versus HLA-DR plot (D), and CCR5 expression was evaluated in fourDR 38 subsets using histograms (E). Data were analyzed using FlowJo software (Tree Star).
VOL. 85, 2011 ACTIVATED T CELLS HARBOR THE MAJORITY OF HIV RNA 10195
on May 27, 2018 by guest
http://jvi.asm.org/
Dow
nloaded from

phoid tissues. While prior studies have suggested that activatedlymphocytes are preferentially infected (31) and contribute toHIV-1 replication in vivo (51), the proportion of virus replica-tion that occurs in these cells in vivo and the mechanismsunderlying their facility to propagate HIV-1 are not known.The present study was designed to evaluate the hypothesis thatactivated CD4� T cells are the source of the majority of HIV-1both in vitro and in vivo and to explore the role of HIV-1chemokine coreceptors in promoting virus replication by thesecells. In vitro, DR� 38� T cells constituted a minority of virus-producing cells, and replication was unrelated to HIV-1chemokine receptor expression. In vivo, the majority of R5-tropic HIV-1 RNA was found in DR� 38� T cells, and in fourof five subjects, the majority of HIV-1 DNA was found in thesecells as well. The percentages of CCR5� cells were higher inthe DR� 38� CD4� T-cell subset than in other CD4� T-cellsubsets in lymphoid tissues, and the percentages and density ofCCR5� CD4� T cells predicted the amount of R5-tropicHIV-1 RNA among subsets. These data demonstrate thatDR� 38� CD4� T cells in lymphoid tissues are highly suscep-tible to infection with R5-tropic virus, possibly due to height-
ened expression of CCR5, and produce the majority of R5-tropic HIV-1 in vivo.
In vitro studies in PBMC failed to recapitulate the in vivoobservation that HIV-1 replication is concentrated withinlymph node DR� 38� lymphocytes. Instead, the majority ofboth R5- and X4-tropic HIV-1 replication in PBMC occurredwithin DR� 38� lymphocytes and was unrelated to chemokinereceptor expression. A dramatic decline in percentages ofDR� 38� cells was seen in culture, consistent with prior ob-servations that activated T cells are predisposed to apoptosis(3, 18). In addition, some HIV-1-producing DR� 38� cells mayhave been transformed into DR� 38� cells because HIV-1 nefis known to downregulate major histocompatibility complexclass II (MHC-II) by endocytosis (5, 43, 46). Thus, preferentialreplication of HIV-1 by DR� 38� cells in vitro may have beendue to relative resistance of these cells to HIV-1-induced apop-tosis and/or downregulation of DR on HIV-1-producing DR�
38� cells. Fundamental differences between peripheral bloodand lymphoid tissue lymphocytes in their ability to supportHIV-1 replication could explain the differences between celltypes that propagated HIV-1 in vitro and in vivo. Tonsil cells
FIG. 6. Percentages of CCR5� (A) and CXCR4� (B) and concentrations of these HIV-1 coreceptors (C and D), respectively, in DR/38 CD3�
CD4� subsets of lymph node cells from HIV-1-seropositive individuals (n � 18) and HIV-1-seronegative individuals (n � 6). Each symbolrepresents the value for an individual. Short horizontal lines indicate median values for groups of individuals. P values indicate comparisonsbetween DR� 38� cells and other subsets in seropositive subjects. Asterisks denote P values that were no longer statistically significant afterBonferroni’s correction for multiple comparisons (cutoff, P � 0.017). Differences between DR� 38� cells and other subsets in seronegative subjectsand differences between seropositive and seronegative subjects were not statistically significant after adjusting for multiple comparisons.
10196 MEDITZ ET AL. J. VIROL.
on May 27, 2018 by guest
http://jvi.asm.org/
Dow
nloaded from

have been demonstrated to be more permissive for HIV-1 thanPBMC (10). In an ex vivo human tonsil tissue model, cells thatexpressed CD25 and/or DR were the major cell types thatreplicated R5 virus (3). In an ex vivo cervicovaginal tissuemodel, productive R5 infection occurred preferentially inCD38� T cells (41). Nevertheless, none of these studies exam-ined whether cells that expressed both DR and 38 preferen-
tially replicated HIV-1, and therefore, it is not possible todetermine whether these model systems recapitulated the pref-erential propagation of HIV-1 by DR� 38� cells that we ob-served in lymphoid tissues in vivo. Differences between acuteHIV-1 infection of seronegative human cells using soluble ex-tracellular virus compared to cell-to-cell transfer of virus inlymphoid tissues during chronic HIV-1 infection may also ac-count for the failure of the vitro culture system to parallelHIV-1 replication in lymph node cells in vivo. Future studiescould be directed at dissecting out reasons why PBMC assaysfailed to recapitulate in vivo findings from lymph node cellsfrom untreated HIV-1-infected subjects. The discordance be-tween our in vitro and in vivo findings illustrates the limitationsof the PHA-stimulated PBMC model of HIV-1 replication andunderscores the importance of validating in vitro findings within vivo data.
This is the first study to demonstrate that CCR5 is highlyexpressed on DR� 38� CD4� T cells in lymph nodes and thatdifferences in the amounts of HIV-1 RNA produced by DR/38subsets in vivo are related to the percentages of CCR5� cellsand density of CCR5 on these cells. One prior study thatevaluated lymph nodes from HIV-1-infected individuals didnot detect a correlation between CCR5 expression on CD4� Tcells and lymph node cellular HIV-1 RNA (35). This studyincluded individuals who were receiving antiretroviral therapyand individuals with X4-tropic HIV-1 in their analyses, how-ever, which may have obscured an association. In vitro studieshave suggested that the number of CCR5 molecules per cell isa critical determinant of HIV-1 susceptibility (27, 36, 38), andone group reported that the concentrations of CCR5 mole-cules on CD4� T cells, but not the percentages of CCR5�
CD4� T cells in peripheral blood, correlate with viral load(39). In the present study, however, both the percentage ofCCR5� cells and number of CCR5 molecules per cell corre-lated with HIV-1 RNA within lymphocyte subsets, suggestingthat both may be major determinants of HIV-1 susceptibility inlymphoid tissues. Prior studies have demonstrated that HIV-1infection itself does not alter CCR5 levels in peripheral bloodCD4� T cells (29, 39), and we found similar percentages ofCCR5 molecules in activated lymph node cells from seropos-itive and seronegative individuals in this study. Thus, the cor-relation between percentages and density of CCR5� activatedT cells and HIV-1 RNA observed in this study is unlikely to bedue to induction of CCR5 by HIV-1 replication. These findingsprovide circumstantial evidence that expression of CCR5 fa-cilitates the preferential replication of R5-tropic HIV-1 byDR� 38� T cells in vivo but do not eliminate the possibilitythat other factors may play a role. Further studies includingstudies of a larger number of subjects are warranted to confirmor refute the preliminary findings of the relationship betweenCCR5 expression and HIV-1 RNA from this study.
Whether activated CD4� T cells propagate HIV-1 moreefficiently than other CD4� T cells is unknown. In situ analysesof lymph nodes from 5 HIV-1-infected humans in early HIV-1infection revealed that the amount of HIV-1 RNA per pro-ductively infected cell was approximately 4 times higher inHLA-DR� or Ki67� cells than in other cells (50). Neverthe-less, that study did not evaluate the amount of HIV-1 RNA inDR� 38� cells. Two lines of evidence in the present studysuggest that the amount of HIV-1 RNA produced per produc-
FIG. 7. HIV-1 RNA measurements within subsets of CD4/CD8CD3� lymph node cells (n � 6). (A) Numbers of HIV-1 RNA copies/105 cells; (B) percentages of CD4/CD8 subsets within CD8� CD3�
lymph node cells; (C) percentages of total RNA copies contributed byeach CD4/CD8 subset after adjusting for percentages of subsets shownin panel B. For each box-and-whisker plot, the line indicates themedian and the whiskers (error bars) indicate the range. Lymph nodecells from untreated HIV-1-seropositive subjects were sorted into sub-sets on a cell sorter, and aliquots of 105 cells were frozen as pellets.HIV-1 RNA was then extracted and measured by PCR.
VOL. 85, 2011 ACTIVATED T CELLS HARBOR THE MAJORITY OF HIV RNA 10197
on May 27, 2018 by guest
http://jvi.asm.org/
Dow
nloaded from

tively infected DR� 38� cell is not different from that pro-duced by other cells. First, in vitro infection of PHA-stimulatedPBMC with HIV-1 reporter viruses did not reveal consistentdifferences in the mean fluorescence intensity (MFI) of GFPbetween DR� 38� cells and other subsets (Fig. 2). Second, thepattern of concentration of HIV-1 RNA and DNA among the4 subsets in vivo (Fig. 8) was similar in most subjects, suggest-ing that the amount of DNA, rather than the cell type, was themajor determinant of how much RNA was produced. Never-theless, these observations do not exclude the possibility thatDR� 38� cells produce more virions per infected cell thanother subsets. This question could be addressed definitively by
limiting dilution assays and measurement of HIV-1 RNAamong purified cells from each subset.
A shortcoming of this study is that virus replication andchemokine receptor levels were determined only in lymphnodes, whereas HIV-1 is propagated within a variety of othersecondary lymphoid tissues in vivo, including spleen and mu-cosal lymphoid tissues. The percentage of total body lympho-cytes that are harbored within lymph nodes is controversial,but it has been estimated that approximately 41% of lympho-cytes are found in lymph nodes (13). It would be important todetermine in future studies whether R5-tropic HIV-1 replica-tion in other secondary lymphoid tissues is concentrated within
FIG. 8. HIV-1 RNA and DNA measurements within subsets of DR/38 CD8� CD3� lymph node cells. (A) Numbers of HIV-1 RNA copies/105
cells; (B) percentages of DR/38 subsets within CD8� CD3� lymph node cells; (C) percentages of total RNA copies contributed by each DR/38subset after adjusting for percentages of subsets shown in panel B; (D) numbers of HIV-1 DNA copies/105 cells; (E) percentages of total DNAcopies contributed by each DR/38 subset after adjusting for percentages of subsets shown in panel B. Lymph node cells from untreatedHIV-1-seropositive subjects were sorted into subsets on a cell sorter, and aliquots of 105 cells were frozen as pellets. HIV-1 RNA and DNA werethen extracted and measured by PCR.
10198 MEDITZ ET AL. J. VIROL.
on May 27, 2018 by guest
http://jvi.asm.org/
Dow
nloaded from
activated lymphocytes and whether these cells also have ele-vated CCR5 expression. Another limitation of the presentstudy is that none of the study subjects harbored X4-tropicvirus, and consequently, conclusions concerning HIV-1 repli-cation in vivo are limited to R5-tropic virus. Interestingly, un-like CCR5, the percentages of CXCR4� cells were not ele-vated in DR� 38� CD4� T-cell subsets in lymph node (Fig. 6).Measurement of HIV-1 RNA in T-cell subsets from lymphoidtissues of individuals infected with X4-tropic virus or withmixed tropic viruses could potentially provide important in-sight regarding the immunopathogenesis of X4-tropic virus. Afinal limitation of this study is that although our gating strategyon CD8� T cells included the majority of HIV-1 RNA-pro-ducing cells, it excluded the CD4� CD8� subset, which pro-portionally accounted for a median of 29% of total RNAcopies (Fig. 7C). One prior study characterized the HIV-1-specific functional properties of these cells in peripheral bloodsamples from HIV-1-infected individuals and concluded thatthey shared effector profiles of both CD4� and CD8� T cells(20). Virtually nothing is known, however, about the CD4�
CD8� T-cell population in lymph nodes. Because of the lowfrequency of CD4� CD8� T cells in the lymph node cellpopulation, we were unable to perform parallel sorting exper-iments to measure HIV-1 RNA in DR/38 subsets. Neverthe-less, further study of this subset, which harbored the secondhighest burden of HIV-1 RNA, is warranted.
The present study significantly advances understanding ofthe link between immune activation and HIV-1 pathogenesis,as it demonstrates that activated T cells are central to thepropagation of HIV-1 in vivo. It has been hypothesized thatimmune activation may also contribute to CD4� T-cell deple-tion indirectly through a variety of mechanisms, including ac-tivation-induced death, immune senescence, and immune sup-pression (44). Results of the present study do not exclude apotential role for these mechanisms, although the need toinvoke indirect mechanisms seems less clear in light of thepivotal role of activated lymphocytes in HIV-1 replication. Thefindings from this study suggest that therapeutic strategies toreduce the number of DR� 38� CD4� T cells could limitHIV-1 replication and consequently disease progression. The
efficacy and feasibility of such interventions are supported bythe fact that HIV-1-infected individuals with remarkably lowlevels of immune activation and very low viral loads have beenreported (7); these individuals seem to be otherwise healthy,suggesting that low levels of DR� 38� CD4� T cells do notconfer an immune deficit. Although therapies to suppress im-mune activation have not resulted in dramatic improvementsin virologic control in HIV-1-infected individuals so far (34,37), it is unclear whether these therapies truly reduced frac-tions of DR� 38� T cells in lymphoid tissues where the ma-jority of HIV-1 is produced. A better understanding of theontogeny of DR� 38� CD4� T cells in lymphoid tissues andidentification of enzymes that are specific to their developmentcould reveal potential targets for intervention. Development ofin vitro models that accurately recapitulate HIV-1 replicationin vivo could facilitate studies to develop targeted therapies tointerrupt immune activation-associated HIV-1 replication invivo. Ultimately, strategies aimed at reducing the number ofDR� 38� CD4� T cells could represent a new class of host-directed therapies and further add to the armamentarium ofantiretroviral therapies for HIV-1 infection.
ACKNOWLEDGMENTS
This work was supported by Public Health Services grant R21HD051450 from the National Institute of Child Health and HumanDevelopment and the University of Colorado Center for AIDS Re-search grants P30 AI054907 and K08 AI080285 from the NationalInstitute of Allergy and Infectious Diseases, National Institutes ofHealth.
We express our gratitude to the subjects who participated in thisstudy. We also thank John Koeppe, Patty Caraway, Graham Ray, CathiBasler, and Beverly Putnam for assistance in recruiting study subjects;Karen Whalen for assistance in lymph node surgical procedures; MarkNehler and David Fullerton for assistance in procuring HIV-1-sero-negative nodes; the NIH AIDS Research and Reference ReagentProgram and Vineet N. Kewal Ramani and Dan R. Littman for pro-vision of GHOST cells; and Elizabeth Kelly and Brent Palmer forassistance with cell sorting.
REFERENCES
1. Begaud, E., et al. 2006. Reduced CD4 T cell activation and in vitro suscep-tibility to HIV-1 infection in exposed uninfected Central Africans. Retrovi-rology 3:35.
FIG. 9. Percentage of CCR5� (A) and number of CCR5 molecules (B) on CD4� T cells within lymph node cell DR/38 subsets and predictedlog10 HIV-1 RNA within the corresponding DR/38 CD8� CD3� subset.
VOL. 85, 2011 ACTIVATED T CELLS HARBOR THE MAJORITY OF HIV RNA 10199
on May 27, 2018 by guest
http://jvi.asm.org/
Dow
nloaded from

2. Biancotto, A., et al. 2007. Abnormal activation and cytokine spectra in lymphnodes of people chronically infected with HIV-1. Blood 109:4272–4279.
3. Biancotto, A., et al. 2008. HIV-1 induced activation of CD4� T cells createsnew targets for HIV-1 infection in human lymphoid tissue ex vivo. Blood111:699–704.
4. Bleul, C. C., L. Wu, J. A. Hoxie, T. A. Springer, and C. R. Mackay. 1997. TheHIV coreceptors CXCR4 and CCR5 are differentially expressed and regu-lated on human T lymphocytes. Proc. Natl. Acad. Sci. U. S. A. 94:1925–1930.
5. Chaudhry, A., et al. 2009. HIV-1 Nef promotes endocytosis of cell surfaceMHC class II molecules via a constitutive pathway. J. Immunol. 183:2415–2424.
6. Choudhary, S. K., et al. 2005. R5 human immunodeficiency virus type 1infection of fetal thymic organ culture induces cytokine and CCR5 expres-sion. J. Virol. 79:458–471.
7. Choudhary, S. K., et al. 2007. Low immune activation despite high levels ofpathogenic human immunodeficiency virus type 1 results in long-termasymptomatic disease. J. Virol. 81:8838–8842.
8. de Baar, M. P., et al. 1999. Design and evaluation of a human immunode-ficiency virus type 1 RNA assay using nucleic acid sequence-based amplifi-cation technology able to quantify both group M and O viruses by using thelong terminal repeat as target. J. Clin. Microbiol. 37:1813–1818.
9. Deeks, S. G., et al. 2004. Immune activation set point during early HIVinfection predicts subsequent CD4� T-cell changes independent of viralload. Blood 104:942–947.
10. Doitsh, G., et al. 2010. Abortive HIV infection mediates CD4 T cell deple-tion and inflammation in human lymphoid tissue. Cell 143:789–801.
11. Folks, T. M., et al. 1988. Characterization of a promonocyte clone chroni-cally infected with HIV and inducible by 13-phorbol-12-myristate acetate.J. Immunol. 140:1117–1122.
12. Folkvord, J. M., C. Armon, and E. Connick. 2005. Lymphoid follicles aresites of heightened human immunodeficiency virus type 1 (HIV-1) replica-tion and reduced antiretroviral effector mechanisms. AIDS Res. Hum. Ret-roviruses 21:363–370.
13. Ganusov, V. V., and R. J. De Boer. 2007. Do most lymphocytes in humansreally reside in the gut? Trends Immunol. 28:514–518.
14. Giorgi, J. V., and R. Detels. 1989. T-cell subset alterations in HIV-infectedhomosexual men: NIAID Multicenter AIDS cohort study. Clin. Immunol.Immunopathol. 52:10–18.
15. Giorgi, J. V., et al. 1999. Shorter survival in advanced human immunodefi-ciency virus type 1 infection is more closely associated with T lymphocyteactivation than with plasma virus burden or virus chemokine coreceptorusage. J. Infect. Dis. 179:859–870.
16. Giorgi, J. V., et al. 1993. Elevated levels of CD38� CD8� T cells in HIVinfection add to the prognostic value of low CD4� T cell levels: results of 6years of follow-up. The Los Angeles Center, Multicenter AIDS CohortStudy. J. Acquir. Immune Defic. Syndr. 6:904–912.
17. Goldsmith, M. A., M. T. Warmerdam, R. E. Atchison, M. D. Miller, andW. C. Greene. 1995. Dissociation of the CD4 downregulation and viralinfectivity enhancement functions of human immunodeficiency virus type 1Nef. J. Virol. 69:4112–4121.
18. Gougeon, M. L., et al. 1996. Programmed cell death in peripheral lympho-cytes from HIV-infected persons: increased susceptibility to apoptosis ofCD4 and CD8 T cells correlates with lymphocyte activation and with diseaseprogression. J. Immunol. 156:3509–3520.
19. Hazenberg, M. D., et al. 2003. Persistent immune activation in HIV-1 infec-tion is associated with progression to AIDS. AIDS 17:1881–1888.
20. Howe, R., et al. 2009. Phenotypic and functional characterization of HIV-1-specific CD4�CD8� double-positive T cells in early and chronic HIV-1infection. J. Acquir. Immune Defic. Syndr. 50:444–456.
21. Hunt, P. W., et al. 2008. Relationship between T cell activation and CD4�T cell count in HIV-seropositive individuals with undetectable plasma HIVRNA levels in the absence of therapy. J. Infect. Dis. 197:126–133.
22. Karlsson, I., et al. 2005. Differential pathogenesis of primary CCR5-usinghuman immunodeficiency virus type 1 isolates in ex vivo human lymphoidtissue. J. Virol. 79:11151–11160.
23. Kestens, L., et al. 1994. Selective increase of activation antigens HLA-DRand CD38 on CD4� CD45RO� T lymphocytes during HIV-1 infection.Clin. Exp. Immunol. 95:436–441.
24. Koning, F. A., et al. 2005. Low-level CD4� T cell activation is associatedwith low susceptibility to HIV-1 infection. J. Immunol. 175:6117–6122.
25. Kutsch, O., E. N. Benveniste, G. M. Shaw, and D. N. Levy. 2002. Direct andquantitative single-cell analysis of human immunodeficiency virus type 1reactivation from latency. J. Virol. 76:8776–8786.
26. Laurence, J., M. B. Sellers, and S. K. Sikder. 1989. Effect of glucocorticoidson chronic human immunodeficiency virus (HIV) infection and HIV pro-moter-mediated transcription. Blood 74:291–297.
27. Lee, B., M. Sharron, L. J. Montaner, D. Weissman, and R. W. Doms. 1999.
Quantification of CD4, CCR5, and CXCR4 levels on lymphocyte subsets,dendritic cells, and differentially conditioned monocyte-derived macro-phages. Proc. Natl. Acad. Sci. U. S. A. 96:5215–5220.
28. Levy, D. N., G. M. Aldrovandi, O. Kutsch, and G. M. Shaw. 2004. Dynamicsof HIV-1 recombination in its natural target cells. Proc. Natl. Acad. Sci.U. S. A. 101:4204–4209.
29. Lin, Y. L., et al. 2002. Cell surface CCR5 density determines the postentryefficiency of R5 HIV-1 infection. Proc. Natl. Acad. Sci. U. S. A. 99:15590–15595.
30. Liu, Z., et al. 1997. Elevated CD38 antigen expression on CD8� T cells is astronger marker for the risk of chronic HIV disease progression to AIDS anddeath in the Multicenter AIDS Cohort Study than CD4� cell count, solubleimmune activation markers, or combinations of HLA-DR and CD38 expres-sion. J. Acquir. Immune Defic. Syndr. Hum. Retrovirol. 16:83–92.
31. Maenetje, P., et al. 2010. A steady state of CD4� T cell memory maturationand activation is established during primary subtype C HIV-1 infection.J. Immunol. 184:4926–4935.
32. Meditz, A. L., et al. 2008. SDF-1alpha is a potent inducer of HIV-1-specificCD8� T-cell chemotaxis, but migration of CD8� T cells is impaired at highviral loads. AIDS Res. Hum. Retroviruses 24:977–985.
33. Morner, A., et al. 1999. Primary human immunodeficiency virus type 2(HIV-2) isolates, like HIV-1 isolates, frequently use CCR5 but show pro-miscuity in coreceptor usage. J. Virol. 73:2343–2349.
34. Murray, S. M., et al. 2010. Reduction of immune activation with chloroquinetherapy during chronic HIV infection. J. Virol. 84:12082–12086.
35. Nokta, M. A., et al. 2001. Chemokine/CD4 receptor density ratios correlatewith HIV replication in lymph node and peripheral blood of HIV-infectedindividuals. AIDS 15:161–169.
36. Platt, E. J., K. Wehrly, S. E. Kuhmann, B. Chesebro, and D. Kabat. 1998.Effects of CCR5 and CD4 cell surface concentrations on infections by mac-rophagetropic isolates of human immunodeficiency virus type 1. J. Virol.72:2855–2864.
37. Read, S. W., et al. 2010. The effect of leflunomide on cycling and activationof T-cells in HIV-1-infected participants. PLoS One 5:e11937.
38. Reeves, J. D., et al. 2002. Sensitivity of HIV-1 to entry inhibitors correlateswith envelope/coreceptor affinity, receptor density, and fusion kinetics. Proc.Natl. Acad. Sci. U. S. A. 99:16249–16254.
39. Reynes, J., et al. 2001. CD4 T cell surface CCR5 density as a host factor inHIV-1 disease progression. AIDS 15:1627–1634.
40. Rouet, F., et al. 2005. Transfer and evaluation of an automated, low-costreal-time reverse transcription-PCR test for diagnosis and monitoring ofhuman immunodeficiency virus type 1 infection in a West African resource-limited setting. J. Clin. Microbiol. 43:2709–2717.
41. Saba, E., et al. 2010. HIV-1 sexual transmission: early events of HIV-1infection of human cervico-vaginal tissue in an optimized ex vivo model.Mucosal Immunol. 3:280–290.
42. Schacker, T., et al. 2001. Productive infection of T cells in lymphoid tissuesduring primary and early human immunodeficiency virus infection. J. Infect.Dis. 183:555–562.
43. Schindler, M., et al. 2003. Down-modulation of mature major histocompat-ibility complex class II and up-regulation of invariant chain cell surfaceexpression are well-conserved functions of human and simian immunodefi-ciency virus nef alleles. J. Virol. 77:10548–10556.
44. Sodora, D. L., and G. Silvestri. 2008. Immune activation and AIDS patho-genesis. AIDS 22:439–446.
45. Spiegel, H., H. Herbst, G. Niedobitek, H. D. Foss, and H. Stein. 1992.Follicular dendritic cells are a major reservoir for human immunodeficiencyvirus type 1 in lymphoid tissues facilitating infection of CD4� T-helper cells.Am. J. Pathol. 140:15–22.
46. Stumptner-Cuvelette, P., et al. 2001. HIV-1 Nef impairs MHC class IIantigen presentation and surface expression. Proc. Natl. Acad. Sci. U. S. A.98:12144–12149.
47. Tenner-Racz, K., and P. Racz. 1995. Follicular dendritic cells initiate andmaintain infection of the germinal centers by human immunodeficiencyvirus. Curr. Top. Microbiol. Immunol. 201:141–159.
48. Wang, J. M., et al. 1998. HIV-1 envelope gp120 inhibits the monocyteresponse to chemokines through CD4 signal-dependent chemokine receptordown-regulation. J. Immunol. 161:4309–4317.
49. Yang, O. O., et al. 2005. Effects of HIV-1 infection on lymphocyte pheno-types in blood versus lymph nodes. J. Acquir. Immune Defic. Syndr. 39:507–518.
50. Zhang, Z., et al. 1999. Sexual transmission and propagation of SIV and HIVin resting and activated CD4� T cells. Science 286:1353–1357.
51. Zhang, Z. Q., et al. 2004. Roles of substrate availability and infection ofresting and activated CD4� T cells in transmission and acute simian immu-nodeficiency virus infection. Proc. Natl. Acad. Sci. U. S. A. 101:5640–5645.
10200 MEDITZ ET AL. J. VIROL.
on May 27, 2018 by guest
http://jvi.asm.org/
Dow
nloaded from