hkscan corporation q2 interim report 2010 · boguslaw miszczuk eur 1 037.4m
TRANSCRIPT

HKScan Corporation Q2 Interim report 2010
CEO Matti Perkonoja Media and investor briefing 10 August 2010

2
HKScan’s mission and vision Mission statement:
MEAT AND MOREHKScan is a responsible food company which creates economic value added for its stakeholders through its meat-based productportfolio, food concepts and tasty products that are designed to contribute to the lives of consumers by making cooking easy and enjoyable.
Vision:
MEAT INDUSTRY SHAPERHKScan is a responsible food company which sets the standard for best practices in the meat industry in Europe through strong brands, innovative products, an efficient and transparent production chain and skilled employees.

03/2009 3
St Petersburg
Outokumpu
Vantaa
EuraSäkylä
Turku TallinnRakvereStockholm
Riga
Vilnius
Örebro
LinköpingSkara
VisbyHalmstad
StrövelstorpKristianstad
Bjæverskov
Swinoujscie
PoznanWarsaw
Czyzew
SokolowKolo
JaroslawTarnowDebica
Ullånger
Luuleå
Surrey
Viiratsi
HKScan CorporationNet sales in 2009: EUR : 2 124.7m*, CEO Matti Perkonoja
Finland Sweden Baltics Poland
net salesin 2009: EUR 156.9m
• AS Rakvere
Lihakombinaat
Managing director
Anne Mere
• AS Tallegg
Managing director
Teet Soorm
net salesin 2009:EUR 251.7m**
• Saturn Nordic
Holding AB
Sokolów S.A.
Managing director
Boguslaw Miszczuk
net salesin 2009:EUR 1 037.4m
• Scan AB
Managing director
Denis Mattsson
net salesin 2009:EUR 732.5m
• HKScan
Finland Oy
Managing
director
Jari Leija
Group structure
* Between segments EUR -53.9 million** Joint venture Saturn Nordic Holding owned 50/50 by HKScan and Danish Crown holds 100% of shares in Sokolów. In 2009, half of Sokolów’s net sales i.e. EUR 251.7 million were accounted for in HKScan Group figures.
Sales office
Production facility
ForssaMellilä
Skellefteå

03/2009 4
Outokumpu
Vantaa
EuraSäkylä
Turku TallinnRakvere
Riga
Vilnius
Örebro
LinköpingSkara
VisbyHalmstad
StrövelstorpKristianstad
Bjæverskov
Swinoujscie
PoznanWarsaw
Czyzew
SokolowKolo
JaroslawTarnowDebica
Ullånger
Luuleå
Surrey
Viiratsi
Sales office
Production facility
ForssaMellilä
Skellefteå
Group structure
Finland Sweden Baltics Poland
Business processes
Business processes
Business processes
HKScan Corporation
Support processes
Support processesSt Petersburg
Stockholm

5
HKScan Corporation
Q2/ 2010
Q2/ 2009
Q1-Q2/ 2010
Q1-Q2/ 2009
2009
Net sales, EUR mill. 502.3 541.6 985.9 1 033.6 2 124.7 EBIT, EUR mill. 8.1 14.3 13.6 22.5 55.1 - EBIT margin, % 1.6 2.6 1.4 2.2 2.6 Profit before taxes 5.0 9.4 8.9 11.1 37.3 EPS, EUR 0.07 0.16 0.13 0.15 0.64
• The profitability of the HKScan Group continued to develop in Sweden and the Baltics and especially in Poland.
• In Finland, the industrial action in April/May had a considerable impact on earnings in the early part of the year.
• Group EBIT for the entire first half of the year fell short of 2009 and stood at EUR 13.6 million (EUR 22.5m).
• Group net sales were EUR 985.9 million (EUR 1 033.6m). The lower net sales are attributable to lower sales volume caused in turn mainly by the labour market disputes in Finland and the cattle shortage in Sweden.
• The company reaffirms its earnings guidance given in the Q1 interim report. Full-year EBIT exclusive of non-recurring items is estimated to fall somewhat short of the level seen in 2009.
M.Perkonoja 10.8.2010

Group EBIT Bridge, Reported EBIT – Q2 /2009 vs. Q2 /2010
Net effect EUR -6.2 million
M€

Group EBIT Bridge, Reported EBIT – Q1-Q2 /2009 vs. Q1-Q2 /2010
Net effect EUR -8.9 million
M€

8
Exchange rate trends
3,0
3,5
4,0
4,5
5,0
2.1.
2008
8.2.
2008
18.3
.200
828
.4.2
008
5.6.
2008
14.7
.200
820
.8.2
008
26.9
.200
84.
11.2
008
11.1
2.20
0822
.1.2
009
2.3.
2009
8.4.
2009
23.7
.200
931
.8.2
009
7.10
.200
916
.11.
2009
23.1
2.20
092.
2.20
1010
.3.2
010
20.4
.201
027
.5.2
010
5.7.
2010
Euron arvo zlotyina, PLNEuro against the Swedish crown, SEK
08/2010
Euro against the Polish zloty, PLN
Source: European Central Bank

9
Market area: Finland
Q2/ 2010
Q2/ 2009
Q1-Q2/ 2010
Q1-Q2/ 2009
2009
Net sales, EUR mill. 173.5 190.2 341.3 365.5 732.5 EBIT, EUR mill. -0.1 6.7 -0.7 12.9 27.0 - EBIT margin, % -0.1 3.5 -0.2 3.5 3.7
• The industrial action in the food industry taking place in April/May had a clear depressive effect on sales and earnings in the business segment of Finland in Q2. The negative earnings impact of the industrial action is estimated at roughly EUR -0.5 million per day. The effects will continue into Q3.
• Q2 EBIT in Finland was in the red at EUR -0.1 million (EUR 6.7m).
• In Finland:- The amended EU marketing standard for poultry meat will in the long run strengthen the market standing of locally
produced fresh poultry meat.- The earnings development seen in the early part of the year has brought forward the implementation of business chain
development projects in Finland.- HK Ruokatalo will centralize meat procurement, primary production and feed trade into a single company at the
beginning of 2011.- On 24 June 2010, HKScan Finland Oy and Järvi-Suomen Portti Oy agreed on plans to establish a new company to carry
on the production of processed meats at Portti’s current plant in Mikkeli. The planned transaction includes the production machinery at the Tikkala plant as well as Järvi-Suomen Portti’s brands. The arrangement is subject to the approval of the Finnish Competition Authority.
- The four-year collective agreement concluded in May and the ensuing duty to maintain industrial peace provide a foundation for the stable development of operations
M.Perkonoja 10.8.2010

10
• In Sweden, net sales declined when measured in both euro and krona due to e.g. delivery issues resulting from the cattle shortage and the ramp-up of the logistics centre.
• EBIT for the quarter came in at EUR 3.1 million (EUR 3.0m).
• In Sweden:- The short supply of Swedish beef cattle hampered earnings development in the market area.- The industrial restructuring launched in September 2009 at Scan is proceeding on schedule and according to
plans: in Q2, the consumer-packed meat facility has been transferred from Uppsala to Linköping, where the new logistics centre is also at the ramp-up stage.
- The restructuring will in Q3 continue to give rise to additional expenditure relating to logistics and production transfers.
- In early June, Scan AB signed an agreement to sell its production facility in Visby on the island of Gotland to a new company, Gotlands Slagteri AB, which is to start up in September 2010. The company is owned by Svenskt Butikskött and Scan AB with holdings of 75 and 25 percent, respectively. At the same time, Scan will take a 25-percent stake in Svenskt Butikskött.
Q2/
2010 Q2/
2009 Q1-Q2/
2010 Q1-Q2/
2009
2009
Net sales, EUR mill. 241.9 264.5 472.3 502.9 1 037.4
EBIT, EUR mill. 3.1 3.0 5.7 5.1 16.7
- EBIT margin, % 1.3 1.1 1.2 1.0 1.6
M.Perkonoja 10.8.2010
Market area: Sweden

11
Q2/
2010 Q2/
2009 Q1-Q2/
2010 Q1-Q2/
2009
2009
Net sales, EUR mill. 40.2 40.9 76.0 78.2 156.9
EBIT, EUR mill. 3.3 3.5 4.3 4.5 9.8
- EBIT margin, % 8.1 8.6 5.7 5.8 6.3
• The business environment in the Baltics continued to present a challenge due to
recession, intensifying competition and erosion in consumer purchasing power.
• The net sales of HKScan’s Baltic Group in the second quarter were in line with the previous year. Second-quarter earnings were EUR 3.3 million (EUR 3.5 million).
• In the Baltics:- Rakvere Lihakombinaat and Tallegg maintained their competitiveness through adaptation of the product
portfolio and tight cost control. - HKScan’s Baltic Group delivered an EBIT margin of 8.1% (8.6%).- AS Rigas Miesnieks signed in March an agreement on acquiring a holding in excess of 90 percent in the
Latvian AS Jelgavas Galas Kombinats. The deal was approved by the Latvian competition authorities in late June. In order to streamline operations in Latvia, the sales and logistics functions of Rigas Miesnieks and Jelgavas Galas Kombinats will be consolidated as of September. Most of the production-related activities in Riga will be transferred to Jelgava’s plant in the coming year. The company’s dispatching department and administration will remain in Riga.
M.Perkonoja 10.8.2010
Market area: Baltics

12
*) Q2/
2010 Q2/
2009 Q1-Q2/
2010 Q1-Q2/
2009
2009
Net sales, EUR mill. 66.0 60.9 129.9 117.3 251.7
EBIT, EUR mill. 4.0 2.5 8.3 4.1 9.3
- EBIT margin, % 6.1 4.1 6.4 3.5 3.7
*) The figures refer to HKScan’s share (50%) of the figures of the Sokolów Group.
• In Poland, Sokolów’s Q2 net sales grew by 8.3 percent from the corresponding period in 2009 when measured in euro but fell by 2.4 percent when measured in zloty.
• The decline in net sales was attributable to:• sales prices of meat depressed by intense competition• spring floods in Poland
• Q2 EBIT increased to EUR 4.0 million (EUR 2.5m in 2009):• robust progress in modern retail chains• accomplished cost control• good subsidiary performance • momentum in exports
• Sokolów’s profitability has climbed to a new high in the first half of the year and the company exceeds the Group’s long-term EBIT target.
M.Perkonoja 10.8.2010
Market area: Poland

13
Finland33.3%
Baltics 7.7%
Finland -1.2%
Baltics 31.9%
Poland 12.6%
Sweden 46.4%
Sweden 30.0%Poland
39.3%
Breakdown of net sales and EBIT Q2/2010
* shares calculated including internal sales * shares calculated exclusive of Group administration costs
Net sales EUR 502.3 million EBIT EUR 8.1 million

14
Finland 33.5%
Baltics 7.5%
Finland -4.2%
Baltics 24.6%
Poland 12.7%
Sweden 46.3%
Sweden 32.6%Poland
47.0%
Breakdown of net sales and EBIT Q1-Q2 /2010
* shares calculated including internal sales * shares calculated exclusive of Group administration costs
Net sales EUR 985.9 million EBIT EUR 13.6 million

15
Quarterly EBIT* developmentMeur
M.Perkonoja 10.8.2010
* reported

16
Consumer demand for food is still expected to remain steady in the Group’s home markets and export markets are anticipated to pick up somewhat towards the end of the year. Business streamlining programmes, in particular the progress of the restructuring programme in Sweden and the launch of the streamlining programme planned in Finland, provide the foundation for the stronger development of the Group’s competitiveness and profitability. Improved profitability furthermore requires the business in Finland to be restored from the effects of the labour market disturbances.
This anticipation of the future gains further support from the good performance of segments of the Baltics and Poland, which in part serves to even out the earnings development of the entire Group.
With performance in the first half of the year falling markedly short of the same a year ago, the Group’s full-year EBIT exclusive of non-recurring items is estimated to be at a level somewhat lower than in 2009.
M.Perkonoja 10.8.2010
Future outlook

17
(EUR million) Q2/2010 Q2/2009 Q1-Q2/
2010 Q1-Q2/
2009 2009
NET SALES 502.3 541.6 985.9 1 033.6 2 124.7 Operating income and expenses -479.9 -513.7 -944.0 -984.0 -2 013.3 Share of associates’ results 0.3 0.1 0.8 0.2 0.9 Depreciation and impairment -14.5 -13.6 -29.1 -27.2 -57.2 EBIT 8.1 14.3 13.6 22.5 55.1 - % of net sales 1.6 2.6 1.4 2.2 2.6 Financial income 1.3 1.3 3.5 3.1 5.2 Financial expenses -4.9 -6.8 -9.7 -15.4 -24.9 Share of associates’ results 0.5 0.6 1.5 0.9 2.0 PROFIT / LOSS BEFORE TAXES 5.0 9.4 8.9 11.1 37.3 - % of net sales 1.0 1.7 0.9 1.1 1.8 Income tax -0.8 -0.9 -0.6 -2.2 -4.9 PROFIT / LOSS FOR THE PERIOD 4.3 8.5 8.3 8.9 32.5 PROFIT / LOSS FOR THE PERIOD
ATTRIBUTABLE TO:
Equity holders of the parent 3.6 7.5 7.0 7.6 29.9 Minority interests 0.7 1.0 1.2 1.3 2.6 TOTAL 4.3 8.5 8.3 8.9 32.5 Earnings/share, continuing operations,
EUR
0.07
0.16
0.13
0.15
0.64
HKScan income statement

18
(EUR million) Q2/2010 Q2/2009 Q1-Q2
/2010 Q1-Q2/
2009 2009
Profit / loss for the period 4.3 8.5 8.3 8.9 32.5 OTHER COMPREHENSIVE INCOME (after taxes) Exchange differences on translating foreign
operations
-0.2
2.8 7.0
-3.6 1.8 Available-for-sale investments -0.4 0.1 0.0 -0.1 0.4 Cash flow hedging -1.1 1.0 -3.9 0.4 -7.1 TOTAL OTHER COMPREHENSIVE INCOME -1.7 3.9 3.1 -3.3 -4.8 TOTAL COMPREHENSIVE INCOME FOR THE PERIOD 2.6 12.4 11.4 5.6 27.6 COMPREHENSIVE INCOME FOR THE PERIOD
ATTRIBUTABLE TO:
Equity holders of the parent 1.9 11.2 9.9 4.3 24.8 Minority interests 0.7 1.2 1.5 1.3 2.8 Total 2.6 12.4 11.4 5.6 27.6
HKScan statement of comprehensive income

19
(EUR million) 30.6.2010 30.6.2009 31.12.2009 ASSETS
Non-current assets
Intangible assets 69.2 60.7 65.7
Goodwill 90.9 83.7 88.2
Tangible assets 482.3 467.5 469.1
Holdings in associates 22.7 19.0 20.9
Trade and other receivables 20.6 19.8 18.2
Available-for-sale investments 11.3 10.0 10.5
Deferred tax asset 13.2 9.7 12.3
Total non-current assets 710.2 670.4 685.0
Current assets
Inventories 134.0 133.1 118.7
Trade and other receivables 207.4 202.4 194.3
Income tax receivable 2.2 1.4 0.2
Other financial assets 2.2 2.2 2.0
Cash and cash equivalents 68.6 57.8 73.9
Total current assets 414.4 396.9 389.0
TOTAL ASSETS 1 124.6 1 067.2 1 074.0
Consolidated balance sheet

20
(EUR million) 30.6.2010 30.6.2009 31.12.2009 EQUITY AND LIABILITIES Equity attributable
to equity holders of the parent 386.6 312.3 389.3
Minority interest 9.4 5.3 9.4 Total shareholders’ equity 396.1 317.6 398.7 Deferred tax liability 32.5 33.5 32.2 Non-current interest-bearing liabilities 352.1 430.4 329.9 Non-current non-interest bearing liabilities 5.0 4.7 5.9 Pension commitments 3.5 3.6 3.6 Non-current provisions 2.8 3.2 8.5 Non-current liabilities 395.9 475.3 380.1 Current interest-bearing liabilities 113.5 65.2 87.5 Trade and other payables 213.3 206.1 202.0 Income tax liability 2.8 0.3 2.7 Current provisions 3.1 2.6 2.8 Current liabilities 332.7 274.3 295.1 EQUITY AND LIABILITIES 1 124.6 1 067.2 1 074.0
M.Perkonoja 10.8.2010
Consolidated balance sheet

M.Perkonoja 27.2.2009 21
(EUR million) 30.6.2010 30.6.2009 2009 Operating activities EBIT and depreciation (incl. adjustments) 42.1 47.7 111.9 Change in provisions -5.8 2.6 7.6 Change in net working capital -25.4 -8.7 2.5 Financial income and expenses -6.2 -12.3 -19.7 Taxes -0.6 -2.2 -4.9 Net cash flow from operating activities 4.1 27.1 97.4 Investing activities Gross investments in PPE -35.7 -26.0 -43.7 Disposals of PPE 2.3 1.5 2.9 Investments in subsidiary 0.0 -0.3 -4.7 Shares in associates acquired 0.0 0.0 -0.3 Loans granted and repaid -0.2 0.2 5.1 Net cash flow from investing activities -33.6 -24.6 -40.8 Cash flow before financing activities -29.5 2.5 56.6 Financing activities Proceeds from share offering 0.0 0.0 76.8 Repayments of hydbrid bond 0.0 0,0 -20.0 Loans raised and repaid 34.2 -25.3 -121.8 Interest on hybrid bond 0.0 -1.3 -2.1 Dividends paid -12.0 -9.4 -9.4 Purchases of own shares 0.0 0.0 0.0 Net cash flow from financing activities 22.1 -36.0 -76.5 Change in cash and cash equivalents -7.4 -33.5 -19.9
Cash flow statement

Cash flows after investments 2005-2010
Meu
r
2005 2006 2007 2008 2009 Q1-Q2Q2Q1
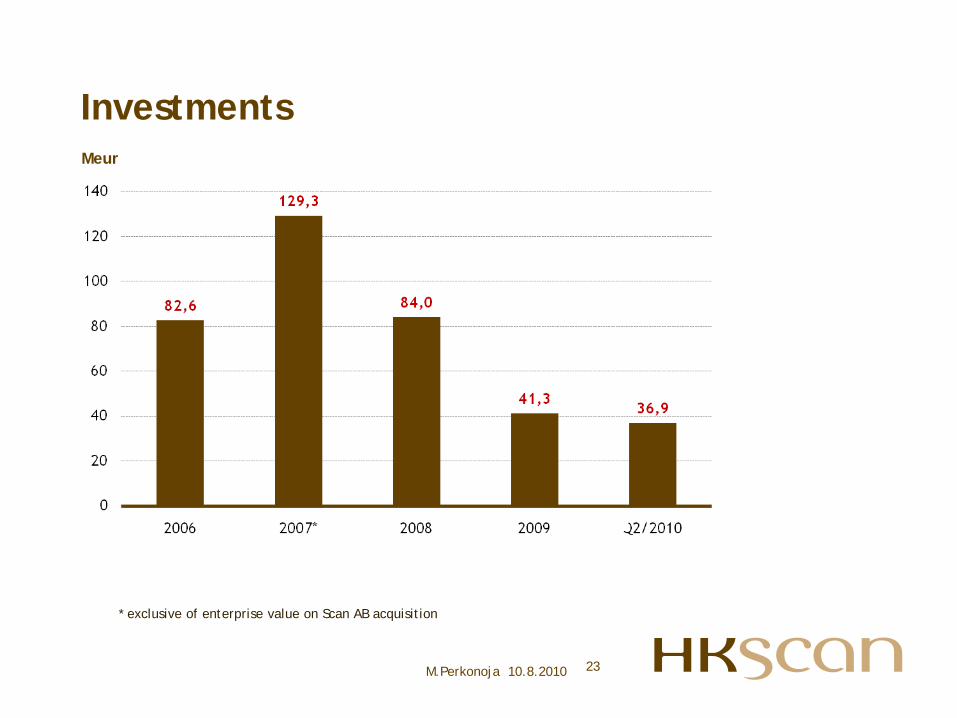
23
Meur
M.Perkonoja 10.8.2010
Investments
* exclusive of enterprise value on Scan AB acquisition

24
30.6.2010 30.6.2009 2009 EPS, diluted, EUR 0.13 0.15 *) 0.64 Equity / share, 30.6., EUR *) 7.16 7.00 7.21 Equity ratio, % 35.2 29.8 37.1 Average no. of shares, mill. - average in period 54.0 39.3 44.9 Production-related investment, EUR mill. 36.9 24.5 41.3 Average no. of employees 7 136 7 265 7 429 *)
Per-data share for the comparison year has been adjusted for the 2009 share offering.
M.Perkonoja 10.8.2010
Financial highlights

25
Financial targets and target achievement 2006 – Q2/2010
Target Achievement
Q1-Q2/ 2010
2009
2008
2007
2006
EBIT over 5% of net sales 1.4 2.6 1.7 2.6 4.3
Return on equity over 15% 4.2 9.0 2.3 9.2 11.9 Equity ratio over 40% 35.2 37.1 29.5 29.3 43.7 Dividend
distribution at least 30%
of net earnings 34.5 199.3 37.7 34.2
M.Perkonoja 10.8.2010

26