hiv coinfections, malignancies, and comorbidities
DESCRIPTION
HIV Coinfections, Malignancies, and Comorbidities. HIV Coinfections, Malignancies, and Comorbidities. HIV-hepatitis C coinfection HIV-hepatitis B coinfection Hepatotoxicity, HIV-hep coinfection, and antiretroviral therapy HIV-related malignancies Psychiatric concerns in persons with HIV. - PowerPoint PPT PresentationTRANSCRIPT

HIV Coinfections, Malignancies, HIV Coinfections, Malignancies, andand
ComorbiditiesComorbidities

HIV Coinfections, Malignancies, HIV Coinfections, Malignancies, andand
ComorbiditiesComorbidities HIV-hepatitis C coinfectionHIV-hepatitis C coinfection
HIV-hepatitis B coinfectionHIV-hepatitis B coinfection
Hepatotoxicity, HIV-hep coinfection, and Hepatotoxicity, HIV-hep coinfection, and antiretroviral therapyantiretroviral therapy
HIV-related malignanciesHIV-related malignancies
Psychiatric concerns in persons with HIVPsychiatric concerns in persons with HIV
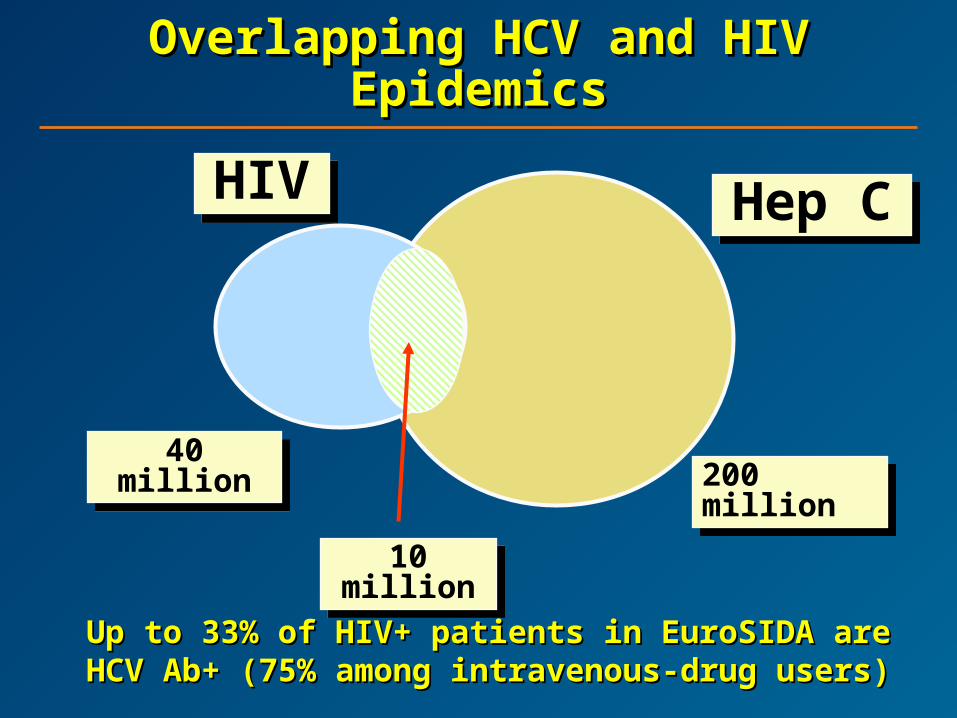
Overlapping HCV and HIV Overlapping HCV and HIV EpidemicsEpidemics
Up to 33% of HIV+ patients in EuroSIDA are Up to 33% of HIV+ patients in EuroSIDA are HCV Ab+ (75% among intravenous-drug HCV Ab+ (75% among intravenous-drug
users)users)
40 million40 million200 million200 million
10 million10 million
HIVHIV Hep CHep C

Variables to Consider Before Variables to Consider Before Initiating HCV Therapy in HIV+ Initiating HCV Therapy in HIV+
PatientsPatients HIV-related:HIV-related:
– CD4CD4– HIV RNAHIV RNA– Antiretroviral therapyAntiretroviral therapy
Liver-related:Liver-related:– GenotypeGenotype– HCV loadHCV load– TransaminasesTransaminases– HistologyHistology
Others:Others:– Neuropsychiatric historyNeuropsychiatric history– Drug addiction and alcohol consumptionDrug addiction and alcohol consumption
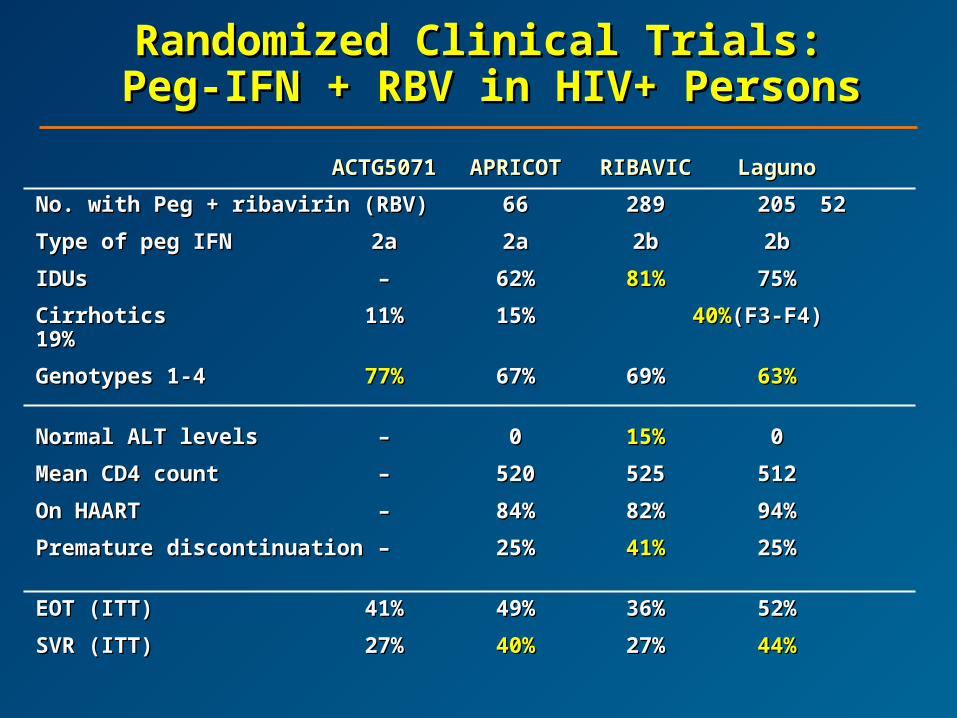
Randomized Clinical Trials:Randomized Clinical Trials: Peg-IFN + RBV in HIV+ Persons Peg-IFN + RBV in HIV+ Persons
ACTG5071ACTG5071 APRICOTAPRICOT RIBAVICRIBAVIC LagunoLaguno
No. with Peg + ribavirin (RBV)No. with Peg + ribavirin (RBV) 6666 289289 205205 5252
Type of peg IFNType of peg IFN 2a2a 2a2a 2b2b 2b2b
IDUsIDUs –– 62%62% 81%81% 75%75%
CirrhoticsCirrhotics 11%11% 15%15% 40%40%(F3-F4)(F3-F4) 19%19%
Genotypes 1-4Genotypes 1-4 77%77% 67%67% 69%69% 63%63%
Normal ALT levelsNormal ALT levels –– 00 15%15% 00
Mean CD4 countMean CD4 count –– 520520 525525 512512
On HAARTOn HAART –– 84%84% 82%82% 94%94%
Premature discontinuationPremature discontinuation –– 25%25% 41%41% 25%25%
EOT (ITT)EOT (ITT) 41%41% 49%49% 36%36% 52%52%
SVR (ITT)SVR (ITT) 27%27% 40%40% 27%27% 44%44%
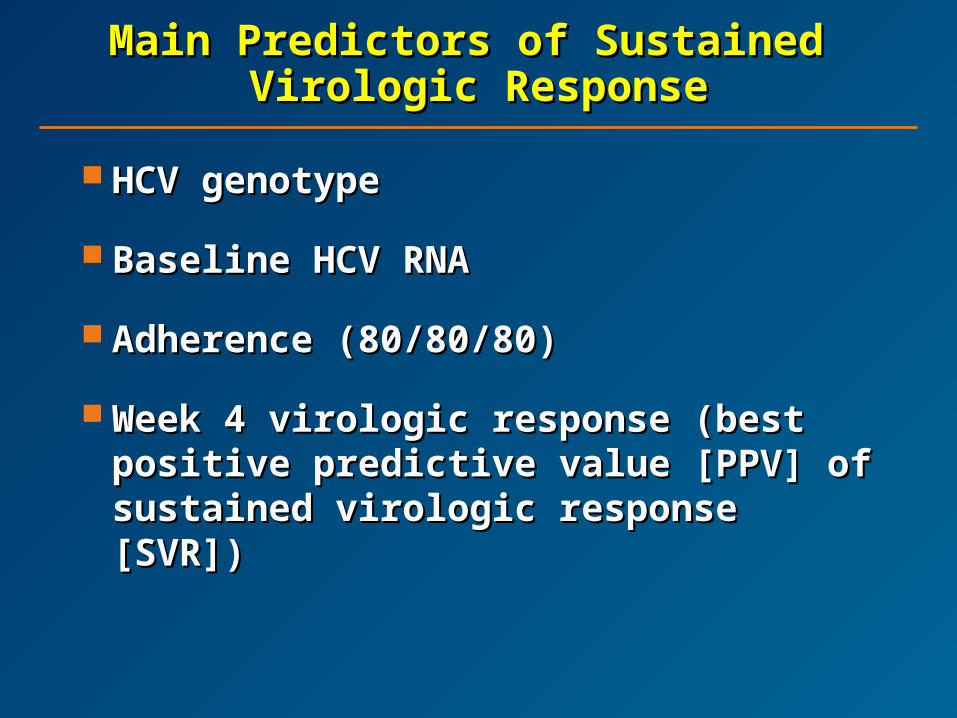
Main Predictors of Sustained Main Predictors of Sustained Virologic ResponseVirologic Response
HCV genotypeHCV genotype
Baseline HCV RNABaseline HCV RNA
Adherence (80/80/80)Adherence (80/80/80)
Week 4 virologic response (best positive Week 4 virologic response (best positive predictive value [PPV] of sustained predictive value [PPV] of sustained virologic response [SVR])virologic response [SVR])
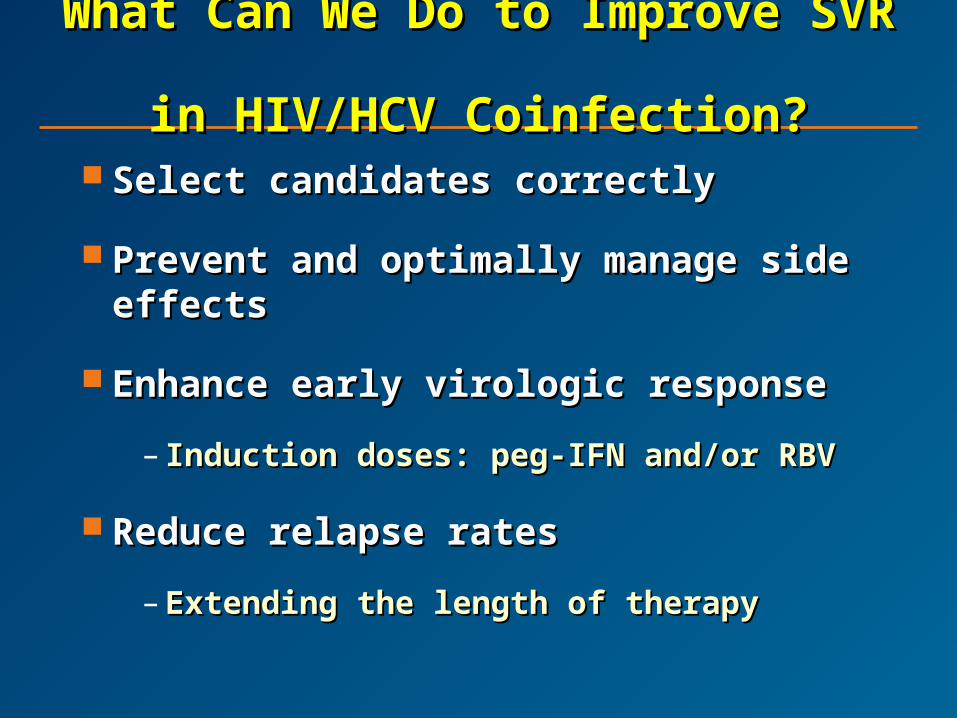
What Can We Do to Improve What Can We Do to Improve SVR SVR
in HIV/HCV Coinfection?in HIV/HCV Coinfection? Select candidates correctlySelect candidates correctly
Prevent and optimally manage side effectsPrevent and optimally manage side effects
Enhance early virologic responseEnhance early virologic response
– Induction doses: peg-IFN and/or RBVInduction doses: peg-IFN and/or RBV
Reduce relapse ratesReduce relapse rates
– Extending the length of therapyExtending the length of therapy
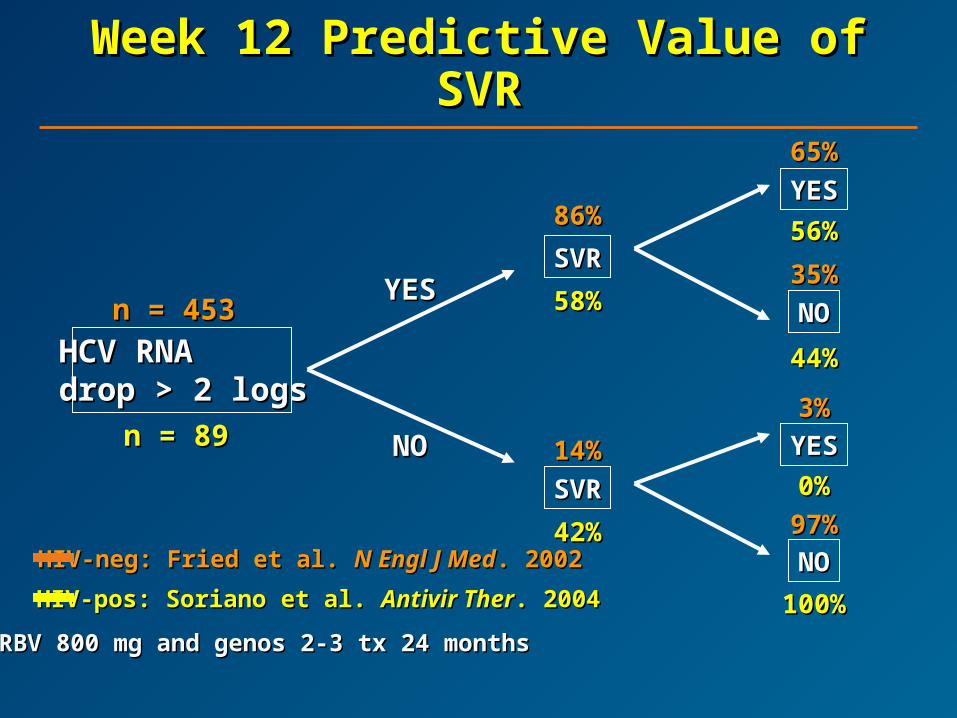
Week 12 Predictive Value of Week 12 Predictive Value of SVRSVR
HCV RNAHCV RNAdrop > 2 logsdrop > 2 logs
n = 453n = 453
n = 89n = 89
SVRSVR
SVRSVR
YESYES
NONO
YESYES
NONO
86%86%
58%58%
14%14%
42%42%
YESYES
NONO
65%65%
56%56%
35%35%
44%44%
3%3%
0%0%
97%97%
100%100%
HIV-neg: Fried et al. HIV-neg: Fried et al. N Engl J MedN Engl J Med. 2002. 2002
HIV-pos: Soriano et al. HIV-pos: Soriano et al. Antivir TherAntivir Ther. 2004. 2004
RBV 800 mg and genos 2-3 tx 24 monthsRBV 800 mg and genos 2-3 tx 24 months

PRESCO Trial: DesignPRESCO Trial: Design
Study WeeksStudy Weeks00 9696727248482424 6060 8484
Peg
-IF
N +
RB
V
Peg
-IF
N +
RB
V
1000
-120
0 m
g/d
ay10
00-1
200
mg
/day
1212 3636
Follow-upFollow-up
G2,3G2,3
G1,4G1,4
G1,4G1,4
G2,3G2,3
Follow-upFollow-up
Follow-upFollow-up
Follow-upFollow-up
Only patients who achieved EVR (>2 log drop in HCV RNA at week 12) continued treatment.Only patients who achieved EVR (>2 log drop in HCV RNA at week 12) continued treatment.
N =
391
N =
391

13%
40%
68%
34%
46%
69%
0
10
20
30
40
50
60
70
80
>1 log >2 log Neg (<10 IU/mL)
Week 4
HC
V R
NA
Dro
p (
% P
atie
nts
) APRICOT (n=176)
PRESCO (n=94)
APRICOT (800 mg/day) vs PRESCO APRICOT (800 mg/day) vs PRESCO (1000–1200 mg/day): G1 Week 4 (1000–1200 mg/day): G1 Week 4
ResponseResponse
Ramos et al. Ramos et al. Antivir TherAntivir Ther. 2006 (in press). 2006 (in press)
On-treatment analysisOn-treatment analysis

Week 4 Virologic ResponseWeek 4 Virologic ResponseAccording to HIV Status and RBV According to HIV Status and RBV
Dose Dose Study No. Week 4 >1 log reduction
in HCV-RNA >2 log reduction in HCV-RNA
Negative serum HCV-RNA
HCV genotype 1
PRESCO 94 69.2 46.2 33.8 Fried 298 78.8 55.3 31.2 APRICOT 176 68 40 13 HCV genotype 3
PRESCO 70 93.8 89.6 85.4 Fried 140 95 90.7 84.2 APRICOT 95 87 80 37 HCV genotype 4
PRESCO 18 57.1 50 28.6 Fried 15 93.3 66.6 60 APRICOT 16 56 19 13
PRESCO: HIV+ and RBV high Fried: HIV-neg and RBV high APRICOT: HIV+ and RBV lowPRESCO: HIV+ and RBV high Fried: HIV-neg and RBV high APRICOT: HIV+ and RBV low
Clinical InterpretationClinical Interpretation
HIV negativelyHIV negatively affectsaffects the early virologic the early virologic response to HCV therapyresponse to HCV therapy
Prescription of appropriate Prescription of appropriate (high) RBV doses(high) RBV doses increase early virologic response mainly increase early virologic response mainly in genotypes 1 and 4, but also in genotypes 2 in genotypes 1 and 4, but also in genotypes 2 and 3and 3

SHORT STATEMENT OF THE FIRST EUROPEAN CONSENSUSCONFERENCE ON THE TREATMENT OF CHRONIC
HEPATITIS C AND B IN HIV CO-INFECTED PATIENTS1–2 March, 2005, Paris, France
The ECC Jury
J Hepatol 2005;42:615-24.

HIV Coinfections, Malignancies, HIV Coinfections, Malignancies, andand
ComorbiditiesComorbidities HIV-hepatitis C coinfectionHIV-hepatitis C coinfection
HIV-hepatitis B coinfectionHIV-hepatitis B coinfection
Hepatotoxicity, HIV-hep coinfection, and Hepatotoxicity, HIV-hep coinfection, and antiretroviral therapyantiretroviral therapy
HIV-related malignanciesHIV-related malignancies
Psychiatric concerns in persons with HIVPsychiatric concerns in persons with HIV
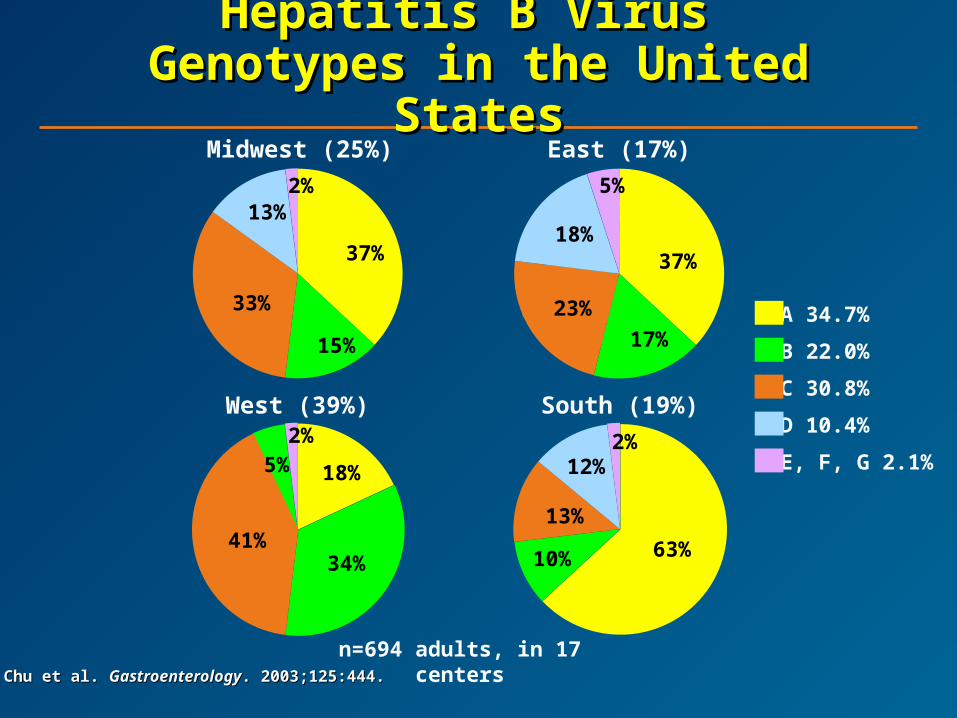
Chu et al. Chu et al. GastroenterologyGastroenterology. 2003;125:444.. 2003;125:444.
A 34.7%
B 22.0%
C 30.8%
D 10.4%
E, F, G 2.1%
Midwest (25%) East (17%)
n=694 adults, in 17 centers
Hepatitis B Virus Hepatitis B Virus Genotypes in the United StatesGenotypes in the United States
10%
13%
12%
37%
15%
33%
13%2%
37%
17%
23%
18%
5%
South (19%)West (39%)
18%
34%41%
5%2%
63%
2%

Sequelae of Chronic HBV Sequelae of Chronic HBV InfectionInfection
Hepatocellular carcinoma (HCC)Hepatocellular carcinoma (HCC)
– ~500,000 deaths annually worldwide~500,000 deaths annually worldwide11
– ~50% of cases associated with HBV infection~50% of cases associated with HBV infection11
Viral factors linked to greater risk of HCC Viral factors linked to greater risk of HCC include HBeAg positivity, serum HBV DNA include HBeAg positivity, serum HBV DNA levels >10levels >1055 copies/mL, and genotype C copies/mL, and genotype C22
Risk of HCC increase based on HBV DNA Risk of HCC increase based on HBV DNA levels, even in patients with normal ALT at levels, even in patients with normal ALT at baselinebaseline33
1. Parkin DM, et al.1. Parkin DM, et al. Int J Cancer Int J Cancer. 2001;94:153-156. . 2001;94:153-156. 2. Yu MW, et al. 2. Yu MW, et al. J Natl Cancer InstJ Natl Cancer Inst. 2005;97:265-272.. 2005;97:265-272.3. Iloeje UH, et al. 3. Iloeje UH, et al. J HepatolJ Hepatol. 2005;42:16S [Abstract 495].. 2005;42:16S [Abstract 495].
% W
ith
dis
ease
pro
gre
ssio
n%
Wit
h d
isea
se p
rog
ress
ion
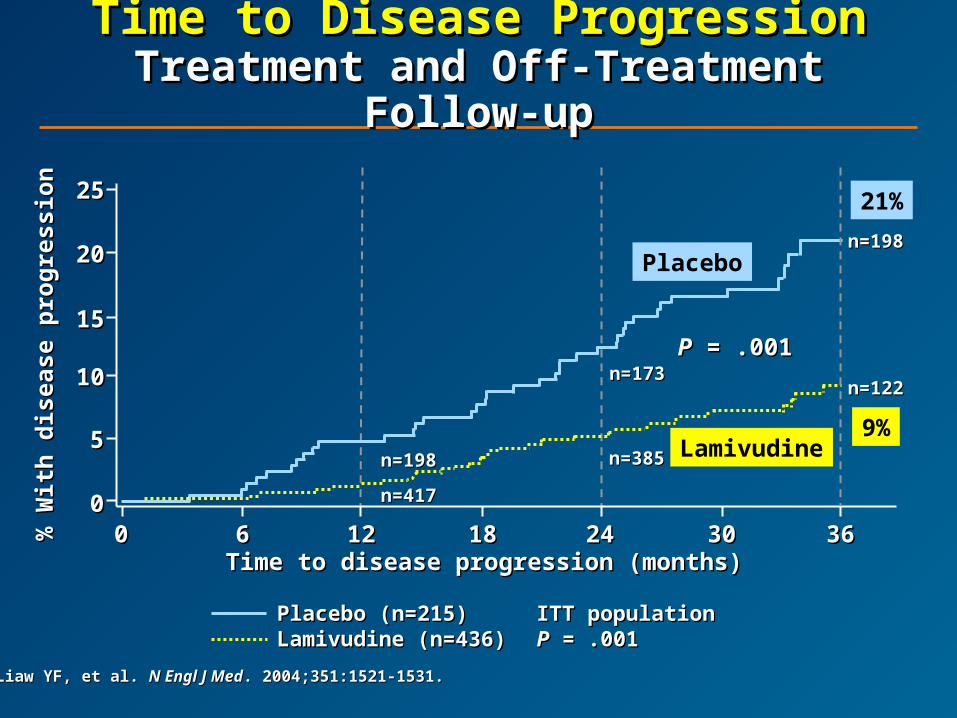
Time to Disease ProgressionTime to Disease ProgressionTreatment and Off-Treatment Treatment and Off-Treatment
Follow-upFollow-up
Placebo (n=215)Placebo (n=215) ITT populationITT populationLamivudine (n=436)Lamivudine (n=436) PP = .001 = .001
Time to disease progression (months)Time to disease progression (months)
LamivudineLamivudine
PP = .001 = .001
2525
2020
1515
1010
55
0000 66 1212 1818 2424 3030 3636
9%
21%
Placebo
Lamivudinen=385n=385
n=198n=198
n=417n=417
n=173n=173n=122n=122
n=198n=198
Liaw YF, et al. Liaw YF, et al. N Engl J MedN Engl J Med. 2004;351:1521-1531.. 2004;351:1521-1531.

HIV/HBV Coinfection: HIV/HBV Coinfection: Effect on Liver-Related Effect on Liver-Related
MortalityMortality
00
22
44
66
88
1010
1212
1414
1616
HIV-/HBsAg-HIV-/HBsAg- HIV+HIV+ HBsAg+HBsAg+ HIV+/HBsAg+HIV+/HBsAg+
Liv
er-r
elat
ed m
ort
alit
y ra
te
Liv
er-r
elat
ed m
ort
alit
y ra
te
(per
100
0 p
erso
n-y
ears
)(p
er 1
000
per
son
-yea
rs)
P <P < .001 .001P P = .04= .04
P P < .0001< .0001
Thio CL, et al.Thio CL, et al. Lancet Lancet. 2002;360:1921-1926. . 2002;360:1921-1926.
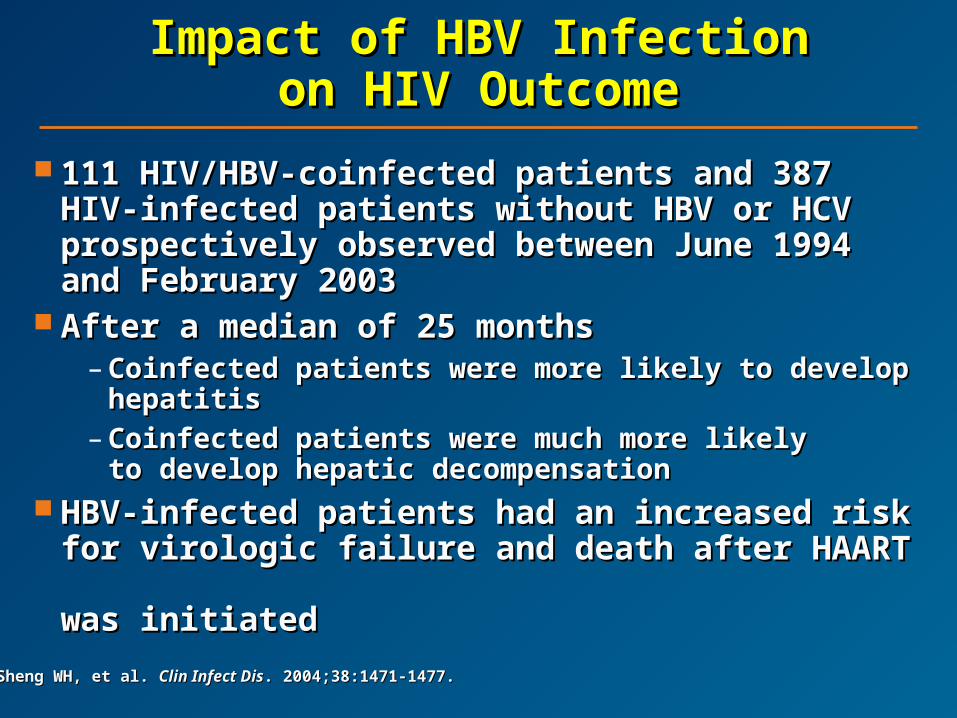
Impact of HBV InfectionImpact of HBV Infectionon HIV Outcomeon HIV Outcome
111 HIV/HBV-coinfected patients and 387 111 HIV/HBV-coinfected patients and 387 HIV-infected patients without HBV or HCV HIV-infected patients without HBV or HCV prospectively observed between June 1994 prospectively observed between June 1994 and February 2003and February 2003
After a median of 25 monthsAfter a median of 25 months– Coinfected patients were more likely to develop Coinfected patients were more likely to develop
hepatitis hepatitis – Coinfected patients were much more likelyCoinfected patients were much more likely
to develop hepatic decompensationto develop hepatic decompensation HBV-infected patients had an increased riskHBV-infected patients had an increased risk
for virologic failure and death after HAART for virologic failure and death after HAART was initiatedwas initiated
Sheng WH, et al. Sheng WH, et al. Clin Infect DisClin Infect Dis. 2004;38:1471-1477. . 2004;38:1471-1477.
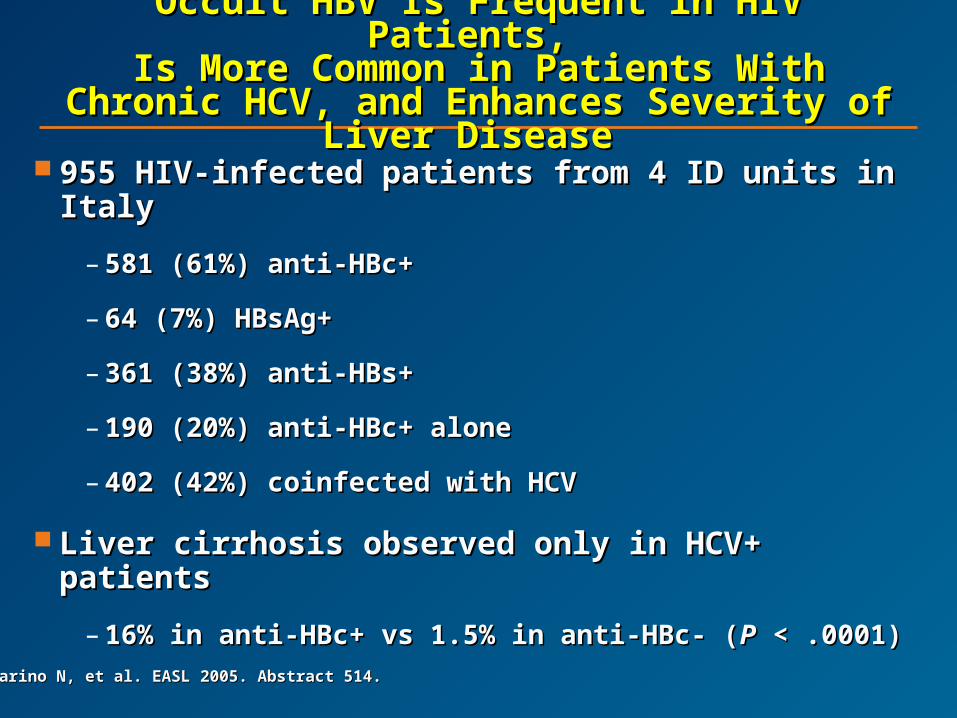
Occult HBV Is Frequent in HIV Patients, Occult HBV Is Frequent in HIV Patients, Is More Common in Patients With Is More Common in Patients With
Chronic HCV, and Enhances Severity of Chronic HCV, and Enhances Severity of Liver Disease Liver Disease
955 HIV-infected patients from 4 ID units in Italy955 HIV-infected patients from 4 ID units in Italy
– 581 (61%) anti-HBc+581 (61%) anti-HBc+
– 64 (7%) HBsAg+64 (7%) HBsAg+
– 361 (38%) anti-HBs+361 (38%) anti-HBs+
– 190 (20%) anti-HBc+ alone190 (20%) anti-HBc+ alone
– 402 (42%) coinfected with HCV402 (42%) coinfected with HCV
Liver cirrhosis observed only in HCV+ patientsLiver cirrhosis observed only in HCV+ patients
– 16% in anti-HBc+ vs 1.5% in anti-HBc- (16% in anti-HBc+ vs 1.5% in anti-HBc- (PP < .0001) < .0001)Marino N, et al. EASL Marino N, et al. EASL 2005. Abstract 514. 2005. Abstract 514.
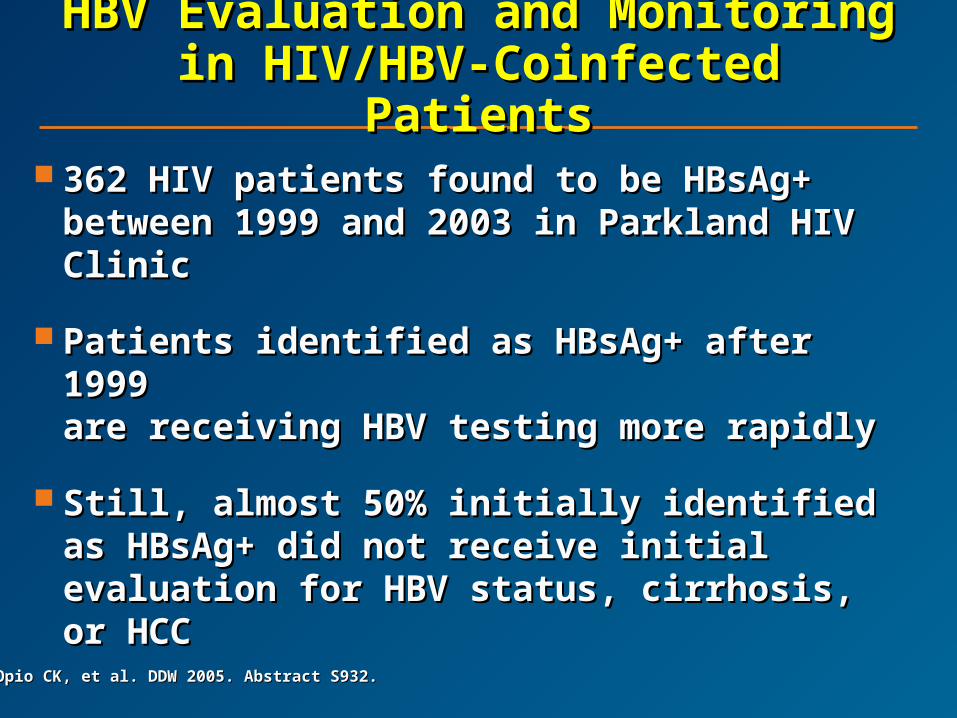
HBV Evaluation and MonitoringHBV Evaluation and Monitoringin HIV/HBV-Coinfected Patientsin HIV/HBV-Coinfected Patients
362 HIV patients found to be HBsAg+ between 362 HIV patients found to be HBsAg+ between 1999 and 2003 in Parkland HIV Clinic1999 and 2003 in Parkland HIV Clinic
Patients identified as HBsAg+ after 1999 Patients identified as HBsAg+ after 1999 are receiving HBV testing more rapidlyare receiving HBV testing more rapidly
Still, almost 50% initially identified as HBsAg+ Still, almost 50% initially identified as HBsAg+ did not receive initial evaluation for HBV did not receive initial evaluation for HBV status, cirrhosis, or HCCstatus, cirrhosis, or HCC
Opio CK, et al. DDW Opio CK, et al. DDW 2005. Abstract S932. 2005. Abstract S932.
HBV Goals of TherapyHBV Goals of Therapy
Long-term viral suppressionLong-term viral suppression
No resistance developmentNo resistance development
Decrease risk of HCCDecrease risk of HCC
What is optimal therapy?What is optimal therapy?

Currently Approved Currently Approved Antiviral TherapiesAntiviral Therapies
Interferon alfa-2bInterferon alfa-2b
Peginterferon alfa-2aPeginterferon alfa-2a
Lamivudine (LAM)Lamivudine (LAM)
Adefovir dipivoxil (ADV)Adefovir dipivoxil (ADV)
Entecavir (ETV)Entecavir (ETV)

Mutations in the HBV Genome Mutations in the HBV Genome Lead Lead
to Resistance to Antiviral to Resistance to Antiviral TherapiesTherapies
Terminal proteinTerminal protein
V173L
V173L
A181V or TA181V or T
Lamivudine resistanceLamivudine resistancemutationsmutations
SpacerSpacer Reverse transcriptaseReverse transcriptase Rnase HRnase H
FF GG AA BB CC DD EE
L180ML180M
YMDDYMDD
M204V or I
M204V or I
N236T K241EN236T K241EK318QK318Q
34434411
Observed in ADV treated patientsObserved in ADV treated patients
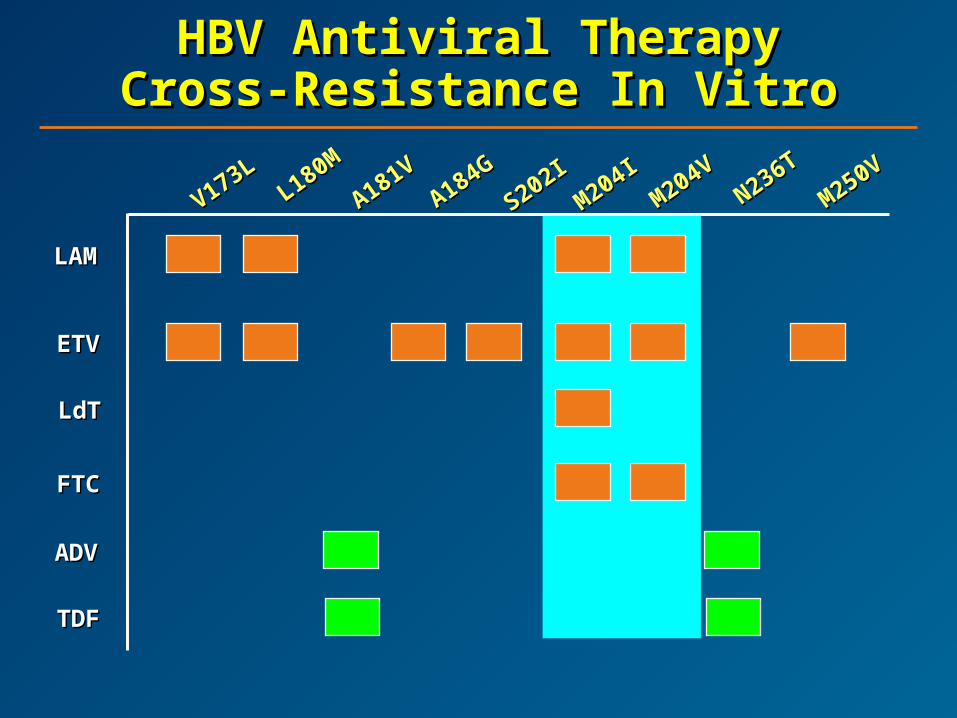
HBV HBV Antiviral TherapyAntiviral TherapyCross-Resistance Cross-Resistance IIn n VViitrotro
M204VM204V
V173LV173L
A181VA181V
M250VM250V
L180ML180M
A184GA184G
S202IS202I
N236TN236T
M204I
M204I
LAMLAM
ADVADV
ETVETV
LdTLdT
FTCFTC
TDFTDF
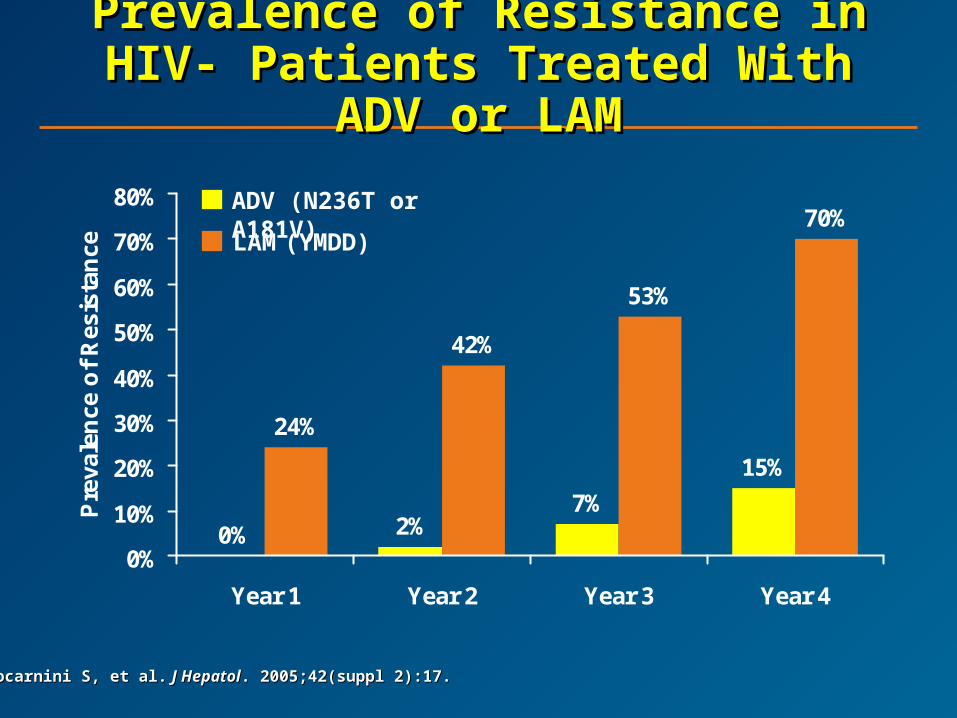
0% 2%7%
15%
24%
42%
53%
70%
0%
10%
20%
30%
40%
50%
60%
70%
80%
Year 1 Year 2 Year 3 Year 4
Pre
vale
nce
of
Res
ista
nce
Prevalence of Resistance in Prevalence of Resistance in HIV- Patients Treated With ADV HIV- Patients Treated With ADV
or LAMor LAM
Locarnini S, et al.Locarnini S, et al. J Hepatol J Hepatol. 2005;42(suppl 2):17.. 2005;42(suppl 2):17.
ADV (N236T or A181V)
LAM (YMDD)

HBV DNA and ALT Normalization With HBV DNA and ALT Normalization With ADV in LAM-Resistant HBV/HIV-ADV in LAM-Resistant HBV/HIV-
Coinfected PatientsCoinfected Patients
0%
27%
36%
3%
37%
64%
6%
19%
0%
10%
20%
30%
40%
50%
60%
70%
Baseline Week 48 Week 96 Week 144
Weeks on ADV
Pat
ien
ts (
%)
HBV DNA ≤ 1000 copies/mL
ALT normalization
Benhamou Y, et al. 12th CROI. Boston, MA. 2005. Abstract 935. Benhamou Y, et al. 12th CROI. Boston, MA. 2005. Abstract 935.
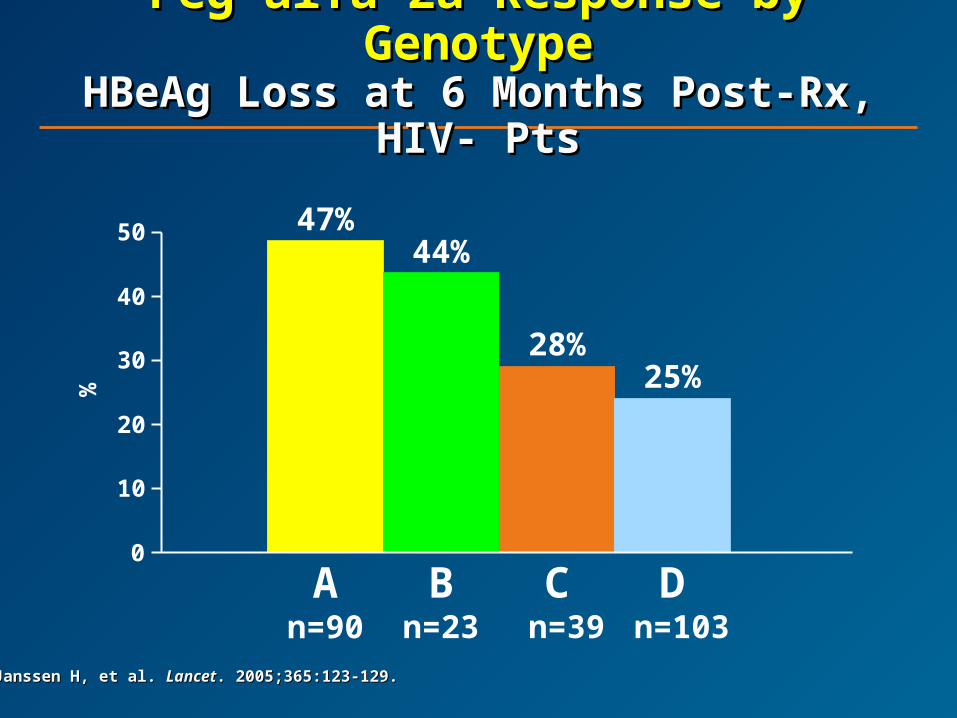
A n=90
47%44%
Bn=23
28%
C n=39
25%
D n=103
0
10
20
30
40
50
%
Peg alfa 2a Response by Peg alfa 2a Response by GenotypeGenotype
HBeAg Loss at HBeAg Loss at 6 Months Post-Rx, 6 Months Post-Rx, HIV- PtsHIV- Pts
Janssen H, et al. Janssen H, et al. LancetLancet. 2005;365:123-129.. 2005;365:123-129.

Adefovir vs Tenofovir in HIV-Adefovir vs Tenofovir in HIV-Coinfected Patients With LAM-Coinfected Patients With LAM-
Resistant HBVResistant HBV
2233
44 4444
78
94100
0
20
40
60
80
100
120
Week 12 Week 24 Week 36 Week 48% o
f P
atie
nts
w/H
BV
DN
A <
400
cop
ies/
mL
Adefovir
Tenofovir
Van Bommel F, et al. Van Bommel F, et al. HepatologyHepatology. 2004;40:1421-1425.. 2004;40:1421-1425.
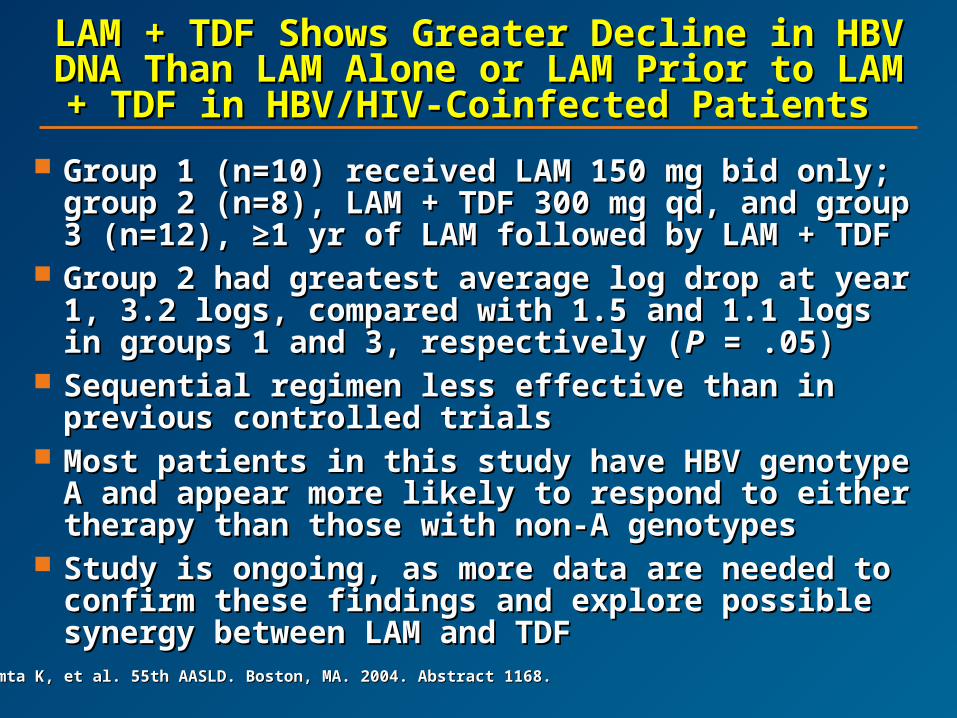
LAM + TDF Shows Greater Decline in LAM + TDF Shows Greater Decline in HBV DNA Than LAM Alone or LAM Prior HBV DNA Than LAM Alone or LAM Prior to LAM + TDF in HBV/HIV-Coinfected to LAM + TDF in HBV/HIV-Coinfected
Patients Patients Group 1 (n=10) received LAM 150 mg bid only; group 2 Group 1 (n=10) received LAM 150 mg bid only; group 2
(n=8), LAM + TDF 300 mg qd, and group 3 (n=12), ≥1 yr (n=8), LAM + TDF 300 mg qd, and group 3 (n=12), ≥1 yr of LAM followed by LAM + TDFof LAM followed by LAM + TDF
Group 2 had greatest average log drop at year 1, 3.2 Group 2 had greatest average log drop at year 1, 3.2 logs, compared with 1.5 and 1.1 logs in groups 1 and 3, logs, compared with 1.5 and 1.1 logs in groups 1 and 3, respectively (respectively (PP = .05) = .05)
Sequential regimen less effective than in previous Sequential regimen less effective than in previous controlled trialscontrolled trials
Most patients in this study have HBV genotype A and Most patients in this study have HBV genotype A and appear more likely to respond to either therapy than appear more likely to respond to either therapy than those with non-A genotypesthose with non-A genotypes
Study is ongoing, as more data are needed to confirm Study is ongoing, as more data are needed to confirm these findings and explore possible synergy between these findings and explore possible synergy between LAM and TDFLAM and TDF
Mamta K, et al. 55th AASLD. Boston, MA. 2004. Abstract 1168. Mamta K, et al. 55th AASLD. Boston, MA. 2004. Abstract 1168.
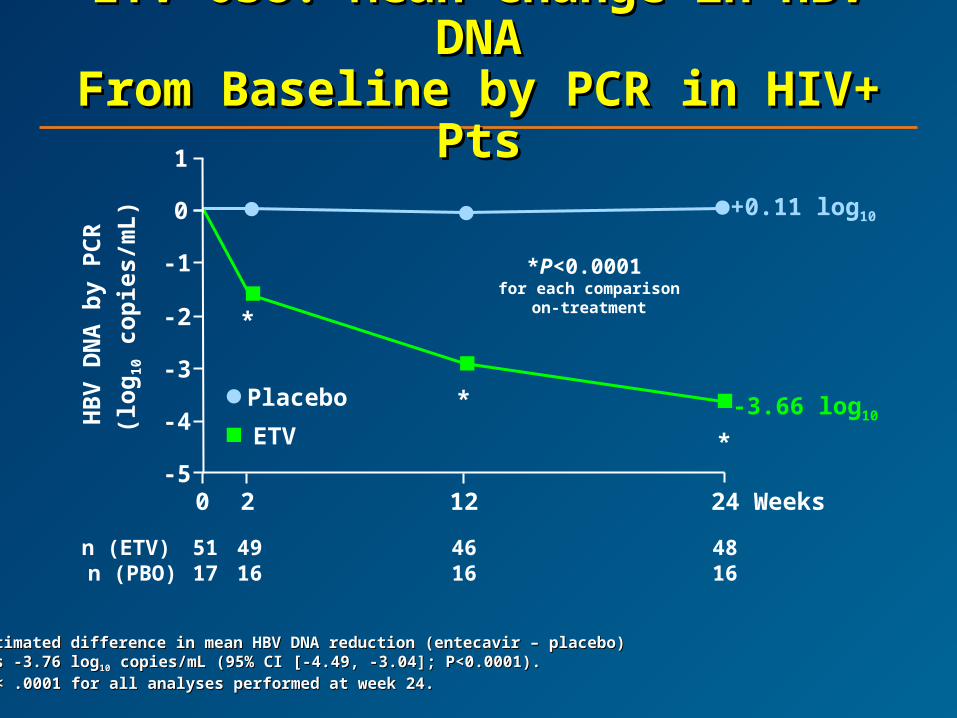
ETV-038: Mean Change in HBV ETV-038: Mean Change in HBV DNADNA
From Baseline by PCR in HIV+ From Baseline by PCR in HIV+ PtsPts
Estimated difference in mean HBV DNA reduction (entecavir – placebo) Estimated difference in mean HBV DNA reduction (entecavir – placebo) was -3.76 logwas -3.76 log1010 copies/mL (95% CI [-4.49, -3.04]; P<0.0001). copies/mL (95% CI [-4.49, -3.04]; P<0.0001).
PP < .0001 for all analyses performed at week 24. < .0001 for all analyses performed at week 24.
5117
4616
4816
n (ETV) n (PBO)
4916
HB
V D
NA
by
PC
R
(lo
g10
co
pie
s/m
L)
*P<0.0001 for each comparison
on-treatment
-3.66 log10
-5
-4
-3
-2
-1
0
1
0 2 12 24
Placebo
ETV
+0.11 log10
*
*
*
Weeks

Other Combinations for HBV Other Combinations for HBV at AASLD 2005at AASLD 2005
Emtricitabine (FTC) and clevudine (L-Emtricitabine (FTC) and clevudine (L-FMAU)FMAU)
LAM and ADVLAM and ADV
Tenofovir (TDF) rescue of ADV failureTenofovir (TDF) rescue of ADV failure
Combination therapy and resistance lights Combination therapy and resistance lights starting to pop on very slowlystarting to pop on very slowly

Evolving Treatment Paradigms Evolving Treatment Paradigms in HBV, HBV/HIVin HBV, HBV/HIV
SuppressionSuppression Reduce HBV DNAReduce HBV DNA Improve ALTImprove ALT Potential for resistancePotential for resistance Hope for seroconversionHope for seroconversion Indefinite course of therapyIndefinite course of therapy
Complete ResponseComplete Response Undetectable HBV DNAUndetectable HBV DNA Normalization of ALTNormalization of ALT Minimal resistanceMinimal resistance HBeAg loss/seroconversionHBeAg loss/seroconversion Sustained viral load Sustained viral load
reduction off treatmentreduction off treatment
EliminationEliminationComplete response, plusComplete response, plus Eradication of cccDNAEradication of cccDNA No hepatic flares off treatmentNo hepatic flares off treatment Reduce progression Reduce progression
of liver diseaseof liver disease
Current FutureFuture
HIV Coinfections, Malignancies, HIV Coinfections, Malignancies, andand
ComorbiditiesComorbidities HIV-hepatitis C coinfectionHIV-hepatitis C coinfection
HIV-hepatitis B coinfectionHIV-hepatitis B coinfection
Hepatotoxicity, HIV-hep coinfection, and Hepatotoxicity, HIV-hep coinfection, and antiretroviral therapyantiretroviral therapy
HIV-related malignanciesHIV-related malignancies
Psychiatric concerns in persons with HIVPsychiatric concerns in persons with HIV

Patterns of SteatosisPatterns of Steatosis
Macrovesicular steatosis:Macrovesicular steatosis: Hepatocytes contain a single large vacuole of Hepatocytes contain a single large vacuole of
fat (TG) that fills up the cell and displaces the fat (TG) that fills up the cell and displaces the nucleus to the peripherynucleus to the periphery
Microvesicular steatosis:Microvesicular steatosis: Hepatocytes are filled up with numerous small Hepatocytes are filled up with numerous small
lipid vesicles that leave the nucleus in the lipid vesicles that leave the nucleus in the center of the cellcenter of the cell
““Its presence implies impairment of Its presence implies impairment of mitochondrial oxidation of fatty acids mitochondrial oxidation of fatty acids and severe energy crisis” – D. Pessayreand severe energy crisis” – D. Pessayre
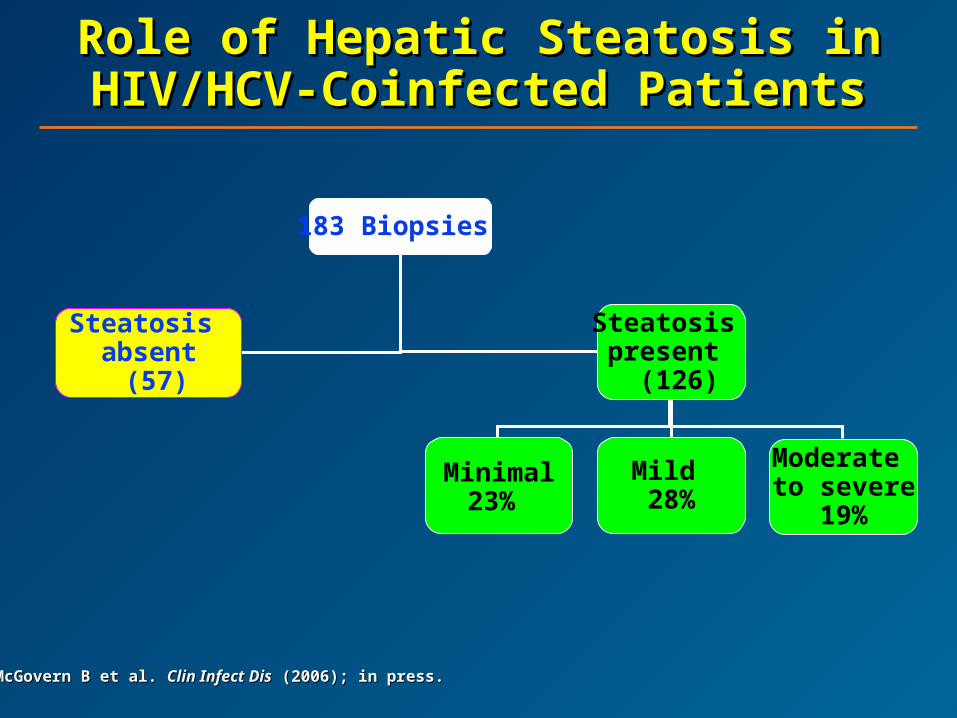
Role of Hepatic Steatosis in Role of Hepatic Steatosis in HIV/HCV-Coinfected PatientsHIV/HCV-Coinfected Patients
183 Biopsies
Steatosis absent (57)
Steatosis present
(126)
Minimal23%
Mild 28%
Moderate to severe
19%
McGovern B et al. McGovern B et al. Clin Infect DisClin Infect Dis (2006); in press. (2006); in press.

HAART and HepatotoxicityHAART and Hepatotoxicity
10,000 patients from 21 ACTG trials10,000 patients from 21 ACTG trials
– High rate of severe drug-induced liver injury High rate of severe drug-induced liver injury (DILI) irrespective of class(DILI) irrespective of class
3,927 pts with follow-up for 3 years on ART3,927 pts with follow-up for 3 years on ART
– The most common grade 4 adverse events The most common grade 4 adverse events were liver relatedwere liver related
– Risk was higher in patients with viral hepatitis Risk was higher in patients with viral hepatitis (OR = 5.97 for HBV; OR = 2.74 for HCV)(OR = 5.97 for HBV; OR = 2.74 for HCV)
Reisler, IAS 2001, Buenos Aires, Abst. 43; Reisler, Reisler, IAS 2001, Buenos Aires, Abst. 43; Reisler, J Acquir Immune Defic Syndr.J Acquir Immune Defic Syndr. 2003;34. 2003;34.
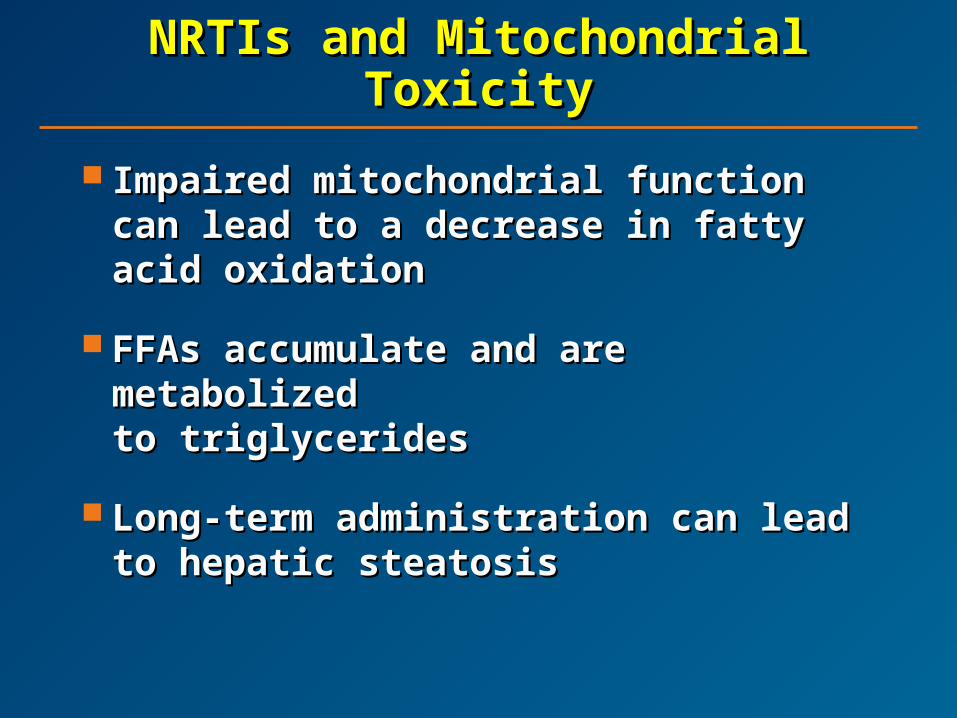
NRTIs and Mitochondrial NRTIs and Mitochondrial ToxicityToxicity
Impaired mitochondrial function can lead Impaired mitochondrial function can lead to a decrease in fatty acid oxidationto a decrease in fatty acid oxidation
FFAs accumulate and are metabolized FFAs accumulate and are metabolized to triglyceridesto triglycerides
Long-term administration can lead Long-term administration can lead to hepatic steatosisto hepatic steatosis

Risk Factors for NVP-Risk Factors for NVP-Associated Associated SymptomaticSymptomatic
Events in All TrialsEvents in All Trials
NVP (RR = 11.2; NVP (RR = 11.2; PP < .01) < .01)
Female gender (RR = 3.2; Female gender (RR = 3.2; PP < .01) < .01)
Female with baseline CD4 Female with baseline CD4 ≥ ≥ 250 (RR = 9.8; 250 (RR = 9.8; PP < .01) < .01)
Male with baseline CD4 Male with baseline CD4 ≥ ≥ 400 (RR = 6.4; 400 (RR = 6.4; PP < .01) < .01)
Baseline ALT or AST >2.5x Baseline ALT or AST >2.5x ULN (RR = 3.2; ULN (RR = 3.2; PP < .01) < .01)
HBV coinfection (RR = 3.9; HBV coinfection (RR = 3.9; PP < .01) < .01)
Baseline CD4 found to be Baseline CD4 found to be an inconsistent factoran inconsistent factor
Rash-Associated Hepatic Events Other Symptomatic Hepatic Events
Stern JO et al, 14th Int AIDS Conference, 2002, Barcelona.Stern JO et al, 14th Int AIDS Conference, 2002, Barcelona.
PIs and HepatotoxicityPIs and Hepatotoxicity
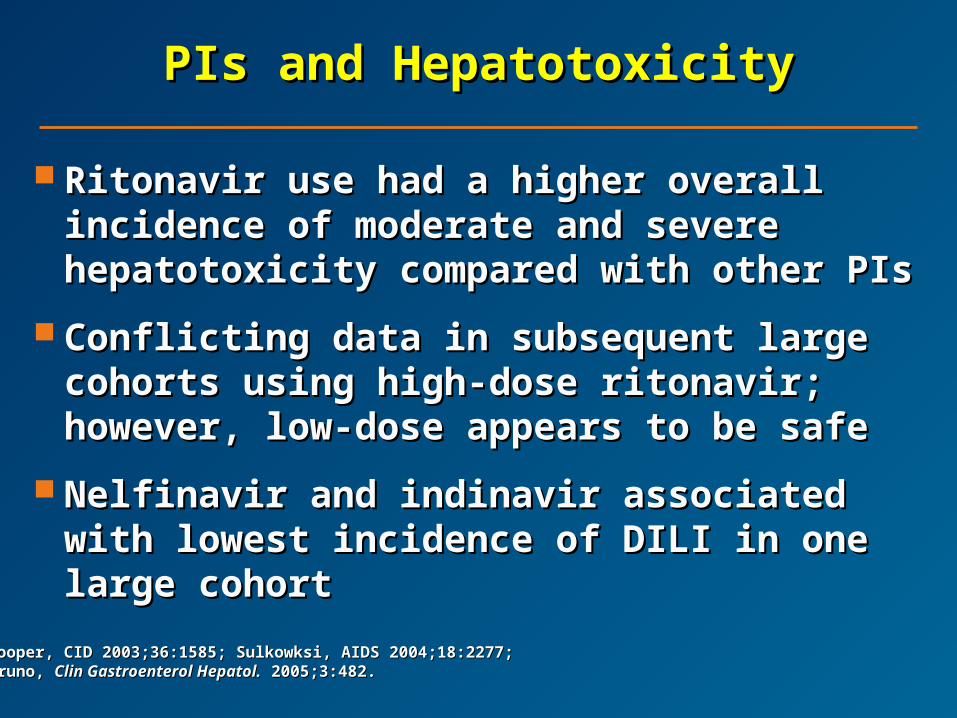
Ritonavir use had a higher overall incidence of Ritonavir use had a higher overall incidence of moderate and severe hepatotoxicity compared moderate and severe hepatotoxicity compared with other PIswith other PIs
Conflicting data in subsequent large cohorts Conflicting data in subsequent large cohorts using high-dose ritonavir; however, low-dose using high-dose ritonavir; however, low-dose appears to be safeappears to be safe
Nelfinavir and indinavir associated with lowest Nelfinavir and indinavir associated with lowest incidence of DILI in one large cohortincidence of DILI in one large cohort
Cooper, CID 2003;36:1585; Sulkowksi, AIDS 2004;18:2277; Cooper, CID 2003;36:1585; Sulkowksi, AIDS 2004;18:2277; Bruno, Bruno, Clin Gastroenterol Hepatol.Clin Gastroenterol Hepatol. 2005;3:482. 2005;3:482.

Pharmacokinetics of Pharmacokinetics of Lopinavir/Ritonavir in HIV/HCVLopinavir/Ritonavir in HIV/HCV
Ritonavir pK sampling on day 14 in 12 Ritonavir pK sampling on day 14 in 12 HIV/HCV patients with mild and moderate HIV/HCV patients with mild and moderate liver disease:liver disease:
AUC:AUC:
41% higher in mild liver disease41% higher in mild liver disease
185% higher in moderate liver disease185% higher in moderate liver disease
Arribas J et al, 9th EASL.Arribas J et al, 9th EASL.

Can We Avoid Drug-Induced Can We Avoid Drug-Induced Liver Injury (DILI) by Risk Liver Injury (DILI) by Risk
Stratification?Stratification? GenderGender HIV infection and low glutathione levelsHIV infection and low glutathione levels Genetic polymorphisms: CYP2D6Genetic polymorphisms: CYP2D6 ObesityObesity Acetylator statusAcetylator status AgeAge Duration of treatmentDuration of treatment Alcohol useAlcohol use and ROS, 2E1, glutathione and ROS, 2E1, glutathione New risk factorNew risk factor: Chronic viral hepatitis: Chronic viral hepatitis

Cumulative Effects of Liver Cumulative Effects of Liver InjuryInjury
Is a “trial by error” approach potentially Is a “trial by error” approach potentially harmful?harmful?
Reports of worsening histology after HAARTReports of worsening histology after HAART
17 patients with severe hepatotoxicity:17 patients with severe hepatotoxicity:
– Four-month “washout” period Four-month “washout” period
– 59% successfully tolerated their medications59% successfully tolerated their medications
– However, 41% had another episode of DILI!However, 41% had another episode of DILI!
Hepatotoxicity is a sign that should be Hepatotoxicity is a sign that should be evaluatedevaluated
Puoti, Puoti, J Acquir Immune Defic Syndr.J Acquir Immune Defic Syndr. 2003;32:259; Aceti, 2003;32:259; Aceti, Int J STD AIDS.Int J STD AIDS. 2005;16:148. 2005;16:148.

Prevention of DILIPrevention of DILI
Pitfalls and limitations of current dataPitfalls and limitations of current data
Assessment of riskAssessment of risk
– Does the patient have chronic viral hepatitis?Does the patient have chronic viral hepatitis?
– What are the baseline aminotransferases?What are the baseline aminotransferases?
– Evaluate synthetic functionEvaluate synthetic function
– Staging of liver diseaseStaging of liver disease
Monitoring of laboratoriesMonitoring of laboratories
Education of the patient!Education of the patient!
Sabin, Sabin, Clin Infect Dis.Clin Infect Dis. 2004;S56; McGovern, IAPAC 2004, S23. 2004;S56; McGovern, IAPAC 2004, S23.

HIV Coinfections, Malignancies, HIV Coinfections, Malignancies, andand
ComorbiditiesComorbidities HIV-hepatitis C coinfectionHIV-hepatitis C coinfection
HIV-hepatitis B coinfectionHIV-hepatitis B coinfection
Hepatotoxicity, HIV-hep coinfection, and Hepatotoxicity, HIV-hep coinfection, and antiretroviral therapyantiretroviral therapy
HIV-related malignanciesHIV-related malignancies
Psychiatric concerns in persons with HIVPsychiatric concerns in persons with HIV
Concomitant Diseases and Concomitant Diseases and Comorbidities: Comorbidities: MalignanciesMalignancies
LymphomaLymphoma
Kaposi’s sarcoma Kaposi’s sarcoma
Human papillomavirus: anal and cervical Human papillomavirus: anal and cervical cancercancer
Other cancersOther cancers

Cancers Associated With Cancers Associated With HIV InfectionHIV Infection
AIDS definingAIDS defining
– Systemic and CNS lymphoma (EBV)Systemic and CNS lymphoma (EBV)
– Kaposi’s sarcoma (HHV-8)Kaposi’s sarcoma (HHV-8)
– Cervical carcinoma (HPV)Cervical carcinoma (HPV)
Non-AIDS definingNon-AIDS defining
– Aerodigestive cancers (head/neck, lung)Aerodigestive cancers (head/neck, lung)
– Hematalogic (Hodgkin’s disease, myeloma)Hematalogic (Hodgkin’s disease, myeloma)
– Skin (anal, melanoma)Skin (anal, melanoma)
– Testis (seminoma)Testis (seminoma)
– OthersOthers

HIV Infection and Risk of HIV Infection and Risk of Hematologic NeoplasmsHematologic Neoplasms
Linkage between cancer and AIDS registriesLinkage between cancer and AIDS registries
USA, Italy, AustraliaUSA, Italy, Australia
Relative risk increased forRelative risk increased for
– Intermediate- or high-grade lymphoma – 400-foldIntermediate- or high-grade lymphoma – 400-fold
– Low-grade and T-cell lymphoma – 15-foldLow-grade and T-cell lymphoma – 15-fold
– Hodgkin’s disease – 10-foldHodgkin’s disease – 10-fold
– Myeloma and leukemias – 2- to 5-foldMyeloma and leukemias – 2- to 5-fold
In Africa – risk 10x less than in developed countries In Africa – risk 10x less than in developed countries
– Underascertainment?Underascertainment?
– Earlier death from infection?Earlier death from infection?
Dal Maso L. Dal Maso L. Lancet Oncol.Lancet Oncol. 2003; 4: 110-9. 2003; 4: 110-9.

Highly Active Antiretroviral Therapy Highly Active Antiretroviral Therapy and Incidence of Cancer in HIV-and Incidence of Cancer in HIV-
Infected AdultsInfected Adults
International Collaboration on HIV and Cancer. International Collaboration on HIV and Cancer. J Natl Cancer Inst.J Natl Cancer Inst. 2000; 92: 1822-30. 2000; 92: 1822-30.
Cancer typeCancer type
Adjusted incidence rateAdjusted incidence rateper 1000 per year (No.)per 1000 per year (No.)
Rate ratio (RR) for Rate ratio (RR) for 1997 through 19991997 through 1999
vs vs 1992 through 19961992 through 1996
1992–19961992–1996 1997–19991997–1999 RR (SE)RR (SE) RR (99% Cl)RR (99% Cl)
Kaposi’s sarcomaKaposi’s sarcoma 15.2 (1489)15.2 (1489) 4.9 (190)4.9 (190) 0.32 (0.03)0.32 (0.03)
Hodgkin’s diseaseHodgkin’s disease 0.5 (38)0.5 (38) 0.4 (12)0.4 (12) 0.77 (0.26)0.77 (0.26)
Non-Hodgkin’s lymphomaNon-Hodgkin’s lymphoma 6.2 (623)6.2 (623) 3.6 (134)3.6 (134) 0.58 (0.06)0.58 (0.06)
Cancer of the uterine cervixCancer of the uterine cervix 1.1 (19)1.1 (19) 2.1 (17)2.1 (17) 1.87 (0.65)1.87 (0.65)
Other cancersOther cancers 1.7 (126)1.7 (126) 1.7 (54)1.7 (54) 0.96 (0.16)0.96 (0.16)
0.10.1 11 1010

Characteristics of HIV-Characteristics of HIV-Associated Lymphoma in Associated Lymphoma in
Adults and ChildrenAdults and Children PresentationPresentation
– Primary CNS disease (10%)Primary CNS disease (10%)
– Systemic lymphoma (90%)Systemic lymphoma (90%)
HistologyHistology– Large cell or immunoblasticLarge cell or immunoblastic
– Small, noncleaved cellSmall, noncleaved cell
– Uncommon typesUncommon types Primary effusion lymphoma (KSHV)Primary effusion lymphoma (KSHV) Plasmablastic lymphoma of oral cavityPlasmablastic lymphoma of oral cavity
Extranodal involvement common (up to 80-90%)Extranodal involvement common (up to 80-90%)– Common sites: marrow, GI tractCommon sites: marrow, GI tract
– Uncommon sites: kidneys, skin, other unusual sitesUncommon sites: kidneys, skin, other unusual sites
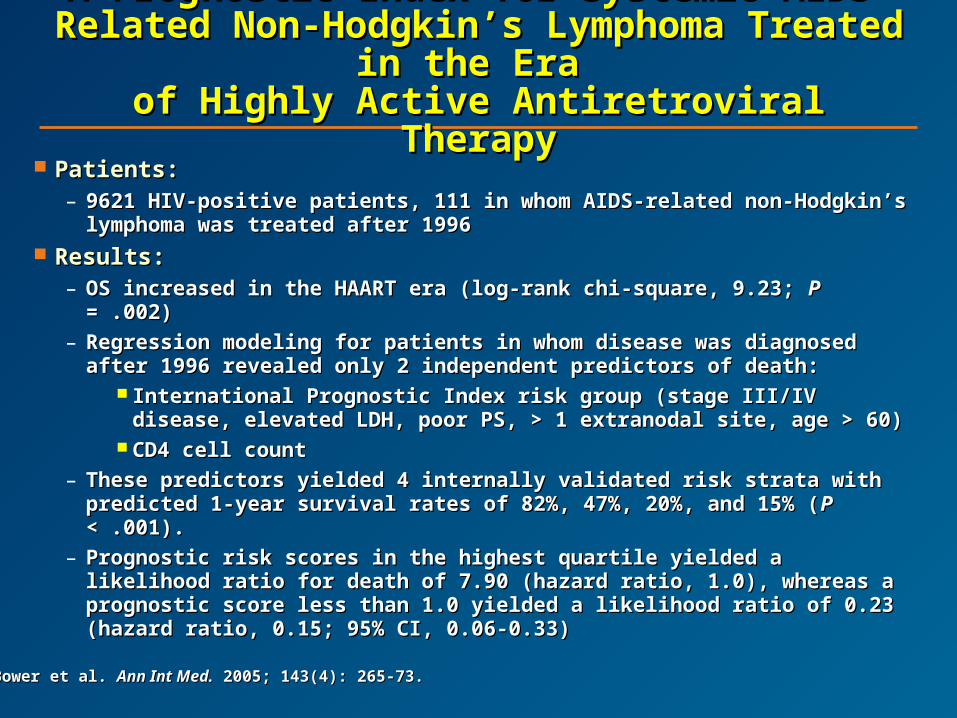
A Prognostic Index for Systemic AIDS-A Prognostic Index for Systemic AIDS-Related Non-Hodgkin’s Lymphoma Related Non-Hodgkin’s Lymphoma
Treated in the Era Treated in the Era of Highly Active Antiretroviral Therapyof Highly Active Antiretroviral Therapy
Patients:Patients:– 9621 HIV-positive patients, 111 in whom AIDS-related non-Hodgkin’s 9621 HIV-positive patients, 111 in whom AIDS-related non-Hodgkin’s
lymphoma was treated after 1996lymphoma was treated after 1996 Results:Results:
– OS increased in the HAART era (log-rank chi-square, 9.23; OS increased in the HAART era (log-rank chi-square, 9.23; PP = .002) = .002)
– Regression modeling for patients in whom disease was diagnosedRegression modeling for patients in whom disease was diagnosedafter 1996 revealed only 2 independent predictors of death: after 1996 revealed only 2 independent predictors of death:
International Prognostic Index risk group (stage III/IV disease, International Prognostic Index risk group (stage III/IV disease, elevated LDH, poor PS, > 1 extranodal site, age > 60)elevated LDH, poor PS, > 1 extranodal site, age > 60)
CD4 cell countCD4 cell count
– These predictors yielded 4 internally validated risk strata with These predictors yielded 4 internally validated risk strata with predicted 1-year survival rates of 82%, 47%, 20%, and 15% (predicted 1-year survival rates of 82%, 47%, 20%, and 15% (PP < .001). < .001).
– Prognostic risk scores in the highest quartile yielded a likelihood ratio Prognostic risk scores in the highest quartile yielded a likelihood ratio for death of 7.90 (hazard ratio, 1.0), whereas a prognostic score less for death of 7.90 (hazard ratio, 1.0), whereas a prognostic score less than 1.0 yielded a likelihood ratio of 0.23 (hazard ratio, 0.15; 95% CI, than 1.0 yielded a likelihood ratio of 0.23 (hazard ratio, 0.15; 95% CI, 0.06-0.33)0.06-0.33)
Bower et al. Bower et al. Ann Int Med.Ann Int Med. 2005; 143(4): 265-73. 2005; 143(4): 265-73.
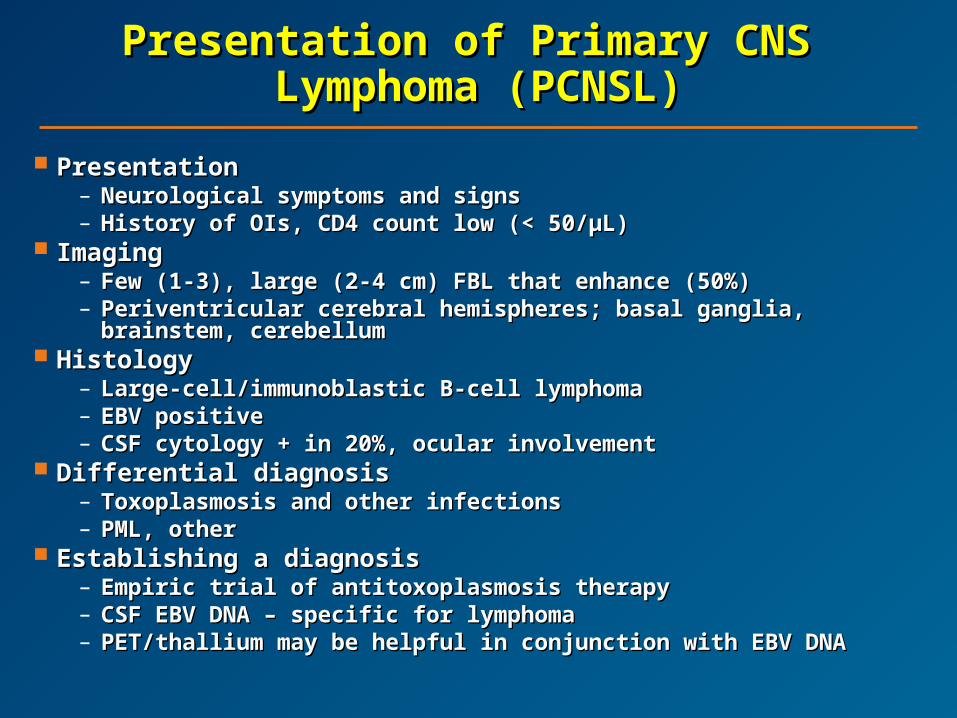
Presentation of Primary CNS Presentation of Primary CNS Lymphoma (PCNSL)Lymphoma (PCNSL)
PresentationPresentation– Neurological symptoms and signsNeurological symptoms and signs– History of OIs, CD4 count low (< 50/μL)History of OIs, CD4 count low (< 50/μL)
ImagingImaging– Few (1-3), large (2-4 cm) FBL that enhance (50%)Few (1-3), large (2-4 cm) FBL that enhance (50%)– Periventricular cerebral hemispheres; basal ganglia, brainstem, Periventricular cerebral hemispheres; basal ganglia, brainstem,
cerebellumcerebellum HistologyHistology
– Large-cell/immunoblastic B-cell lymphomaLarge-cell/immunoblastic B-cell lymphoma– EBV positive EBV positive – CSF cytology + in 20%, ocular involvementCSF cytology + in 20%, ocular involvement
Differential diagnosisDifferential diagnosis– Toxoplasmosis and other infectionsToxoplasmosis and other infections– PML, other PML, other
Establishing a diagnosisEstablishing a diagnosis– Empiric trial of antitoxoplasmosis therapyEmpiric trial of antitoxoplasmosis therapy– CSF EBV DNA – specific for lymphomaCSF EBV DNA – specific for lymphoma– PET/thallium may be helpful in conjunction with EBV DNAPET/thallium may be helpful in conjunction with EBV DNA

Treatment of Primary CNS Treatment of Primary CNS LymphomaLymphoma
Optimize HAARTOptimize HAART
– Anecdotal reports of spontaneous regressionAnecdotal reports of spontaneous regression
– AIDS 1998; 12: 952-8; J AIDS 1992; 5: 953-4AIDS 1998; 12: 952-8; J AIDS 1992; 5: 953-4
Standard treatmentsStandard treatments
– SteroidsSteroids
– Whole-brain irradiation (WBRT)Whole-brain irradiation (WBRT) Median survival, 3 monthsMedian survival, 3 months 10% survive 1 year (usually good PS)10% survive 1 year (usually good PS)
– CHOD chemotherapy x 1 CHOD chemotherapy x 1 WBRT (U.S. Intergroup) WBRT (U.S. Intergroup) Similar results to irradiation alone (J AIDS 2000; 23: A30, abst 63)Similar results to irradiation alone (J AIDS 2000; 23: A30, abst 63)
Alternative treatmentsAlternative treatments
– High-dose zidovudine, gancyclovir +/- IL-2High-dose zidovudine, gancyclovir +/- IL-2 Anecdotal reports of benefit (J AIDS 1999; 15: 713-9)Anecdotal reports of benefit (J AIDS 1999; 15: 713-9)
– High-dose methotrexate-based regimensHigh-dose methotrexate-based regimens

ConclusionsConclusions
Non-Hodgkin’s lymphoma is a common complication of HIV infectionNon-Hodgkin’s lymphoma is a common complication of HIV infection Influence of HAARTInfluence of HAART
– Incidence of lymphoma may be decreasing Incidence of lymphoma may be decreasing – Lymphoma may be a more common initial manifestation of AIDSLymphoma may be a more common initial manifestation of AIDS
Primary CNS lymphoma Primary CNS lymphoma – Common cause of FBLCommon cause of FBL– May respond to anti-EBV therapy (AZT, gancyclovir) or HD MTXMay respond to anti-EBV therapy (AZT, gancyclovir) or HD MTX
Systemic non-Hodgkin’s lymphomaSystemic non-Hodgkin’s lymphoma– Up to 50% may be cured with standard chemotherapyUp to 50% may be cured with standard chemotherapy– CD4 count most important prognostic factorCD4 count most important prognostic factor– Attention to supportive care importantAttention to supportive care important– Reduced-dose regimens may result in inferior outcomeReduced-dose regimens may result in inferior outcome– Dose-dense or intense regimens not more effectiveDose-dense or intense regimens not more effective– Phase III trial of CHOP +/- rituximab completedPhase III trial of CHOP +/- rituximab completed– Ongoing studies evaluating infusional therapy +/- rituximabOngoing studies evaluating infusional therapy +/- rituximab
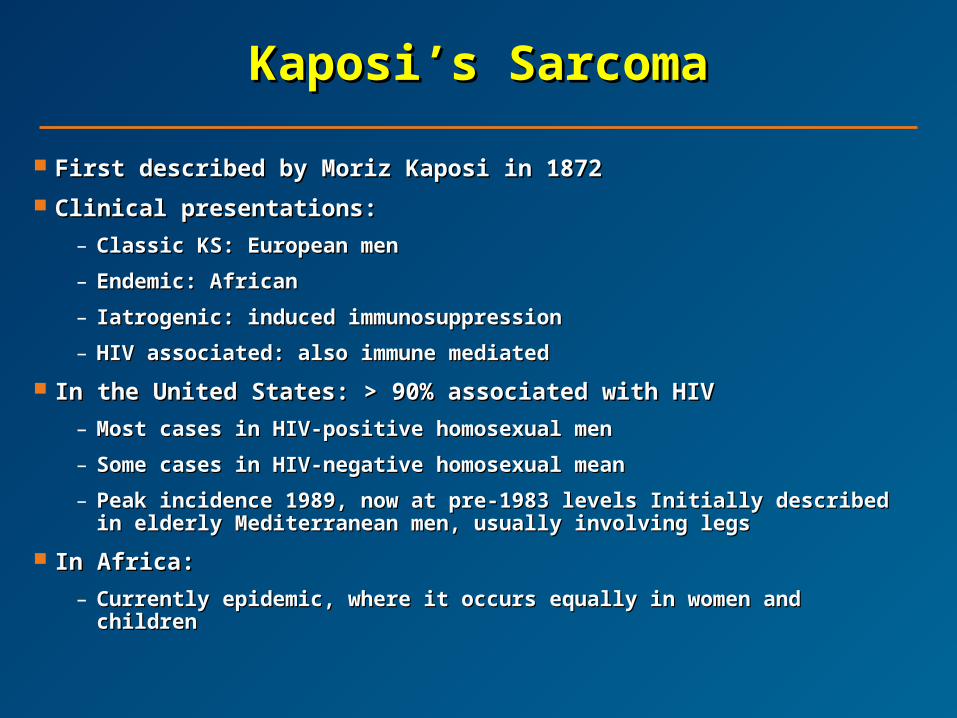
Kaposi’s SarcomaKaposi’s Sarcoma
First described by Moriz Kaposi in 1872First described by Moriz Kaposi in 1872
Clinical presentations:Clinical presentations:
– Classic KS: European menClassic KS: European men
– Endemic: AfricanEndemic: African
– Iatrogenic: induced immunosuppressionIatrogenic: induced immunosuppression
– HIV associated: also immune mediated HIV associated: also immune mediated
In the United States: > 90% associated with HIVIn the United States: > 90% associated with HIV
– Most cases in HIV-positive homosexual menMost cases in HIV-positive homosexual men
– Some cases in HIV-negative homosexual meanSome cases in HIV-negative homosexual mean
– Peak incidence 1989, now at pre-1983 levels Initially described Peak incidence 1989, now at pre-1983 levels Initially described in elderly Mediterranean men, usually involving legsin elderly Mediterranean men, usually involving legs
In Africa:In Africa:
– Currently epidemic, where it occurs equally in women and childrenCurrently epidemic, where it occurs equally in women and children

Histology and PathogenesisHistology and Pathogenesis
Associated with KSHV infectionAssociated with KSHV infection
– Human herpes virus (HHV-8) – DNA sequences found in KS lesion; Human herpes virus (HHV-8) – DNA sequences found in KS lesion; IHC for LNA-1 (encoded by ORF-73)IHC for LNA-1 (encoded by ORF-73)
– HHV-8 also associated with PEL, Castleman’s diseaseHHV-8 also associated with PEL, Castleman’s disease
– HHV-8 detectable in semen, salivaHHV-8 detectable in semen, saliva
– Incidence parallels HHV-8 seroprevalenceIncidence parallels HHV-8 seroprevalence
Histologic hallmarks:Histologic hallmarks:
– Spindle cell proliferationSpindle cell proliferation
– Red cell extravasationRed cell extravasation
– Cellular infiltrationCellular infiltration
Malignant cell appears to be of clonal lymphoepithelial originMalignant cell appears to be of clonal lymphoepithelial origin HIV viral antigens (eg, Tat) and cytokines (eg, IL-6) may promote HIV viral antigens (eg, Tat) and cytokines (eg, IL-6) may promote
proliferationproliferation Decreased incidence and virulence with HAART therapy Decreased incidence and virulence with HAART therapy

Principles of ManagementPrinciples of Management
Indications for cytotoxic therapyIndications for cytotoxic therapy– Life-threatening visceral involvementLife-threatening visceral involvement
– Cosmesis and/or lymphedemaCosmesis and/or lymphedema
Other therapeutic optionsOther therapeutic options– HAARTHAART
– Biological agents: alpha-IFN, imatinib, thalidomideBiological agents: alpha-IFN, imatinib, thalidomide
– IrradiationIrradiation
– CryotherapyCryotherapy
– Topical retinoidsTopical retinoids
– Intralesional therapyIntralesional therapy
Cytotoxic agentsCytotoxic agents– Liposomal anthracyclines (Doxil, DaunoXome)Liposomal anthracyclines (Doxil, DaunoXome)
– Antitubulin agents (paclitaxel, vinorelbine)Antitubulin agents (paclitaxel, vinorelbine)
Cancer and HIV InfectionCancer and HIV Infection
HIV-associated cancers have diminished but are HIV-associated cancers have diminished but are not uncommonnot uncommon
Lymphoma is potentially life-threatening but curableLymphoma is potentially life-threatening but curable
KS has a more indolent course in the HAART eraKS has a more indolent course in the HAART era
Non-AIDS-defining cancers are more commonNon-AIDS-defining cancers are more common
HIV infection is not a contraindication to cytotoxic HIV infection is not a contraindication to cytotoxic therapytherapy
Patients benefit from a multidisciplinary approachPatients benefit from a multidisciplinary approach
Clinical trials are available for patients with HIV-Clinical trials are available for patients with HIV-associated cancers – AIDS Malignancy Consortium associated cancers – AIDS Malignancy Consortium (http://www.amc.uab.edu)(http://www.amc.uab.edu)

Natural History of Cervical Natural History of Cervical NeoplasiaNeoplasia
00––1 Year1 Year 00––5 Years5 Years 11––20 Years20 Years
Invasive Invasive cervical cervical cancercancer
Cleared HPV infection
CIN 1CIN 1
InitialInitialHPV HPV
infectioninfection
ContinuingContinuinginfectioninfection
CIN CIN 2/32/3
Median duration, 1-2 yearsMedian duration, 1-2 years
Potential Cofactors for Progression:Potential Cofactors for Progression:
- HPV-related: type, variants, viral loadHPV-related: type, variants, viral load
- Parity, oral contraceptive useParity, oral contraceptive use
- SmokingSmoking
- Chlamydia, HSV-2 coinfectionChlamydia, HSV-2 coinfection
- Diet (vitamins A, C, E, carotenoids, Diet (vitamins A, C, E, carotenoids, folic acid, etc.)folic acid, etc.)
- Immunogenetics (HLA type)Immunogenetics (HLA type)
- Host factors: immune responseHost factors: immune response
Adapted from Pinto AP, Crum CP. Adapted from Pinto AP, Crum CP. Clin Obstet GynecolClin Obstet Gynecol. 2000;43:352-362.. 2000;43:352-362.
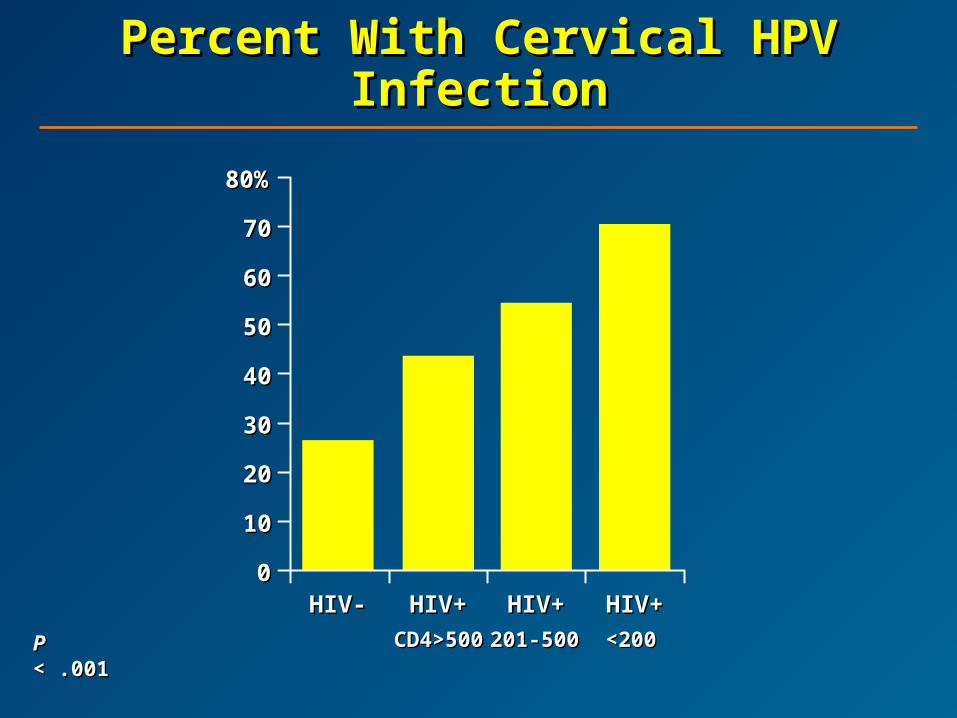
Percent With Cervical HPV Percent With Cervical HPV InfectionInfection
PP < .001 < .001
7070
80%80%
00
1010
2020
3030
4040
5050
6060
CD4>500CD4>500 <200<200
HIV-HIV- HIV+HIV+ HIV+HIV+ HIV+HIV+
201-500201-500

60%60%
00
1010
2020
3030
4040
5050
CD4>500CD4>500 <200<200
HIV-HIV- HIV+HIV+ HIV+HIV+ HIV+HIV+
201-500201-500
Percent With AbnormalPercent With AbnormalCervical CytologyCervical Cytology
PP < .001 < .001

Guidelines for Assessment Guidelines for Assessment of CIN in HIV+ Womenof CIN in HIV+ Women
Pap smear at initial evaluationPap smear at initial evaluation
Repeat Pap smear 6 months laterRepeat Pap smear 6 months later
If both negative, can do annual PapIf both negative, can do annual Pap
Low threshold for colposcopyLow threshold for colposcopy
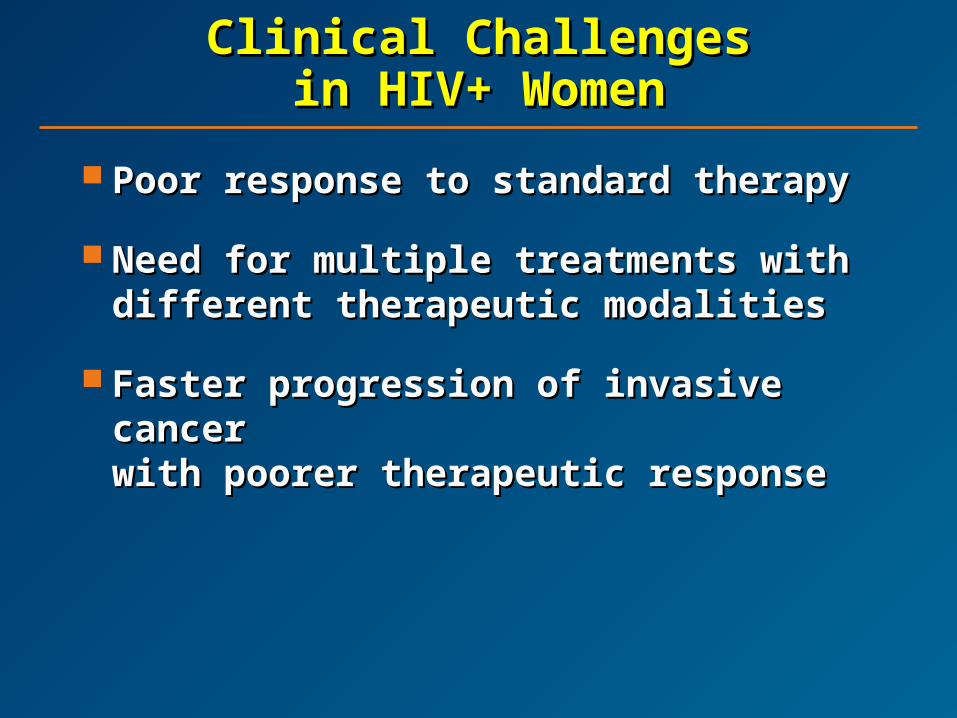
Clinical ChallengesClinical Challengesin HIV+ Womenin HIV+ Women
Poor response to standard therapyPoor response to standard therapy
Need for multiple treatments with different Need for multiple treatments with different therapeutic modalitiestherapeutic modalities
Faster progression of invasive cancer Faster progression of invasive cancer with poorer therapeutic responsewith poorer therapeutic response
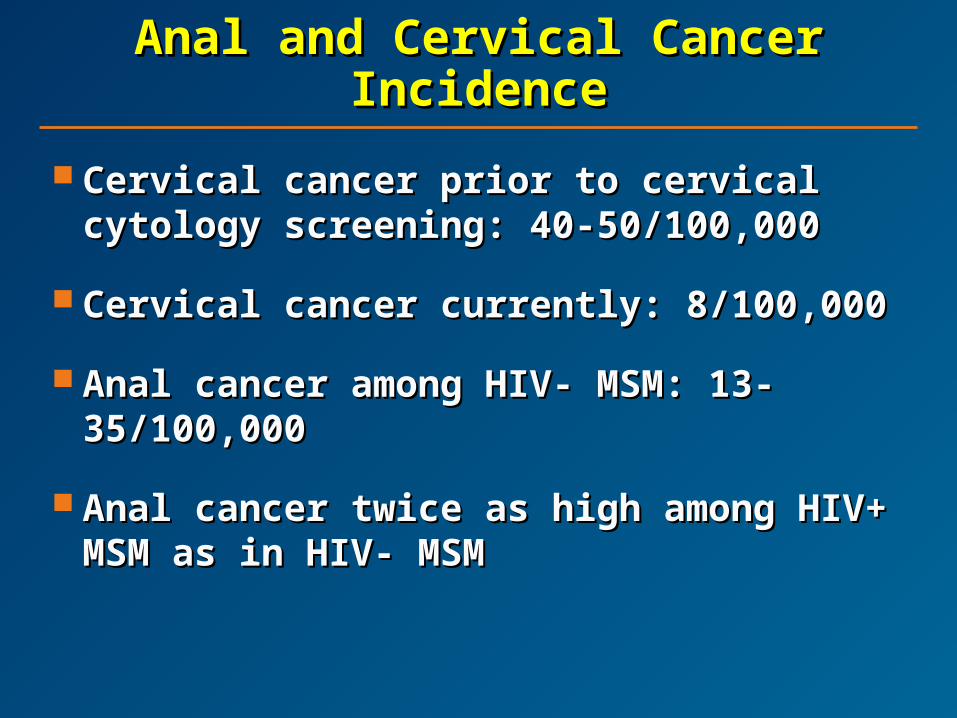
Anal and Cervical Cancer Anal and Cervical Cancer IncidenceIncidence
Cervical cancer prior to cervical cytology Cervical cancer prior to cervical cytology screening: 40-50/100,000screening: 40-50/100,000
Cervical cancer currently: 8/100,000Cervical cancer currently: 8/100,000
Anal cancer among HIV- MSM: 13-35/100,000Anal cancer among HIV- MSM: 13-35/100,000
Anal cancer twice as high among HIV+ MSM Anal cancer twice as high among HIV+ MSM as in HIV- MSMas in HIV- MSM
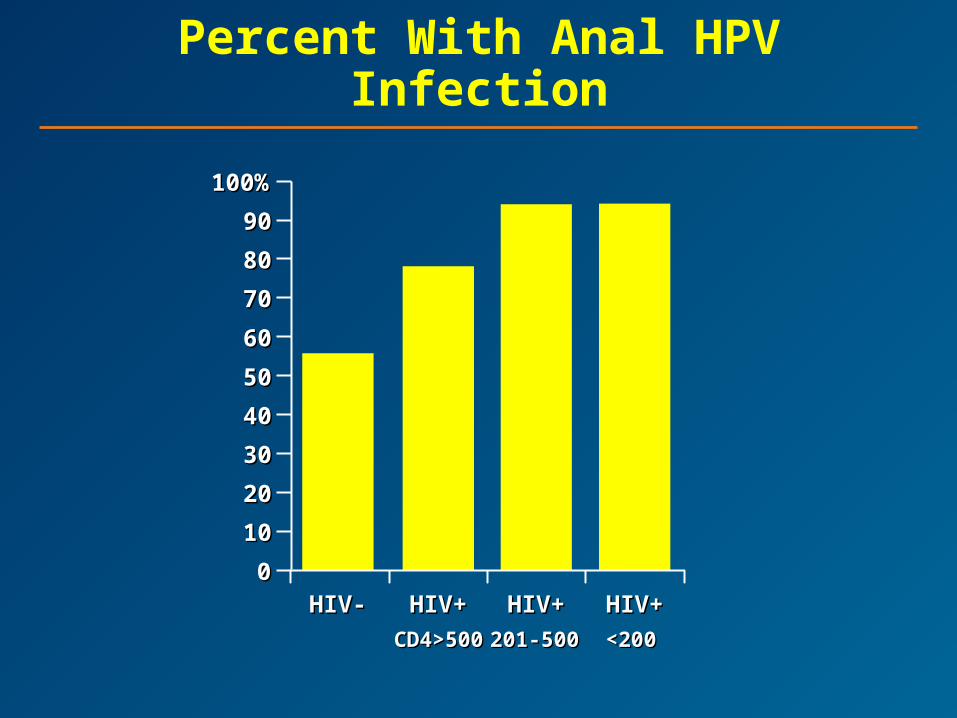
CD4>500CD4>500 <200<200
HIV-HIV- HIV+HIV+ HIV+HIV+ HIV+HIV+
201-500201-500
100%100%
00
1010
2020
4040
6060
8080
3030
5050
7070
9090
Percent With Anal HPV Infection
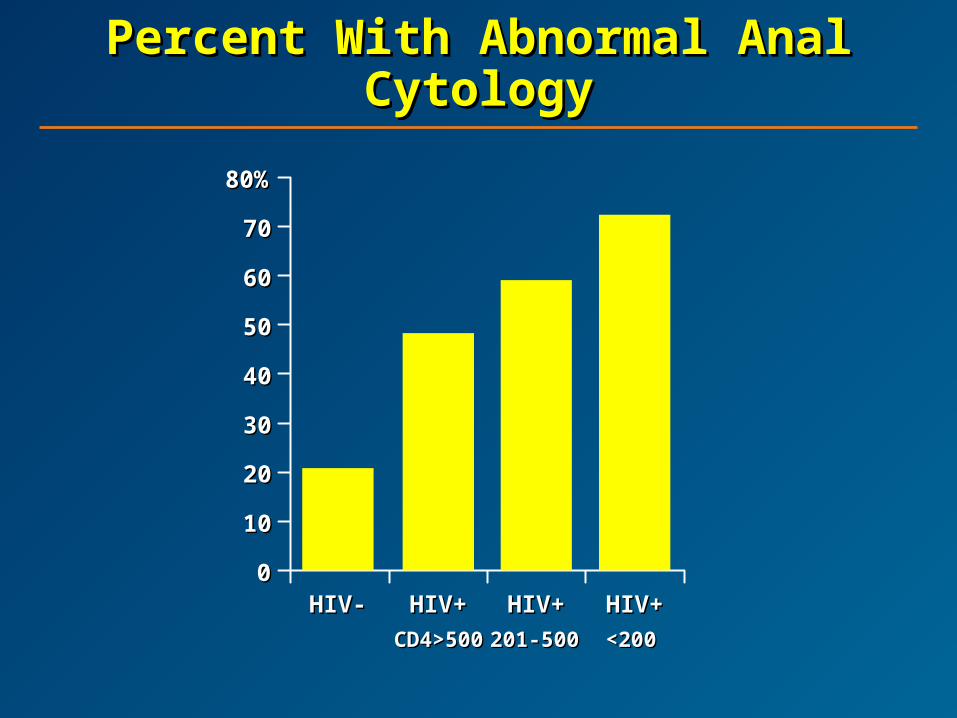
Percent With Abnormal Anal Percent With Abnormal Anal CytologyCytology
7070
80%80%
00
1010
2020
3030
4040
5050
6060
CD4>500CD4>500 <200<200
HIV-HIV- HIV+HIV+ HIV+HIV+ HIV+HIV+
201-500201-500
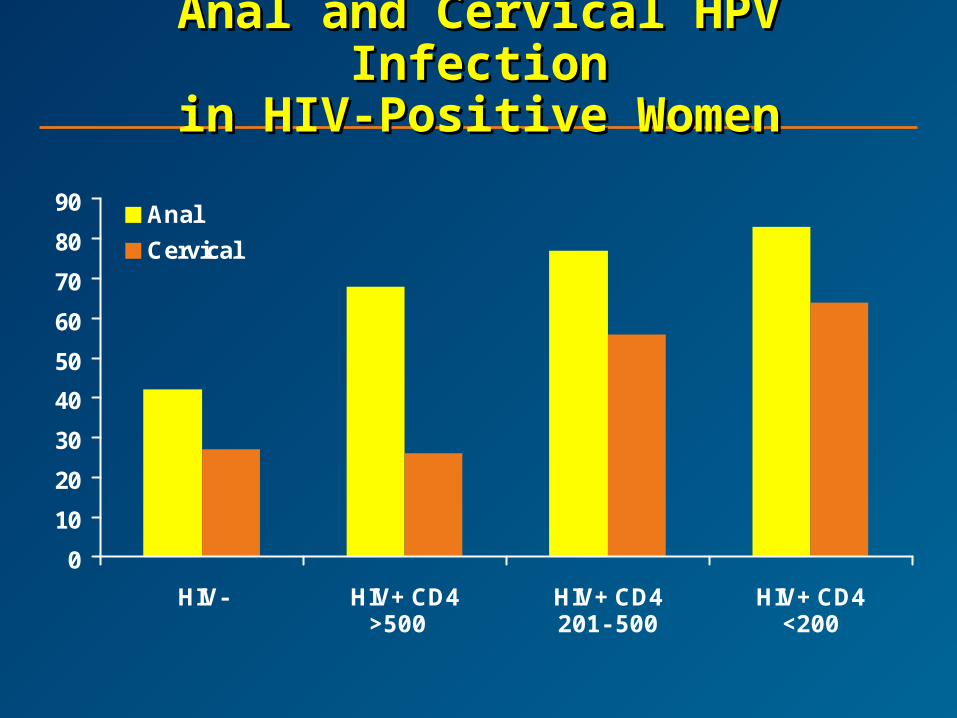
Anal and Cervical HPV InfectionAnal and Cervical HPV Infectionin HIV-Positive Womenin HIV-Positive Women
0
10
20
30
40
50
60
70
80
90
HIV- HIV+ CD4 HIV+ CD4 HIV+ CD4
Anal
Cervical
>500 <200201-500
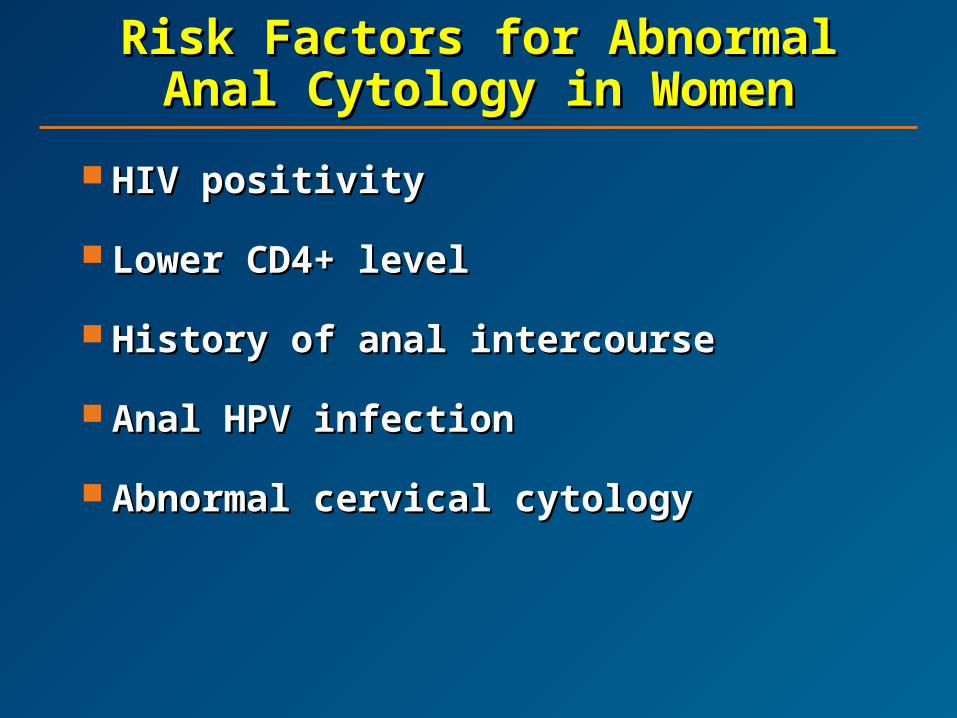
Risk Factors for Abnormal Anal Risk Factors for Abnormal Anal Cytology in WomenCytology in Women
HIV positivityHIV positivity
Lower CD4+ levelLower CD4+ level
History of anal intercourseHistory of anal intercourse
Anal HPV infectionAnal HPV infection
Abnormal cervical cytologyAbnormal cervical cytology

Percent of Men Developing AIN Percent of Men Developing AIN
2/3 at Intervals During Follow-2/3 at Intervals During Follow-up up
Months of follow-upMonths of follow-up
66% (CI)% (CI) PP
HAART use HAART use in HIV+ men in HIV+ men
NoNo
YesYes
5 (0-11)5 (0-11)
5 (1-9)5 (1-9)
23 (12-34)23 (12-34)
35 (27-43)35 (27-43)
52 (36-67)52 (36-67)
53 (44-62)53 (44-62)
65 (50-82)65 (50-82)
68 (58-77)68 (58-77)
.44.44
1212% (CI)% (CI)
1818% (CI)% (CI)
2424% (CI)% (CI)

Anal Cancer SinceAnal Cancer SinceIntroduction of HAARTIntroduction of HAART
Chiao et al. JAIDS. 2005;40:451-455Chiao et al. JAIDS. 2005;40:451-455
– Pre-HIV: 1973-1981 0.6/100,000Pre-HIV: 1973-1981 0.6/100,000
– HIV: 1982-1995 0.8/100,000HIV: 1982-1995 0.8/100,000
– HAART: 1996-2001 1.0/100,000HAART: 1996-2001 1.0/100,000
– Female-to-male ratio 1.6:1 1.2:1Female-to-male ratio 1.6:1 1.2:1
Bower et al. JAIDS. 2004;37:1563-1565 Bower et al. JAIDS. 2004;37:1563-1565
– 8640 HIV+ MSM in London8640 HIV+ MSM in London
Pre-HAART incidence – 35/100,000 patient-yearsPre-HAART incidence – 35/100,000 patient-years(95% CI, 15-72)(95% CI, 15-72)
Post-HAART incidence – 92/100,00 patient-yearsPost-HAART incidence – 92/100,00 patient-years(95% CI, 52-149)(95% CI, 52-149)

Who Should Be Screened?Who Should Be Screened?
All HIV+ MSM with good prognosisAll HIV+ MSM with good prognosis
All HIV- MSM over the age of 40All HIV- MSM over the age of 40
? Women with high-grade vulvar lesions? Women with high-grade vulvar lesionsor canceror cancer
? All HIV+ women? All HIV+ women
? All HIV+ men regardless of sexual orientation? All HIV+ men regardless of sexual orientation
? All men and women with perianal condyloma? All men and women with perianal condyloma
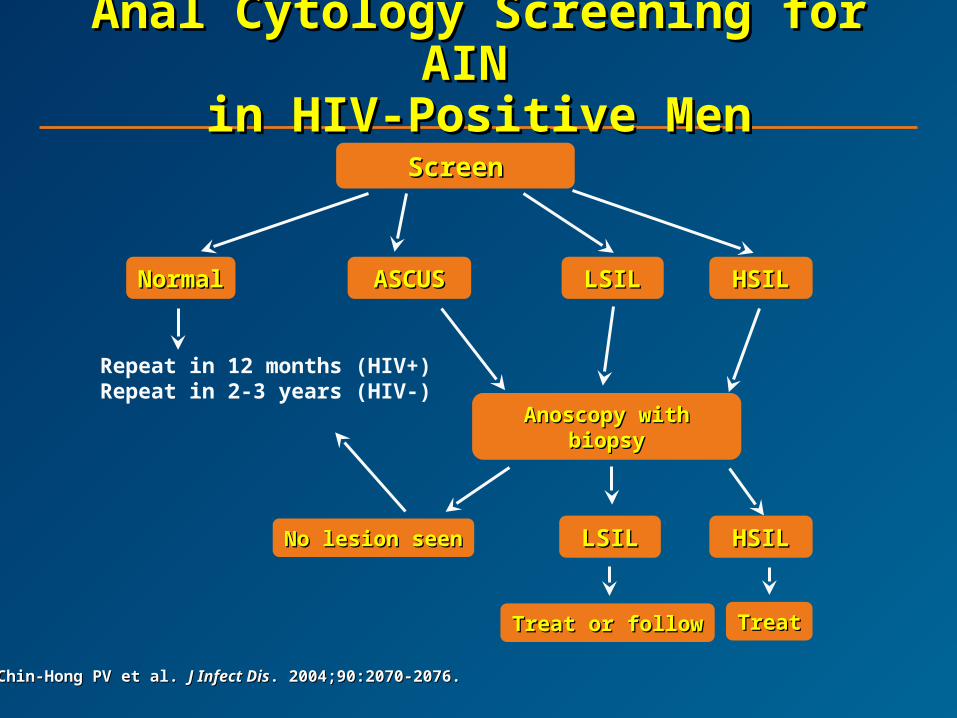
Anal Cytology Screening for Anal Cytology Screening for AIN AIN
in HIV-Positive Menin HIV-Positive Men
Chin-Hong PV et al. Chin-Hong PV et al. J Infect DisJ Infect Dis. 2004;90:2070-2076.. 2004;90:2070-2076.
ScreenScreen
NormalNormal ASCUSASCUS LSILLSIL HSILHSIL
Repeat in 12 months (HIV+)Repeat in 2-3 years (HIV-)
Anoscopy with biopsyAnoscopy with biopsy
Treat or followTreat or follow TreatTreat
No lesion seenNo lesion seen LSILLSIL HSILHSIL
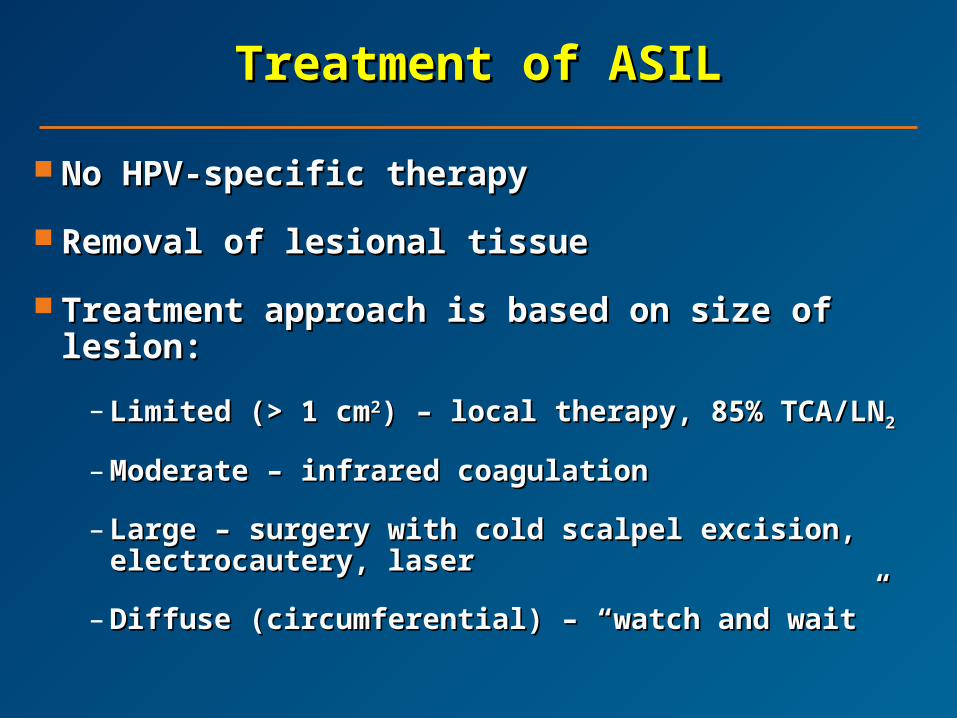
Treatment of ASILTreatment of ASIL
No HPV-specific therapyNo HPV-specific therapy
Removal of lesional tissueRemoval of lesional tissue
Treatment approach is based on size of lesion:Treatment approach is based on size of lesion:
– Limited (> 1 cmLimited (> 1 cm22) – local therapy, 85% TCA/LN) – local therapy, 85% TCA/LN22
– Moderate – infrared coagulationModerate – infrared coagulation
– Large – surgery with cold scalpel excision, Large – surgery with cold scalpel excision, electrocautery, laserelectrocautery, laser
– Diffuse (circumferential) – “watch and wait” Diffuse (circumferential) – “watch and wait”
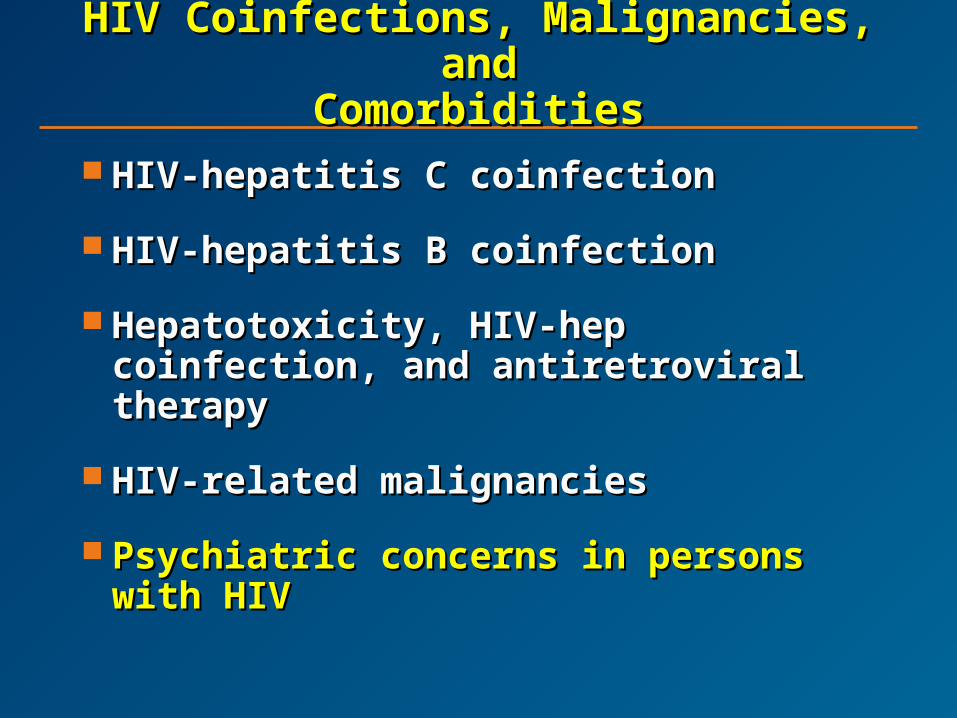
HIV Coinfections, Malignancies, HIV Coinfections, Malignancies, andand
ComorbiditiesComorbidities HIV-hepatitis C coinfectionHIV-hepatitis C coinfection
HIV-hepatitis B coinfectionHIV-hepatitis B coinfection
Hepatotoxicity, HIV-hep coinfection, and Hepatotoxicity, HIV-hep coinfection, and antiretroviral therapyantiretroviral therapy
HIV-related malignanciesHIV-related malignancies
Psychiatric concerns in persons with HIVPsychiatric concerns in persons with HIV
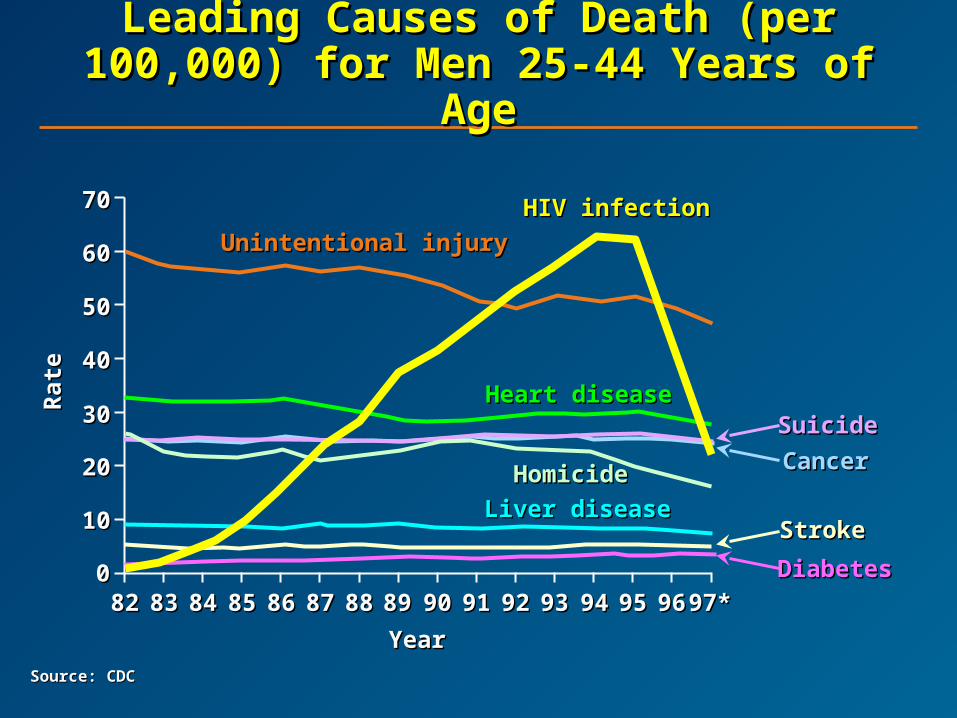
Leading Causes of Death (per Leading Causes of Death (per 100,000) for Men 25-44 Years of 100,000) for Men 25-44 Years of
AgeAge
Source: CDCSource: CDC
YearYear
Rat
eR
ate
008282
1010
2020
3030
4040
5050
6060
7070
8383 8484 8585 8686 8787 8888 8989 9090 9191 9292 9393 9494 9595 9696 97*97*
Unintentional injuryUnintentional injury
HIV infectionHIV infection
SuicideSuicide
CancerCancer
StrokeStroke
DiabetesDiabetes
Heart diseaseHeart disease
HomicideHomicide
Liver diseaseLiver disease
Prior Research Has Shown That Prior Research Has Shown That Psychiatric Patients:Psychiatric Patients:
Have increased risk for HIVHave increased risk for HIV
Are less likely to receive HAARTAre less likely to receive HAART
Are less likely to stay on HAARTAre less likely to stay on HAART
Are less likely to achieve an undetectable Are less likely to achieve an undetectable viral loadviral load
Are more likely to dieAre more likely to die

Association Between Mental Association Between Mental D/O and Time to HAARTD/O and Time to HAART
Time in YearsTime in Years
Pro
bab
ilit
y o
f H
AA
RT
Th
erap
yP
rob
abil
ity
of
HA
AR
T T
her
apy
P=0.05P=0.05
No mental disorderNo mental disorder
Mental disorderMental disorder
00 22 44 66
0.000.00
0.250.25
0.500.50
0.750.75
1.001.00

Association Between Mental Association Between Mental Disorder and Survival Disorder and Survival
No mental disorderNo mental disorder
Mental disorderMental disorder
P=0.10P=0.1000
Time in YearsTime in Years00 22 44 66
11P
rob
abil
ity
of
Su
rviv
alP
rob
abil
ity
of
Su
rviv
al
HIV Is a Psychiatric EpidemicHIV Is a Psychiatric Epidemic
HIV increases risk for psychiatric illnessHIV increases risk for psychiatric illness
Psychiatric illness increases risk for HIVPsychiatric illness increases risk for HIV
Effective treatment for psychiatric illness Effective treatment for psychiatric illness
– Can improve patient outcomeCan improve patient outcome
– Can decrease HIV transmissionCan decrease HIV transmission

Depression as AIDS Develops
Time of AIDS
Months Before and After AIDSMonths Before and After AIDS
00
1010
2020
-48-48 -36-36 -24-24 -12-12 66 1818
% D
epre
ssed
% D
epre
ssed

PharmacotherapyPharmacotherapy
Poor sleepPoor sleep Weight lossWeight loss AnxietyAnxiety GI disturbanceGI disturbance
NortriptylineNortriptylineDesipramineDesipramine
HypersomniaHypersomnia Weight gainWeight gain Suicide potentialSuicide potential ChronicityChronicity
FluoxetineFluoxetineSertralineSertralineParoxetineParoxetineFluvoxamineFluvoxamineCitalopramCitalopramEscitalopramEscitalopramVenlafaxineVenlafaxineDuloxetineDuloxetine
Failure from side effects Failure from side effects
Lithium augmentationLithium augmentationNeuroleptic augmentation (risk/benefit)Neuroleptic augmentation (risk/benefit)
Failure after good trialFailure after good trial
NEXT DRUGNEXT DRUG
TrazodoneTrazodoneNefazodoneNefazodoneBupropionBupropionMirtazepineMirtazepineMAOIsMAOIsAtomoxetineAtomoxetine
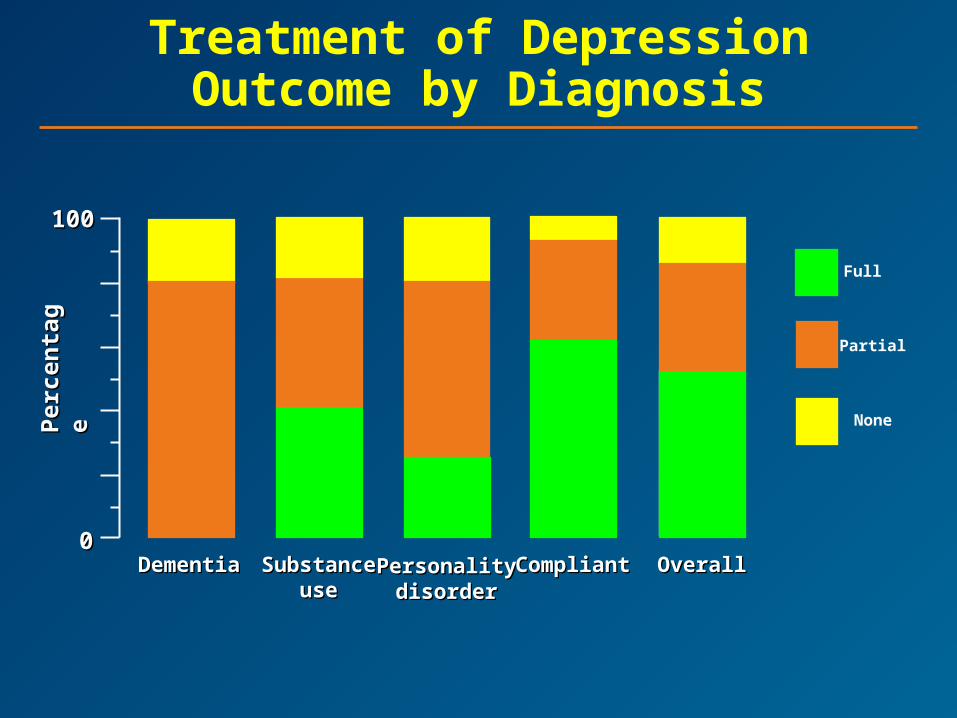
Treatment of DepressionOutcome by Diagnosis
00
100100
DementiaDementia SubstanceSubstanceuseuse
PersonalityPersonalitydisorderdisorder
CompliantCompliant OverallOverall
Full
Partial
NonePer
cen
tag
eP
erce
nta
ge