history of red lakes - nmfs scientific publications...
TRANSCRIPT
HISTORY OF RED LAKES FISHERY,
1917-38,
With Observations on
Population Status
Marine Biological Laboratory
OCT 2 8 1957
WOODS HOLE, MASS.
SPECIAL SCIENTIFIC REPORT- FISHERIES No. 229
UNITED STATES DEPARTMENT OF THE INTERIOR
FISH AND WILDLIFE SERVICE

EXPLANATORY NOTE
The series embodies results of investigations, usually of restricted
scope, intended to aid or direct management or utilization practices and as
guides for administrative or legislative action. It is issued in limited quantities
for official use of Federal, State or cooperating agencies and in processed form
for economy and to avoid delay in publication
,

United States Department of the Interior, Fred A. Seaton, Secretary
Fish and Wildlife Service
HISTORY OF RED LAKES FISHERY, 1917-38,
WITH OBSERVATIONS ON POPULATION STATUS
By
John Van Oosten and Hilary J. Deason
Fishery Research Biologists
Special Scientific Report- -Fisheries No. 229.
Washington, D. C.
August 1957

ABSTRACT
A historical account traces the development of the commercial
fisheries of the Red Lakes, Minnesota, from its inception in 1917 as a
war measure through 1938 . The trends of production and catch per unit of
effort were followed for the principal species with notes on statistics of
the minor fishes. Life history data were recorded for the walleye and yellow
perch . A historical account was presented of the artificial propagation of the
walleye and whitefish from 1918 through 1938.
NOTE
This report, covering research done in 1938, was completed just
before World War II. Because it contains data of historical interest and of
value to fishery researchers, it is now being published, particularly in view
of the current investigations on the Red Lakes by the University of Minnesota
in cooperation with the U . S . Fish and Wildlife Service
.

CONTENTS
Page
Description of the Red Lakes 1
History of the Red Lakes fisheries 3
Events that led to the investigation 11
Fishes of the Red Lakes 11
Statistics of the Red Lakes fisheries 14
Total yield and value 14
Relative Importance of Upper and Lower Red Lakes 14
Production by Indian and white fishermen 17
Seasonal distribution of the catch 17
Fishermen 19
Fishing effort 19
Average catch per lift 20
The walleyes of Lower Red Lake 25
Length-frequency distributions 25
Rate of growth 27
Comparison of the growth in Lower Red Lake and in other
waters 27
Length-wei^t relation and coefficient of condition 31
Maturity and sex ratio •. 31
Spawning habits and season 38
The yellow perch of Lower Red Lake 40
Length -frequency distributions 40
Rate of growth 40
Length-wei^t relation and coefficient of condition 42
Maturity and sex ratio 48
The goldeye of the Red Lakes 48
The freshwater drum of the Red Lakes 48
Notes on the whitefish 50
Notes on the northern pike 50
Notes on the suckers 50
The rock bass 50
Artificial propagation 50
Walleye 51
Whitefish 57
Brook, brown, rainbow, and lake trout 60
Summary 60Literature cited 63


HISTORY OF RED LAKES FISHERY, 1917-38,
WITH OBSERVATIONS ON POPULATION STATUS
The commercial fishing activities of the
Red Lake Indians on Lower and Upper Red Lakes,
Beltrami and Clearwater Counties, Minnesota,
have constituted their principal source of in-
come during several months of each year since
the fisheries were established on a continuing
basis in 1919. It has been estimated that ap-
proximately 1,500 Indians on the reservation
depend on fishing for part of their livelihood.
The fisheries, as described in detail later,
were first established in 1917 by the State of
Minnesota as a food-conservation measure, but
later were conducted principally to provide the
Indians an additional source of income . In 1929
the State was restrained by a decision of the
Minnesota Supreme Court from operating a fish-
ery for profit. Thereafter, the producing and
marketing were carried on by an Indian
-
owned cooperative. The Red Lake Fisheries
Association, Incorporated.
It has been assumed by many that the Of-
fice of Indian Affairs, U.S. Department of the
Interior, and the State of Minnesota have con-
current jurisdiction over the Red Lakes
.
However, under the Treaty of 1889 the Red Lake
Indians ceded liie Red Lakes to the United States
and not to Minnesota. The State of Minnesota
does not have jurisdiction over the fish in the
reservation waters of the Red Lakes . Minnesota,
however, has the power to regulate the sale and
transportation of all fish in non-reservation
areas
.
This is the report of an investigation
which involved actual field work in August and
September 1938, and made at the request of the
U.S. Commissioner of Indian Affairs. The brief
investigation resulted in the accumulation of
biological data on the principal species, and a
study of all available records and literature
afforded an appraisal of the fishery resource,
fishing methods and practices
.
DESCRIPTION OF THE RED LAKES
Upper and Lower Red Lakes are situated
principally in Beltrami County, only the extremewestern portion of the lower lake being located
in Clearwater County, Minnesota (fig. 1). At
least 15 tributaries drain into the lakes, the two
largest being the Tamarack River entering Up-per Red Lake and the Black EXick River flowing
into Lower Red Lake . The outlet is located in
Lower Red Lake at the head of the Red LakeRiver, a branch of the Red River of the North
.
The lakes, which cover an area of approximate-
ly 443 square miles, are situated in the south-
ern part of the Hudson Bay drainage basin. Theentire area of Lower Red Lake and 49 percent
of the area of Upper Red Lake lie within the
boundaries of the Red Lake Indian Reservation.
Upper Red Lake covers an area of ap-
proximately 188 square miles or 120,320 acres.
A curved line drawn across the lake connecting
the reservation boundaries appears to be the
official method of separating non -reservation
from reservation waters . On the basis of that
division 92 square miles (58,880 acres) lie with-
in the reservation and 96 square miles (61,440
acres) outside of the reservation. The total
length of shoreline is calculated to be 63 .3 miles
of which 30.6 miles are within the reservation
and 32 . 7 miles outside . Upper Red Lake has a
maximum length of 24.3 miles and a maximumwidth of 9.8 miles. The lake is connected near
its southwestern extremity with Lower Red Lake
by means of a navigable channel (called the
"Narrows") that has a minimum width of approx-
imately . 9 mile
.
The total surface area of Lower RedLake is about 2 55 square miles (163,200 acres)
and the shoreline is calculated to be 73 miles in
length. The lake has a maximum length of 24.4
miles and a maximum width of 14.5 miles (in
the region of the "Narrows ')
.


The Red Lakes are single basin lakes
with very regular shorelines virtually without
protected bays or coves . (Sisters Bay on Upper
Red Lake, east of the "Narrows", is the only
prominent bay) . The maximum depth of Lower
Red Lake was reported to be about 40 feet and
the average depth between 20 and 25 feet. The
maximum depth of Upper Red Lake was re-
ported to be about 14 to 18 feet with an average
of 8 to 10 feet.
TTie shores of Lower Red Lake and the
southern shore of Upper Red Lake are habitable
.
The northern shore of Upper Red Lake is low
and marshy with fairly dense aquatic vegetation
and generally is not suited for human habitation.
A very small number of white settlers live near
the shores of Upper Red Lake, outside of the
reservation boundaries . The inhabitants of the
shore areas of waters within the reservation
boundaries are exclusively Indian.
No hydrographic or limnological surveys
have been made of the Red Lakes prior to 1938
.
Dr . Samuel Eddy of the University of Minnesota
made a few observations on Lower Red Lake on
August 5 and 6, 1933, which he summarized in a
letter as follows: turbidity with Secchi disk, 1
meter; pH (hydrogen -ion concentration) at sur-
face 8.5, at 8 meters 8.0; dissolved oxygen at
surface 8.3 p. p.m., at 8 meters 8 p.p.m.
Bottom samples were collected but not studied.
Dr. Eddy stated that mayfly larvae, Hexagenia,
were abundant in the deeper waters . The sur-
face waters of Upper Red Lake contained 5 p.p.
m, of free carbon dioxide, 147.5 p.p.m. bi-
carbonates, and the pH was 8 .5 on September 4,
1938. In another letter Dr. Eddy observed:
"This lake (Lower Red Lake) is relatively shal-
low and without any thermal stratification
.
From my casual observations it seems to be
similar to several other lakes which we have
surveyed in more detail. These lakes consti-
tute a type which are among our most productive
lakes, due to the shallow condition and the fact
that the entire bottom is available for food pro-
duction for fish."
The 1938 investigation entailed no limno-
logical studies.
HISTORY OF THE RED LAKESFISHERIES
The Red Lakes were reported to have
been so heavily populated with fish before 1918
that each year vast quantities of various species
died and were beached along the shores . The
principal species, the walleye Stizostedion
vitreum vitreum (Mitchill), was reported to have
been small and scrawny ("razor-backed") and
the flesh poor. S. A. Selvog (1925?), the first
State Superintendent of the Red Lakes fisheries,
reported that in 1917 and 1918 these pike "did
not compare on the market with the pike from
other waters, and averaged scarcely a pound in
weight. It is not uncommon now to take pike
weighing four to six pounds and frequently more,
and a shipping box can be filled with half the
number of pike necessary in the beginning
the quality of fish in Red Lake has been materi-
ally improved by the removal of a part of the
abundant supply." In an earlier report (1922)
he stated, "In 1918 it required from 125 to 137
walleyed pike to fill a box of 150 pounds, where-
as during the season of 1922 the number re-
quired for the same sized box is from 70 to 85,
indicating a marked increase in the average
size of the fish . It also appears that during
recent seasons dead fish have not been obseirved
in any great numbers around the shores of the
lake in the summer time ... ."
Albert C. Klancke (1929), then State
Supervisor of Commercial Fi shing, wrote, "It
has been demonstrated that the taking of the
pike, at least, from the waters of Red Lake,
has increased the size and quality of the remain-
ing fish . This was realized after a few years of
operations."
Prior to the fall of 1917 the only fish-
ing activities on Lower and Upper Red Lakes
were conducted by the Indians of the Red Lake
Reservation as a source of food. Whitefish and
sheepshead for use during the winter were sun
dried, or salted and smoked by the majority of
the Indian families . The laws of Minnesota at
that time prohibited the commercial exploita -
tion of the fishery resources of any of the inland
waters of the State
.

Economic conditions during the war, the
resultant high price of meat and meat products,
and the necessity of conserving other food sup-
plies were the principal reasons for the estab-
lishment of the commercial fishing industry of
the Red Lakes (Avery, 1918) . The clamor for a
supply of reasonably priced fish as a substitute
for meat even led to the unreasonable request
that the Minnesota Commissioner of Game and
Fish "give the settlers their rights to kill gameand catch fish at any time regardless of gamelaws." The Governor and the Minnesota Public
Safety Commission (State War Board) were de-
luged with similar appeals . At the request of
the Public Safety Commission (resolution of
September 12, 1917), the Commissioner of
Game and Fish formulated a plan for commer-cial fishing operations and wholesaling in someof the larger inland lakes of Minnesota to be
conducted under his supervision.
A commercial fishing enterprise was be-
gun on the Red Lakes during the fall of 1917
with a basic fund of $1,000 appropriated by the
Minnesota Public Safety Commission. Because
of the lack of equipment there was little com-mercial fishing during the fall of 1917, but four
pound-nets were set off Redby and two off Pone-
mah in Lower Red Lake in May 1918 by State
crews . By the fall of 1918 the State owned 10
pound-nets and 2 gill -nets (Avery, 1919). Col-
lecting stations were established to which the
Indians, who fished with hook and line and with
gill-nets, and the State pound-net fishermen de-
livered their catches for sorting, packing, and
shipment. The fish were shipped to various
points in Minnesota where they were sold by the
State at less than the prevailing market prices
.
The first pound-net lifted in Lower RedLake caught 9,657 pounds of fish, approximately
80 percent of which were walleyes . "The fish
were found to be so abundant that during Mayand June (1918) from two to four thousand
pounds at a lift were taken from the pound-nets
in use." (Avery, 1918) . It was reported that in
1918 a gill-net 300 feet long would catch 300
walleyes, and that approximately 1,500 pounds
of fish were caught by one Indian in a single lift
of 2,000 linear feet of gill-nets. S.A. Selvog
(19257) wrote, "During the war period, this
department earned an actual profit of approx-
imately $40,000, due largely to the fact that dur-
ing the seasons of 1917 and 1918 virtually all the
fish produced in Red Lake were taken by our
crews and equipment, whereas the fish producedsince then has been purchased largely from in-
dividual fishermen. There was a loss in 1919
and 1920, but since 1921 the industry has been
more than self-sustaining, and no money has
been appropriated for its maintenance except
the original $1,000 appropriated by the Public
Safety Commission in 1917, which was refunded
in 1918." In 1918 the majority of the Indians
fished with hook and line, but in 1919 they
started to use rather extensively, gill-nets of
3-1/2-inch mesh, stretched measure.
Mr . Art Allard, a white man, who wasemployed almost continuously on the Red Lakes
as a spawn -taker by the State during the period
1918-1929, informed us that during the years
1920 to 1922 walleyes taken in pound-nets weresorted for the market. The larger fish, which
brought the best prices, ran 40 fish per 100
pounds (average 2-1/2 pounds). At that time
pound-netters took no walleyes under 1 pound
(sometimes under 1-1/2 pounds) and often sorted
the 3 -pound and larger individuals (3 to 7 pounds;
average about 4 pounds) for the New York mar-ket. The walleyes taken in the 3 -1/2 -inch meshgill -nets averaged about 1 pound in weight.
There was then a fairly good supply of the big-
ger fish, and in the fall 4- to 7-pound walleyes
were plentiful . Large northern pike were also
common . TTie pound-nets were lifted, on the
average, every 2 days and never fished uninter-
ruptedly longer than 3 days
.
Mr. Allard said the State at first per-
mitted the Indians to employ a 3 -1/2 -inch mesh,then increased the size to 3-3/4 Inches. Hesaid that no dead fish were found around the
State's pound-nets, except that occasionally
sheepshead ran into the nets in such tremendous
numbers that many were killed by the crowding.
The small pike were released without apparent
harm.
In 1919 it was proposed that the RedLake fisheries be abandoned, but their continu-
ance was recommended by the Minnesota

Commission of Public Safety and sanctioned by
the Legislature in order that some employment
might be provided for the Red Lake Indians and
for the white settlers on Upper Red Lake outside
of the boundaries of the reservation (Klancke,
1929)
.
The Minnesota State Fisheries of the
Red Lakes was established with a revolving fund
to be used for state fishing operations, and from
1920 to 1928 inclusive, the State of Minnesota,
through its Commissioner of Game and Fish,
acted as a distributor and wholesaler of the fish
produced. The State continued to fish pound-
nets, however, except in certain years as, for
example, 1923 and 1924; usually six were in
operation but as many as eigjit or ten had been
used. Toward the close of the period of the
State's operation and management of the fisher-
ies only four pound-nets were used. The catch-
ing of fish by State pound-net crews in
competition with the Indian gill -net fishermen
was a source of controversy and dissatisfaction.
The Indians fished under a contract be-
tween the Commissioner of Indian Affairs, U.S.
Department of the Interior, and the State of
Minnesota . The first contract, dated April 28,
1921, was renewed June 26, 1923, and January
25, 1924 (for a period of 5 years until January
25, 19-29) . The 1924 renewal stipulated amongother items that the fish should be taken by gill-
nets and hook and line, and that the Red Lake
Tribe should be paid royalties on all fish pur-
chased from the Indians, and larger amounts for
all fish taken by State crews. Each Indian fam-
ily was limited to 1,500 feet of gill-nets with a
mesh of not less than 4 inches, stretched
measure, and the annual production from the
Red Lakes was limited to 650,000 pounds, ex-
clusive of rough fish (sheepshead, goldeyes, and
suckers) . (Under the terms of the contract re-
newal of 1924 the maximum was reduced from
750,000 pounds despite the fact that the Indians
had requested an increase of 100,000 pounds in
the annual production limit. The reduction re-
portedly was made because the lake level was14 inches lower in 1923 than it was in 1922, and
it was feared that the walleye population would
decrease because of the inability of the spawn
-
ers to enter the tributary streams) . Under
this contract fishing was carried on to 1929
.
In 1924 a fish hatchery building, a damand concrete spillway in Mud Creek to provide a
water supply for the hatchery, and three cottages
for state employees were erected. The total
initial cost of these structures was reported to
be $40,394.92, all financed by profits from the
sale of fish caugjit in the Red Lakes (typewritten
report of Minnesota State Fisheries for the per-
iod July 7 to November 15, 1924, dated January
1, 1925). Boats and equipment purchased at the
time increased the assets by $7,021.04. No
state appropriations were involved in the im-
provements and purchases
.
Although the fishing operations were
covered by a contract, there nevertheless de-
veloped a number of unsatisfactory features
.
Not only did the Indians object to the competition
of the State pound-net crews, but dissatisfaction
also arose concerning the wholesaling operations
conducted by the State -appointed manager. The
Red Lake Tribal Council passed a resolution on
November 20, 1922, which asserted that the
State was wantonly wasting the resources of the
Red Lakes by refusing to accept and market
"rough fish"; that the weighing in of fish caught
by the Indians was inaccurate; and that the
Indians were not being paid a fair price for their
catches . The resolution embodied a plea that
the Superintendent of the Red Lake Indian Agen-
cy endeavor to find a better market for the
Indians' fish, and that he appoint a qualified in-
dividual to check the weights of all fish caught
by the Indians and delivered to the fishery plant
at Redby. EXssatisfaction was also expressed
with respect to the late opening (July 1) of the
fishing season which forced the Indians to oper-
ate at a time when fish were least available
.
A check-wei^er was appointed by the
Superintendent of the Red Lake Agency and a
provision for a check-weigher was written into
the contract renewal of January 25, 1924 . "ITie
completion of a cold storage plant and smoke
house in 1924 enabled the State to handle the
rough fish which formerly were wasted. On
May 20, 1925, the Agency Superintendent re-
ported to the Commissioner of Indian Affairs
that an investigation of prices paid by private

companies to Minnesota fishermen on the inter-
national boundary waters (Lake of the Woods and
Rainy Lake) demonstrated that the State of Min-
nesota underpaid the Indians for their fish
.
Controversy arose in 1926 between the
state fishery superintendent and the Indian fish-
ermen over the use of illegal nets and conse-
quent destruction of undersized fish .- ManyIndians were found (by state inspection, July 1926)
to be using 3-1/2-inch mesh and a still larger
number were using 3-3/4-inch mesh, althougti
the terms of the contract between the Minnesota
Commissioner of Game and Fish and the Com-missioner of Indian Affairs specified that a meshof not less than 4 inches, stretched measure,
should be used by all Indians who sold fish to the
State . The state fishery superintendent demand-
ed that all illegal nets be turned over to the RedLake Indian Agency. The agency superintendent
affirmed that the Indians could employ whatever
net mesh they chose in taking fish for their ownconsumption, but that all Indians would be in-
formed that fish caugfit with illegal nets could
not be sold to the State. Apparently, the super-
intendent of the fisheries was not satisfied with
this decision for he refused to buy fish from
Indians who had illegal nets in possession, as
determined by an inspection made by one of his
employees.
State Supervisor, Albert C . Klancke
(1929), expressed the State's views in regard to
the method of fishing by the Indians as follows:
"The method of taking (fish), however, does not
commend itself. Gill nets are used almost ex-
clusively, and unless utmost diligence is exer-
cised, the marketable condition (of the fish) is
not the best. Hence, Red Lake fish do not
\J In the Bemidji (Minn.) Sentinel of February,
1927, the State Superintendent wrote: "The last
season, 1926, was the most deplorable situation
of all the years I had charge of that industry
(since 1917). There were thousands of little
pike produced that had not attained a length of
more than seven or eigjit inches, thousands of
pike were delivered to us of this size and what
was delivered to us was only a drop in the buck-
et of what they left to rot at home, or at their
fishing stations ... .
"
command the price usually paid for pound net
catches . Weather conditions on Red Lake often
preclude the taking of fish at desired periods,
with the result that at times more fish are pro-
duced than can properly be taken care of at the
fishery plant and for which a desirable market
can be found. These matters can, however, be
properly regulated when the fishermen them-
selves realize that it is to their advantage to
strictly adhere to the fishing regulations and an
effort made to deliver the fish in the best possible
condition. It is to be hoped that in the near
future only pound nets will be utilized, thus
assuring an even run of fish, better in size and
condition, and when the market commands the
best prices." Later (1931) he wrote: "It has
been urged that the use of gill nets in taking the
catch should be done away with . The use of
pound nets should be substituted, for by the use
of such equipment production can be controlled,
and better prices obtained for the catch, with
the assurance that the quality will be the high-
est."
At the time of the 1938 investigation gill
nets were set and lifted by hand, usually from a
row boat. Except when a storm prevented lift-
ing, all nets fished one ni^t out, being set in
the late afternoon or early evening and lifted
early the next morning. The nets were cleared
on shore except the whitefish gill -nets operated
in tile fall, which were cleared when lifted so
that the nets could be reset. Most of the fishing
was done within 1-1/2 or 2 miles from shore,
although some nets were set as far as 4 or 5
miles offshore. In spring and early summerwhen the water is cold the fish are near the
shore but as the water warms they move into
deeper water (20 to 40 feet) so that the nets are
set farthest from shore during the warm season.
In order to obtain fish for home consumption
some Indians operated gill nets through the ice
and many continued to use all of their gill nets
after the summer season for commercial fish-
ing had been closed.
The legal right of the State of Minnesota
to conduct a wholesale fish business for private
profit in competition with private industry waschallenged in a summons and complaint served
on the Commissioner of Game and Fish of Min-

nesota on May 31, 1927, at the instigation of a
licenced wholesaler and buyer of fish at Winona,
Minnesota . The Attorney General of the State
of Minnesota interposed a demurrer to the com-plaint, which demurrer was overruled by the
District Court of Ramsey County. The case
was then appealed to the State Supreme Court
whose decision (February 17, 1928) upheld the
action of the lower court which, then, on Janu -
ary 14, 1929 issued an order that restrained
the State from engaging in the commercial buy-
ing of fish In competition with private industry.
Shortly after the issuance of this order
the Minnesota Legislature passed an act (Act,
March 22, 1929, Chapter 84) authorizing the
Commissioner of Game and Fish to lease the
Red Lakes fishery plant to the United States or
its authorized agency. This act Is the legal
basis on which the Red Lake Fisheries Associa-
tion has operated and it is given here verbatim
.
Section 5592, subsections 1-8, of the Laws of
1929 foUow:
" 5592-1 . Fish may be taken and soldfrom certain lakes.—^i-Jhaiever the coiranission-
er of game and fish shall find after inves-tigation that any kind or kinds of fish maybe taken from Upper Red Lake in Beltramicounty or from Lower led Lake in Beltramiand CleDrv/ater counties, or from any partof said lakes, without unduly depleting suchfish therein, he may, so lonz as such condi-tion shall continue, permit such fish to betaken in said lakes or in such part thereofas he may desi^iate, in such manner as hemay deem proper, and may permit such fish tobe possessed, transported, sold, or other-wise disposed of j such taking, possession,transportation, sale, or other dispositionto be under the supervision of the commis-sioner and subject to such regulations as
he may prescribe, and subject to suspensionor termination at any time as to any kindof fish whenever the commissioner shall findthat such fish cannot be taken without un-duly depleting the same ./Stained withoutchange in Laws of 1939, art. kiu/
"5592-2. Commissioner to make regula-tion^o—The commisKioner is hereby empovreredto m.ake all needful and proper regulationsfor the purposes of this act, and to requirepersons taking, possessing, transporting,selling, or otherwise disposing of such fish
to obtain licenses and to pay such license
fees or other charges as he deems proper to
defray the cost of administration and en-
forcement of this act and to contributetoward the expense of conservation and
propagation of fish in said lakes. Retainedwithout change in Laws of 1939, art. UST/
"5592-3 . Violation a misdemeanor .
--Violation of any regulation prescribed bythe commissioner under this act shall be
deemed a violation of this act, and shallbe a misdemeanor, ^^Deleted in Laws of 1939^
" 55924; . itestriction.-^Io fishshall be taten from the portion of saidlakes within the Sed Lake Indian reserva-tion in violation of any law or regulationrelating thereto prescribed by or under theauthority of the United States, and allregulations made by the commissioner of
game and fish under this act relating to
the taking of fish from said Indian reserva-tion waters shall be made subject to compli-ance with such federal lavjs and regulations.Retained without change in Laws of 1939,art. 2llj_^
"5592^5. Commissioner may leaseplant and equipment .—^The commissioner ofgame and fish is hereby authorized to leasethe state fisheries plant and equipment at
Redby to the United States or to any properauthorized agency thereof for such term or
terms from time to time and upon such con-ditions as to rental and otherwise as heshall deem reasonable, subject to termina-tion by direction of the legislature at anytime, provided, that such plant and equip-ment shall be used only for the benefit ofthe Indians and other persons taking fishfrom said lake in accordance with the pro-visions of this act. The commissioner is
also authorized to lease the state fishhatchery and equipment at Redby to theUnited States or to any proper authorizedagency thereof upon like terms and condi-tions and subject to termination in likemanner provided that said hatchery shall beoperated only for the propagation of fishin said lakes or such other waters of thestate of Minnesota as the commissioner maydesignate; or the commissioner may, in hisdiscretion, continue to operate said hatch-ery, ^^tained without change in Laws of1939, art. kSJ/
"5592-6. Disposition of fees .
—

All fees and rentals under this act shallbe paid to the commissioner of game and fishand shall by him be tr.ansmitted to the statetreasurer, who shall credit the same to thestate fish revolving fund constituted underthe provisions of General Statutes 1923,Section 560I4, and acts amendatory thereof
and supplementary thereto. In addition to
the purposes prescribed by said Section
^OU, all moneys in said funds shall here-after be available to pay the cost of ad-
ministration and enforcement of this act andthe cost of propagation and conservation of
fish in said lakes, and said moneys are
hereby appropriated therefor so far as maybe necessary. Said Section 560I4. is herebymodified and amended, so far as inconsistentherewith, so as to conform herewith.
Retained without change in Laws of 1939,art. 76}7
" 5592-7 . /Vets subject to penalty andforfeitures of other acts.—This act shallbe part of the laws relating to wild animals,
and violations thereof shall be subject tothe same penalties and forfeitures as pre-scribed for violations of such laws.
^Retained without change in Laws of 1939,art. 331^
"5592-8. Acts supplementary .—Thisact shall be supplementary to all otherlaws applicable to the taking or dispositionof fish from said lakes, and shall not bedeemed to repeal or supersede any such otherlaw except so far as directly inconsistentherewith." /Deleted in Lavfs of 1939^
On March 27, 1929, shortly after the en-
actn^ent of the above legislation, the Red LakeFisheries Association was organized and in-
corporated under the laws of Minnesota by the
Red Lake Tribe, in order that the commercialfisheries of the Red Lakes might be exploited
judiciously and profitably by the Indians
.
The Commissioner of Indian Affairs, U.
S . Department of the Interior, authorized the
Red Lake Indians to engage in commercial fish-
ing on the waters of the Red Lakes within the
boundaries of the reservation and accorded of-
ficial sanction to the Red Lake Fisheries
Association. An agreement was reached betweenthe Association and the Minnesota Game and Fish
Commissioner whereby a lease was entered into
for a period of 5 years from 1929. Fishing
operations were started in July 1929 and con-
tinued until November in that year
.
Not only did the Minnesota Commissionerof Game and Fish grant the Association a lease
for the use of the fishery plant and equipment
but, according to Klancke (1931), he also agreed
to use the accumulated balance of some $27,000
in the State Fish Revolving Fund for the care
and maintenance of the fishery plant.
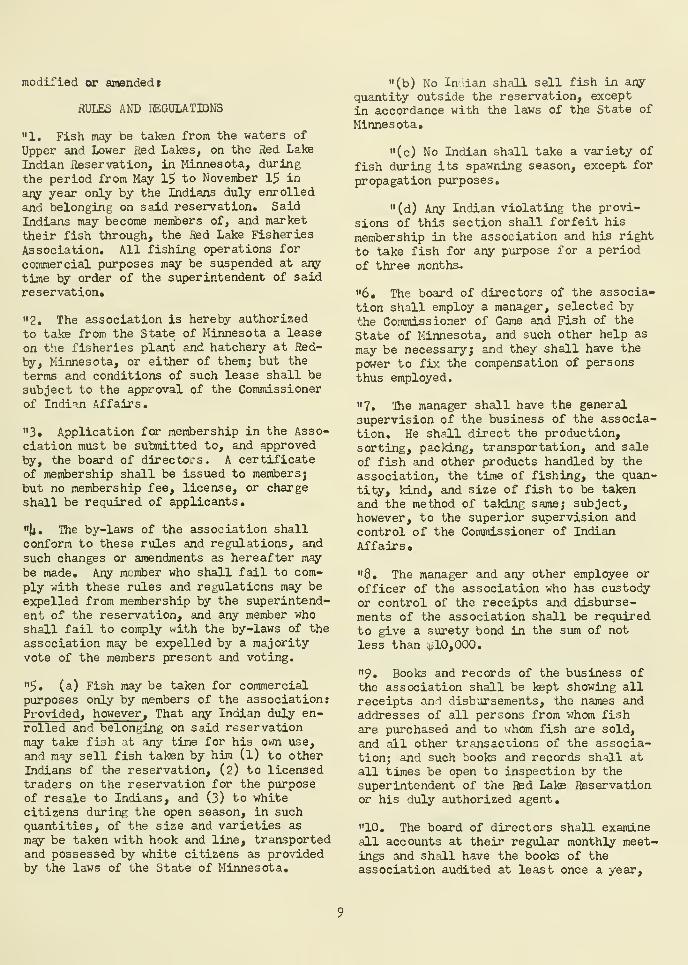
Upon recommendation of the Superin -
tendent of the Red Lake Agency, the Commis-sioner issued regulations that governed the
taking of fish and the conduct of the business of
the Association. The rules and regulations,
promulgated under date of March 10, 1930,
were:
"It appearing that commercial fishingprofitably may be done in the waters of the
Red Lakes, on the Sed Lake Indian iteserva-
tion, in the State 01 Minnesota, and certainIndians of said reservation having hereto-fore organized and incorporated the iied Lake
Fisheries Association under the laws of the
State of Minnesota for the purpose of en-gaging in the business of producing andmarketing fish, and the Bed Lake Heservationbeing an unceded, unallotted Indian iteserva-
tion under the exclusive jurisdiction andcontrol of the United States, authority is
hereby granted said association to do com-mercial fishing in the waters of the RedLakes on said reservation and to engage insaid business only in accordance with therules and regulations hereinafter contained:Provided, That said association is recog-nized only as an instrumentality of the
United States for the purpose of doing saidfishing and conducting said business in theinterest of said Indians; And ProvidedFurther , That the United States does not
surrender, relinquish, or modify its exclu-sive jurisdiction and control over the RedLake Reservation, the Red Lake Indians or
their property, or concede or acknowledgeany right, power, or authority of the Stateof Minnesota, its courts or officials, orsaid association or any other agency, to inany way supervise, control, or administerthe affairs of said reservation or saidIndians or their property; And ProvidedFurther , That the authority hereby grantedto engage in said business may at any timebe cancelled and withdrawn, and the follow -
ing rules and regulations likewise may be
8
modified or amended
t
flULES AND HEGDLATIONS
"1. Fish may be taken from the waters of
Upper and Lower Red Lakes, on the Red Lake
Indian iteservation, in Minnesota, during
the period from May 15 to November 15 in
any year only by the Indians duly enrolledand belonging on said reservation. SaidIndians may become members of, and market
their fish through, the fled Lake Fisheries
Association, All fishing operations for
commercial purposes may be suspended at any
time by order of the superintendent of said
reservationo
"2. The association is hereby authorized
to take from the State of Minnesota a lease
on the fisheries plant and hatchery at Red-
by, Minnesota, or either of themj but the
terms and conditions of such lease shall be
subject to the approval of the Commissionerof Indian Affairs.
"3. Application for membership in the Asso-ciation must be submitted to, and approved
by, the board of directors. A certificateof membership shall be issued to members;
but no membership fee, license, or charge
shall be required of applicants.
"U' The by-laws of the association shallconform to these rules and regulations, and
such changes or amendments as hereafter may
be made. Any member who shall fail to com-
ply with these rules and regulations may beexpelled from membership by the superintend-ent of the reservation, and any member whoshall fail to comply with the by-laws of the
association may be expelled by a majorityvote of the members present and voting.
"^. (a) Fish may be taken for commercialpurposes only by members of the association:Provided, however . That any Indian duly en-rolled and belonging on said reservationmay take fish at any time for his own use,
and may sell fish taken by him (l) to otherIndians of the reservation, (2) to licensedtraders on the reservation for the purposeof resale to Indians, and (3) to whitecitizens during the open season, in suchquantities, of the size and varieties as
may be taken with hook and line, transportedand possessed by white citizens as providedby the laws of the State of Minnesota,
"(b) No Indian shall sell fish in any
quantity outside the reservation, except
in accordance with the laws of the State of
Minnesota,
"(c) No Indian shall take a variety of
fish during its spawning season, except, for
propagation purposes.
"(d) Any Indian violating the provi-
sions of this section shall forfeit his
membership in the association and his right
to take fish for any purpose for a period
of three months,
"6« The board of directors of the associa-
tion shall employ a manager, selected bythe Commissioner of Game and Fish of the
State of Minnesota, and such other help as
may be necessary; and they shall have the
power to fix the compensation of persons
thus employed.
"7. The manager shall have the general
supervision of the business of the associa-
tion. He shall direct the production,
sorting, packing, transportation, and sale
of fish and other products handled by the
association, the time of fishing, the quan-tity, kind, and size of fish to be taken
and the method of taking same; subject,
however, to the superior supervision andcontrol of the Commissioner of IndianAffairs.
"8, The manager and any other employee or
officer of the association who has custodyor control of the receipts and disburse-ments of the association shall be requiredto give a surety bond in the sum of not
less than ^,10,000.
"9. Books and records of the business ofthe association shall be kept showing allreceipts and disbursements, the names andaddresses of all persons from whom fishare purchased and to whom fish are sold,
and all other transactions of the associa-tion; and such books and records shall at
all times be open to inspection by the
superintendent of the flsd Lake Reservationor his duly authorized agent,
"10. The board of directors shall examineall accounts at their regular monthly meet-ings and shall have the books of the
association audited at least once a year.
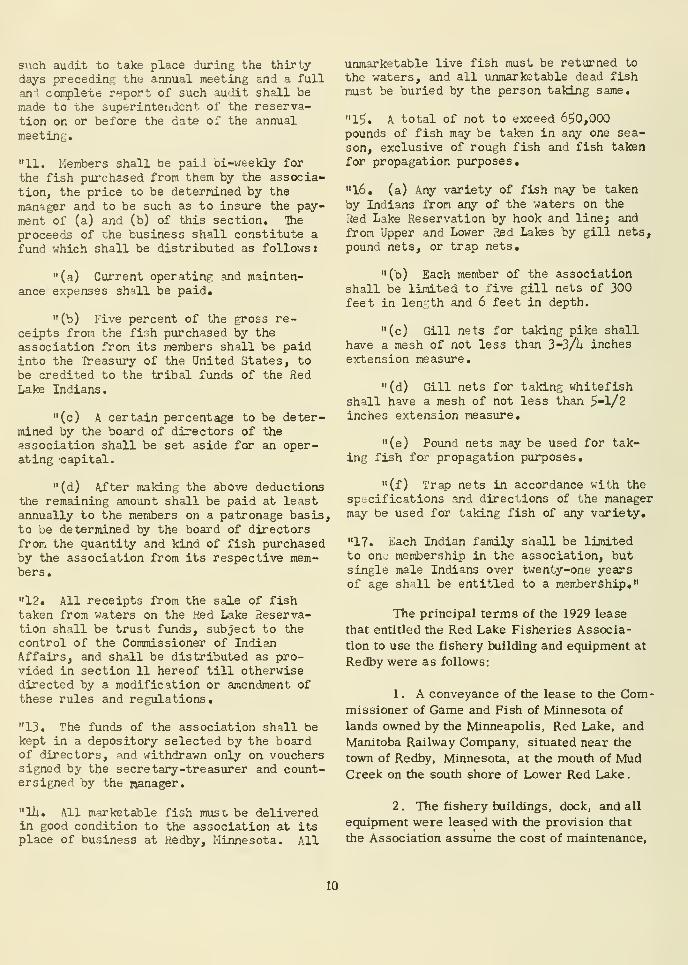
such audit to take place during the thirty-
days preceding the annual meeting and a fullan I complete report of such audit shall be
made to the superintetidcnt of the reserva-tion on or before the date of the annual
meeting.
"11. Members shall be paid bi-weekly for
the fish purchased from them by the associa-
tion, the price to be determined by the
manager and to be such as to insure the pay-
ment of (a) and (b) of this section. The
proceeds of the business shall constitute a
fund which shall be distributed as follows:
"(a) Current operating and mainten-ance expenses shall be paid,
"(b) Five percent of the gross re-ceipts from the fish purchased by theassociation from its members shall be paidinto the Treasury of the United States, to
be credited to the tribal funds of the RedLake Indians.
"(c) k certain percentage to be deter-mined by the board of directors of theassociation shall be set aside for an oper-ating capital.
"(d) ^fter making the above deductionsthe remaining amount shall be paid at leastannually to the members on a patronage basis,to be determined by the board of directorsfrom the quantity and kind of fish purchasedby the association from its respective mem-bers.
"12. All receipts from the sale of fishtaken from waters on the Red Lake Reserva-tion shall be trust funds, subject to the
control of the Commissioner of IndianAffairs, and shall be distributed as pro-vided in section 11 hereof till otherwisedirected by a modification or amendment of
these rules and regulations.
"13. The funds of the association shall bekept in a depository selected by the boardof directors, and withdrawn only on voucherssigned by the secretary-treasurer and count-ersigned by the manager.
"111. All marketable fish must be deliveredin good condition to the association at itsplace of business at Redby, Minnesota. All
unmarketable live fish must be returned to
the waters, and all unraarkstable dead fishmust be buried by the person taking same.
"15. A total of not to exceed 6$0,000pounds of fish may be taken in any one sea-
son, exclusive of rough fish and fish takenfor propagation purposes.
"16, (a) Any variety of fish may be taken
by Indians from any of the waters on the
Zted Lake Reservation by hook and linej and
from Upper and Lower Red Lakes by gill nets,
pound nets, or trap nets,
"(b) Each member of the association
shall be limited to five gill nets of 300feet in len.=^;th and 6 feet in depth.
"(c) Gill net-s for taking pike shallhave a mesh of not less than 3-3/U inches
extension measure.
" (d) Gill nets for taking whitefish
shall have a mesh of not less than 5-1/2inches extension measure,
"(e) Pound nets may be used for tak-
ing fish for propagation purposes,
"(f) Trap nets in accordance with the
spiicifications and directions of the managermay be used for taking fish of any variety,
"17. Kach Indian family shall be limitedto on- membership in the association, butsingle male Indians over twenty-one yearsof age shall be entitled to a membership,"
The principal terms of the 1929 lease
that entitled the Red Lake Fisheries Associa-
tion to use the fishery building and equipment at
Redby were as follows:
1
.
A conveyance of the lease to the Com-missioner of Game and Fish of Minnesota of
lands owned by the Minneapolis, Red Lake, and
Manitoba Railway Company, situated near the
town of Redby, Minnesota, at the mouth of MudCreek on the south shore of Lower Red Lake
.
2 . The fishery buildings, dock, and all
equipment were leased with the provision that
the Association assume the cost of maintenance,
10
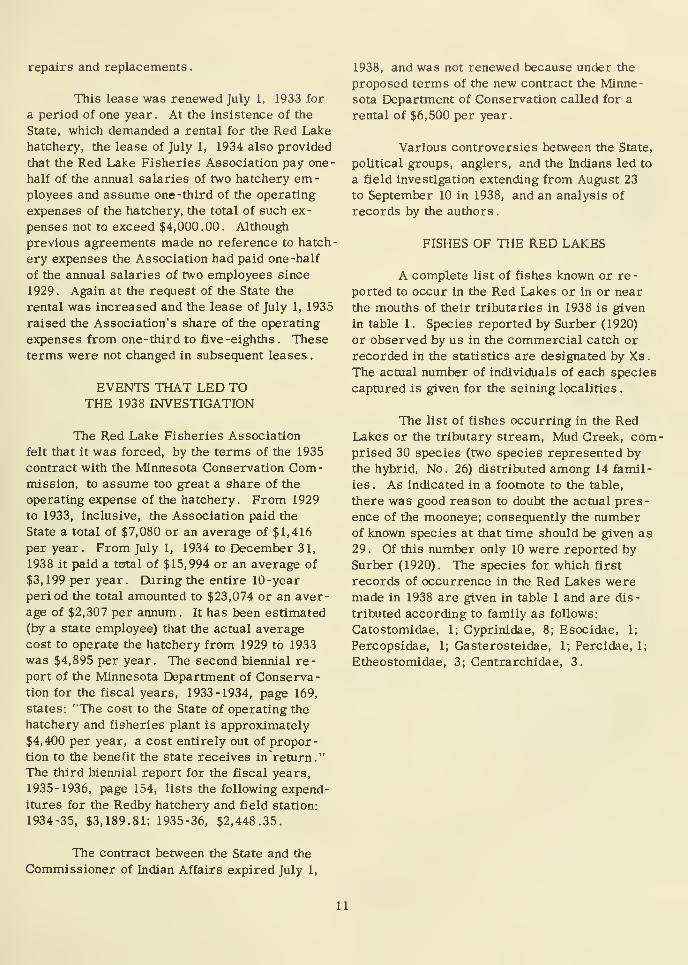
repairs and replacements
.
This lease was renewed July 1, 1933 for
a period of one year . At the insistence of the
State, which demanded a rental for the Red Lake
hatchery, the lease of July 1, 1934 also provided
that the Red Lake Fisheries Association pay one-
half of the annual salaries of two hatchery em-ployees and assume one-third of the operating
expenses of the hatchery, the total of such ex-
penses not to exceed $4,000.00. Although
previous agreements made no reference to hatch-
ery expenses the Association had paid one -half
of the annual salaries of two employees since
1929. Again at the request of the State the
rental was increased and the lease of July 1, 1935
raised the Association's share of the operating
expenses from one-third to five-eighths. These
terms were not changed in subsequent leases
.
EVENTS THAT LED TOTHE 1938 INVESTIGATION
The Red Lake Fisheries Association
felt that it was forced, by the terms of the 1935
contract with the Minnesota Conservation Com-mission, to assume too great a share of the
operating expense of the hatchery. From 1929
to 1933, inclusive, the Association paid the
State a total of $7,080 or an average of $1,416
per year. From July 1, 1934 to December 31,
1938 it paid a total of $15,994 or an average of
$3, 199 per year . During the entire 10 -year
period the total amounted to $23,074 or an aver-
age of $2,307 per annum . It has been estimated
(by a state employee) that the actual average
cost to operate the hatchery from 1929 to 1933
was $4,895 per year. The second biennial re-
port of the Minnesota Department of Conserva-tion for the fiscal years, 1933-1934, page 169,
states: "The cost to the State of operating the
hatchery and fisheries plant is approximately
$4,400 per year, a cost entirely out of propor-tion to the benefit the state receives in return."
The third biennial report for the fiscal years,
1935-1936, page 154, lists the following expend-
itures for the Redby hatchery and field station:
1934-35, $3,189.81; 1935-36, $2,448.35.
The contract between the State and the
Commissioner of Indian Affairs expired July 1,
1938, and was not renewed because under the
proposed terms of the new contract the Minne-
sota Department of Conservation called for a
rental of $6,500 per year.
Various controversies between the State,
political groups, anglers, and the Indians led to
a field investigation extending from August 23
to September 10 in 1938, and an analysis of
records by the authors
.
FISHES OF THE RED LAKES
A complete list of fishes known or re-
ported to occur in the Red Lakes or in or near
the mouths of their tributaries in 1938 is given
in table 1. Species reported by Surber (1920)
or observed by us in the commercial catch or
recorded in the statistics are designated by Xs
.
The actual number of individuals of each species
captured is given for the seining localities
.
The list of fishes occurring in the RedLakes or the tributary stream. Mud Creek, com-prised 30 species (two species represented by
the hybrid. No. 26) distributed among 14 famil-
ies . As indicated in a footnote to the table,
there was good reason to doubt the actual pres-
ence of the mooneye; consequently the numberof known species at that time should be given as
29. Of this number only 10 were reported by
Surber (1920). The species for which first
records of occurrence in the Red Lakes weremade in 1938 are given in table 1 and are dis-
tributed according to family as follows:
Catostomidae, 1; Cyprinidae, 8; Esocidae, 1;
Percopsidae, 1; Gasterosteidae, 1; Percidae, 1;
Etheostomidae, 3; Centrarchidae, 3.
11

Table 1, - -Species of fish reported from the Red Lakes by Surber (1920) and observed or collected by authors
.(Occurrence of fish reported by
Surber or observed In commercial catch Indicated by X)
Family and scientific name
.yAclpenserldae
1
.
Aclpenser fulvescens Raflnesque"
Hiodonddae
2. Amphlodon alosolde s Ratlneaque
3
.
Hlodon terglaus 1* Sueur?^
Coregonldae 3,
4. Coregonus clupeaformla (Mltchlll)-
Catostomldae .
.
5 - Carplodes cyprinus (Le Sueur)-
6. Catostomus c. corpmersonnl
(Lacdpfede)
7. Moxostoma aureoUim (Le Sueur)
Cyprlnldae
8. Notemlgonus crysoleucas auratus
(Raflnesque)
9. SemotHufa a. atromaculatus
(Mltchlll)
10. Rhlnlchtfays atratulus meleagrls
Agassiz
11. Notropls V. volucellus (Cope)
12. Notropis heterodon (Cope)
13. Notropls hudsoniuB selene
(Jordan)
14. Notropls comuois frontalis
(Agassiz)
15. Plmephales p. promelas
Raflnesque
Amelurldae
16. Amelurus nebulosus (Le Sueur)
Esocldae
17. Esox lucluB Linnaeus
Percopsidae
18. Percopsis omlscomaycus (Walbaum)
Gasterosteidae
19. Eucalia inconstans (Kirtland)
Gadldae
20. Lota maculosa (Le Sueur)
Percidae
21. Perca flavescens (Mltchlll)
22. StizQstedlon v. vltreum (Mitchill)
Btheostomidae
23 . Bolepoma nlgnna gjleple
(Hubbs and Green)
24. Hadropterus macula tu3 (Glrard)
25. Poecilichthys exilis (Girard)
Centrarchidae^^
26. Legonus glbbosus (Unnaeus)-^
26. Lggomis cyanellus (Raflnesque)-
27. AmblopUtes rupestris
(Rafinesque)
28. Pomoxls sparoides (Lacdpfede)
Sciaenidae
29. Aplodinotus grunnlens
Raflnesque
Common name
Observed
Reported by
by authors
Surber In com
-
(1920) merclal
catch
Number taken by aelnlng in locality Standard
North- Mouth of Mouth of Mod Creek. length In
east Tamarack Black Duck Redby, Lower Red Lake millimeters
comer, River, River, Lower Upstream Upstream of specimens
Upper Upper Lower Red 500 1.000 taken wlih
Red Lake Red Lake Red Lake Lake faet feet seine
Lake sturgeon X
Goldeye XMooneye X
Common whltefish X
Carp sucker. qulUback X
White sucker XRedhorse sucker —
Western golden shiner —
Creek chub, homed dace —
Western black -nosed dace —
Mimic shiner ~Black -chinned shiner —
Northwestern spottailed
shiner —
Northern common shiner —
Fat-head minnow —
Brown bullhead —
Northern pike —
Trout perch —
Brook stickleback —
Burbot, lawyer X
Yellow perch —
Walleye X
Scaty johnny darter
Black-sided darter
Iowa darter
{ Common sunfish
( Green sunfish
Rock bass
Black crappie
Freshwater drum
— 1
1/ Reported by Surber as A. rutncundus Le Sueur
.
2/ Reported by Surber as possibly the most common form; may
3/ Reported by Surber as C. Ubradoricus Richardson.
4/ Reported by Surber as C. thompaoni Agassiz.
5/ Represented by the hybrid, common sunfish x green sunfish.
have been confused by Surber with the goldeye.
22
15
(55) 88-162
39-82
4
s

ao
-J
•« "
XI
a
XI
^

STATISTICS OF THE RED LAKESFISHERIES
Total yield and value
Practically complete data are available
on the total production of the Red Latces fisher-
ies since commercial fishing began in 1917
(table 2). Catch statistics are lacking only for
the first six months of 1919 and the last six
months of 1926. The total production from the
beginning of the fishery throu^ 1938, exclusive
of the catch in these 2 half-year periods, was
16,693,210 pounds. Had complete data been
available the total almost certainly would have
been well in excess of 17 million pounds. The
total catch in individual years was lowest in
1920 (322,684 pounds) and highest in 1929
(1,086,473 pounds). The average for the years
1918-1938, was 820,32 pounds.
The values (including royalties and
bonuses when these were paid) of the annual
yields to the Indian and white fishermen are
given in the table for the years 1920 to 1938,
inclusive. (The last six months of 1926 are ex-
cluded.). During these 19 years the Red Lakes
fishermen received a total of $943,230. During
the entire period of operation from 1917 on, the
fishermen received more than one million dol-
lars for their fish. The annual income varied
from $19,190 in 1935 to $99,931 in 1929.
Beginning in 1927 statistical records
were maintained continuously of the production
of the individual species. The averages and
percentages at the bottom of table 2, based on
the 1927-1938 statistics, may be taken as
descriptive of the commercial fishery in the
Red Lakes for this period.
The production statistics of table 2 can-
not be employed for a discussion of fluctuations
in abundance since the fishery operates under
a production -quota system. When the limit of
650,000 pounds, exclusive of rough fish, was
reached, fishing operations other than those
carried on to obtain eggs for artificial propaga-
tion were suspended for the season. The
quantities of some species reported may have
depended on the existence of a market demand;
a particularly good example is the goldeye, the
marketing of which was stimulated greatly by a
growing demand for it as a smoked fish.
Relative importance of Upper and LowerRed Lakes
Although Upper and Lower Red Lakes
presumably are both single-basin lakes of ap-
proximately the same regular, elliptical shape
and size, Lower Red Lake has a maximumdepth of about 40 feet while the maximum depth
of Upper Red LaKe is reported to be from 14 to
18 feet. Limnological differences between the
two basins possibly may be reflected in differ-
ences in the natural abundance of fish. The
relative magnitude of the commercial catches
of the two lakes was related principally to num-ber of fishermen and to fishing intensity.
A few Indian fishermen operated on both
lakes, but the major part of the commercial
fishing activities was centered on Lower RedLake and very few Indians fished exclusively on
Upper Red Lake . A small number of white
settlers (see table 4) formerly operated gill nets
on the portion of Upper Red Lake that lies out-
side of the reservation boundary (see fig. 1)
but they were forced to sell their catch ex-
clusively to the Red Lake Fisheries Association.
Because of their violations of the fishing regula-
tions in the past, the white settlers on Upper
Red Lake were denied fishing Licenses in 1938.
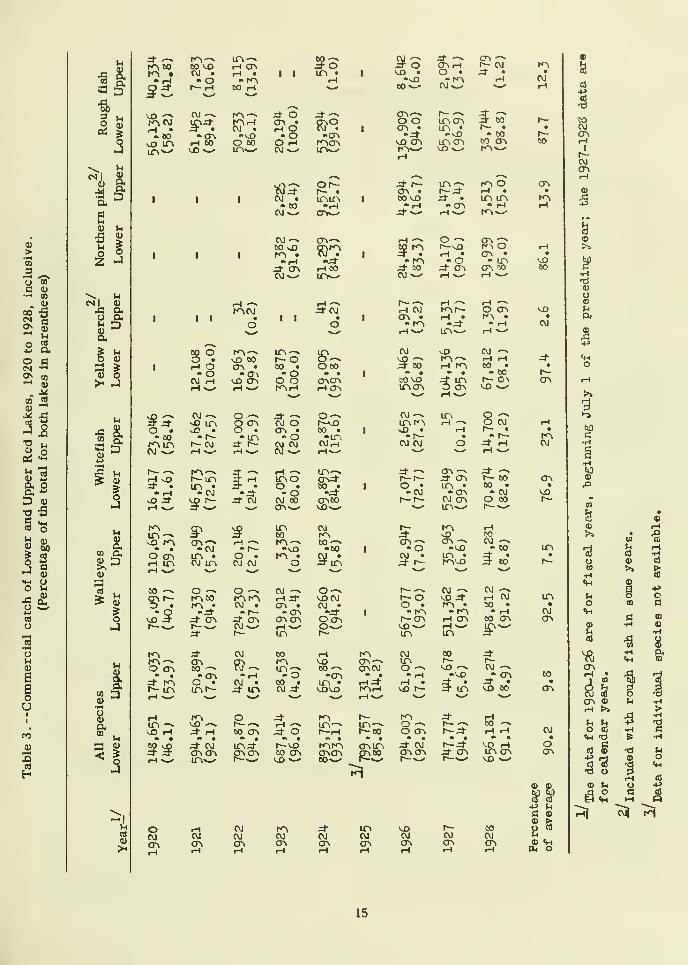
With a few exceptions the catches of
waUeyes, whitefish, yellow perch, and north-
ern pike were recorded separately for each
lake over the period 1920-1928 (table 3). All
other species, termed "rough fish", constituted
10.2 percent of the total catch of Upper and 7.9
percent of the total catch of Lower Red Lake
during the 9 years.
Ordinarily, except for the whitefish
catches in some years, the fisheries of Upper
Red Lake were only about one-tenth as im-
portant as those of the lower lake. There are
indications that the fisheries of the upper lake
were even less productive after 1928. Quality
of the walleye from the upper lake was said to
be inferior to that of lower lake fish.
14
u
•a
S
•s goZ J
CNl 0)
Do.
D a>
u
<» 5
o
ato a
o
CO
U3 "^ CM '-^
t^CVJ lO^r-l • 3- •«co •cr>
>J3 IT* i-t CO
O CTi1-4 in
U5;s
O <T\
h- in
i^i-iw .
•vJDO 00
i I
t<^c\j
CO o t«^-^O • UD COf-H o cr\ •• O "Ox
c\j i-t vu cr\
sO —
»
CO -^3F ;* ^ iTiO • vD •• CO -r^r<Mn r^c\Jcvi ^^ r-< «—
•
rH ^ r-- lO
• i-H « C\J ^^
O •
ir\ -^ ^ -
CO
- iH
oCO (T>
I I
:* OiH O-OO 1-1
CVJ w^
C\J •• CO
CVJs-'
CO sD
I I
CO •
•oo o
CM Ocr\ •- o
CM CMOJ ^^
tooo •- o
CM 00o^*^
—
irvCO
o
00'^ O-^ O'^ CM-^Q>r— K\co r'^ro rH:a-;>• r<^» cvj« cTi*~ -J- -h- •CT^
^ r-- in
CO
in^CO •CM ^
Jt O
5oin •
•CPiK\crvin^x
^p pr-
;d- as iHCOCM»^ inv-^
o
OCO• •
C3^CT^
CO • I
•m.CMrM
in'^crvd-CO •
CTiOOV£)-
CMrnCO'-
^.
<«OCMCM •"^OCTio»--
^^ J- CM in^ r^MDCT^ cri cr> cr> co o"i
in-^ in-^r^M F-co
r^ro CTvin
CO'-' r^%^
it O cr.i-( r-- CM<ji • O • ;* •
•vX3 " i~n r-f
tO>-' CM^^ ^^
CTv-xO O
»J3 C7^
^d- COCM^-
00
CO <Dincri
CM —inr'^iv£> •• r—
CM CM
rH r<^ CMUD <7N—
'
inCO'-^ CTvCM O ^•CTv •• -rH
in iHJ iH •\X)vr) fSr-t VO I
—
i^in CTvin I— ••^ • COino^ CO CTi
CTv • I^J- 1-4 •cou) ^ • in in-rH -Cr> * rH
^v-' rH r<^^^
o -*I— 'jjrH •• o^ cr>
r— —
»
rH CM<T\ * rH •
•KA "^rH'*-' in^^
60
^ir^
r-d-
OCVJ CVJ
cr>
CMCJ(3^
CM CM<7^
inCJcr»
CM CMen
• inCTl 00
O CTl
^ CO '-»
r<^-^ t-< rHrH r<^ 00 •
• . -co^ in r^ oiO CTl M3 >-'
in Q "'rH -^ O CO
1-1 t-- .• - r-O ^ r-i
=1- -^ cr>'^ ^ -^r— r— St a^ i— coO • in • 00 •• CO ' a\ "CO
r-r— CM (r\ o co--^ If^•^^ t^ >^
1—
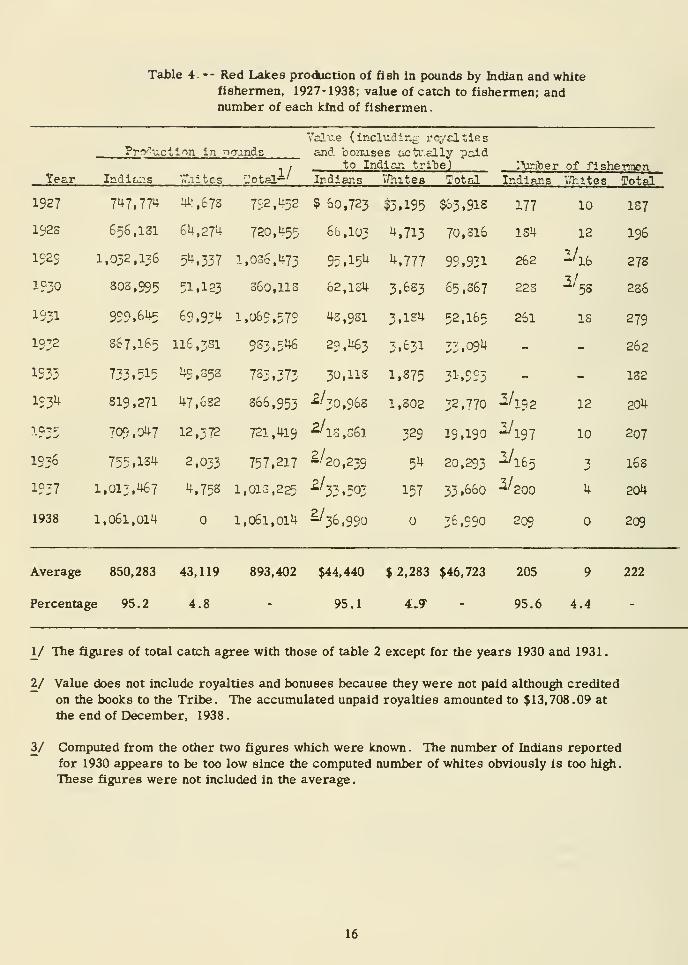
Table 4. -- Red Lakes production of fish in pounds by Indian and whitefishermen, 1927-1938; value of catch to fishermen; andnumber of each kind of fishermen
.
VaLv.e (including royaltiesPro''''uctlon in ncrgnds and o onuses actv.ally paid
/ to Indian tri"be} :\iriber of fishermentear Indiiu^s Vr.iitcs -otal-^ Ir.dlai-^s V/hites Total Indians Y/hltes Total
1927 7»+7,774 Ui-',673 792,452 $ 60,723 $3,195 $63,918 177 10 187
192s 656,131 6U,27i^ 720,455 6b,lu3 4,713 70,316 1S4 12 196
1929 1.032.136 54,337 l,os6,U73 95,i5U 4,777 95.931 262 ^16 278
1930 803,995 51,123 36o,lls 62,134 3,6S3 65,867 22s ^'58 236
1931 929,645 69.934 1,069,579 4s ,981 3,131; 52,165 261 is 279
1932 867,165 116,331 9S3.546 29,1463 3,631 33,094 - - 262
1933 733. 51I; 49,35s 733,373 30.113 1.375 31.993 - - 182
1934 319,271 47,632 866,953 •2/30,968 1,802 32,770 -^192 12 204
"^SIZ 709.047 12,372 721,419 ^is,G6l 329 19,190 -^197 10 207
1936 755.134 2,033 757.217 -^20,239 51; 20.293 ^165 3 168
1937 1,013,467 4,758 1,013,225 •2/33.503 157 33,660 ^200 4 204
1938 1,061,014 1,061, 014 -/3&,99o 36,990 209 209
Average 850,283 43,119 893,402 $44,440 $2,283 $46,723 205 9 222
Percentage 95.2 4.8 - 95.1 4.9" - 95.6 4.4
y The figures of total catch agree with those of table 2 except for the years 1930 and 1931.
2/ Value does not include royalties and bonuses because they were not paid although credited
on the books to the Tribe. The accumulated unpaid royalties amounted to $13,708.09 at
the end of December, 1938
.
3/ Computed from the other two figures which were known . The number of Indians reported
for 1930 appears to be too low since the computed number of whites obviously is too high.
These figures were not included in the average
.
16

Production by Indian and white
fishermen
Table 4 gives the available data on the
annual total production (1927-1938) by Indian
and white fishermen, the value of their catches,
and the number of each kind of fishermen. All
of the white man's fish came from Upper Red
Lake outside of the reservation. The produc-
tion figures for the Indians and whites for the
years 1927 and 1928 correspond exactly with
those for the same years for Lower and Upper
Red Lakes respectively (table 3) . It is possible
that the other figures of catch of table 4 also
represent the yields of the two lakes, in which
case the production statistics of table 4 supple-
ment those of table 3
.
During 1927-1934 Indians contributed
93 percent (not shown in table) to the total yield
and white fishermen 7 percent. After 1934 the
catch by whites was negligible and no licenses
were issued to them in 1938 . In the entire
period 1927-1938 Indians contributed 95 percent
and xhe white man 5 percent to the total catch,
virtually the same relative percentages holding
for the value of the product
.
Seasonal distribution of the catch
Before 1930 catch statistics of the com-mercial fisheries of the Red Lakes were not
recorded according to fishing season. In 1930,
however, the newly-organized Red Lake Fish-
eries Association instituted a card-file system
that provided for a daily record of the catch and
earnings of each fisherman. From those records
the seasonal catches for 1930-1938 have been
compiled (table 5)
.
The length of the fishing seasons is a
factor in the proportionate size of the total catch
of the summer and fall seasons. During 1930-
1933, the summer season began between July 7
and 10, but in 1934-1938 the season began about
2 weeks earlier, or between June 17 and 20.
The summer season terminated between August 1
and October 7, depending upon the total number
of fishermen, the abundance of fish, the number
of lifts necessary to obtain the seasonal quota of
650,000 pounds (not including rough fish), and
the frequency with which lifts could be made
without creating unprofitable marketing con-
ditions through oversupply. Commercial fishing
during the fall season was conducted largely to
obtain whitefish eggs for artificial propagation.
During 1930-1938, the fall season commencedbetween October 4 and 20 and ended between
November 3 and 14 . The final date of the fall
fishing was determined either by the collection
of an adequate supply of whitefish eggs, or by
the freezing of the lakes
.
The annual summer catch of all species
averaged 690, 171 pounds and the annual fall
catch averaged 198,768 pounds during 1930-1938.
The 9 -year summer average was 77, 6 percent
and the fall average was 22 . 4 percent . The
summer catches of individual years comprised
between 62 and 91 percent of the totals during
the 9 -year period. The greater summer catches
were largely the result of a greater fishing in-
tensity and a longer season. Only small-mesh
gill nets (3-1/2 inches, stretched measure) are
fished in the summer, whereas 5-1/2-inch meshnets are used in the fall. These large-mesh
nets do not take some of the smaller species
(as, for example, perch)
.
The bulk of the production of every im-
portant species except whitefish and northern
pike occurred in the summer season. The per-
centages of the average annual total production
of the six principal species taken in summerwere: walleyes, 80 percent; yellow perch, 91
percent; whitefish, 18 percent; northern pike,
49 percent; freshwater drum, 95 percent; and
goldeyes, 97 percent. Fluctuations in summerpercentages of individual years were relatively
small except in the whitefish whose percentages
varied from .4 in 1938 to 54 in 1936 . Despite
the fact that 80 percent of the walleyes were
captured in summer, this species dominated
both the summer and fall production (63 percent
of the summer total and 53 percent of the fall
total). Whitefish made up only 31 percent of the
fall production although 82 percent of the year's
take of whitefish were captured in that season.
In order of production the 6 principal species in
the summer were: walleyes, yeUow perch, gold-
eyes, freshwater drum, whitefish, and northern
pike. In the fall the order was: walleyes, white-
fish, yellow perch, northern pike, suckers, and
goldeyes.
17

a3a
a CD
1^
5 H
0]
(U
(U
n)
I I
r--
^
i8
o in
1-1 wo^iniria-
l-HOJ
©JI—
o
r-t O
J- CM
' in
o
O00
I cr.m
as
CVJi-t
I to I I I I I I I I
l<%iH C\JM3 60 in O'J3 v£)
0~\ U^U^ in I
I I
r— roin
II II II II II II II II
CO CO
vD in t<^^
r- ino_ OJ l~-M3O ro i~- COm 9>
<S> i-i
OJ
incrvinrH
a>r<^ t<->|^
I I
M OJ^<Mr^CO
H O>J3
to
>^ CVJ
3^
iH in
o to
O CVJ
mc\ji>0 rH
OM-H0^ rH
ao
I& CO in
OJ o^ LO I
°^fj
cu3-OrH
rocTi incTiO rM CO CO
t~~ l-H•k •»
cu
cod-H OCM O
OJ
^
I I
at
r<^OJ
CO
I I
r-l ^CM CMOJ om «»
60 r-l
OJ CM^. c3
Cn CM CO h-
SP -^5si:
CTi
VD OcnztJt OJ
^ in
rot^ CO ro
CTiVD
t<Mn
cr>f~-
-^
o^coiH o
^ o injt o^^
o t--

Although the conclusions based on aver-
ages provide a valid comparison of summer and
fall fisheries, the presence of certain exceptions
to the general statements should be noted. Al-
though whitefish were produced chiefly in the
fall, the summer catches equalled or exceeded
the fall production in 1933, 1935, and 1936.
The fall production of whitefish was small, how-
ever, in each of these years . On the other hand,
relatively high percentages of the total catch of
walleyes were taken in the fall in 1931 and 1932
(30 percent and 34 percent, respectively). In
no other years did the percentage of walleyes
produced in the fall exceed 19. The causes for
these exceptions to the general trend are un-
known. Weather conditions --especially time of
formation of ice --doubtless had an important
effect on the fall production.
caused, at least in part, by the initiation of W.P. A. projects employing Indian labor, by the
gradual elimination of the white fishermen
(table 4), and by periodic free distribution of
large qujmtities of staple foods at the Red Lake
Agency
.
Table 4 shows the number of Indian and
white fishermen who operated during 1927-1938.
The data indicate that the Indians always far out-
numbered the white fishermen, comprising on
the average, 96 percent of the total. An aver-
age of 205 Indians and 9 whites were engaged in
commercial fishing, the number of Indians
fluctuating between 165 and 262 and the numberof white men varying from to 18
.
Fishing effort
Fishermen
The numbers of fishermen who operated
gill nets on Lower and Upper Red Lalces during
the summer and fall seasons of 1930-1938 and
the total number participating in the fishery each
year (fishing in the summer only, in the fall
only, or in both seasons) are recorded in table 6.
Total numbers are also given for 1927-1929, in
table 4. The number of summer fishermen
averaged 200 for the 9 -year period. There
were fewer summer fishermen during 1933-1937
(also 1927 and 1928), than during 1930-1932
(probably also 1929), or in 1938. The 1933-1937
annual average of 176 summer fishermen was25 percent less than the average of 235 for 1930-
1932 and was 16 percent below 1938.
Fall fishermen for 1930 to 1938, inclu-
sive, averaged 174 or 13 percent less than the
summer fishermen during the same years. How-ever, in 1930-1932 there was an annual average
of 245 fall fishermen, and in 1933-1938 the av-
erage was 139, or 43 percent less than during
the preceding 3 years.
Each Indian fisherman on the Red Lakes
up to 1938 could set and lift not to exceed 5 nets,
each 300 feet long, or a total of 1,500 linear feet
of netting each day, as prescribed by the regula-
tions made by the Commissioner of Indian Af-
fairs. Nets usually were set during the late
afternoon or evening and lifted the following
morning so that the fishing time for each lift
was one night out. Nets sometimes remained
in the water for a longer time during a severe
storm. Weather conditions sufficiently adverse
to prevent the lifting of nets during the summerseason were usually of infrequent occurrence
.
The total lifts made by all fishermen
during the summer and fall seasons, and during
both seasons, from 1930 to 1938, appear in
table 6. During the 9 years an average of 5,927
lifts of presumably 1,500 feet of small-mesh
gill nets was made during the summer season,
equivalent to 77 percent of the total number of
lifts made during both seasons. In tfte fall the
annual average of 1,742 lifts of presumably
1,500 feet of nets constituted 23 percent of the
average number of lifts for the entire year
.
Individuals participating in the fishery at
some time during the year varied from 286 in
1930to 168 in 1936 and averaged 223. The 1933-
1938 average of 197 fishermen was 28 percent
below the 1930-1932 average of 275 fishermen.
The pronounced decrease in the total number of
fishermen in 1933 and subsequent years was
The relative quantities of large-meshand small-mesh nets used during the fall are
unknown. Fishermen ordinarily employed small-
mesh nets early in the fall until whitefish appear,
whereupon large -mesh nets were substituted
for many of the small -mesh. Some fishermen,
sometimes with the approval of the manager of
19

the fisheries and sometimes against his wishes,
used one or more small -mesh nets in their gang
through the entire fall fishing season.
The total lifts during each fishing season
were divided by the number of fishermen to de-
termine the average number of lifts per
fisherman (table 6).
Ordinarily the abundance of walleyes and
the condition of the market controlled the length
of the summer season and the number of lifts
made. When walleyes were abundant and the
quota was easily reached, the season was short-
ened and consequently the number of lifts
reduced, unless market conditions necessitated
interrupted fishing, when the season was pro-
longed but the number of lifts was not increased.
Table 6 shows there was a direct relation be-
tween length of season and number of lifts and
these serve, therefore, as rough indices of
abundance of walleyes . On this basis we would
conclude that 1930, 1931, 1932, 1937, and 1938
were good years and that 1933, 1934, 1935, and
particularly 1936 were poor years. This con-
clusion agrees with results obtained from
calculation of average catch per lift except for
the years 1930 and 1933. The close correspond-
ence of the results based on two different methods
strengthens the validity of our final conclusions
on relative abundance of walleyes in different
years
.
Although the length of the season and the
number of lifts usually depended on the abundance
of the fish, there is not necessarily any direct
relation between these two factors and the total
yield. The seasons may be relatively short and
the number of lifts below average but the total
catch of walleyes (table 5) may be comparatively
large (1931, 1937, 1938); or the reverse may be
true (1935, 1936). A direct relationship did ex-
ist, however, between length of season or numberof lifts and annual yield in 1930, 1932, 1933, and
1934.
The large variation in average number of
fall lifts probably was related to weather condi-
tions and possibly also to abundance of fish.
During some years the lakes froze before the
peak of the whitefish spawning run occurred. Kwhitefish were numerous and the run occurred
before the onset of freezing weather, then the
desired quantity of eggs for artificial propaga -
tion could be secured with a smaller number of
lifts and in a shorter time than if whitefish werescarce.
Average catch per lift
Statistics of the annual total yield of the
Red Lakes fisheries cannot be employed to
measure fluctuations in natural abundance of the
principal species because of the controlled maxi-
mum production and limitations as to the number
of lifts imposed by favorable or unfavorable
condition of the wholesale market. Since all
lifts presumably consisted of approximately the
same quantity of gear, the average catch per
lift is an approximate measure of the yield per
unit of fishing effort. The total catch of each
species during the summer seasons of 1930 to
1938 (table 5) was divided by the total number of
summer lifts (table 6) to obtain the catch per
lift (table 7). Catches and numbers of lifts dur-
ing the fall seasons are unsuited for analysis in
terms of catch per lift because of the mixture of
small -mesh nets and large-mesh nets employed
during that season.
The 9 -year (1930-1938) mean of the
average summer catches of all fishermen was122 pounds per lift (table 7) distributed accord-
ing to species as follows: walleye, 78; yellow
perch, 26; whitefish, 2; northern pike, 2;
freshwater drum, 3; goldeyes, 10; sucKers, 0.2;
and bullheads, 0.1.
If the average catch per lift for the 9-
year interval is assumed to have an index value
of 100 (or 100 percent), then the annual fluctua-
tions in the abundance of all species and of the
individual species may be estimated by express-
ing the catch per lift in each year as a percentage
of the corresponding 9 -year mean. For example,
the catch per lift of all species combined in 1930
85.2was 100 X
122or 70 percent of the 1930-1938
average; similarly the "abundance percentage"
for walleyes in the same year was 100 x ^ ~ 78.
Table 8 contains no computations of abunaaiKie
percentages for goldeyes, suckers, and bull-
heads . Data for the last two species were scanty
and fluctuations in the catch per lift of goldeyes
are believed to be unreliable as measures
20

Table 6. --Fishermen in the summer and fall fisheries, length of summerfishing season, average lifts per fisherman in summer and fall
fisheries, and lifts in summer, fall, and entire year on the RedLakes, 1930-1938.
YeoT

Table 7. - -Average production in pounds per individual lift of
approximately 1,500 feet of small -mesh gill nets on the
Red Lakes during summer fishing seasons of 1930-1938.

Table 8 .- -Percentage relations of average catches per lift for 1930-1938
to the average catch per lift for the 9 -year period in the Red Lakesfisheries during the summer fishing season (based on the data of
table 7).
of abundance since quantities that could not be
sold were not reported. Data for walleyes and
perch are more reliable than those for the
other species.
The catch per lift of all species combined
was only 70 percent of average in 1930. The
abundance of fish improved in 1931, and was 29
percent above the 9-year average in 1932.
Abundance declined during the next 3 years,
reaching the 9-year minimum of 67 percent in
1935. A slight increase in abundance in 1936
was followed by a sharp upturn to 133 percent
in 1937 and further, though less pronounced, im-
provement in 1938 to the 9 -year maximum (149
percent). The catch per lift of all fish combined
in both 1937 and 1938 exceeded that in any year
of the period 1930-1936.
As might be expected, the annual fluctua-
tions in the abundance percentages of walleyes
resembled the fluctuation s for all species com-
bined. The directions of change were the same
in all years except 1936 when the abundance of
all fish combined improved (from 67 in 1935 to
72 in 1936) while that of walleyes declined (from
52 in 1935 to 43 in 1936). Measured in terms of
the average catch per lift the abundance of wall-
eyes was greatest in 1938 (149 percent of aver-
age) and was above average in 1931-1933 and in
1937. Walleyes were least abundant in 1936
(43 percent of average) and were below "normal"
in 1930 and 1934-1936. The rapid changes in
the abundance of walleyes in certain years are
especially striking. As an outstanding example
the 1937 abundance was 2.9 times that of 1936,
and the years of greatest and least abundance
(1938 and 1936) were separated by a single in-
tervening year.
Fluctuations in catch per left of yellow
perch resembled those of all fish combined and
of the walleye . Examination of the data with
respect to the occurrence of "above-normal"
and "below -normal" years reveals complete
agreement between the perch and all species
combined and agreement between the perch and
the walleye in every year except 1931 (perch be-
low average and walleye above average) . The
directions of change in the abundance of perch
and walleyes were the same in every year but
1938 (a slight decrease in the abundance of perch
and an increase in the abundance of walleyes).
It was concluded that trends in the fluctuations
in abundance of yellow perch and walleyes were
closely similar in the period 1930-1938, although
the actual values of the abundance percentages
differed considerably in some years . There are
no data upon which to explain this obvious corre-
lation. Perch were most abundant in 1937(167
percent) and were nearly as abundant in 1938
(159 percent). Their abundance was above aver-
age also in 1932 and 1933. Perch were least
abundant in 1930 (43 percent) and were below
average in 1931 and 1934-1936. The most pro-
nounced change in abundance occurred from 1936
to 1937. (1937 abundance percentage was three
times that of 1936).
The very poor catches of walleyes in 1935
and 1936 were attributed to abnormally low water
levels . The vegetation along the shore, favorable
spawning and feeding grounds of minnows, was
exposed. It was thought that a subsequent reduc-
tion in forage fishes caused a loss in weight of
the predator walleyes so that many of marketable
length could no longer be caught in the 3-3/4-inch
meshes, thereby decreasing the catch in pounds
per unit of net. Figures were brought forward
to show that in 1934 the average weight of the wall-
eye in the commercial catch was 1 2 pounds but in
1936 it was only 0.9 pound. In 1938 the average
weight was again 1 . 2 pounds . The water level was
said to have been from 4-1/2 to 5 feet higher in
1938 than in 1936.
Because 3-3/4-inch mesh did not take wall-
eyes of marketable size, the manager of the fisheries
in 1936 authorized mesh of 3 -1/2 -inches. The ef-
fect of this reduction in size of mesh apparently is
reflected in the increased catch per unit of effort in
1937. The still further rise in catch in 1938 is ex-
plained, in part at least, by the increased average
weight of the fish. The walleyes were in better con-
dition in 1938 than in several preceding years
.
It is not apparent why the catch of perch
should drop so low in 1936, but the reduction in meshsize is responsible for part if not all of the rise in
catch in 1937 and 1938.
Abun dance percentages of whitefish cannot be
considered dependable. Summer is a poor season
for capture of whitefish, and annual fluctuations in
catch per lift may depend more on limnological con-
ditions that determine whether whitefish are present
24

on the grounds fished for other species than on
the actual abundance of fish. Neither would
abundance percentages of the whitefish taken in
the fall be reliable, not only because of the un-
known number of small -mesh nets fished with
the whitefish nets, but also because of the vari-
ations in weather conditions which in some years,
for example 1938, would delay the spawning
season to such an extent that it would not reach
its climax before commercial fishing operations
were suspended for the year.
Catch per lift of northern pike was well
above average in 1930, improved in 1931, and
reached a maximum in 1932. A sharp decline
in 1933 was followed by a less sharp improve-
ment in 1934. The abundance of northern pike
appears to have been consistently below average
throughout the period, 1935-1938.
Catches of freshwater drum were above
average in 1931, 1932, and 1935-1937 and below
average in 1930, 1933, 1934, and 1938. The best
catches were made in 1936 and the poorest in 1934.
The preceding discussion was based on
the data of all fishermen in each summer's fish-
ing. In view of the considerable annual fluctua-
tions in the number of fishermen (tcible 6), the
possibility was considered that some of the ob-
served variations in the catch per lift may have
originated in variations from year to year in the
skill and ability of the fishermen engaged. Totest this possibility an analysis was made of the
annual fluctuations in the catch per lift of 19
selected fishermen (the best fishermen as se-
lected by the manager) who fished each year
throughout the period 1930-1938. Althou^ the
average catch per lift of all species made by the
19 fishermen was 1.5 times the average catch
per lift obtained by all fishermen during the
years 1S80-1S68, the conclusions, with respect to
relative abundance, that would have been drawnfrom the data of these selected fishermen werepractically identical with those based on the data
of all fishermen. The description of fluctuations
in abundance from annual variations in the catch
per lift of all fishermen may be considered valid.
THE WALLEYES OF LOWER RED LAKE
The walleye, as demonstrated during the
preceding discussion of the statistics of the com-mercial fisheries of the Red Lakes, was by far
the most important species produced. During
1927-1938, the walleye averaged 62.3 percent
of the annual catch
.
Scale samples, accompanied by records
of standard, fork, and total lengths, weight, sex,
and stage of maturity, were collected from 127
individuals which represented the unselected
catch obtained by 3 fishermen on August 24, 1938,
in 18 nets. Similar data were obtained on August
25 from 185 fish selected to secure a good repre-
sentation of fish of all sizes and ages. Length
measurements only were obtained from 470 wall-
eyes, which, together with the 185 from which
scale samples were taken, constituted the total
number taken by 6 fishermen from 34 nets lifted
on August 25.
The scales, cleaned and mounted on slides
in a glycerine -gelatine medium, were studied on
a microprojection machine. Measurements of the
projected images of the scales from the focus
(center) to each annulus (yearring) and to the edge
of the scale were used to calculate lengths of the
fish at the end of each year of life. Computations
were made by the direct -proportion method. Ages
are designated by roman numerals which denote
the num ber of annuli (year rings) on the scales or
completed years of life of the fish. Since the col-
lections were made during the growing season
each fish was actually a fraction of a year older
than the age indicates
.
Length -frequency distributions
The length -frequency distributions of the
various age groups of walleyes (table 9) have been
based on a combination of 127 fish of an unassorted
sample and 185 individuals selected to obtain a
better representation of fish over certain length
intervals. Comparisons of the frequency distribu-
tions of the age groups in table 9 with the distribu-
tions based on the unassorted sample of 127 fish
(not shown), revealed that the inclusion of the
selected individuals did not affect the data signif-
icantly. Inclusion of the selected fish did, however,
affect the age composition of the samples as maybe seen by the comjiarison of the percentage age
compositions of the unassorted sample (bottom of
table) and the sample containing both unassorted
and selected fish. In the unassorted sample agp-
groups rV and V made up 81 .9 percent of the total;
in the combined samples, 64.3 percent. Age-group
IV dominated both samples . At the extreme right
of the table is the distribution of fish in the
25

ID
C U
ilu a
tCO
c
to j-«
'-' enCO rt
CO -^> Ol-l u(U lU
S B•"
E
B o?i cE -'
•-; CO
3 XI° H^ O
&_^") -3
.
O >tH 00i-' O CO
- E o"1^ —O kH - -
O CO g"• -o ">
.2 1; ^
n ">
Iw -a 3.2 c <^^ c
o 21 ^
SJ O n)
ST c«
u- 3 aS
i
•H +>
a oo
u oCO
•H _Q O
a
h
I
<a a (a1-4 0) <D
> o£'3 5pq o
4^
C! 03
CO rH ^> O
pi T! .H
« +^ atJ op •H
4J i-Hw
II I I I I I I t^oMfN^ I ooo 60 OM^w :* irmlnco cod- to o^it• •«• ••••••••••••••••OOOO i-li-liHOr-lOrHC\J irvC\J r^ OvO m J- r-l
l-l rH OJ rH
I 1 I I I I |Cv)r^;i•l^^|co:*;d^-OvOr^pQ'i^a^60coc^^r-tr-IH r-l ^^C^I^a^r<^ LOW ki3 t<^M
1-1 I I r-l I I I I r-l ifMfMrii-i vo r<^r- CO r-eo cj> r-l O o O ir»t-i r<^c3MPrH rHC0r<^t<^rO h^r<^ C\J r-t
II II lllllllll II llllllll |l|CMi-1(M
11 lllllllllllllllll|C\J|WrH^t— I~-Z}-C0
I I I I I I I I t I t I I I I I I I ^ en CTi looo crvd- J- :d- rHr^ t-i t-t r-< T-t
IIIIIIIIIIIIIIIIIrHVO^Or-ll^r-llllllrH r-l r^
II llllllll I r-l I M3 r^ 1^ CO >^ OJ r-l lllllllll
I I I I rH loind- r^ I t I I t I I I I I I I I I I I
O CO
G IIH 4)
S4 ^o

commercial catch as determined from a series
of unassorted samples.
With the exception of the -group the
frequency distributions of the successive age
groups overlap; this overlap increased with in-
crease in size and age . Every length interval
beyond 240-249 millimeters, standard length,
was represented by fish of two or three age
groups.
All walleyes of age -groups 0, I, and II,
and all but one of the III group were below 14
inches fork length . Forty-six percent of the IV-
group fish, and 21 percent of the V -group were
shorter than 14 inches. All individuals of the
age -group VI were well above 14 inches, in the
winassorted samples (782 fish) from the commer-cial catch, 38 percent were below and 62 percent
above 14 inches.
The range of length over which the gill
nets took walleyes in abundance was delimited
sharply. Seventy -six percent of the total catch
fell within the length range, 13.4-15.6 inches,
fork length (14.2-16.6 inches, total length.
0.9-1.4 pounds). Nearly all of these fish be-
longed to age -groups FV and V . The irregular
and discontinuous distribution of the smaller fish
suggests that many of them were accidental"
captures, that is, were not gilled in the custom-
ary manner but were entangled in the webbing of
the nets by their mouth parts, teeth, or fins
.
No individual exceeded 17.5 inches in total lengJi.
An attempt to obtain larger specimens failed.
One informant asserted that in the period 1927-
1932, the walleye averaged much larger; fish
of 4 or 5 pounds were common in the earlier
period, when a 4 -inch mesh gill net could take
them in the deeper water
.
Rate of growth
Lengths, weigjits, and coefficients of
condition of each age group of the Lower RadLake walleye are shown in table 10 for each sex,
and calculated lengths according to age group or
year of life are presented in table 11 and fig. 2
.
Inspection of average lengths at time of capture
shows no differences or only slight differences
between males and females of age -groups I, II,
and III, but females of age -groups IV and V
averaged distinctly longer than the males. (The
scanty data of age-group VI do not permit a com-parison of the sexes.) The average weights show
a similar sex difference in age -groups IV and V,
where females averaged slightly heavier than
the males
The calculated standard lengths at the end of
the first year of life (table 11) were higher in age-group I than in any of the older age groups . Thesmall fish were taken in large -mesh gill nets andprobably were the larger and more rapidly growingmembers of the age group . The same explanation
applies to the larger of the two 0-group fish that
were 89 and 116 millimeters, standard length,
at the time of capture . The calculated lengths
of age-groups U-VI doubtless were affected less
by gear selection and may be taken as descriptive
of the growth history of the population. The cal-
culated lengths shown at the bottom of table 11
are based on data of age-groups II-VI. Age-groupI was excluded from these compilations since it
was probably unrepresentative. The grandaverage calculated lengths represent the succes-sive summations of the grand average annual
increments of growth in length. This procedureprovides a smoother growth curve and one morein conformity with the actual data on the growthin different years of life
.
In all the well represented age groups
except the II group, the calculated lengths of
the females tended to be greater than those of
males, especially during the later years of life
.
This superiority in the growth of the females
may be seen also in the grand average calculated
lengths. (See also fig. 2.) The advantage of the
females was insignificant (only 1 millimeter) at
the end of the first year of life but increased
continuously with increase in age to a maximumadvantage of 19 millimeters at the end of the
sixth year . The most rapid growth of both sexes
occurred in the first year of Life. Growth in-
crements decreased in each of the later years
but the decline was most rapid in the third and
fourth years.
Comparison of the growth in Lower RedLake and in other waters
Calaulated lengths and annual increments
of length for the various years of life of walleyes
27
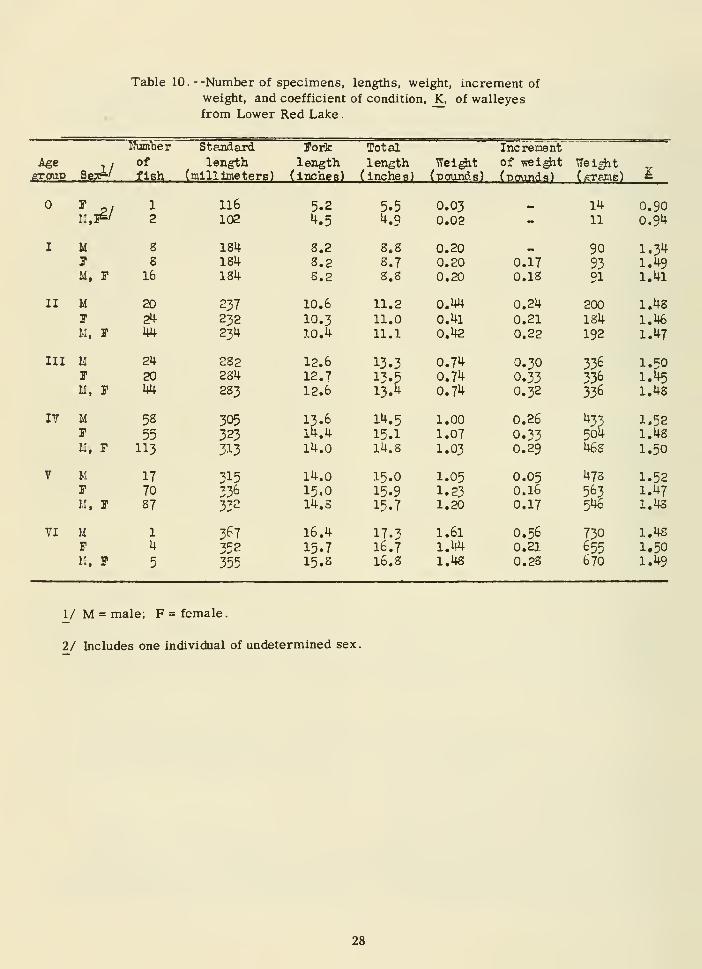
Table 10. --Number of specimens, lengths, weight, increment of
weight, and coefficient of condition, JC, of walleyes
from Lower Red Lake
.
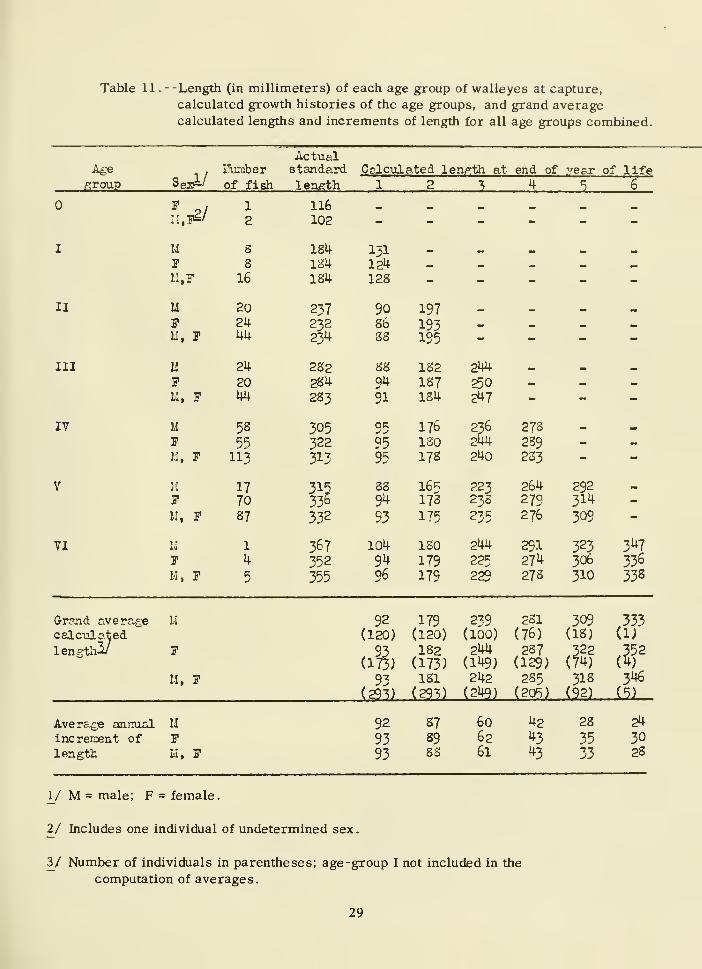
Table 11 .- -Length (in millimeters) of each age group of walleyes at capture,
calculated growth histories of the age groups, and grand averagecalculated lengths and increments of length for all age groups combined.

t
kj
Q:
Xkj
I
o
S3H0NI Nl H10N31 IVIOI 1N3 IV Al n03
from Lower Red Lake, Lake of the Woods and
Lake Erie (Deason, ms.) are compared in table
12. (Also see fig. 3.) Fish from Lower RedLake and Lake of the Woods grew more rapidly
(93 and 94 millimeters) during the first year
than in LaKe Erie . During the second year, Lake
Erie fish grew more rapidly than during their
first year in contrast to the Red Lake and Lakeof the Woods fish, which grew more slowly dur-
ing their second year than during the first.
Beyond the second year the growth increments
of Lake Erie fish were the largest in every year
but one (the fourth) and the increments of the
Red Lake fish were the smallest in every year
except the sixth . The grand average calculated
lengths of the Lake Erie walleyes were the
largest and those of the Red Lake fish the small-
est in all years beyond the second.
Hart (1928) studied the growth of wall-
eyes from Lakes Nipigon and Abitibi, Ontario
by means of age determinations, but did not cal-
culate growth from scale measurements . The
average fork and converted total lengths and
weights of the Nipigon and Abitibi fish are com-pared in table 13 with similar data from Lower
Red Lake, Lake of the Woods, and Lake Erie.
Lower Red Like fish averaged shorter and
lighter in most age groups than Lake Erie and
Lake of the Woods individuals . However, the
walleyes from Lakes Nipigon and Abitibi were
much slower growing than those from Lower RedLake during the period covered by the 1938
samples.
A comparison of the growth of the RedLake walleye with average growth of the species
in Minnesota as determined by Eddy and Car-
lander (1939) in£a.cated that Red Lake fish grew
more slowly than the average except in the first
year of life during the years covered by data
collected in 1938
.
Length -weight relation and coefficient
of condition
Examination of the average values of
the coefficient of condition for the age groups
(table 10) as well as of the length -weight data
(not presented) revealed no large differences be-
tween sexes although males tended to be in
slightly better condition than the females of
corresponding age. Accordingly, data for the
sexes were combined in the preparation of table
14. Each entry is the average for all fish with-
in a 5 -millimeter interval of standard length.
These data form the basis of the length -weight
curve in figure 4 which has been so constructed
that conversions of weight in ounces to weight in
grams and standard lengths in millimeters to
fork or total lengths in inches may be accomplished
readily.
2/The coefficient of condition, K— is a
measure of the relative heaviness of fish or
groups of fish. Large values of K indicate a
heavy, robust fish, while small values of K in-
dicate a slender, less stockily built individual.
The values of K of the Lower Red Lake walleye
exhibited no important or consistent changes
with increase in length beyond 172 millimeters,
standard length . The values do, however, tend
to be slightly higjier in the older fish (age -groups
rV-VI) than in the younger (age -groups O-IU).
(See table 10.) Very small and young individuals
apparently are quite slender as indicated by the
low K of the two smallest fish (standard lengths
of 89 and 116 millimeters).
Maturity and sex ratio
The size at maturity will vary some-
what in different populations . In this study a
fish is considered to be mature if the state of its
organs indicated that it would spawn the next
spring, regardless of whether it had spawned
before
.
Available data on maturity of Lower
Red Lake walleyes are presented in table 15,
which shows the number and percentage of mature
and immature individuals in each age group, and
in table 16, which shows the number of mature
and immature fish and the percentage of maturity
according to length with all age groups combined.
The youngest mature individuals occurred in
age -group II (in third summer) of the males and
in age-group III of the females. In each sex, the
youngest group with a majority of mature in-
dividuals was the IV group (93 percent of the
males and 69 percent of the females mature)
^/ V - W X 10^/. W = weight in grams,— -^^^
—
-rn—^ L = standard length in mm
.
31

Table 12. --Comparison of the calculated growth of walleyes from LowerRed Lake, Lake Erie, and Lake cf the Woods (number of
specimens in parentheses)
.

S3H3NI Nl H10N31 IVIOJ. IN31V Al n03 a
3O3d
Sd323IM ni IV
u
33
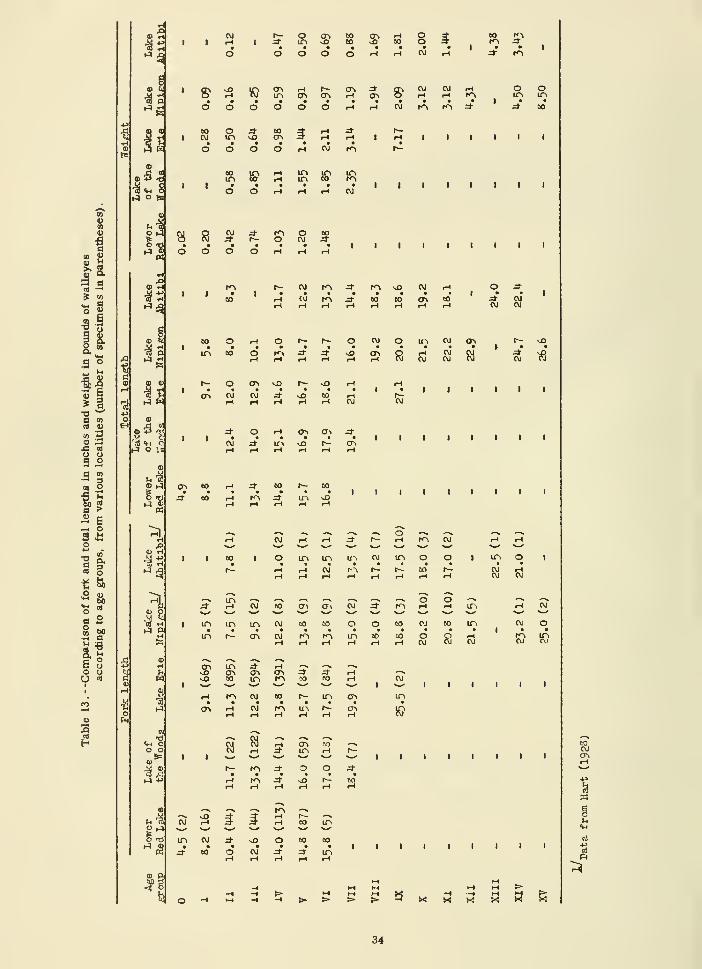
GO O
l
•6•HID
b xl
S^^
a) <H c1-1 o
O -rt
'-' is
.§8
Vl Oo o
S)
o t:!
^gfe
?i f3
COI •
in
1^I
cr> to• •
:* 60
o
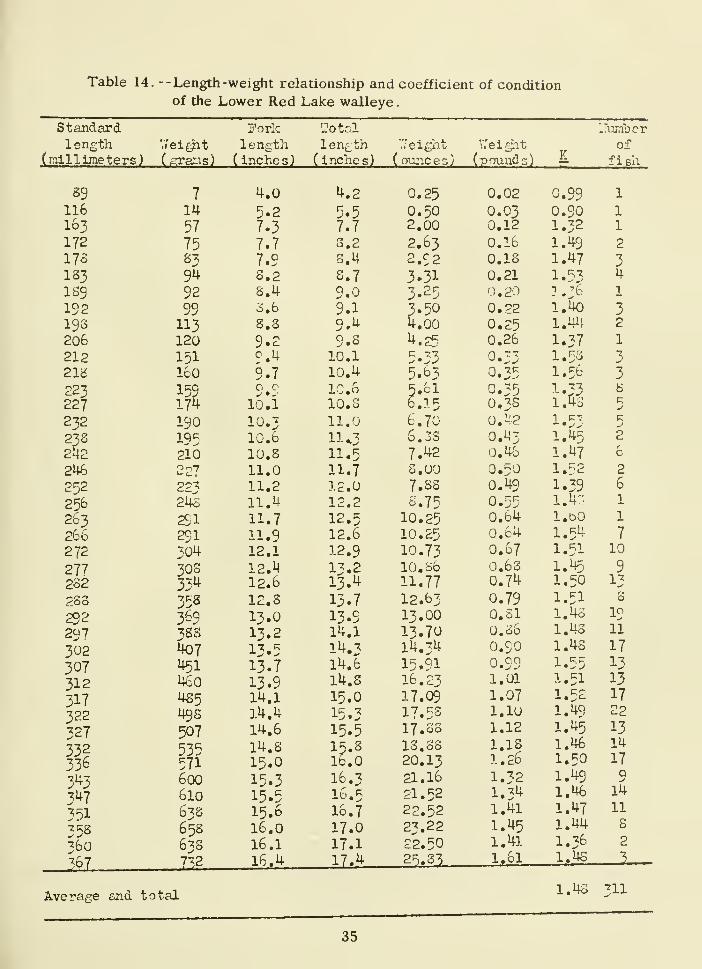
Table 14. --Length -weight relationship and coefficient of condition
of the Lower Red Lake walleye
.
Standard

en
<uoc
8
4

2

whose average fork length was 14 inches (14.8
inches, total length) and whose average weight
was 1 pound (table 10) . However, nearly half
(46 percent) of the males were mature as age-
group m whereas only 10 percent of the III-
group females were mature. Apparently males
tend to become mature at an earlier age than
females. No well represented age group of
either sex was composed entirely of mature fish.
Since nearly all of the Il-group males
were immature in August, it may be assumedthat very few males of this group spawn when ex-
actly 3 years old (in spring) . Since nearly half
the ni-group males were mature in August, it
may be assumed further that these fish were at-
taining sexual maturity for the first time at 4
years of age. Thus, if half the male walleyes
are to be permitted to spawn once, they must be
protected until their fifth summer; and if morethan half are to spawn once, protection must be
provided until the sixth summer . By a similar
reasoning it may be determined that the majority
of the females reach sexual maturity for the first
time when exactly 5 years of age, and protection
must be provided until they enter their sixth
summer. These findings disagree with the state-
ment of Surber (Minnesota Conservationist,
February, 1934, p. 18) that walleyes mature in
3 years.
Table 10 indicates that males in their
sixth summer (August) averaged 14 inches, fork
length (15 inches, total length; 1 .05 pounds) and
the females 15 inches (15.9 inches, total length;
1.23 pounds). The average for both sexes com-bined was 14.8 inches, fork length (15.7 inches,
total length; 1.2 pounds).
Data on percentage of maturity at differ -
ent lengths (table 16) indicate that male walleyes
mature at a smaller size as well as at a lower
age in comparison with females. Although little
difference exists between sexes in the length at
which the first mature individuals occurred, a
majority of the males were mature or maturing
at all lengths beyond 280 millimeters, standard
length, (12.5 inches, fork length) as comparedwith a length of 300 millimeters (13.4 inches,
fork length) for females. Table 16 indicates
that at 14 inches, fork length, 19 percent of the
males and 36 percent of the females may still be
immature. At 15 inches, fork length, all of the
males and 89 percent of the females weremature
.
To obtain adequate data on age and
length of walleyes at first maturity, it was neces-
sary to include both selected and unassorted
samples in the tabulation. The inclusion of the
data of selected fish causes the percentages of
immature fish in the entire sample to be higher
than would be expected in a strictly randomsample of the commercial catch . In the unas -
sorted sample of the commercial catch from3 -1/2 -inch mesh nets, of a total of 47 males,
78 percent were mature; of a total of 80 females,
72 percent were mature
.
Numbers of males and females in each
age group and sex ratios were as follows: (The
sex was not determined for one 0-group fish.)
Number Number of Females per
Age group of males females 100 males

0)

1933, April 21 to May 8; peak, April 26 to 30.
1935, April 21 to May 8. psak, April 30 to May 2
.
1936, April 19 to May 10;peak, April 30 to May 5.
1937, April 28 to May ll;peak. May 3 to 9.
1938, April 12 to 27; peak, April 16 to 26.
The principal spawning grounds are in
Tamarack River and Shotley Brook which flow
into the eastern end of Upper Red Laxe and
Black Duck River which enters the southeastern
corner of Lower Red Lake . There are other
spawning streams of minor importance. EXiring
periods of low water, as in 1935 and 1936, the
walleye may spawn in the lake near shore if
prevented from entering upstream spawning
localities
.
THE YELLOW PERCH OF LOWER REDLAKE
The yellow perch, Perca flavescens
(Mitchill) ranks second to the walleye. Thetotal production averaged 145,702 pounds annual-
ly from 1927 to 1938. In the period 1927-1938,
yellow perch made up an average of 16.5 per-
cent of the yearly catch . Because of the
importance of yellow perch to the Red Lakes
fisheries, those facts concerning the life history
of the species obtained during the investigation
are presented here.
Scale samples and data on length, weight,
sex, and maturity were collected from 311 yel-
low perch, the total unassorted catch from 18
nets (5,400 linear feet). On the same day,
August 24, scale samples and data were obtained
from 196 "culls" sorted from the catch of all the
remaining fishermen. Scale samples and data
were also collected from 88 perch which wereselected from catches made on August 25 to
provide a more extensive range of sizes and age
groups for study. Lengths only were recorded
of 896 yellow perch, which, in addition to the 88
selected fish mentioned above, constituted the
entire catches of yellow perch from 34 nets
lifted on August 25.
Length -frequency distributions
With the yellow perch as with the walleye
it is valid to base tabulations of the length -fre-
quency distributions of the age groups (table 17)
on the combined selected and unselected samples
.
Since inclusion of the selected fish distorted the
data on the numerical representation of the age
groups, a record of the age composition of the
unselected sample of 311 fish has been included
at the bottom of the table. The frequency dis-
tribution based on all unselected samples of the
commercial catch (right of table) did not include
the "culls ' measured on August 24. This cir-
cumstance accounts for the fact that at certain
lengths the totals for the age groups exceed the
number of fish measured in all commercial
samples. One of the 595 scale samples collected
could not be used for age determination.
There was considerable overlap of the
length -frequency distributions of the age groups,
especially among the older and larger fish.
Every length interval from 180 to 259 millimeters,
standard length, was represented by at least 3
age groups, and some by 4, 5, or 6 age groups
.
In the unassorted samples of the commercial
catch (rig^t of table) the perch were concen-
trated between the lengths of 200 and 249 milli-
meters, standard length (9.0-11 .2 inches, fork
length; 9.4-11.8 inches, total length; 7.5-13.0
ounces), 90.0 percent of the total falling within
that interval. This length interval of greatest
abundance in the commercial catch corresponds
with the lengths of greatest abundance of age-
groups VI and VII. That these age groups werethe best represented in the commercial catch is
indicated also by the fact that age-group VI madeup 60 percent and age -group VII 26 percent of
the unassorted sample of 311 fish. The irregular
nature of the frequency distribution of the small-
er perch suggests that commercial gill nets maymake a number of "accidental" captures (fish
tangled in the webbing by their fins or mouth
parts). The fact that the IV-group fish were
poorly represented in both the selected and un-
selected samples may indicate poor survival in
1934.
Rate of growth
Examination revealed that inclusion of
selected material with unselected did not alter
average lengths and weights and calculated
lengths of the age groups as determined from
unselected samples alone. For purposes of a
study of growth the data of both the selected and
40

T3
unselected fish may be combined. Accordingly,
table 18, which contains average lengths and
weights at time of capture and coefficients of
condition, jC, for the males and females and for
the sexes combined, and table 19, which con-
tains calculated growth histories of the age
groups and grand average calculated growth,
have been based on all fish for which age deter-
minations were made. All individuals of age-
group I and nearly all of age -groups U, III, and
IV were selected whereas from 59 percent
(age group V) to 93 percent (age -group VII) of
the fish of the remaining age groups were un-
selected.
The differences between lengths and
wei^ts of male and female yellow perch of
age -groups I, II, and III were small and prob-
ably of little significance . On the other hand,
lengths and weights of males and females of
age -groups V-VIII are indicative of a possible
sex difference in growth rate inasmuch as the
females of each age group averaged longer and
heavier than the males of corresponding age
.
Calculated lengths at the end of the first
year of life (table 19) of the various age groups
were in good agreement among the older age
groups . Calculated lengths for the first year of
the I -group fish were greater than those of
other age groups (except the single male of age-
group VIII) . The 12 yearling fish probably
represented the larger and faster growing fish
of their age group. Liicewise, first -year cal-
culated lengths of the Il-group fish tended to be
higher than those of the majority of the older
age groups, probably for the same reason.
Second-year calculated lengths of the Il-group
fish were also higher than average, which lends
support to the inference that these were repre-
sentative of only the larger, more rapidly
growing individuals of the age group. Inclusion
of age -groups I and II in the computation of the
general growth curve does not have a signifi-
cant distorting effect on the data . Among the
older age groups agreement of the calculated
lengths was satisfactory when the number of
specimens was adequate
.
The grand average calculated lengths at
the bottom of table 19 are averages of the cor-
responding calculated lengths of the age groups
for the first 4 years of life . Beyond the fourth
year grand average calculated lengths were de-
termined by the successive addition of the grand
average increments of growth in length. This
procedure made possible a natural "smoothing"
of the growth curve in the later years. Thegraphical representation of the general growth
(fig. 5) has been arranged to permit ready con-
versions between standard lengths in millimeters
and total lengths in inches. The increments of
growth in length are shown by broken lines . The
increments show that most rapid growth of both
sexes took place in the second year. A progres-
sive decline in annual growth occurred after the
second year, although growth of the third year
still exceeded that of the first.
Calculated lengths of females of differ-
ent age groups were slightly larger than those
of males in all corresponding years of life.
This indication of a distinct sex difference in
growth rate is apparent in grand average calcu-
lated lengths. A similar sex difference in
growth rate has been found in other perch popula-
tions, notably in Lake Erie (Jobes, 1952).
Length -wei^t relation and coefficient of
condition
Length -weight data of Lower Red Lake
yellow perch are presented in table 20 and fig-
ure 6 for each sex and for the sexes combined.
In the table each length represents the average
of all fish in a 5 -millimeter interval of standard
length. The curve of figure 6 has been con-
structed so that it may be read in terms of
standard lengths in millimeters and weight in
grams, or fork or total length in inches and
weight in ounces. The length -weight data mani-
fested no consistently large sex differences over
the entire length range, althougli males of inter-
mediate length (172 to 198 millimeters) werenoticeably heavier than females of the samelength.
The coefficient of condition, _K^ has been
calculated for the averages of length and weight
of fish within each 5 -millimeter interval of stand-
ard length (table 20) . The values of_K_of males
may be described as relatively low over the
length range of 108 to 168 millimeters, relatively
higfi for lengths of 172 to 2 32 millimeters, and
42

Table 18. --Lengths, weights, increments of weight and coefficients of
condition, K, of yellow perch from Lower Red Lake
.
Agefprawp

Table 19- '-Length (in millimeters) of each age group of yellow perchfrom Lower Red Lake, calculated growth histories of age
groups, and grand average calculated lengths and increments
of length for all age groups combined
.

y E L L O IV PERCH L O IVE R RED LAKE2 5
k
Uj
J
Q
Q
k.
-J
2
I 5
I
5

(UB
aa
Xwx:on1)
ouQia.
o
^
a:
i-i
I
coa
oo
a0)ouaB
iB
-J
O(U
•a
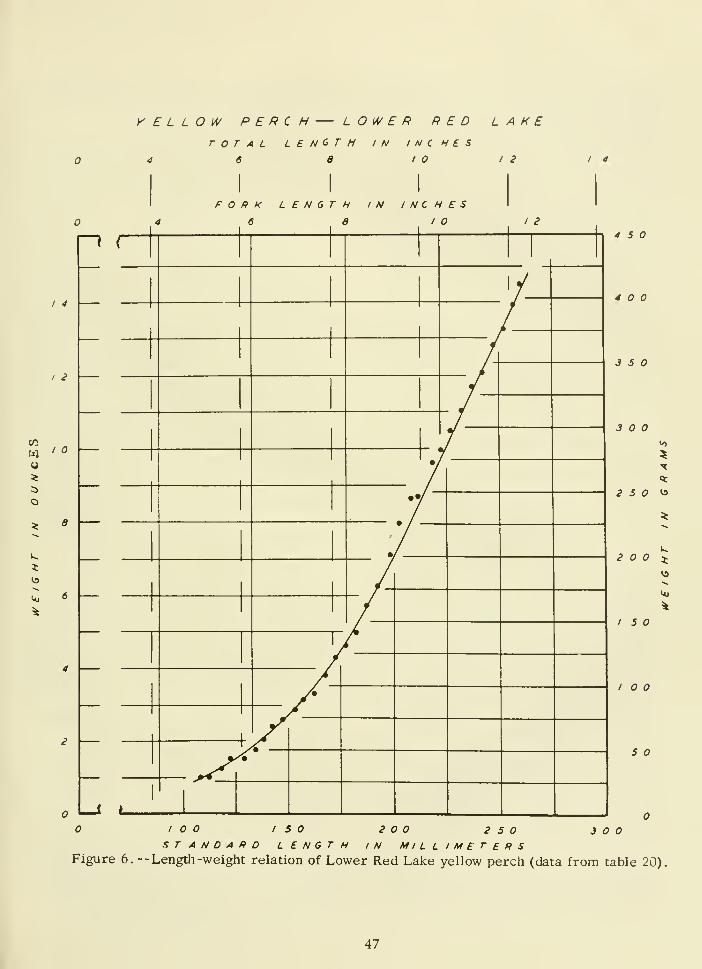
y E L L O IV PERCH L O A^ E R RED LAKETOTAL LENGTH IN INCHES
4 6 6 10 12
FORK LENGTH IN INCHES6 8 10 12
I 4
I 2
ICO
u
o
/ 4
low again at lengths of 238 and 248 millimeters.
There were wide fluctuations in the values of Kwithin these different intervals of lengths. Fe-
males exhibited the same kind of change as
males in values of K with increasing length of
fish However, the increase from a relatively
low value of K to a higher value did not occur in
the females until a length of 209 millimeters wasreached, instead of 172 millimeters, and the de-
crease in coefficient of condition of larger
females occurred at 242 millimeters instead of
at 238 millimeters as in males. When data for
the sexes are combined it may be seen that
values of K remained at about the same level
until a fish length of 172 millimeters was reached.
The values of JC increased over the length range
of 172 to 202 millimeters, remained fairly con-
stant at a high level for lengths of from 208 to
237 millimeters, then gradually declined with
each increase in length of the larger fish.
The changes in the values of K with
changes in standard length of sexes combined
appear to be due to the trends in values of jC of
each sex . Each sex had approximately the samecoefficient of condition at lengths of 108 to 168
millimeters, inclusive (K equalled 2.23 for the
males, and 2 .29 for the females) . It is obvious
that males were in better condition at lengths of
172 to 198 millimeters, inclusive. It is ob-
served also that values of K for the sexes com-bined increased at the lengths where the males
were relatively heavier than the females. The
high value of K at 202 millimeters is due entire-
ly to the heaviness of the males. The continued
high value of K for the sexes combined at lengths
of 208 to 232 millimeters no doubt was due to the
circumstance that both sexes were in good con-
dition at those lengths (K equalled 2.62 for the
males, and 2 .55 for the females) . The hi^value of^at 237 millimeters for the sexes com-bined was due to the good condition of the females
in that length interval and to the scarcity of the
more slender males. Since both sexes showed
a decline in condition at the greater lengths, the
decreasing values of K at lengths of 242 milli-
meters and more was to be expected.
Values of K, of individual age-groups
(table 18) show only slight differences related
to sex in the younger age groups but the maleswere distinctly heavier than the females in the
older age groups (V-VUI) . _K_ showed a tendency
to increase with age and length of the fish
.
Average^ of 2.46 for Lower Red Lake
yellow perch is unusually large for the species
and indicates that although they had grown at
only a moderate rate for the species, they were
extremely heavy for their length
.
Maturity and sex ratio
The criterion employed to ascertain
maturity in the walleye was also used for yellow
perch . Male yellow perch of Lower Red Lake
mature earlier than females (table 21). All fish
of both sexes were immature as age -group 1 (in
second summer). In age-group n, however, 59
percent of the males were mature whereas only
2 percent of the females were mature. The per-
centages of maturity for age-group III were:
males, 94; females, 37. The samples contained
no rV -group females but the high percentage of
immature Ill-group females suggests that somewould still have been immature as age -group IV.
The IV -group males and all fish of both sexes
of age -group V and older were mature. Sex ratios
varied widely among the age groups, although the
females tended to predominate. On the whole, the
females outnumbered the males 180:100.
THE GOLDEYE OF THE RED LAKES
The goldeye, Amphiodon alosoides
Rafinesque, was recorded as a separate item in
the statistical summaries of the Red Lakes fish-
eries in 1917-1918, althou^ thereafter, until 1927,
it was grouped with the miscellaneous fishes. Gold-
eyes were reported to have been extremely abundant
in the early years. Comparatively few goldeyes
were sold until a demand developed for the
smoked fish. In the period 1927-1938, an annual
average of 57,876 pounds of goldeyes wasmarketed. This species accounted for 6.6
percent of the average annual catch of all fish
.
On the average, during 1930-1938, 97 percent
of the yearly catch of goldeyes was producedduring the summer season.
FRESHWATER DRUM OF THE RED LAKES
The freshwater drum (also called sheeps-head, gray bass, and white perch), Aplodinotusgrunniens Rafinesque, is one of the least valuedof the commercial fishes of the Red Lakes.Large numbers are consumed fresh by the
48

CO
aft) pta oto U
o
0)
-P
CO
O CVJ
On CvJ
rH O
f^\ O
rH OCK
SO OCM
IXN O
O vO
2 :s
o oOS fH
o oo
o oo
o oo
8°
On
On rH
O Oo
3 CO
•-* ie -H
ft) 0)
CO (0
-P -PB C0) a;
o ou u<D ft)
nVrH(0
UN CO
C\i rH
r^ CVJ
rH CM
CNJ OCNJ
O so
u3P(0
e
ft)
K »
i-H CNNO r^
UN O O OO
UN O O O
NO O O OCNJ O
r^ O O Or-{ O
I I
o^vO
CNJ COOn
(00)
0)
CNJ CNJ OrH CO CO'^ <^ rH
rH UN Oou\
rH r— r-UN
rH NO OD
NO r^ OCM rH U>
UN O O
NO 'UNOn
-d- CNJ (3n(^ CNJ UN
iH <r^
NO NO
CO
O)
Oo
oo
•9 ^
c c
0)
a,
CO CO CO
p -p eGOO)El E-i |JM
CO0)
(0 rH0) COH 6CO 4)
HI
U9

resident Indians who also dry them in the sun or
smoke them over campfires and store quantities
of the dried or smoked product for winter con-sumption . They appeared separately in the
statistics of the Red LaKes fisheries of 1917-
1918, but thereafter until 1927, they were groupedwith miscellaneous fishes. Over the period1927-1938, an average of 18,592 pounds peryear was caught. In 1930-1938, the only yearsfor which catch statistics were separated byfishing seasons, 95 percent of the total catch of
freshwater drum was made during the summerand 5 percent during the fall. Statistical recordsprovide no estimate of the quantity caught for
local consumption, but contain only a tabulation
of the quantity marketed by the Red Laxe Fish-
eries Association. The species is of little
importance on the fresh -fish markets because of
the rather coarse, dry quality of its flesh, andconsequently it brings low wholesale and retail
prices. Indians and others report the species
is not as abundant as formerly, which is sub-
stantiated by the large catch (69, 119 pounds) re-
corded for the years 1917-1918.
NOTES ON THE WHITEFISH
The whitefish, Goregonus clupeaformis
(Mitchill), is the third most abundant species
produced commercially in the Red Lakes; the
average annual catch for 1927-1938 was 78,977
pounds. Catches from 1935 to 1938 were dis-
tinctly below normal, averaging only 31,912
pounds per year. Adverse weather conditions,
low water levels, and frozen spawning groundsas well as a decrease in abundance may have
been responsible. The majority of the whitefish
catch comes from Lower Red Lake where in
1920-1928, 77 percent of the total catch of both
lakes was obtained. In two of those years, how-ever, (1920 and 1922) more whitefish werecaught in the upper than in the lower lake
.
Whitefish are caught principally during the fall
season; during 1930-1938, 82 percent of the
total Red Lakes catch was obtained during the
fall. During some years, however, high per-centages of the total catch wem made during the
summer season, as in 1933, 1935, and 1936
when 50, 45, and 54 percent, respectively, of
the annual yields were obtained by summer fish-
ing.
NOTES ON THE NORTHERNPIKE
The northern piice, Esox lucius Linnaeus,
ranked fifth in total production in the Red Lakes
commercial fisheries up to the time of the sur-
vey. From 1927 to 1938 the annual catch
averaged 24,714 pounds. The catches each
year after 1932 were below average except in
1934. In 1923, 1924, and 1926-1928, 86 per-
cent of the total yield of northern piKe camefrom Lower Red Lake. In 1930-1938, 49 per-
cent of the total production of northern pitce
was caught during the summer fishing season
and 51 percent during the fall. Both large-mesh
and small -mesh nets were fished in the fall,
but their relative importance for production of
northern pike is not known.
NOTES ON THE SUCKERS
The catches of white sucker, Catostomus
commersonni (Lacdpfede), were not always re-
corded separately in statistics of the Red Lakes
fisheries, but during some years were included
with other species under the generalized head-
ing of rough fish. All suckers were grouped
together in the catch records for 1917-1918,
1927-1931, and 1933-1936. Besides die white
sucker, the northern redhorse, Moxostomaaureolum was also included, although the form-
er species probably comprised the bulk of the
catch. EXiring 1927-1938, the annual catch of
suckers in the Red Lakes averaged 5,348
pounds
.
THE ROCK BASS
The rock bass, Ambloplltes rupestris
(Rafinesque), is of minor importance in the
Red Lakes and usually occurs only incidental-
ly in the commercial gill -net catches. It is a
game fish in Minnesota and, under the terms
of state regulations, may be neither bought
nor sold.
ARTIFICL\L PROPAGATION
Artificial propagation of Red Lakes
fishes began in 1918 when an employee of the
Minnesota Department of Conservation was
50
sent to the lakes to obtain walleye eggs . Only
a small quantity was secured. The first white-
fish eggs were collected during the fall of 1919.
Because of the untrained personnel employed in
1922, only 13 percent of the whitefish eggs
hatched. Experienced spawn collectors, sent
to the Red Lakes in 1923, succeeded in obtain-
ing 72,000,000 whitefish eggs that were shipped
to the French River and Duluth hatcheries on
Lake Superior for incubation. A loss of only
15 percent was reported (Surber, 1924)
.
A hatchery building was constructed at
Redby, adjacent to the Minnesota State Fisher-
ies buildings, in 1924. The water supply was
obtained by impounding the waters of Mud Creek.
The hatchery was equipped for incubation of the
eggs of walleyes, whitefish, and trout . Its
capacity in 1938 was 160 million eggs. The
cost of the construction of the hatchery and the
expenses of its operation in the years 1924-1928,
were defrayed from the profits of the Minnesota
State Fisheries. Over the period 1929-1938, a
share of the salaries of 2 employees and a por-
tion of the operating costs were borne by the
Red Lake Fisheries Association, although the
hatchery remained under the supervision of the
Minnesota Department of Conservation.
Walleye
Eggs of walleyes hatched at Redby were
obtained by the artificial spawning of ripe adults
captured in pound nets set in three principal
streams entered by spawning schools. Two of
the streams. Tamarack River and Shotley
Brook, flow into the eastern end of Upper Red
Lake. (See fig. 1.) The third stream, Black
Duck River, flows into the eastern end of Lower
Red Lake. After 1933 there was no impound-
ment and stripping of walleyes in Shotley Brook
(at least no records are available), as it proved
to be the least productive of the 3 localities, and
a more than adequate supply of eggs for the Red-
by and other hatcheries could be obtained readily
from Tamarack and Black Duck Rivers
.
The procedure of capturing walleyes was
to set a pound net in the stream with the tunnel
opening faced downstream and a wing extended
at an angle to each bank. Four "dummy" pound
nets, that is, cribs without tunnel or wings.
constructed of the same kind of netting used for
the pound-net crib, were placed upstream from
the pound net to retain females not ready to be
stripped at time of capture. The pound net was
lifted each morning and the tunnel tied so no
fish could enter. Ripe fish were spawned at
once, and both males and females returned to
the river above the pound net so that they could
not re-enter it. Green females were placed in
the "dummy" nets until they ripened, when they
were spawned and released above the pound net
.
Because of this method of operation, it was
possible to count the fish that ascended the
streams. During the late afternoon the pound
-
net tunnel was untied and placed in position so
fish could enter. Each day's recorded catch of
male and female walleyes represented new ar-
rivals taken during one night's fishing. In some
years daily records were kept of males and fe-
males captured, females stripped, temperature
of water and air, and weather conditions .
All available records of male and female
walleyes captured annually in 3 spawning streams
where egg-collecting stations were maintained
are shown in table 22 . The magnitude of the
spawning run in Tamarack River far exceeded
that in the other 2 streams. The consistently
strong predominance of males (19 males to 1
female) each year appeared to be characteristic
of spawning runs of walleyes in the Red Lakes
.
"Hie record of males and females cap-
tured does not provide a complete count of the
spawning populations in the streams, and there-
fore, cannot be used as an index of abundance.
Althou^ the streams were blockaded effectively,
fishing operations often were delayed until the
main spawning run had started or were sus-
pended before the close of the spawning season,
as in 1932, 1933, and 1938. As soon as suf-
ficient eggs for the Redby and other State
hatcheries had been secured, the pound nets
were removed. The collecting season did not
always coincide with the spawning season, since
in some years heavy runs were already underway
when pound nets were first set. May 8, however,
marks fairly well the termination of the normal
spawning period.
Not only did the capacity of the hatcher -
ies limit the take of walleyes and eggs in certain
51
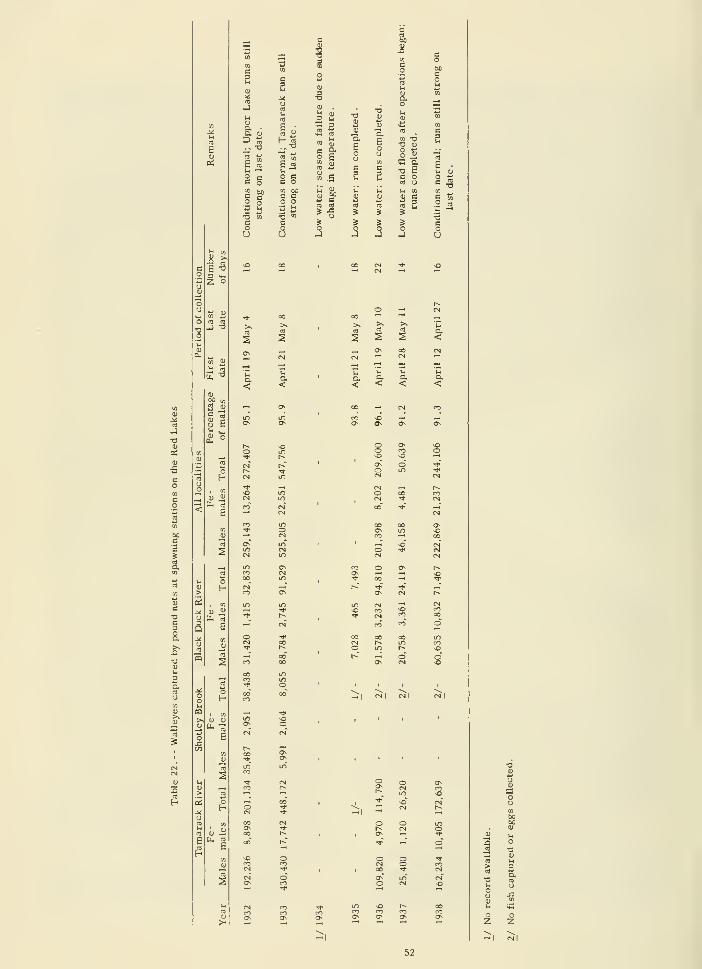
II
35
2 S

years, but other factors such as low water levels,
floods, sudden changes in temperature, and un-
favorable weather conditions reduced the numbers
collected in other years . For example, during
the spring reasons of 1934, 1935, and 1936, the
water level in Red Lakes v/as reported to be so
low that many walleyes, especially the larger
females, could not enter the streams to spawn.
At its lowest stage, in 1936, the water at the
mouth of Tamarack River was said to be only
about 4 inches deep. At the same time, the
depth at the mouth of Black Duck River was about
1 foot. By the spring of 1937, flood conditions in
Tamarack River prevented proper setting of the
pound net so the number of fish captured was
small and the number of eggs collected unusually
low.
Publications of the State of Minnesota re-
port unfavorable weather conditions in the spring
of 1924, 1930, and 1931; in addition to low water
a sudden drop in temperature to almost winter
conditions continued for such a long period in
1934 that upon resumption of favorable weather
conditions the walleyes failed to return to spawn.
A W.P.A. project approved in 1935 and carried
throu^ 1936, which made extensive channel im-
provements in Tamarack River, should prevent
shallow -water conditions which impeded the
spawning migration
.
Again, the biennial reports of the Minne-
sota Department of Conservation state repeatedly
that the number of walleye eggs taken depends to
a large degree on reasonably uniform water tem-
peratures. An examination of the daily tempera-
ture and catch records indicates that if such a
correlation exists the relation is very general in
character. Sudden changes in the abundance of
fish occurred during the height of the season
without a change in temperature, and vice versa
- - sudden changes in temperatures occurred
without affecting the trend in numbers of fish as-
cending the stream . Apparently a considerable
latitude exists in temperatures that control move-
ments of spawning walleyes. For example, large
numbers ran in both Tamarack and Black Duck
Rivers during April 22-30, 1936, when tempera-
tures were low (mostly below 39° F., table 23).
In fact, the largest number of fish (17,096) taken
on Tamarack River in 1936 was caught on April
27, when the water temperature was 34° F. On
the other hand, in 1937 large numbers werecaught during May 2-8, when water temperatures
were relatively high (mostly above 52 °F.). How-ever, the normal range of the temperatures
during the main part of the spawning runs was
40°F.-48°F. and varied only from 5° F. to 8°F.
(7 of the 1 1 runs)
.
All available records of the number of
walleye females stripped, number of eggs ob-
tained, and average number of eggs per female
are contained in table 24. The calculation of the
number of eggs collected is based on an actual
count of 137,251 eggs per quart made in April
1938, by the superintendent of the Redby hatchery.
The computation of the average number of eggs
per female is low because the females were not
subjected to sufficient pressure and manipulation
to remove all the eggs and probably not morethan 70 percent were expressed from the average
female. The precaution against severe pressure
is necessary to ensure that females will survive
artificial spawning and will be in good physical
condition and free from internal haemorrhage
when returned to the water
.
The first artificially hatched walleyes
were deposited in the Red Lakes in 1919 when
560,000 fry were planted. (Table 25) . Not until
the Redby hatchery produced its first walleyes
in the spring of 1925 were regular plantings be-
gun. The tremendous variations in numbers of
fry planted in different years were related to Jie
differences in total number of eggs collected
each year , number of eggs shipped to other
state hatcheries, percentage of hatch, and num-
ber of fry produced at Redby used for stocking
other waters.
Table 25 contains all available records
on total number of walleye eggs collected and
shipped from the Red Lakes, number of fry pro-
duced by the Redby hatchery, and number of fry
planted in the Red Lakes. During 1932-1938, an
average of 168,935,000 eggs was collected; the
smallest number was taken in 1937 and the larg-
est in 1938 . On the average, about 35 percent
of the eggs collected were shipped to other state
hatcheries . Of the remaining 65 percent, about
57 percent were reared to fry stage at Redby.
This percentage of survival does not substantiate
Mr. Thaddeus Surber's statement (Minnesota
53

Q

VnBv
Eoao<u
a
3o
bObo01
J*60
UV>
•o

0)
•T3
i)
o•3oua.
>>
aM
T3U«:
Eoa(U •
a <u
« «STJ
'"^
s-s1=1 .s
8 ^to «
^ >^
« c
ID
Pq
C 4)
^; rt

Conservationist, February 1934) that the usual
survival is 75 percent, nor does it agree with
percentages of hatch at the Federal hatchery at
Lakewood, Vermont (46 . 7 percent), and by the
State of Michigan on Saginaw Bay (35 percent).
On the average, 92 percent of the walleye
fry produced at the Redby hatchery were planted
in the Red Lakes. This represents an average
yearly plant of about 51,614,000 fry. About 60
percent of these were planted in Lower Red Lake
and 40 percent in Upper Red Lake, although the
percentages varied greatly from year to year.
The number of fry planted in the Red Lakes over
the period 1932-1938 represented 33 percent of
the eggs collected from these lakes, yearly per-
centages varying from 28 to 55 . The number of
fry planted, excluding 1919, varied from
10,900,000 in 1926 to 120,205,000 in 1929.
Whitefish
Artificially hatched whitefish fry were
first planted in the Red Lakes in 1921, when
875,000 were introduced (table 26). The first
collection of whitefish eggs from these lakes wasmade in the fall of 1919 when 2,000,000 eggs
were taken. A regular program of artificial
propagation of whitefish was begun in 1924 when
the Redby hatchery was first placed in operation.
Eggs of Red Lakes whitefish were ob-
tained by stripping fish captured by Indian fisher-
men in 5-1/2-inch mesh gill nets during the fall.
After stripping, the fish were marketed. Those
individuals with unripe eggs at the time of capture
also were sold. Their sex products, therefore,
were lost to the lake. Severe storms often inter-
rupted the collecting of eggs. Mr. Thaddeus
Surber (Minnesota Conservationist, December1934) reported that during the fall of 1933 a
change in weather conditions occurred so sudden-
ly that it stopped abruptly the spawning run of the
whitefish and destroyed many gill nets. He wrote:
"In the whitefish operations where the eggs are
procured through commercial fishing operations
at Red Lakes, the fishermen themselves suffered
a loss of 75 percent of their nets, the change was
so sudden." In some other years exceptionally
heavy winds prevailed and at times an early freeze
-
up occurred, such as happened in the fall of 1924
when the lakes froze a month earlier than usual
and greatly limited the take of whitefish eggs
.
One Indian fisherman informed us that because
of ice conditions, fishing for whitefish wasprofitable in only one out of three years.
For many years the Red Lakes were the
only source of artificially propagated whitefish
in Minnesota. Surber (1929) wrote: "The im-
portance of maintaining the whitefish fisheries
of Red Lake and of at least making an effort to
restore, so far as possible, the same fishery
in Lake Superior, has led this Department to
spare no efforts to obtain all the eggs possible
to meet this demand. Fortunately the vast re-
sources of Red Lake have made it possible to
secure large quantities of eggs, and while the
quality of the eggs varies from season to season
,
we can at least be assured of maintaining the
fisheries of Red Lake with a considerable surplus
to divert to other waters, including Lake Superior.
The statement reflects considerable optimism
.
In view of the decline in production of Red Lakes
whitefish during years before 1938 (table 2), it
appeared doubtful that the fry resulting from only
a portion of the eggs collected from Red Lakes
fish were particularly effective in maintaining
the stock.
Optimism again was reflected in Surber's
(1933) statement: "Our production of whitefish
eggs continues to be of great importance . Not
only are we maintaining an important fishery
for this species in the waters of Red Lake but
Red Lake has proven to be the only source from
which we can expect a never failing supply of
eggs for supplying other waters. From this
source of supply we have successfully introduced
whitefish into Lake Superior. This was respons-
ible for the increased catch of whitefish in Lake
Superior waters. We are procuring eggs of this
species from Lake Superior >vhich are readily
identified as the Red Lake species." The principal
distinguishing feature of the eggs according to
Mr. Surber was a difference in average size,
the eggs of the Red Lakes whitefish averaging
52,740 to the quart and those of the Lake Superior
whitefish 35,000 to the quart.
It is questionable whether races of such a
plastic form as the whitefish can be identified by
a character as variable as the number of eggs
per quart. The fact that the whitefish produc-
tion of the Michigan waters of Lake Superior
showed fluctuations corresponding to those of
57

the Minnesota production throws considerable
doubt on the assumed causal relation between
plantings of Red LaKes fry and commercial catch
in Lake Superior. However, in more recent
years immediately prior to 1938 there weremore grounds for the belief that artificial propa -
gation of whitefish was beneficial to the Red Lakes
fisheries. If published reports describe the
situation accurately, then the droughts or low
water levels of several years (1931-1936) musthave had a devastating effect on whitefish eggs
deposited naturally in the lakes. The "Second
Biennial Report, Fiscal Years 1933-1934"(1934)
of the Minnesota Department of Conservation
stated (p. 164): "To those who have had occasion
to study the real effects of the drouth however,
the situation is more serious. To cite one in-
stMice, the water levels of Red Lake have receded
to a point where the natural spawning beds of the
whitefish are exposed to the open air and it is
extremely doubtful if any natural reproduction
will take place until the lake level has again at-
tained its normal elevation. This is a serious
matter because the whitefish of Red Lake is justly
considered the most valuable food fish native to
our waters. The "Third Biennial Report, Fiscal
Years 1935-1936"(1936) reiterates the statement
that the whitefish spawning beds "are all exposed"
and "Namrally, if the eggs are deposited on
these old beds, natural production is practically
nothing, as the beds will be frozen solid through-
out the winter .' (p. 152). Under such conditions
it is conceivable that artificial propagation might
have been a factor in maintaining the whitefish of
the Red Lakes
.
Surber (1920) also reported that in 1918
burbot (Lota maculosa) were found on the white-
fish spawning grounds with their stomachs filled
with whitefish eggs. It is not believed, however,
that burbot were numerous enough to have been a
factor in the depletion of whitefish.
An incomplete record of whitefish eggs
collected from the Red Lakes in the fall of various
years over the period 1919-1934, appears in
table 26 . Althou^ eggs were collected every
year during this period, data were available to us
for only 6 years. The computation of numbers of
whitefish eggs collected was based on the accepted
count of 47,000 eggs per quart. Only fragmentary
data were available on the number of whitefish
eggs shipped by the Redby hatchery crew to other
hatcheries for incubation. Table 26 also con-
tains data on the number of whitefish fry produced
at Redby and planted in the Red Lakes. Since the
published biennial reports of the Minnesota De-
partment of Conservation indicate that practically
all of the whitefish fry distributed by the State
originated from the Red Lakes, data have been
Included showing the total number of whitefish
fry produced by the State and the percentage of
each yearly total produced at Redby and planted
in the Red Lakes. Percentages of the number of
fry planted in these lakes in the total number of
eggs collected and in the number of fry produced
at Redby are shown also
.
Available records suggest an average of
at least 45,586,000 whitefish eggs were collected
annually from the Red Lakes from 1919 to 1938.
Before the fall of 1924 and establishment of the
Redby hatchery, all the eggs were shipped from
the Red Lakes for incubation. Computations
based on the scanty data for the years 1933-1935,
indicate that on the average about 17 percent of
the eggs collected by the Redby hatchery wasshipped to other state hatcheries. The eggs re-
tained at Redby yielded an average annual
production of 37,411,064 whitefish fry, which
represented a survival of about 62 percent as
determined from the 1933-1935 data. This per-
centage hatch compares favorably with that
obtained by the U. S. Fish and Wildlife Service
and the State of Michigan (60-65 percent) for the
same species. The number of whitefish fry pro-
duced at Redby represented two-thirds of the
State's output of whitefish fry during 1927-1936.
From 1921-1936, the State produced an average
annual yield of 35,921,000 whitefish fry, and dur-
ing 1921-1938 the State distributed approximately
550 million whitefish fry, nearly all, if not all,
of which presumably came from the Red Lakes.
Since 1920 a total of more than 461 million white-
fish fry, or an average of 27,084,000 fry per year,
was planted in the Red Lakes. This number
represented roughly 43 percent of the eggs col-
lected, 72 percent of the total production of
whitefish fry in the State, and 97 percent of the
fry produced at the Redby hatchery. Whitefish
fry planted in the Red Lakes, excluding 1921,
varied from 4,385,000 in 1925 to 59,210,000 in
1929. About 82 percent of the fry was planted in
Lower Red Lake and 18 percent in Upper Red Lake
.
58

65
•dai
o >i
p.
o +^
•d
I o
•a
o
o -d
K
o ^ o<B 4J -d >5
c3 o Fh "d
C w «0. -
f-.O (D h
Pl( +^ <H
d<H (1)
^1 CO "dP. <K
Ot^-d ra
^ <D 0)
3 aV. « -Ho o S5
^<
0)
<H c,
en 4^,i >, ai
dto (£>
a; tj o
'1 a
,
Brook, brown, rainbow,
and lake trout
Table 27 contains all available data on the
number of trout and other varieties of fish, ex-
clusive of the walleye and whitefish, planted in
the Red Lakes and their tributaries or produced
at the Redby hatchery during the spring of vari-
ous years prior to 1938 . According to the report
of January 1, 1925 by the Superintendent of the
Minnesota State Fisheries, the propagation and
planting of all varieties of fry from 1917 to 1924
inclusive were carried on at the expense of the
State Fisheries, about "90 percent of . . .(whose)
earnings have been derived from the Redby
operation. ..."
Over the period 1917-1924, 621,150 brook
trout fry were deposited in tributaries of the RedLakes and 400,000 herring fry were planted in
the Red Lakes. In 1927 and 1928 the Redby
hatchery produced 104, 940 lake trout fry , of
which 43,611 or 42 percent were introduced into
the Red Lakes. So far as known, no herring or
lake trout were ever taken out of these lakes.
During the 1927-1928 biennium approximately
15,000 perch fry were produced at the Redbyhatchery. During 1927-1938 (3 years missing),
this hatchery reared an annual average of 123,000
trout fry (brown, brook, and rainbow) which
presumably were planted in the streams general-
ly within a radius of about 75 miles from the RedLakes. It may be safely assumed that since 1917
the Redby hatchery was largely responsible for
the production of an estimated total of 2 million
trout fry intended for anglers
.
SUMMARY
1
.
The Red Lakes are situated in Beltrami
and Clearwater Counties, Minnesota . All of
Lower Red Lake and 49 percent of Upper RedLake lie within the Red Lake Indian Reservation.
Upper Red Lake has an area of 188 square miles
and Lower Red Lake an area of 255 square miles.
Both are single -basin, comparatively shallow,
eutrophic lakes well suited for the production of
fish. No limnological survey has been made of
the Red LaKes.
2. An account of the commercial fisheries
of the Red Lakes traces the development of the
industry from its inception in 1917 as a warmeasure to augment food resources, through the
period of State operation from 1919 to 1928, both
years inclusive, and the period of cooperative
management by the Red Lake Fisheries Associa-
tion, Inc., from 1929 through 1938. Essential
extracts from Minnesota laws. Federal regula-
tions, and other documents are included.
3 . A list of the commercial and non-
commercial fish fauna of the Red Lakes,
compiled from publications and new collections,
includes 29 species of 25 genera and 14 families.
Nineteen species, principally small forage fishes,
had not been reported previously.
4. Statistics of the total catch for 20
years (1918 and 1920-1938) were analyzed. Anaverage annual yield of 820,320 pounds of all
species was secured with an average value of
$49,644. Production in 1927, 1928, 1930, and
1933-1936 was below average, and in 1929, 1931,
1932, 1937 and 1938 was above average.
5 . Walleyes, yellow perch, whitefish,
goldeye, and northern pike predominated in the total
annual production in the order named. The trend
of the annual production of walleyes and yellow
perch followed the trend of the total catch. White-
fish production was below average from 1935 to
1938.
6. Production statistics for Lower and
Upper Red Lake were analyzed for 1920-1928.
Ninety percent of the catch came from Lower and
10 percent from Upper Red Lake. In more re-
cent years the yield from the upper lake wasreduced considerably.
7. During 1927-1938, the Indians pro-
duced 95 percent of the total catch and white
fishermen 5 percent.
8 . On the average, 78 percent of the
annual catch was obtained during the summerfishing seasons of 1930-1938, but 82 percent of
the whitefish were caught during the fall season
in those years. The summer catches included
80 percent of the annual yield of walleyes and 91
percent of the yellow perch
.
9. During 1930-1938, an average of 200
60
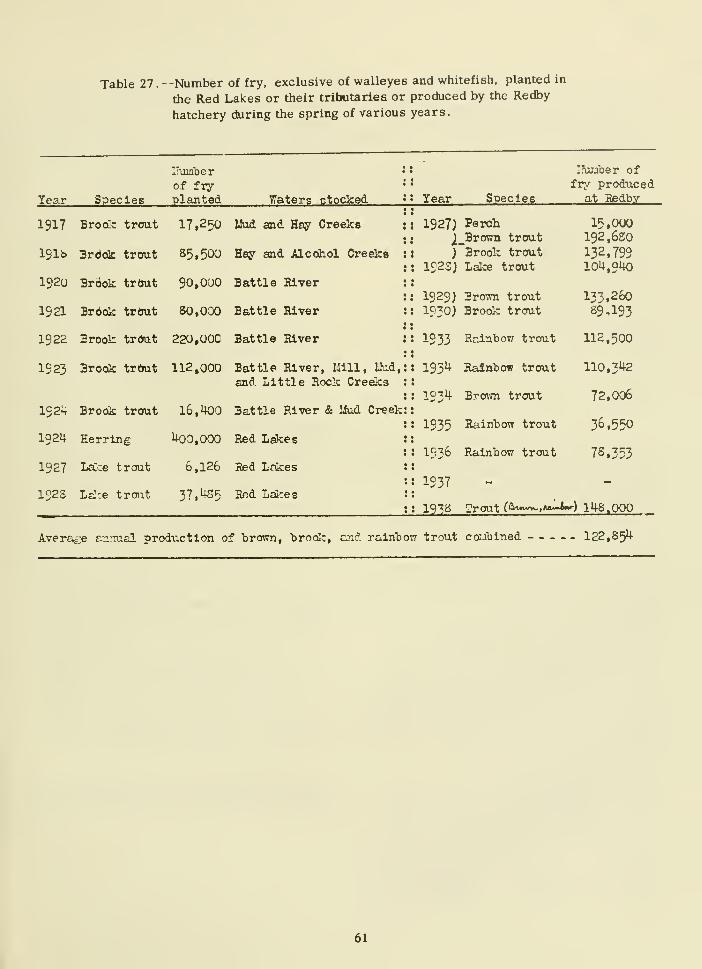
Table 27. --Number of fry, exclusive of walleyes and whitefish, planted in
the Red Lalces or their tributaries or produced by the Redby
hatchery during the spring of various years.
fishermen participated in the summer fishery
each year and 174 in the fall fishery, and 223
fishermen took part at some time during the
year. Indians comprised about 96 percent of the
total number.
10. During 1930-1938, an average of
7,669 net lifts was made, 77 percent in the sum-mer and 23 percent in the fall. Each fisherman
made 30 lifts in the summer and 10 in the fall.
The summer season covered an average of 57
days.
11. Because of a maximum production
limit of 650,000 pounds of the principal species,
the number of individual lifts made by each fish-
erman and the length of the summer season
usually were inversely related to the abundance
of fish. When fish were numerous the summerseason tended to be shortened and consequently
the number of lifts reduced.
12 . The catch per unit of effort (yield
per individual lift of small -mesh gill nets) during
the summer season was held to be the best index
of the abundance of fish of commercial size.
During 1930-1938, the walleyes were below aver-
age in abundance in 1930 and 1934-1936, and
above average in 1931-1933 and 1937-1938; the
yellow perch were below average in 1930-1931
and 1934-1936 and above average in 1932-1933
and 1937-1938. 1936 was a poor year but 1937
and 1938 were excellent for both species. Theserapid fluctuations in catch per unit of effort in
1936-1938 were thought to be due to changes in
water levels, in the condition of walleyes, in size
of mesh of gill nets, and in natural abundance
.
The disturbing artificial factors made a convinc -
ing study of abundance impossible . A stabilized
fishery is a requisite for such a study. Whitefish
apparently have decreased in abundance from 1935
and northern pike from 1934 to 1938.
13 . The age, growth, m aturity, andcondition of walleyes of Lower Red Lake werestudied. Length frequencies showed that 38 per-
cent of the walleyes in the commercial catch
were below the established minimum size limit
of 14 inches, fork length (1938). The commercialcatches were dominated by individuals in the
fifth and sixth years of life. A length of 14 inches
to the fork of the tail was reached in about 5 years
.
14. Age, growth, maturity and condition
of the yellow perch of Lower Red Lake werestudied. Length frequencies showed that 90
percent ranged between 9 and 11 inches, fork
length . The collections were dominated by fish
in the seventh year of life. Females grew morerapidly than males in each year of life.
15. A historical account of the artiiicial
propagation of walleyes and whitefish on the
Red Lakes is presented. A continuous programoriginated with the construction of a hatchery
at Redby in 1924.
16. The method of collecting and strip-
ping walleyes for spawn is described. Records
were obtained of the number of spawning malesand females taken and of the number of eggs
collected. The females produced an average of
23,153 eggs. The quantity of fry returned to
the Red Lakes varied from year to year in ac-
cordance with the number of eggs collected, the
number of eggs and fry supplied to other hatch-
eries or waters, and the variations in the per-
centage of hatch. In 1933-1938 about 35 percent
of the eggs collected were shipped to other
hatcheries. On the average, 92 percent of the
fry hatched at Redby were planted in the RedLakes, which represented only 33 percent of the
number of eggs collected.
17. The method of collecting and stripping
whitefish for spawn is described. About 17 per-
cent of the whitefish eggs collected on the RedLakes were reported shipped to other hatcheries,
but on the basis of the total amount of fry pro-
duced, the data suggest that about 33 percent
of the eggs were shipped. Rou^ly 43 percent
of the eggs collected were returned to the RedLakes as fry. On the average, 97 percent of the
fry hatched at Redby or 72 percent of the State's
output were returned to the Red Lakes
.
18. During 1927-1938, the Redby hatchery
produced an average annual yield of approximate-
ly 123,000 brown, brook, and rainbow trout fry.
62
LITERATURE CITED
Avery, Carlos
1918. Minnesota's experiment in State
fishing. Transactions, AmericanFisheries Society, vol. 48, No. 1,
pp. 57-64.
Klancke, Albert C
.
1931. The Redby fisheries. Biennial
Report of the Commissioner of
Game and Fish of the State of
Minnesota, 1929-1930. Fins,
Feathers and Fur, No. 93, Jan.,
1931, pp. 18-19.
1919. Report of the Minnesota state
fisheries, Oct. 15, 1917 to Dec.
31, 1918. 15 pp.
Eddy, Samuel, and Kenneth Carlander
1939. The growth rate of wall-eyed pike
(Stizostedion vitreum (Mitchill)
in various lakes of Minnesota.
Proceedings, Minnesota Academyof Science, vol. 7, pp. 44-48.
Selvog, S.
1922. Minnesota state fisheries
.
Biennial Report of the State Gameand Fish Commissioner of Minne-
sota for the biennial period ending
June 30, 1922, pp. 64-67.
1925? The Minnesota state fisheries,
Redby, Minn, (pamphlet).
St. Paul.
Hart, John Lawson1928 . Data on the rate of growth of pike
perch (Stizostedion vitreum) and
sauger (S^. canadense) in Ontario.
University of Toronto Studies,
Biological Series No. 31, Publica-
tions of the Ontario Fisheries
Research Laboratory No. 34, pp.
43-55.
Jobes, Frank W
.
1952 . Age, growth, and production of
yellow perch in Lake Erie . U.S.Fish and Wildlife Service, Fishery
Bulletin 47, vol. 52, pp. 205-266.
Klancke, vUbert C
.
1929. Minnesota State Fisheries.
Biennial Report of the Game and
Fish Department of the State of
Minnesota, 1927-1928. Fins,
Feathers and Fur, No. 72, April
1929, pp. 70-71.
Surber, Thaddeus
1920. A preliminary catalogue of the
fishes and fish -like vertebrates
of Minnesota. Appendix, Biennial
Report, State Game and Fish
Commissioner of Minnesota, for
the period ending June 30, 1920,
pp. 1-92.
1924. Propagation and distribution of
fish. Biennial Report of the (Minne-
sota) State Game and Fish
Commissioner for the biennial
period ending June 30, 1924, pp. 60-81.
1929 . Propagation and distribution of fish
.
Biennial Report of the Game and
Fish Department of the State of
Minnesota, 1927-1928. Fins,
Feathers and Fur, No. 72, April,
1929, pp. 66-69.
1933. Fish propagation in State success-
ful. The Minnesota Conservationist,
May -June, 1933, pp. 4, 24, 26.
63
IHT.-DUP. SEC. WASH., D.C.22i»'


M8L WHOI Library Serials- -
--'-""|!||l||il||l|i1l|||ll||tll|l|l'll
5 WHSE 01164
