history of banking regulation as developed by the basel ... basel ii pillar i and basel iii standing...
TRANSCRIPT

(*) National Research University Higher School of Economics (Moscow, Russia), Department of Applied Economics,
Assistant Professor; International Laboratory of Decision Choice and Analysis, Senior Research Fellow; head of
the Basel II Pillar I and Basel III Standing groups within ‘Basel II and Risk-Management Standards Committee’ of the
Association of Russian Banks; project manager at Basel standards implementation unit within Risk-management
division of Alfa-Bank (Moscow, Russia); member of the European Association for Banking and Financial History
Web-page: http://www.hse.ru/en/staff/penikas.
Author is grateful to professors L. Grebnev and Ch. Colvin for discussing one of the first drafts of the paper. Author is
grateful for the inspiration and motivation to prepare current paper that originated from discussions with R. Repullo
and W. T. Selmier II. Author particularly acknowledges anonymous reviewer for the useful and numerous detailed
comments that allowed to significantly improve the content of the paper.
This article is the exclusive responsibility of the author and does not necessarily reflect the opinion of the affiliated
institutions. It does not necessarily reflect either the opinion of the Banco de España or the Eurosystem.
Henry Penikas (*)
HISTORY OF BANKING REGULATION AS DEVELOPED BY THE BASEL COMMITTEE
ON BANKING SUPERVISION IN 1974 – 2014 (BRIEF OVERVIEW)


BANCO DE ESPAÑA 11 ESTABILIDAD FINANCIERA, NÚM. 28
HISTORY OF BANKING REGULATION AS DEVELOPED BY THE BASEL COMMITTEE
ON BANKING SUPERVISION IN 1974 – 2014 (BRIEF OVERVIEW)
In its anniversary 40 years the Basel Committee on Banking Supervision (BCBS) has
published 453 documents that have framed the general bank (and particularly risk)
supervision and regulation worldwide. The objective of the paper is to investigate the main
stages of BCBS regulation evolution, key facts related to bank and risk regulation
development process and to summarize the areas that were touched by the BCBS
regulation including credit, market, operational and liquidity risks; risk and capital
aggregation; corporate governance, recommendations for central banks and information
disclosure by commercial banks. The paper should be viewed as a natural continuation of
the Professor Goodhart’s 2011 book on BCBS history with two core distinctive features.
Whereas Professor Goodhart’s book focuses on the early history of 1974-1997 and is
based on review of BCBS internal archives, the current paper covers whole history of
1974-2014 and is based on the documents and comments publicly available on the
website of the Basel Committee. Concluding remarks present recommendations to
improve existing bank and risk regulation to be first adopted by the Basel Committee.
The Governor [of the meeting at the Basel Committee]
pointed out that the danger we confronted now
[on May 10, 1974] was not of lax of banking,
but of ‘over-prudence’.
GOODHART
[(2011a), p. 35]
The Basel Committee on Banking Supervision (BCBS) was founded in 1974. In 2014 it
celebrated its 40-year anniversary. By the moment of paper preparation the committee has
published 453 documents1 with overall volume of 16 230 pages. These documents have in
essence become the framework for global supervision and particularly risk regulation best
practice, i. e. exactly as professor Goodhart [Goodhart (2011a), p. 542] says that ‘[BCBS]
has become a de facto international regulatory body’, though BCBS never had and never
opted to have legal power to enact regulation for countries.
Often the BCBS documents originated from best practices,2 or in fact from the member
countries’ experience (e. g. remember arguments for Basel I whether to have it as a risk-
weighted or risk-unweighted capital ratio); sometimes they originated from industry
practice (e. g. to mention first amendment to Basel I on market risk regulation and later
Basel II credit risk regulation); and in particular cases requiring new solutions (e. g.
regulation and capital provision against credit protection when using CDS).
When one wants to study the recent history of banking regulation and supervision, he or she
has to start from detailed analysis of BCBS endowment. By now the only material that one
Abstract
1 Introduction
1 Starting October 31, 2014 the Basel Committee started denoting its papers by a ‘d’ symbol in front of paper
name. This seems to be a new approach within Bank for International Settlements (BIS) committees, as e. g.
Committee on Payments and Market Infrastructures started using similar format, see e. g. its paper ‘d123’
published on December 23, 2014.
2 Author is grateful to anonymous reviewer for pointing out the difference in terminology.

BANCO DE ESPAÑA 12 ESTABILIDAD FINANCIERA, NÚM. 28
may find on BCBS history is the book prepared by Professor Goodhart [Goodhart (2011a)].
Though large in granularity of material reviewed due to the use of internal BCBS archives, it
is limited in historical coverage dealing only with the early years of 1974-1997 before Basel II
work was started.
When thinking of regulation history overview, one may wish to refer to other books
– e. g. one about Federal Reserve in the US and Bank of England in the UK [Wood (2008)]
or Banque d’Amsterdam [Gillard (2004)] histories – . Though idea to review those is
correct, most steps of central3 banks in recent history were a reflection of collective
decisions approved by all members within the Basel Committee. Thus the objective of
the paper is to research the BCBS activity leaving individual central banks out of research
scope.
To provide another argument for the necessity for BCBS documents review one has to
remember that the regulatory framework created by BCBS documents is grounded on 453
papers, or approximately 16 thousand pages, and more that 2 thousand comments that
were sent to BCBS. These numbers seem unrealistic to be reviewed and known by each
commercial or central banker. Thus a structured research of these documents is required
for both central and commercial bankers to be on the same page and speak the same
language knowing already discussed points and arguments.
The paper is organized in the following way. Section 2 elaborates on approach to
information collection from the website of the Basel Committee. Section 3 is devoted to the
review of five regulatory waves in BCBS activity. Section 4 presents key stylized facts
about BCBS publications and comments sent to consultative versions of the BCBS
documents. Section 5 gives a summarized review by core areas (workstreams) of banking
regulation developed by the Basel Committee. Workstreams include credit, market,
operational and liquidity risks; risk and capital aggregation; corporate governance,
recommendations for supervisors and information disclosure by commercial banks, and
other issues. Section 6 concludes by suggesting next steps for regulation improvement.
The research is grounded on the materials disclosed by the Basel Committee on Banking
Supervision on the website of the Bank for International Settlements – BIS – (http://www.bis.
org/publ/).4 The two major sources of BCBS documents relate to the Basel Committee
section itself and the one relating to Joint Forum that was created in 1996 to supervise
financial conglomerates by initiative of the Basel Committee and the International
Organization of Securities Commissions (IOSCO) as mentioned in Goodhart (2011a; p. 505).
Respective materials are marked by acronyms ‘bcbs’ and ‘joint’, e. g. for results of Basel III
monitoring exercise one should refer to http://www.bis.org/publ/bcbs278.htm, whereas for
longevity risk discussion in the form of the final document one should go to http://www.bis.
org/publ/joint31.htm. In the times when it was not possible to trace the exact day of
publication (e. g. only month was mentioned for the document), day 01 of the month was
registered for respective publication (e. g. for final Basel I document only month of July is
mentioned on the website; see http://www.bis.org/publ/bcbsc111.htm).
2 Approach
to Basel Committee
Publications Collection
and Analysis
3 An overview of the changing role of central banks is given by professor Goodhart [Goodhart (2011b)].
4 One of supporting motivations for the current research was the representation of number of filed documents to
BCBS archives in its early years presented by professor Goodhart [Goodhart (2011a), p. 96]. Archival files are not
publicly available. This is why current research was grounded on open source web-site information. As a general
observation during the early years of the Basel Committee the number of internally filed documents per annum
almost 10 times exceeded the number of publicly shared documents.

BANCO DE ESPAÑA 13 ESTABILIDAD FINANCIERA, NÚM. 28
It is necessary to introduce Basel Committee core documents classification to be used
further. All the documents mentioned above (i. e. marked as ‘bcbs’ and ‘joint’) can be
broken down into four categories:
1 Consultative document (conventionally such document opens public
discussion for respective topic);
2 Final document (that type of document presents the modified consultative
document after review of comments received and their discussion within
Basel Committee working groups);
3 FAQ – frequently asked questions (document of this type is used to add extra
interpretation to final document if the latter occurred to be insufficient);
4 Report (this is usually a paper indicating the progress of work to implement
and run the respective final document).
There are four other important sources of information that are found differently at web-site.
Those include the following ones issued all by the Basel Committee:
5 Newsletters;
6 Working papers;
7 Comments received for consultative documents, and
8 Quantitative impact studies (QIS).
To trace newsletters one should search for acronyms of the type ‘bcbs_nl’, e. g. for the
treatment of European Stability Mechanism and European Financial Stability Facility for
credit risk measurement purpose one has to visit the following URL: http://www.bis.org/
publ/bcbs_nl17.htm. As for working papers providing extended rationale for particular
regulatory decisions it is required to use the acronym ‘bcbs_wp’, e. g. to get acquainted
with reasoning for standardized approach when measuring counterparty credit risk
exposure the following link http://www.bis.org/publ/bcbs_wp26.htm is of use.
It is important to limit the scope of the research by excluding the working papers published
under the auspices of the Bank for International Settlements, but not directly by the Basel
Committee as they predominantly deal with macroeconomic and monetary issues being
not that focused on microeconomic (microprudential) regulatory issues.5 Those (excluded
from scope) are marked by acronym ‘work’, e. g. discussion on the sources of firms growth
is available using the following link http://www.bis.org/publ/work469.htm.
Comments to consultative documents shed light on industry and sometimes regulators
(from non-Basel committee member countries) position enabling to understand what
5 Nevertheless, certain papers might be of interest (e. g. that of Professor Goodhart about the role of Central Banks
dated November 2010 – http://www.bis.org/publ/work326.htm – and another devoted to Basel III liquidity risk
proposed regulation and dated October 2014 – http://www.bis.org/publ/work470.htm), but generally this is not
the rule. This is why BIS working papers are excluded from total count of publications and pages for the purpo-
ses of this work. As another observation BIS has published close to 500 working papers from its creation, whe-
reas Basel Committee itself has produced 453 documents in 40 years.
BANCO DE ESPAÑA 14 ESTABILIDAD FINANCIERA, NÚM. 28
needs improvement in the prepared papers. It is important to note that comment origination
should be considered to evaluate the degree of its bias. For example, comments from
academicians may be more independent,6 than those coming from banks or banking
associations as latter may generally lobby softening or postponing the regulation if the
latter brings extra burden or at least extra costs for compliance.
More recent documents have comments representation linked directly to the paper, e. g.
to see comments to proposed revision of Pillar III one has to go to page http://www.bis.
org/publ/bcbs286/comments.htm where ‘bcbs286’ refers to consultative document itself
(comments publication was not that always easy and straight-forward to trace if you are
not on the page of the final or consultative document itself, e. g. comments to the second
consultative paper on Basel II are available here: http://www.bis.org/bcbs/cacomments.htm).
Quantitative impact studies (QIS) are run by the Basel Committee to evaluate whether
proposed guidelines need further polishing, and what the overall impact on the banking
system might occur subject to guidelines proxy implementation. All the QIS forms and
results are stored at a separate section of the Basel Committee website, namely inhere:
http://www.bis.org/bcbs/qis/.
The present section is important to understand how to search for publications of interest.
As the list of Basel Committee publications is extensive, to not overload the references list
the reader is recommended to refer to the above mentioned links to documents, working
papers, newsletters and comments using the code explicitly stated in the text of this paper.
For example, if one is interested to find the discussion on the results of trading book
hypothetical portfolio exercise and one knows this is the Basel Committee paper bcbs288
published on September 9, 2014, it is needed to form the URL out of two part: the general
part http://www.bis.org/publ/[...].htm and specific one where ‘[...]’ bracket symbol has to
be replaced by bcbs288 to arrive at http://www.bis.org/publ/bcbs288.htm.
Thus a total number of 453 Basel Committee publications and 2290 comments to its
consultative versions were collected and reviewed (in more details those would be
commented in section 4 on stylized facts; for details please, refer to Table A.1 - Table A.6).
One may wish to understand what is the contribution of Joint Forum activity to above
mentioned overall number of 453 regulatory documents developed by the Basel Committee.
Joint Forum has roughly produced slightly less number of documents during its lifetime
since 1996, than BCBS created before 1996 (36 and 44 documents, respectively). In terms
of total number of documents Joint Forum has contributed to 8% and in terms of pages to
14% (please, refer to Table A.2 for more details).7
Next section would discuss how those collected papers form five regulatory waves of
Basel Committee work on banking regulation development.
The Basel Committee on Banking Supervision originated from groupe de contact with
French being the original working language as mentioned by Goodhart (2011a; p. 17). If
the latter was established in 1972, the former was created in 1974. Thus in 2014 the Basel
Committee celebrated its 40-year anniversary. To research the banking regulation evolution
3 Five Regulatory Waves
of the Basel
Committee Work on
Banking Regulation
6 Author is grateful to anonymous reviewer for pointing out the possibility of bias in comments coming from diffe-
rent sources (from banks lobbying their interests and academics being more independent compared to banks).
7 Author is grateful to anonymous reviewer for recommendation to decompose documents in those produced by
Joint Forum and others.

BANCO DE ESPAÑA 15 ESTABILIDAD FINANCIERA, NÚM. 28
produced by the Basel Committee one has to focus on subject areas (e. g. concrete risk
regulation domains). Still to understand the driver even for particular risk regulation one
should understand what was the regulatory wave for the world banking industry as a
whole. Thus before proceeding to describing stylized facts about banking regulation and
paying detailed attention to the workstreams (subject areas), it is necessary to identify core
regulatory waves that existed in the history of banking regulation produced by the Basel
Committee during its 40 years.
The Basel Committee 1974 – 2014 work on developing banking regulation can be broken
into the five following regulatory waves (for details, please, consult Table A.2). Name for
regulatory waves are proposed to reflect the dominating core document that occupied the
mind of central and/or commercial bankers at the time.
1 1974 – 1986 – Concordat;
2 1987 – 1998 – Basel I;
3 1999 – 2008 – Basel II;
4 2009 – 2011 – Basel III;
5 2012 – 2014 – Post-Basel III.
The Basel Committee work started to deal with supervisors’ interaction when in need to
cross-border resolve weak banks. This marked the start of the first regulatory wave driven
by publication of the very first document ‘Concordat’ (bcbs00a; September 01, 1975).
After Concordat discussions and document preparation on other issues (including Basel I
and liquidity risk regulation) started.
Though intensive internally [including the intent of the USA and the UK to solely agree on
capital regulation rules disregarding the work inside the committee as described by
Goodhart (2011a)], publicly the regulatory wave lasted till 1986 having only 11 documents
published with a total volume of 77 pages. Economic activity was tense at the start of the
period after the 1973 oil price shock and the Iran-Iraq war of 1982; there were notable
bank failures including Herstatt in 1974. Nevertheless, at that time the Basel Committee
never publicly launched consultative documents.
The second regulatory wave started with the publication of the consultative version for
‘Basel I’ (bcbs3a; December 1, 1987). Basel I has introduced the basic capital adequacy
ratio as the foundation for banking risk regulation. Initially it was a ratio of bank capital
to risk-weighted assets for credit risk only. Still the amendment to Basel I started to be
worked out mostly after the famous document of ‘Basel I’ itself was published on July
01, 1988 (bcbsc111). That amendment was to incorporate market risk, as well as to
adjust for deficiencies of Basel I framework (e. g. on country list to be assigned zero risk-
weighting). The work to incorporate latter issues took another 10 years, mostly as long
as it took Peter Cooke, at the time of Basel I Chairman of the Basel Committee, to agree
on the basic Basel I paradigm. Important to note that though Basel I was a fixed risk-
weighting approach for credit risk, market risk regulation already allowed for variable
risk-weighting (i. e. use of internal models). To remember during the second regulatory
wave the very first mention about operational risks occurred on July 01, 1989 (see
bcbsc136 paper on “Risks in Computer and Telecommunication Systems”). Though
3.1 1974 – 1986 – CONCORDAT
(FIRST REGULATORY WAVE)
3.2 1987 – 1998 – BASEL I
(SECOND REGULATORY
WAVE)

BANCO DE ESPAÑA 16 ESTABILIDAD FINANCIERA, NÚM. 28
operational risk management principles were published on September 01, 1998, it did
not receive quantitative treatment as was the case with credit and market risks when
amending Basel I.
Active work on polishing Basel I during the second regulatory wave passed within
significantly positive economic environment (to say during first regulatory wave S&P 500
grew by 200% from 83 in 1974 to 236 in 1986; whereas during the second regulatory wave
it skyrocketed to 1085 in 1998, i. e. by nearly 400%). During the second regulatory wave 8
consultative documents were already published by the Basel Committee, but no feedback
received was made publicly available. The stage is characterized by the publication of 57
documents in total with 1467 page-equivalent (i. e. 20 times larger volume) during second
regulatory wave.
The third regulatory wave started by the announcement on January 11, 1999 that the work
on new capital regulation, i. e. on ‘Basel II’, began. Basel II had several major differences
to amended Basel I document. It tailored to introduce internal models for credit risk
(internal ratings-based – IRB – approach); it added quantifiable risk charge for operational
risk. Basel II also introduced pillar-framework where Pillar I stood for minimum capital
requirements, Pillar II – a supervisory review of Pillar I results (Pillar II charge often exceeds
Pillar I because of incorporation of extra risks, but to a lesser extent as when started banks
were allowed to account for diversification benefits; 2007-09 crisis was a reason used by
regulators to cancel possibility to account for diversification benefits; still Pillar II is a totally
needed piece since the power of capital requirements determination shifted from regulators
to banks when IRB models were authorized),8 and Pillar III summarizing approach to
information disclosure. Given the consultation process and amendments the regulatory
wave lasted till the bottom of the world 2007-2009 crisis. Thus it encapsulated the need to
revise market risk models, inter alia by inclusion of stressed component to simple (normal,
non crisis state of economy) market risk measure.
The third regulatory wave was the most turbulent in terms of economic environment.
During 1999-2008 S&P500 fluctuated in the range of 1000-1500 responding to the negative
consequences of 1997 Asian crisis and 1998 Russia sovereign debt default, to 2001
dotcom bubble breach, 2007 CDO mortgage plummet. Still the Basel Committee published
155 documents, or 7168 pages, during its third regulatory wave that is 3 times more than
during its second one, though regulatory waves are comparable by time length (both
lasted 10 years).
Worth mentioning that it is exactly during the third regulatory wave that the Basel Committee
started to publish comments that it received on consultative documents (the very first
comments were published with respect to second consultative paper on Basel II, cp2,
January 16, 2001). Nevertheless, publishing comments was not a regular practice. For
example, out of 43 papers open for consultation by the Basel Committee during the third
regulatory wave comments are available only for 9 of them.
The fourth regulatory wave is devoted to ‘Basel III’ that was brought as a remedy and a
response to 2007-2009 crisis. It started on December 01, 2009 when Basel III first consultative
paper was published (bcbs164). Basel III brought several innovations to banking risk
regulation. First, it proposed quantification for liquidity risk. Second, capital was redefined;
extra capital buffers were introduced. Third, the unweighted capital ratio was introduced to
3.3 1999 – 2008 – BASEL II
(THIRD REGULATORY WAVE)
3.4 2009 – 2011 – BASEL III
(FOURTH REGULATORY
WAVE)
8 Author is grateful to anonymous reviewer for underlying and arguing for the importance of Pillar II.

BANCO DE ESPAÑA 17 ESTABILIDAD FINANCIERA, NÚM. 28
be monitored in parallel to risk-weighted one. Fourth, unified rules for remuneration of risk-
taking staff were proposed.
Being introduced at the times of economic recession the fourth regulatory wave was
accompanied by the market upturn and S&P 500 growth by 33% from 948 in 2009 to
1267 in 2011. Though short in timing (3 years) during the fourth regulatory wave 83
documents were published by the Basel Committee totaling to 3414 pages, this is mostly
half of document volume produced at the third stage, though it lasted 3 times less (3
years instead of 10).
During fourth regulatory wave publishing comments has become a rule for the Basel
Committee. Thus comments for only 2 out of 21 consultative papers were not made public,
including sound practices for back-testing counterparty credit risk models (bcbs171;
April 1, 2010) and core principles for effective deposit insurance systems (bcbs182;
November 1, 2011).
As Basel III is mostly finalized in terms of minimum requirements and implementation
deadlines (e. g. for liquidity risk regulation), recent years are marked by certain proposals
that are still not associated with Basel III and are significantly novel with respect to a latter
one. That is why it is argued that fifth regulatory wave has to be separated.
Formally fifth regulatory wave started from the publication of the consultative paper on
revision of the approaches to trading book definition and respective market risk
measurement (bcbs219; May 03, 2012). The regulatory wave is characterized by
significant changes in some other areas, including the following ones: introduction of
intraday liquidity management (bcbs225; July 2, 2012); revision of capital charge with
respect to securitizations (bcbs236; December 18, 2012); adding capital charge for
purchased credit protection, i. e. for CDS (bcbs245; March 22, 2013); revision of
approaches to managing credit concentration risk (bcbs246; March 26, 2013); revision
of information disclosure standards to most extent being the follow-up of Basel III
innovations (bcbs286; June 24, 2014); change of approach to operational risk
quantification (bcbs291; October 6, 2014).
The fifth regulatory wave also enjoyed the favourable economic environment with S&P
500 growing by another 50% from 1267 in 2011 to 1906 in 2014. The regulatory wave
was comparable to the preceding one in terms of documents volume published. The
Basel Committee published during 2012-2014 another 111 documents with 3852 pages
of total volume.
Fifth regulatory wave can be positively differentiated from all the previous four regulatory
waves as publishing comments has become a must, i. e. comments for all9 27 consultative
papers are available on the web.
If one wanted to get an insight in the current state of banking regulation and understand
what drove it to the current state, the following stylized facts are of need to obtain the first
quantitative representation of subject area. Below the subsections of Section 4 have the
names of the observed stylized facts.
3.5 2012 – 2014 – POST-BASEL III
(FIFTH REGULATORY WAVE)
4 Stylized Facts about
Banking Regulation
Published by Basel
Committee
9 As of the paper preparation moment it is impossible to conclude about 7 papers as they were only open for
consultation with comments receipt in 2015. Thus though total number of consultative papers during fifth regu-
latory wave equals to 34 with 7 being deducted from the total count for the purpose of comments calculation
(comments for those are not yet available).

BANCO DE ESPAÑA 18 ESTABILIDAD FINANCIERA, NÚM. 28
During 1974-2014 the Basel Committee has published 453 documents, including 109
consultative papers, 197 final documents, 43 QIS documents, 49 reports, 12 responses to
frequently asked questions, 26 working papers,10 17 newsletters. There was only one
paper in the history of the Basel Committee called ‘Discussion Paper’ (bcbs258; July 08,
2013) devoted to “The regulatory framework: balancing risk sensitivity, simplicity and
comparability”. Nevertheless, as there was a consultation period launched for that paper,
it was assigned to consultation paper category (for more details, please, refer to Table A.1).
As one may notice, only every second paper is made available for consultation on average
(number of final and consultative papers are 197 and 109, respectively).
Overall number of pages published by the Basel Committee in its 40 years exceeded 16 k.
This is smaller than the number of pages per CDO-squared investor as estimated by Andrew
Haldane [Haldane (2009), p. 21] where it equaled to 1.1 bn pages per CDO-squared investor.
Nevertheless, even 16 k pages are mostly impossible to be read by an average target user
(commercial banker or regulator). This implies regulation misinterpretation, its complexity,
inconsistency and gaps that would be pointed out in more detail below.
When reviewing the above mentioned regulatory waves of the banking regulation produced
by the Basel Committee, one would observe that the publication volume in pages follows
the trend of economic activity from the very general perspective. One may look at Chart 1
to observe the mentioned codependence of number of pages published by the Basel
Committee and S&P 500 value.
If one takes a look at the scatterplot at Chart 2 comparing the number of pages published
by the Basel Committee per annum and the annual change in S&P 500 one year later, one
may even argue for the positive dependence, though not statistically significant given low
number of annual observations (R-squared presented on a chart is a correlation coefficient
for two variables; R-squared for yearly data equals 9%). If one takes a look at quarterly
data, the situation is mostly unchanged with R-squared decreasing to 3%, being statistically
insignificant.
The observed from Chart 1 and Chart 2 (spurious) co-dependence might lead to a mistaken
take-away that Basel Committee regulation may cause economic crisis. The logic would be
the following. After the important document is published (e. g. Basel I, Basel II, Basel III), there
4.1 THE BASEL COMMITTEE
HAS PUBLISHED 453
DOCUMENTS IN ITS 40
YEARS
0
200
400
600
800
1,000
1,200
1,400
1,600
1,800
0
200
400
600
800
1,000
1,200
1,400
1,600
1,800
1975 1978 1981 1984 1987 1990 1993 1996 1999 2002 2005 2008 2011 2014
# pages S&P 500 (Right-hand scale)
BASEL COMMITTE PUBLICATIONS VS. THE INDICATOR OF ECONOMIC ACTIVITY (S&P 500) CHART 1
Num
ber
of p
ag
es
pub
lished
by
BC
BS
per
annum
S&
P 5
00
Ind
ex
Valu
e (avg
.)
SOURCES:
10 Formally the Basel Committee by end 2014 has published 27 working papers. Nevertheless, working paper
No. 11 on the Treatment of Asset Securitisations was classified as a consultative (not working) paper as the
deadline for comments was set as Dec. 20, 2002 and 22 comments were obtained.

BANCO DE ESPAÑA 19 ESTABILIDAD FINANCIERA, NÚM. 28
is a slowdown in regulation activity and economic agents might take extra risks that
accompanied with low volume of new regulation published would end in losses and in low
S&P 500 value. Alternative rationale can be found at Goodhart (2011a) when he explained
that opponents to Basel I tried to justify that 1992 crisis in the US was driven by Basel I as
it was exactly the implementation time frame of several years post-1988 that over-
constrained the lending through a new risk-weighted capital ratio. Similar artificial logic
may be applicable to Basel II as 2007 crisis started after final (comprehensive) version of
Basel II was published on June 30, 2006 (bcbs128).
Nevertheless, one has to consider three arguments supporting the evidence that Basel
Committee banking regulation cannot imply crisis.
First, as it was mentioned above, the dependence measure is not statistically significant.
If one wants to run a more robust statistical procedure (e. g. Granger causality test), the
finding would be that banking regulation follows the economic activity. This is a natural
conclusion as regulation innovations are conventionally agreed and adopted after particular
crisis or bank default had shed light on certain deficiencies.
Second, as for Basel I Professor Goodhart [Goodhart (2011a), p. 192] argues that it was
difficult when observing the decrease in lending to separate supply-side effects (driven by
new risk and capital regulation) from demand-side ones.11 Thus direct causality of Basel I
and forthcoming crisis is not justified.
Third, as for Basel II it is incorrect to blame it for leading to 2007-2009 crisis as US banks
(to be associated with the source of crisis) did not adopt Basel II, though recommended,
but not insisted by the Federal Reserve; and the Basel II itself had transitional
arrangements for next three years establishing capital floors of 80-90% of Basel I level
SOURCES:
y = 0.0802x + 16.821 R² = 0.0855
-300
-200
-100
0
100
200
300
400
0 200 400 600 800 1,000 1,200 1,400 1,600 1,800
SCATTERPLOT OF BASEL COMMITTEE PUBLICATIONS IN PAGES P. A. VERSUS THE CHANGE IN ECONOMIC ACTIVITY
CHART 2 C
ha
S
&P
50
0
x
h f
N of pa p h y C S
Y y Da a
11 “… was Basel I responsible for the credit crunch of 1991/92?
There was no explicit discussion in the BCBS about the question whether there might be macro-economic
consequential of the introduction of the Accord; at least none that I have found, beyond the (implicit) assump-
tion that bank holding of more capital (and especially so against riskier assets) would provide greater protection
against both individual and systemic failure, and thereby stabilize and improve macro-economic fundamentals.
A reconsideration of this comfortable view was called for by the course of the recession of 1991/92, especially
the recession in the United States… This occurred just at the end of the transition period, when all banks had
to ensure that their capital rose to, and above, the Accord [Basel I Capital Accord of 1988] requirements… If
they [US banks] could not increase the capital (numerator), the only way to enhance their capital ratios would
be to cut back on lending (the denominator). Thus some believed, and presented evidence, that there had been
a Basel-induced ‘credit crunch’ in the USA in 1991/92, thereby deepening the recession. The problem was that
the recession itself lowered the demand for borrowing, and it was extremely difficult to identify, and separate,
demand effects from additional supply effects (if any).” [Goodhart (2011a), pp. 191-192].

BANCO DE ESPAÑA 20 ESTABILIDAD FINANCIERA, NÚM. 28
that did not permit European banks to quickly take on much more risks after Basel II
publication in 2006.
As mentioned above, the Basel Committee has offered 109 papers for public consultation
during 1974-2014. When publishing a paper a consultation period is set by the Basel
Committee. It is set regularly from the third regulatory wave of Basel II. Before there is only
one paper for which it was possible to trace the length of consultation period. This was a
paper about supervision of financial conglomerates (bcbs34; February 1, 1998) of 131 pages
large with consultation ending on July 31, 1998.
As for the rest regular consultation processes one may try to review whether there is any
dependence of paper size in pages and the length of consultation period. For this reason
one should look at Chart 3. It shows that there is no statistically significant dependence
between the volume in pages of consultative document offered by the Basel Committee
and the consultation period.
On average the consultation period is 3 months, or 90.3 days, with minimum being 24 days
[paper devoted to capitalization of bank exposures to central counterparties (bcbs206;
November 1, 2011) with still 28 comments being obtained] and maximum 183 days [paper
named “Credit Risk Modelling: Current Practices and Applications” (bcbs49; April 1, 1999)
when the comments were not disclosed].
During its 40 years the Basel Committee has received and made publicly available 2290
comments on its 109 consultative papers. Though in fact those comments came only in
recent 13 years as the very first comments were published with respect to second
consultative version of Basel II (cp2; January 16, 2001).
Comments by itself range widely from a sentence sent from iPhone (e. g. see Prasad
Saurav comment to paper on internal audit, bcbs210; December 2, 2011) to a 150 pages
report (e. g. see Association of German Savings Banks consolidated comments to second
consultative paper on Basel II, cp2; January 16, 2001).
On average 22 comments are sent per consultative document with minimum of 4 comments
being sent to the document on revised good practices for supervisory colleges (bcbs276;
January 23, 2014) and maximum of 272 comments on Basel III papers on strengthening
resilience of banking sector and on international framework for liquidity risk measurement,
standards and monitoring (bcbs164, bcbs165; December 1, 2009).
4.2 AVERAGE CONSULTATION
PERIOD OFFERED BY
THE BASEL COMMITTEE
EQUALS TO 3 MONTHS
4.3 THE TOTAL NUMBER
OF COMMENTS RECEIVED
AND PUBLISHED BY THE
BASEL COMMITTEE
EQUALS 2290
SOURCES: BIS and author’s elaboration.
y = 0.24x + 80.13 R² = 0.07
0
20
40
60
80
100
120
140
160
180
200
0 50 100 150 200 250
DEPENDENCE BASEL COMMITTEE CONSULTATIVE DOCUMENTS AND RESPECTIVE CONSULTATION PERIOD
CHART 3 D
ays
offere
d fo
r co
nsu
ltatio
n
Number of pages in the consultative document
Scatter plot per consultative papers: pages vs. days for review

BANCO DE ESPAÑA 21 ESTABILIDAD FINANCIERA, NÚM. 28
Not all the comments are available in the original form. For four papers the Basel Committee
decided to present the consolidated overview of comments, just mentioning how many
comments were received. This is the case for the following papers:
— Supervisory guidance on the use of the fair value option by banks under
International Financial Reporting Standards (bcbs114; July 13, 2005), 20
comments;
— Home-host information sharing for effective Basel II implementation (bcbs120;
November 22, 2005), 11 comments;
— Sound credit risk assessment and valuation for loans (bcbs121; November
28, 2005), 15 comments;
— Core Principles for Effective Banking Supervision (bcbs123; April 6, 2006), 31
comments;
Not every comment sent and published is personalized. For example, there are three
papers that received four anonymous comments:
— Mortgage insurance: market structure, underwriting cycle and policy
implications – consultative document (joint30; February 11, 2013), 1 anonymous
comment;
— Strengthening the resilience of the banking sector, Basel III (bcbs165;
December 1, 2009), 2 anonymous comments;
— The internal audit function in banks (bcbs210; December 2, 2011), 1 anonymous
comment;
The total number of unique identifiable commenters who have sent 2209 comments to the
Basel Committee equals to 853. On average one person (institution) has sent historically
comments to three consultative papers. If one takes a look at TOP-50 commenters, than
one may conclude that TOP-50 commenters form only 6% of total number of commenters,
but they have sent 849 comments, i. e. 37% of total number of comments (for details of
TOP-50 commenters, please, refer to Table A.3).
The most active are the four commenters who have sent more12 than 30 comments,
i. e. they commented ca. every third paper. Those are banking associations from France
(41 comments), Canada (41 comments), Japan (40 comments), and Hong Kong (33
comments).
All the commenters can be assigned a type depending on their professional occupation or
affiliation. There are commercial banks, banking associations, other associations and
federations, professional advisors (audit, consulting, rating companies), some narrow focused
entities (payment systems, securitization, insurance), authorities and manufacturing.
4.4 THE TOTAL NUMBER
OF UNIQUE PEOPLE
(INSTITUTIONS) WHO HAVE
SENT THEIR COMMENTS
TO THE BASEL COMMITTEE
IS 853
4.5 THE OVERALL PROPORTION
OF PRIVATE SECTORS
COMMENTERS EQUALS
TO 12% OF TOTAL HAVING
SENT 7% OF ALL
COMMENTS13
12 The threshold was chosen subjectively where the difference between the number of comments sent is the lar-
gest, i. e. in between 4th and 5th commenters the difference is 5 comments, whereas between 5th and 6th only
one comment.
13 Author is grateful to the anonymous reviewer for proposing this interesting decomposition to compare lobbying
interests.
BANCO DE ESPAÑA 22 ESTABILIDAD FINANCIERA, NÚM. 28
Would like to particularly explain the existence two cohorts: authorities and manufacturing.
Authorities include central banks, ministries, other state bodies and World Bank and
International Monetary Fund as the latter two are financed by state governments.
Manufacturing includes companies that are either directly or closely involved in production
of cars (e. g. Daimler), planes (e. g. Lufthansa, Aviation working group), ships (e. g. Danish
Ship Finance), oil (e. g. Shell), other equipment (e. g. Siemens). To summarize the arguments
of manufacturing cohort were principally of two sorts: companies of interest either wanted
certain items to be recognized as collateral (e. g. planes), or opted for facilitation (i. e. lower
capital charge) for leasing activities (e. g. for cars, long-term projects). Those comments
were considered when specialized lending category was developed as a very differentiated
type of lending that inter alia included project finance (for long-term investments like oil
plant etc.) and object finance (for leasing of cars, ships, planes).
Table A.5 shows that commenters and comments mostly had banking background coming
either from banks or banking associations. Thus those resulted in 46% of total comments,
same time being only 25.6% of total number of commenters. Comments from academics
(that are expected to be more unbiased) and other individuals (sometimes people did not
explicitly put their affiliation when commenting) contributed only to 7% of total comments
being 12.2% of total number of commenters.
For the purpose of research each commenter was assigned a country of residence either
based on the location of headquarters14 or the country code of the contact phone number.
As a result 2209 comments came from 853 unique commenters originating from 83
countries of the world (please, refer to Map 1).
Those 83 countries represent 32% of total number of countries in the world, but constitute
94% of the world GDP. Though one may wish to conclude that most of economically active
world is aware of the changes in banking regulation and actively participates in shaping it
through sending its comments. However, this is not the fact as the top-countries (whose
people or institutions have sent more than 100 comments) are the United States (516
comments), the United Kingdom (317 comments), Germany (182 comments), Belgium
(152 comments), Japan (104 comments), and France (102 comments). Those six countries
contribute to only 42% of the world GDP having sent 63% of total comments. As one may
notice those were the countries originally being members of the Basel Committee since its
establishment in 1974.
If one wishes to test hypothesis whether it is the scale of economic activity or the level of
economic development that drives the frequency15 of comments sent, then Chart 4 and
4.6 REPRESENTATIVES
OF 83 COUNTRIES HAVE
SENT THEIR COMMENTS
TO THE BASEL COMMITTEE
14 For complicated cases the residence of the most easily identifiable commenter (if several) was used, e. g. there
were comments to second (cp2; January 16, 2001) and third (cp3; April 29, 2003) consultative papers on Basel
II from the Aviation working group. Aviation working group comment was signed by heads of Airbus and Boeing.
As Airbus production is located in several European countries, the residence of the joint comment was assigned
to the United States because of uniqueness of Boeing residence. As one may see the numbers in Table A.4 in
Annex, several complicated cases cannot change significantly the overall comments’ breakdown by countries.
15 One may justly argue that the number of comments as well as the number of pages in the comment and/or in the
document are peripheral to the quality of those comments and documents. Though the argument is correct, there
is no proxy to measure the correctness and/or the quality of the comments and the documents. The fact that
particular comment was not incorporated in the document does not mean it is useless. The comment might be
wrongly or unclear presented, it was not the time to understand and share the comment. Opposite is also true. If
the comment was incorporated, it does not mean it was definitely correct. It means that regulators and commen-
ter had the same vision and were able to understand each other, and moreover agree at a distance with each other.
That is why the number of comments and pages is a second best proxy to measure at high-level the domain of
banking regulation. Analysis of documents content (given limitations of the paper) would be given in Section 5.

BANCO DE ESPAÑA 23 ESTABILIDAD FINANCIERA, NÚM. 28
Chart 5 should be analyzed. Mentioned charts map number of comments against GDP and
GDP per capita as latter are conventional proxies for the level of economic development.
Limitation16 of such approach is that Basel Committee tailors its regulation for internationally
active banks and not for national economies as a whole. As a research extension one may
wish to correlate comments to number of internationally active banks in a region. In addition
to the absence of a formalized list of internationally active banks per country, one should be
16 Author thanks anonymous reviewer for drawing attention to the limitations of bank research when using GDP.
ILLUSTRATIVE MAP OF COUNTRIES ACTIVITY IN TERMS OF COMMENTS SENT TO BASEL COMMITTEE MAP 1
SOURCES: BIS and author’s elaboration.NOTE: The map is the representation of data available in Table A.6. The darker the green colour is, the more comments were sent from that country. Grey colour corresponds to the absence of comments originating from the region.
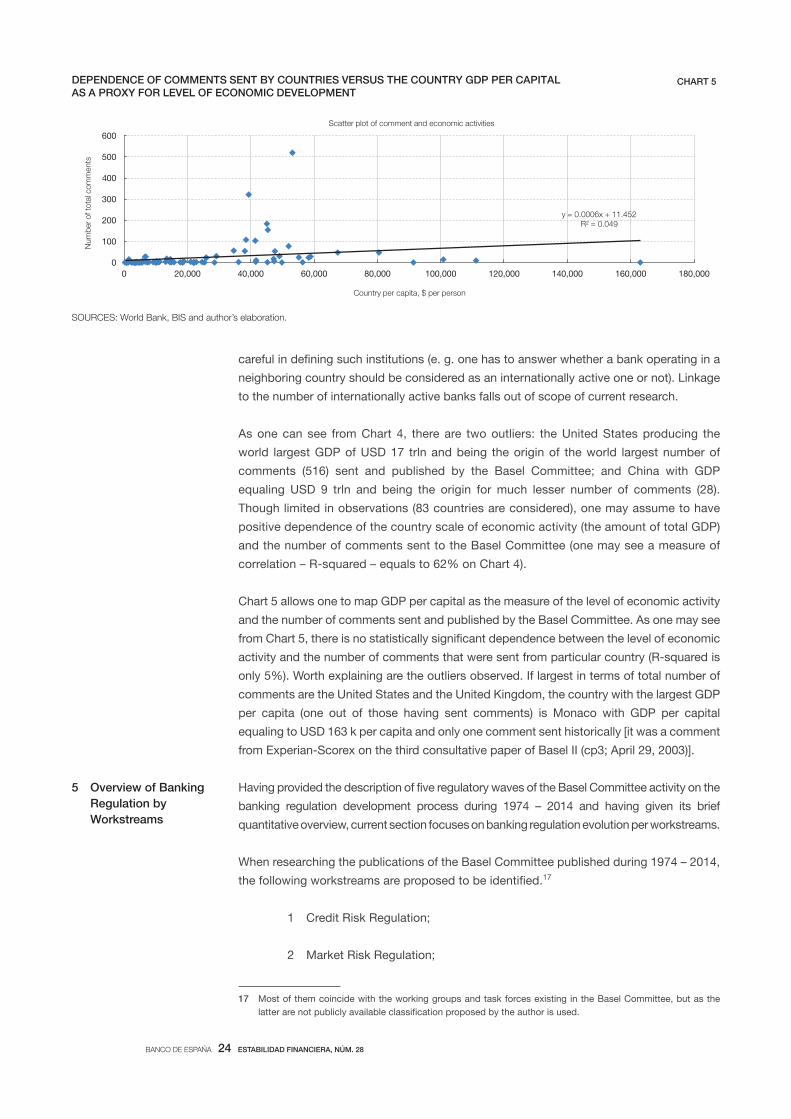
SOURCES: World Bank, BIS and author’s elaboration.
* One may point out that there is a methodological inconsistency as the comments were received by the Basel Committee (and published) since 2001 and the GDP (and GDP per capita) data is taken as of end-2013. From one side, the argument is theoretically correct. From another side, there are several counterarguments to
might be a research extension to observe the commenting activity with respect to change in country GDP year on year, but this falls out of the scope of the current research.
y = 3.10–11 x + 4.7456 R² = 0.6226
0
100
200
300
400
500
600
0 5,000 10,000 15,000 20,000
DEPENDENCE OF COMMENTS SENT BY COUNTRIES VERSUS THE COUNTRY GDP AS A BENCHMARK FOR SCALE OF THE ECONOMY
CHART 4
Num
ber
of to
tal c
om
ments
Country GDP, $ bn
Scatter plot of comment and economic activities
BANCO DE ESPAÑA 24 ESTABILIDAD FINANCIERA, NÚM. 28
careful in defining such institutions (e. g. one has to answer whether a bank operating in a
neighboring country should be considered as an internationally active one or not). Linkage
to the number of internationally active banks falls out of scope of current research.
As one can see from Chart 4, there are two outliers: the United States producing the
world largest GDP of USD 17 trln and being the origin of the world largest number of
comments (516) sent and published by the Basel Committee; and China with GDP
equaling USD 9 trln and being the origin for much lesser number of comments (28).
Though limited in observations (83 countries are considered), one may assume to have
positive dependence of the country scale of economic activity (the amount of total GDP)
and the number of comments sent to the Basel Committee (one may see a measure of
correlation – R-squared – equals to 62% on Chart 4).
Chart 5 allows one to map GDP per capital as the measure of the level of economic activity
and the number of comments sent and published by the Basel Committee. As one may see
from Chart 5, there is no statistically significant dependence between the level of economic
activity and the number of comments that were sent from particular country (R-squared is
only 5%). Worth explaining are the outliers observed. If largest in terms of total number of
comments are the United States and the United Kingdom, the country with the largest GDP
per capita (one out of those having sent comments) is Monaco with GDP per capital
equaling to USD 163 k per capita and only one comment sent historically [it was a comment
from Experian-Scorex on the third consultative paper of Basel II (cp3; April 29, 2003)].
Having provided the description of five regulatory waves of the Basel Committee activity on the
banking regulation development process during 1974 – 2014 and having given its brief
quantitative overview, current section focuses on banking regulation evolution per workstreams.
When researching the publications of the Basel Committee published during 1974 – 2014,
the following workstreams are proposed to be identified.17
1 Credit Risk Regulation;
2 Market Risk Regulation;
5 Overview of Banking
Regulation by
Workstreams
SOURCES: World Bank, BIS and author’s elaboration.
y = 0.0006x + 11.452 R² = 0.049
0
100
200
300
400
500
600
0 20,000 40,000 60,000 80,000 100,000 120,000 140,000 160,000 180,000
DEPENDENCE OF COMMENTS SENT BY COUNTRIES VERSUS THE COUNTRY GDP PER CAPITAL AS A PROXY FOR LEVEL OF ECONOMIC DEVELOPMENT
CHART 5 N
um
ber
of to
tal c
om
ments
Country per capita, $ per person
Scatter plot of comment and economic activities
17 Most of them coincide with the working groups and task forces existing in the Basel Committee, but as the
latter are not publicly available classification proposed by the author is used.

BANCO DE ESPAÑA 25 ESTABILIDAD FINANCIERA, NÚM. 28
3 Operational Risk Regulation;
4 Liquidity Risk Regulation;
5 Risk Aggregation and Capital Definition;
6 Corporate Governance Issues;
7 Recommendations for Supervisors;
8 Information Disclosure Issues;
9 Other Issues.
The subsections below are organized as follows. First, key facts about publications of
the respective workstream are presented (for details, please, see Table A.1). Second, the
workstream composition by topics is given. Third, key evolutionary stages that are
remarkable for the workstream from the perspective of the five regulatory waves mentioned
are discussed (for linkage of publications by workstreams and regulatory waves, please,
refer to Table A.2).
Credit risk regulation incorporates the largest number of publications (94) totaling to 2855
pages. Credit risk was more actively developed during third and fifth regulatory waves of
Basel II and post-Basel III. The workstream has the largest number of relevant newsletters
published (9 out of 17). The total number of publications includes 23 consultative, 41 final,
11 working papers and others. To underline the importance18 of the domain would mention
that it constitutes 21% of total number of documents and 18% of total pages published by
the Basel Committee.
The credit risk regulation workstream refers to banking book assets and covers such
issues as concentration risk regulation, securitization treatment, credit risk transfer,
accounting issues, measurement of counterparty credit risk, risk measurement for centrally
and non-centrally cleared derivatives, internal ratings based (IRB) models validation,
capital charge for equity exposures in the banking book, recommendation for IRB risk
components measurement (exposure at default, EAD; loss given default, LGD), treatment
of credit risk mitigation (CRM) techniques, alignment of expected loss measures and
provisions, particular cases of risk-weighting.
Basic credit risk regulation was first introduced when developing Basel I. Four classes of
assets were suggested with predefined risk-weights: sovereigns (0%), interbank lending
(20%), mortgage (50%), and others (100%). First shift to internal models was done after
Basel I was already in place, when the paper on credit risk modeling (bcbs49) was published
in April 1999. After that the idea of internal ratings-based (IRB) approach was dominating
the regulatory environment. The IRB approach include five risk components: probability of
default (PD), loss given default (LGD), exposure of default (EAD), maturity (M), sales volume
to distinguish small and medium-sized enterprises (SMEs) (S). The risk components use is
described in the explanatory note (irbriskweight; July 01, 2005). It is important to recall that
the IRB approach is based on the theoretical model of a mixture of normal distributions
5.1 CREDIT RISK REGULATION
18 The author acknowledges recommendation of the anonymous reviewer to explicitly evidence the importance of
the area by presenting share of contribution to total number of documents and pages.

BANCO DE ESPAÑA 26 ESTABILIDAD FINANCIERA, NÚM. 28
first introduced in Vasicek (1987), i. e. 12 years later after theoretical finding. The confidence
level for IRB models used is 99.9%.
The IRB approach is based on a single risk-factor model assuming that (a) there is one
systemic risk factor; (b) risk components (e. g. PD and LGD) are independent; (c) loan
portfolio is infinitely granular. As was shown later none of the assumptions does hold, e. g.
Gordy and Lütkebohmert19 [Gordy, Lütkebohmert (2013)] show portfolio finite granularity
needs adjustment to capital charge; Folpmers (2012) has the evidence of positive PD-LGD
correlation; adjustment to multi-risk factor is shown in Pukhtin (2004).
Nevertheless, it is proposed to use the regulatory IRB formula with above limitations kept
in mind. The formula itself may be decomposed in input parameters (PD, LGD, EAD, M, S)
and correlation (R) functions. Parameter S enables to adjust correlation function and to
decrease capital charge when lending to SMEs.
Basel III (bcbs164; December 01, 2009) prescribes introducing adjustment for systemically
important financial institutions (SIFIs) by using 1.25 multiplier in front of correlation function
implying capital overcharge when lending to SIFIs. It is important to explain the meaning of
the multiplier. It has to be used by banks that lend to SIFIs, not necessarily being SIFIs
themselves. SIFIs are separately required to have higher capital (for details see section 5.7).
The essence of the rule (multiplier of 1.25) is that those who lend to SIFIs should have
higher capital all else being equal, whereas the idea of the extra capital buffer for SIFIs is
that SIFIs themselves should have higher capital. From a balanced (closed) economic
system perspective one might doubt on the necessity of both requirements same time
as either the lender increases its capital assuming (taking) higher risks of SIFIs, or SIFIs
hold higher capital and have lower own default probability implying no need for its
creditors to overprovision capital, when lending to SIFIs.
IRB parameters are advised to be estimated along the whole economic cycle according to
Basel II. Nevertheless, the cycle definition is never introduced. There is a floor requiring
having the data window no less than 5 years for PDs, and 7 years for LGDs. However, when
reviewing Basel III pack (bcbs164; December 01, 2009), one may find a proposal to
introduce countercyclical capital buffer based on credit-to-GDP ratio.20 Thus for consistency
it is proposed to use the same proxy for economic cycle as in Basel III for the purpose
of Basel II IRB model development.
There is an important paper relating to IRB parameters, namely on the use of the
parameters, i. e. on Use Test (bcbs_nl9; January 9, 2006). It states that the risk components
should be the foundation of all decisions of the credit institutions, particularly, IRB
components must be used in pricing, provisioning, strategic planning and budgeting.
There are three papers that deal with validation of IRB parameters: studies on validation
(bcbs_wp14; May 01, 2004); update on validation (bcbs_nl4; January 01, 2005); validation of
low-default portfolios (LDP)21 (bcbs_nl6; January 9, 2005). It is recommended that quantitative
and qualitative criteria should be used to assess the risk component model performance.
19 For information Lütkebohmert provided comments to Basel III paper (bcbs165; December 1, 2009) together
with Ebert.
20 The proposed ratio is suboptimal as argued by Repullo and Saurina (2012). Repullo and Saurina justify GDP
growth rate to serve a more reliable proxy for economic cycle measurement.
21 For information how to estimate default probabilities (PD) for low default portfolios, please, see papers by Tasche
[Pluto, Tasche (2005)], [Tasche (2013)]. Worth mentioning that in 2001 Tasche provided his comments together
with C. Acerbi on behalf of Abaxbank to the second consultative paper on Basel II (cp2; January 16, 2001).

BANCO DE ESPAÑA 27 ESTABILIDAD FINANCIERA, NÚM. 28
It is also advised by the Basel Committee that bank runs validation regularly, at least
annually per model. The objective of the exercise is to keep model updated and arrive at
accurate risk component estimates.
One might observe that when risk component model is regularly validated, correlation
function resulting from Vasicek model stay unchanged. To be consistent and accurate in
capital charge estimation (not only is risk components – i. e. inputs – calculation), regulator
should validate and respectively update or revise the correlation functions, if underlying
parameters are shown to fluctuate substantially from year to year.
Risk concentration has a particular place in risk-management regulation and credit risk
management, particularly. The very first relevant paper was published in January 1991
devoted to measuring and controlling large exposures (c121; January 1, 1991). Risk
concentration principles (bcbs63; December 01, 1999) were developed only eight years
later. Nevertheless, final (comprehensive version of) Basel II paper (bcbs128; June 20,
2006) did not yet have explicit charge for concentration risk.
When managing concentration risk, there are two broad approaches: either the maximum
exposure is limited, or bank is penalized for extra concentration. As mentioned by professor
Goodhart [Goodhart (2011a), p. 391], former approach was historically chosen (in my
opinion, it was easier to monitor rather than the second one) as “an appropriate limit for a
single exposure would fall within the range 10-40% of total capital, with 25% being a
preferred central point [in 1990]”.
European Union regulation puts a cap for maximum exposure. If the exposure is
exceeded, the excess capital involved is deducted from current capital. Thus the excess
is allowed, but it needs to be funded with capital completely.22 In Post-Basel III regulatory
wave the former (limiting) approach to risk concentration was suggested for
implementation (bcbs283; April 15, 2014) where exposure is limited to 25% of capital
(CET1; please, see section 5.5 for details), except when lending to SIFIs (it is limited to
15% of CET1).
A number of newsletters that refer to credit risk regulation prescribe certain exception from
the general rule. Thus those referred to zero risk-weighting to be assigned for particular
assets as follow:
— International Finance Facility for Immunization (bcbs_nl10; January 10, 2006);
— Multilateral Investment Guarantee Agency (bcbs_nl15; January 5, 2010);
— European Stability Mechanism (bcbs_nl17; January 3, 2014);
— European Financial Stability Facility (bcbs_nl17; January 3, 2014);
In case the asset did not fall into trading book (e. g. proprietary position in equities), and it
went to banking book special treatment was applicable unless special IRB-models were
developed by financial institution for that asset class. General principle of Basel II (bcbs128;
June 30, 2006) when defining capital charge for equities in the banking book is to use
300% risk-weighting to listed equities and 400% – for non-listed ones. Post-Basel III
22 Author is grateful to anonymous reviewer for clarification on EU regulation.

BANCO DE ESPAÑA 28 ESTABILIDAD FINANCIERA, NÚM. 28
regulatory wave has registered a new document to revise approach for equity exposures
(bcbs266; December 13, 2013).
Particular attention was devoted by Basel Committee to credit risk transfer realized through
loan guarantees and securitization. Very first mention was in the early 1992 (bcbs10a;
September 01, 1992), then there was a ten year pause till 2001 and 2002 (wp10 and wp11;
October 01, 2001 and October 01, 2002, respectively) with a proposed revision in 2004
(bcbs105; January 01, 2004). After that the discussion continued in 2004-2008 under the
heading of credit risk transfer within Joint Forum (joint21; July 31, 2008). Because of
collateralized debt obligations- (CDO-) and asset-backed-commercial-paper- (ABCP-)
induced 2007-2009 crisis the importance of securitization treatment was revived within the
Basel Committee in 2012 with last consultative document published in 2014 (bcbs269;
December 19, 2013). 29 comments were submitted to the latter document.
Market risk regulation has 43 publications with total volume of 1 362 pages. Most number
of papers is broken down in-between consultative papers (16) and final (22). The area can
be assessed as being three times less than the credit risk one as the former contributes
only to 9% of total number of documents and 8% of total number of pages published by
the Basel Committee.
The workstream refers to trading book (i. e. all except banking book) and includes such
topics like treatment of netting, foreign exchange and interest rate risk measurement,
amendments to Basel accords (I, II, III).
From the very start of market risk measurement and regulation the banking industry was
able to justify the necessity to use internal models for regulatory purposes according to
Goodhart (2011a; p. 564). Internal model for market risk (exponential moving average) was
first introduced23 in 1989 by JPMorgan and was called RiskMetrics [RiskMetrics (1996)].
Thus internal models for market risk for regulatory purposes were adopted only 7 years
after its theoretical finding when amendment to Basel I to incorporate market risks was
published (bcbs24; January 1, 1996). As one remembers it took 12 years for Vasicek
model to be adopted as the internal model for credit risk for prudential purposes.
The Basel II prudential approach for market risk was as follows. Nowadays, the internal
model is the Value-at-Risk (VaR).24 VaR was multiplied by 3 (or 4 if back-testing produced
poor results) [bcbs119; November 01, 2005; par. (j) part B.4, p. 41]. The output value was
a capital charge for market risk. The shortcoming of the approach as viewed by BCBS
experts was that it did not capture tail risk or losses to take place in case of crisis.
This is why Basel 2.5 (bcbs134; October 01, 2007), (bcbs140 and 141; July 22, 2008)
(bcbs148 and 158; January 16 and July 01, 2009) targeted to account for the above
shortcoming. Stressed VaR was required to be added to the previously estimated market
risk charge [bcbs148; January 16, 2009; par. (j) part 4, p. 12]. Confidence level for internal
models was kept at 99%.
In the Post-Basel III regulatory wave when fundamental review of the trading book was
launched (bcbs219; May 3, 2012), it was proposed to change the risk measure from VaR
5.2 MARKET RISK REGULATION
23 RiskMetrics definition and brief history of its introduction is available at Wikipedia. URL: http://en.wikipedia.org/
wiki/RiskMetrics (accessed November 5, 2014).
24 VaR is the quantile of the portfolio return distribution given predefined confidence level and with no changes to
liquidity of the asset.

BANCO DE ESPAÑA 29 ESTABILIDAD FINANCIERA, NÚM. 28
to Expected Shortfall (ES).25 In the second consultative paper the confidence level was
proposed to be downgraded from 99% to 97.5% (bcbs265; October 31, 2013). As one
may trace from Adam et al. (2007) expected shortfall was known since 1999 when it was
introduced as a coherent risk measure in Artzner et al. (1999). As follows from Adam et al.
(2007) other risk-measures with nicer statistical properties are already known: distortion26
risk-measure (from 1997) and spectral27 risk measure (from 2002). Thus one may see that
the ES measure was taken on-board mostly 13 years later (similar to Vasicek model for
credit risk).
Fundamental review of the trading book (bcbs219; May 3, 2012) was to large extent
triggered by the Basel Committee’s concern that large international banks were easily
shifting assets from trading to banking books and vice versa to arbitrage and have capital
benefit. For the reason of equalizing capital charge for different risks and for comparable
transactions a revision of banking and trading books was launched to make banks
indifferent to choice of a book (trading or banking). Several criteria were offered to put a
watermark between the books [before book definition was predominantly based on
valuation principle: held-for-trading (HFT) assets were considered to be part of the trading
book; held-to-maturity (HTM) and available-for-sale (AFS) assets were assigned to
banking book]: either using the asset maturity (longer maturity asset must be banking
book; shorter – trading one), or valuation approach (mark-to-market has to be trading book;
mark-to-model – banking book).
Operational risk regulation is based on 25 publications (845 pages in total) of which 6 are
consultative papers and 11 are final. One can delineate specifically areas related to
operational risk management principles and operational loss data collection exercise. The
area is comparable in size (contribution) to marker risk one as it equals to 6% of total
number of documents and 5% of total pages published by the Basel Committee.
Though first mention about operational risks occurred during second regulatory wave of
the Basel Committee (bcbsc136; July 01, 1989), the operational risk management
principles were formulated only 10 years later (bcbs42; September 1, 1998). By that time
one of the largest modern notoriously famous operational risk events happened (Barings
bank fraud in 1994). Nevertheless, operational risk quantification was introduced only in
Basel II (bcbs118; November 1, 2005).
The Basel II (bcbs128; June 30, 2006) approach to operational risk quantification offers
four options for banks: basic indicator approach (BIA), simplified standardized approach
(SSA), standardized approaches (SA), advanced measurement approaches (AMA). SSA is
allowed for certain banks to estimate operational charge based on credit portfolio, not
using gross income value. The idea of two former approaches (BIA, SA) is to use gross
income as the benchmark for capital charge against operational risk. AMA enables a bank
to use statistical model to support capital charge estimation. Confidence level for AMA
models is 99.9%, similar to credit risk one (99.9%), but different to market risk one (99%).
5.3 OPERATIONAL RISK
REGULATION
25 ES, also referred to as tail conditional expectation, is the mean value of observations falling below VaR thres-
hold, i. e. by construction it is larger than VaR. ES requires sufficient number of observations to produce robust
risk estimate.
26 Distortion risk measure assigns unequal weights to positive and negative values of return distribution (traditio-
nally negative outcomes receive higher weights, than positive to reflect that negative ones are less preferred).
27 Spectral risk measure is integrated vertically (whereas VaR, ES, and distortion measures are integrated horizon-
tally). Thus spectral one enables to obtain reliable and robust risk estimates from theoretical perspective when
VaR, ES, distortion measures fail to accomplish it.

BANCO DE ESPAÑA 30 ESTABILIDAD FINANCIERA, NÚM. 28
Post-Basel III regulatory wave was signaled by the need to revise operational risk
regulation, disregarding extensive data survey that was launched in 2008 worldwide
against the mentioned approaches (nl13; January 7, 2008), (bcbs160; July 1, 2009). Thus
a special paper was issued (bcbs292; October 06, 2014). New approach suggests
exchanging basic indicator by business indicator (BI) being a more complicated derivative
of bank financials than the former was. Additionally the capital charge is proposed to be
explicitly linked to bank size. Basel II operational risk-weighting was derived as the ratio of
world industry total operational risk losses divided by industry-wide gross income. Post-
Basel III-related shift to business indicator is not clear as no special data collection was
neither announced, nor disclosed a posteriori. Thus similar shortcomings are applicable to
new operational risk benchmark as they were to basic indicator (conceptually, it was rough
risk-measure), but extra negative effect is produced from new regulation as previously
collected operational loss statistics becomes incomparable and mostly useless.
Liquidity risk regulation is the smallest workstream in terms of publications. It has overall
20 publications (563 pages) of which 6 are consultative, 10 final papers and 3 are responses
to frequently asked questions, 1 report. Liquidity risk domain is smaller in contribution that
operational risk one and contributes to only 4% and 3% of total number of documents and
pages published by the Basel Committee, respectively.
The workstream consists of liquidity management principles, including managing intraday
liquidity and Basel III induced liquidity ratios of liquidity coverage ratio (LCR) and net stable
funding ratio (NSFR).
Though as mentioned the workstream is the smallest in terms of publications, it is the oldest
one as liquidity risk was discussed at the very on-set of BCBS in 1972-1974 as decribed by
Goodhart (2011a; p. 81, Table 3.5, point 9). At that time finding common playing field for
liquidity risk regulation was very difficult. To support the argument presented would like to
refer to professor Goodhart [Goodhart (2011a), p. 321] who cites 1985 discussions when an
opinion was shared that “no single formula is likely to capture all the elements and no single
quantitative guideline will ensure adequate liquidity for a range of different banks”.
To present my personal opinion, though unsuccessful worldwide-wise, central bankers
participating in liquidity risk regulation discussions benefited from those. That is why it
became easier for them to adopt new Basel III ratios that were introduced as a response
to notoriously known collapse of Lehman Brothers on September 16, 2008 (reference28 to
Lehman is not an officially stated one by BCBS, but an implicitly understood one).
Thus the novelty of Basel III (bcbs165; December 01, 2009) is to introduce two indicators
that evaluate liquidity profile of a bank at a monthly and yearly horizons. The former is
called liquidity coverage ratio (LCR) and the latter one is net stable funding ratio (NSFR).
LCR is the ratio of the amount of highly liquid assets and outflows expected within next
month. The LCR regulatory minimum was originally set at 100%, but after the first impact
study the transitory (temporary) threshold was downward adjusted to 60%. BCBS
proposed to calculate LCR in each currency, i. e. to meet the threshold when comparing
assets and outflows in the same currency.
5.4 LIQUIDITY RISK
REGULATION
28 Author acknowledges anonymous reviewer for underlying the need to check whether BCBS officially wrote in
its documents about Lehman case.

BANCO DE ESPAÑA 31 ESTABILIDAD FINANCIERA, NÚM. 28
NSFR is the ratio of liquid assets maturing in a year and expected outflow past one year.
The mandatory threshold was also set to 100%, i. e. a bank has to be able to offset its
long-term outflows. When developing NSFR a link between credit and liquidity risks was
introduced. There was a requirement that special discounting coefficients are assigned to
assets having high creditworthiness ratings from Internal rating models (IRB) of Basel II.
Perhaps, because of overcomplicated approach to NSFR calculation or unfavourable
impact study results, as of now NSFR was decided to be delayed in implementation (future
date of introduction is still to be announced).
Post-Basel III regulatory wave had a document in its set devoted to intraday liquidity
management (bcbs225; July 02, 2012). The idea is to have a set of indicators measuring
average payment settlement time, number of payments per hours etc. Though ideally
necessary tool, it occurred to be difficult to be implemented in software systems. That is
why in the final paper (bcbs248; April 11, 2013) requirements were relaxed and formulated
more as recommendations.
Stress-testing is an important risk-management tool, but it is separately mentioned in the
subsection 5.5. Therefore, recommendation on liquidity stress-testing are mentioned there
as part of Basel I Pillar II requirements.
Though not being the Basel Committee publication a paper [Grant (2011)] on liquidity
transfer pricing published by Financial Stability Institute of the BIS is recommended when
in need to get full picture of liquidity risk management and respective use test.
Risk aggregation and capital definition workstream has the objective of aggregation of all
the risks and estimating economic capital. As by concept of Basel accords, they were
tailored to capture all (known and quantifiable) risks of the credit institution – i. e. to capture
aggregate (gross) risk – the accord documents are included in the workstream.
The workstream has 97 publications totaling to 4 249 pages. It includes 13 consultative
papers, 22 final documents, 14 reports (majority is on the progress of Basel III
implementation), 5 working papers, 4 newsletters, 3 responses to frequently asked
questions and 36 QIS documents. In terms of contribution to total number of documents
the area is similar to credit risk one and equals to 21%, but in terms on number of pages
it exceeds the latter and equals to 26% of total published by the Basel Committee.
The workstream has the following clearly defined topics: approaches to risk aggregation,
stress-testing, capital definition (and redefinition according to Basel III), monitoring progress
of Basel III and regulatory framework implementation; Basel I, II, III documents.
The very first paper on risk aggregation dealt with balance sheets consolidation (bcbs00b;
October 01, 1978). Though important, risk aggregation issue was raised again only 23
and 25 years later when two documents were published. Those were, respectively, papers
on risk management practices and regulatory capital (joint4; November 1, 2001) and
trends in risk integration and aggregation (joint7; August 1, 2003). Both documents relate
to Joint Forum and have a broader scope of application by definition, i. e. financial
conglomerates, not limited to credit institutions. Those were mostly principles-style
papers. Attention should be drawn to the updated paper (joint25; October 21, 2010) that
discuss five approaches to risk aggregation mentioned in the order of increasing accuracy,
complexity and preference from both banks’ and regulators’ perspective: summation;
5.5 RISK AGGREGATION
AND CAPITAL DEFINITION

BANCO DE ESPAÑA 32 ESTABILIDAD FINANCIERA, NÚM. 28
simple diversification; variance-covariance approach; copula29 models; full simulation
(Monte-Carlo based) models.
Another side of risk aggregation (or economic capital) as formulated in Basel II Pillar II is the
stress-testing procedure. Whereas stress-testing is also required to be done under Pillar I
for all marginal risks (i. e. separately for credit, market, and operational risks), under Pillar II
stress-testing should encompass all risks. If for Pillar I purpose stress-testing is more a
sensitivity analysis, for Pillar II purpose it is a scenario analysis or a probabilistic model
evaluation. Though introduced in Basel II (bcbs118; November 1, 2005), stress-testing
principles and sound practices were combined and presented jointly in a special paper
(bcbs147; January 9, 2009). In addition to Basel II the mentioned document recommends
running reverse stress-testing, i.e. based on statistical model a financial institution has to
identify the thresholds for macroeconomic indicators which being breached imply failure,
default or insolvency of the institution itself. Special recommendations were given with
respect to liquidity stress-testing (bcbs_wp24 and bcbs_wp25; January 10, 2013) as those
should also be incorporated in Basel III liquidity ratios of LCR and NSFR.
Capital is also viewed as a part of this workstream. Basel I (bcbs4a; July 01, 1988)
introduced two tier capital structure. Tier 1 included paid-in capital, retained earnings, and
hybrid instruments, tier 2 consisted of long-term subordinated debt to be amortized
equally during last 5 years. Basel I introduced the basic capital adequacy ratio, CAR
(sometimes referred to Cooke ratio by the name at that time Chairman of the Basel
Committee). CAR was the ratio of capital to risk-weighted assets (RWA) for credit risk only
initially. It was 4% for tier 1 capital and 8% for total capital (tier 1 and 2). Professor Goodhart
found important agenda originally formulated by Peter Cooke who challenged whether
prudential (particularly capital) ratios should be minimum, target or standard. Though
simple in supervision, minimum should have been the least preferred option, in Peter
Cooke’s opinion, as inter alia in crisis minimum “does not provide an appropriate buffering
function for banks themselves” [Goodhart (2011a), p. 556].
Basel II (bcbs128; June 30, 2006) added Tier 3 capital for short-term subordinated debt
– though as discussed at Goodhart (2011a; p. 489) for a long time during Basel I discussion
and implementation regulatory community was not ready to accept it as part of capital from
conservative viewpoint –. Basel II introduced the modified CAR ratio (sometimes referred to
McDonough ratio as William McDonough was the Basel Committee Chairman at that time)
where the denominator included RWA for credit, market, and operational risks.
Basel III responding to 2007-2009 crisis (bcbs165; December 1, 2009) proposed following
adjustment to capital definition. First, core equity tier 1 (CET1) capital was introduced
consisting of paid-in capital, retained earnings, but no hybrid instruments included. The
CAR minimum for CET1 capital was set 4.5% and for tier 1 – 6.0%. Second, subordinated
debt from then must be more loss-absorbing, i. e. incorporate the requirement to write-
down debt or exchange it to equity in case of certain triggers are breached; existing
subordinated debt instruments should be amortized in 10 years. Third, tier 3 capital was
deleted from capital adequacy calculation. Fourth, three capital buffers were introduced to
capture the systemically important nature of banking business, 1-3.5%; the stage of
economic cycle, 0-2.5% (to dampen the procyclicality effect of Basel II); the need for
29 Discussion on the use of copulas may be found in the sequence of papers by professor Paul Embrechts:
Embrechts, McNeil, Straumann (1999), Breymann, Dias, Embrechts (2003), McNeil, Frey, Embrechts (2005). To
mention P. Embrechts together with Furrer and Kaufmann provided their comments to third consultative paper
on Basel II (cp3; April 29, 2003).

BANCO DE ESPAÑA 33 ESTABILIDAD FINANCIERA, NÚM. 28
capital conservation, 2.5% (instead of dividend pay-off in any case). All capital buffers are
expressed in percent of CET1 capital.
When speaking about capital used for capital adequacy ratio, one has to keep in mind the
deductions undertaken. According to Basel II (bcbs128; June 30, 2006) investments in
associated companies are deducted if they exceed 15% of the invested entity capital or
the sum of such investments exceed 60% of the invested entity capital (deduction is done
for the part that exceeds the threshold). Basel III (bcbs164; December 01, 2009) has added
another criterion for deduction. Material investment definition was introduced relating to
ownership of more than 10% of the investee entity. In case the investment is considered
material it is required to be fully deducted from the capital of the invested entity. The non-
deducted part is subject to banking book (equity exposure in banking book) or trading
book treatment.
Corporate governance workstream has 31 documents (979 pages) of which there are only
consultative (10) and final (21) ones. The domain’s contribution is somewhat in-between
that of market and operational risks as it is 7% and 6% of total number of documents and
pages published by the Basel Committee, respectively.
The workstream includes corporate governance principles, remuneration regulation,
recommendations for internal audit and interaction with external auditors, internal control
and compliance, business continuity principles.
Corporate governance principles were officially introduced in 1999 (bcbs56; September
01, 1999). Then the revision took place every four years in 2005-2006 (bcbs117, 122), in
2010 (bcbs168, 176) and in 2014 (bcbs294; October 10, 2014).
The major innovation in the area of corporate governance brought by Basel III in its 2010
document (bcbs176; October 01, 2010) is explicit delineation of “three lines of defense”
within the financial institution. Each line should assess risks and monitor them, as well as
control and supervise the risks taken by preceding line of defense. As postulated by the
document, first line of defense should consist of front-office managers dealing with clients.
Second line of defense should include those who develop and control limits including risk-
management and middle-office. Third line of defense is responsible for checking the
efficiency of controls and processes established by first two lines. Internal audit should be
third line of defense (bcbs223; June 28, 2012).
In fact there are two other lines of defense that exist, not mentioned in the Basel Committee
documents. Fourth line of defense is the shareholders (and creditors of loss-absorbing
subordinated debt) of the bank. Fifth line of defense is the central bank and deposit
insurance agency. The underlying logic is that shareholders would have to take on losses
if happen (central bankers want to avoid ‘too big to fail’ cases having consumed significant
taxpayers funds in 2007-2009). When shareholders fail to rule out the situation, and all
recovery measures are inefficient, the deposit insurance agency in agreement with the
central bank has to start resolution process. Thus the system might be naturally called as
“five lines of defense”.
Special focus in the post-2007-2009-crisis time was devoted to remuneration regulation,
namely, large amounts paid to bank executives. Particular concern was attached to cases
when bonus payments were not related to high performance of a bank. Royal Bank of
Scotland (RBS) is one of the example that triggered discussion in mass media. In 2008 and
5.6 CORPORATE GOVERNANCE
ISSUES
BANCO DE ESPAÑA 34 ESTABILIDAD FINANCIERA, NÚM. 28
2013 RBS has ended the financial year with loss, but still allocated and paid significant
bonuses to its managers.30
Cases similar to RBS led to the need to unify remuneration principles and practices in order
to align risk taken (and risk realized) with amounts allocated for management remuneration.
Such principles prescribe first to measure bonuses in all its forms (cash and non-cash,
including commodities etc.) and second to manage variable part (link it to risk indicators),
and third to introduce deferral for no less than 3 years for the variable part of remuneration
(for bank to be able to cancel the deferred variable bonus at all or in part in case risks
relating to that bonus take place during next three years after bonus was accrued).
Theoretically the principle is nice and proper and was used by the majority of investment
banks even before 2007-2009 crisis (in the form close to the one formulated by regulators).
Nevertheless, particular attention should be given to risk-perception of the regulated bank
manager. The constraint on the variable part and its deferral may be an incentive for a risk-
averse person (e. g. a risk-manager). On the contrary, for front-office staff (client relationship
manager) being risk-lovers deferral is similar to a bet (gamble). He or she as a risk-lover
would prefer to gamble and play (take on more risk), when he or she is subject to regulation
in general (and to deferral in particular). He or she would take more risks than envisaged
by regulator (inter alia he or she would target to offset decrease in income because of
deferral by taking even higher risk). That is why closer cooperation of the Basel Committee
and regulators with the academic community is suggested to make proper simulation
models and to calibrate the remuneration rules to obtain the desired effect of decreased
risk-taking with consideration to differentiated risk-perception of bank staff.
Workstream devoted to supervisors is as large as the one focused on Basel accords. It
incorporates 82 documents (3 495 pages) of which 18 are consultative, 41 are final papers;
there are 17 reports and 6 working papers. This is one of three core areas in a row with
credit risk and capital aggregation as it contributes to 18% of total number of documents
and 22% of total number of pages published by the Basel Committee.
The recommendations for supervisors cover such areas as core principles of banking
supervision and deposit insurance, dealing with highly leveraged financial institutions, recovery
and resolution planning, launching and monitoring regulatory consistency assessment program
(RCAP), dealing with financial conglomerates and systemically important financial institutions
(including financial stability – FS – issues), arranging supervisory colleges.
Concordat (bcbs00a; September 01, 1975) was the very first published document of the
Basel Committee and it refers to interaction of supervisors when in need to run cross-border
resolution. Wanted to draw reader attention to the set of papers devoted to highly-leveraged
institutions regulations first published in 1999 (bcbs45) with the final document being made
public in 2001 (bcbs79; March 22, 2003). Those discussions coupled with the pre-Basel I
experience of certain countries31 having risk-free capital measure enabled easier approval
and implementation of leverage ratio in Basel III (bcbs164; December 1, 2009) where leverage
ratio is a relationship of capital (CET1) to the sum of the on- and off-balance sheet assets.
5.7 RECOMMENDATIONS
FOR SUPERVISORS
30 GBP 1 bn was paid by RBS as bonuses out of GBP 20 bn state support by results of 2008 (URL: http://www.
dailymail.co.uk/news/article-1138823/Troubled-RBS-wants-pay-staff-1bn-bonus-taxpayers-20bn-bail-out.
html#ixzz2rDJeazVk). Disregarding the loss of GBP 8.2 bn, RBS paid out GBP 0.6 bn as bonuses by results of
2013 (URL: http://www.economist.com/news/world-week/21597975-business-week?frsc=dg%7Ca) (accessed
November 05, 2014).
31 According to Goodhart (2011a) those were Japan, Luxembourg, and Switzerland as they measured capital
against their liabilities (that can be transformed to capital versus assets ratio).

BANCO DE ESPAÑA 35 ESTABILIDAD FINANCIERA, NÚM. 28
A dominant and permanent topic for the Basel Committee work is the core principles for
banking supervision. Those were first released in September 1997 (bcbs30a). The most
recent revised document dates back to September 14, 2012 (bcbs230), i. e. the discussion is
publicly available for 15 years. In November 2010 another document of similar nature was
offered for publication. Those were core principles for effective deposit insurance systems
(bcbs182; November 1, 2010). The comments were not made public, perhaps there were
none as the consultation period was shorter than average (only 37 days for 40 page document).
The Basel Committee as per Goodhart (2011a; p. 552) never positioned itself as a standard
setter in its early years of 1974-1997. Professor Goodhart complained that it was exactly
the shortcoming that the Basel Committee was issuing recommendations with no penalties
for disobeying them. 2007-2009 crisis changed that approach. During Basel III regulatory
wave a major program was launched: regulatory consistency assessment program (RCAP)
on April 3, 2012 (bcbs216). As mentioned in Goodhart (2011a; p. 439) in the early years of
1974-1997 the prerogative for consistency assessments was owned by the International
Monetary Fund (IMF), but the launch of the RCAP in 2012 puts clear duties segregation and
makes the Basel Committee a more standards setting and controlling body.
The objective of the RCAP program is to evaluate that no arbitrage is available in-between
risks and within risks. There are already three interesting reports available with respect to
credit risk (bcbs256; July 5, 2013) and market risk (bcbs240 and 267; January 31, 2013
and December 17, 2013, respectively). Let us first focus on credit risk survey discussion and
then proceed with market risk one afterwards.
Credit risk survey suggested banks to use hypothetical borrowers to assess risk-weights
for them. As was found, the discrepancies by banks equaled to +/– 20% in relevant terms,
being much more significant than expected by the Basel Committee. Though it would be
ideal to have same risk assessment per each borrower, one has to confess that by
construction of Basel II internal model should provide common assessment of risk not per
borrower (in corporate area) or per facility (in retail one), but per borrower/facility for a
given bank. Let us elaborate more to justify the statement.
Basel II (bcbs128; June 30, 2006) asks to use internal loss data of a bank for IRB credit risk
models (external data is allowed for use if and only if the representativity of external data
against bank portfolio is demonstrated). To be fair to banks (and when assuming for a
moment that none of them is seeking for risk (RWA) arbitrage)32 RCAP credit risks survey
results should have been expected. Please, consider an example that two different banks
A and B have different workout recovery approaches in general (or A bank’s shareholders
have tighter relations to some borrower C, in particular). Suppose this borrower C borrows
same amount from both banks A and B, but on due date it pays back only to bank A (either
because of closer relations to bank A or because of more stringent workout policy of bank A).
Then in order to prepare modeling dataset bank A would register borrower C as a non-
defaulted client; bank B inversely would register borrower C as a defaulted one.
Respectively, when having numerous cases of such differentiated behavior same features
of the borrower (e. g. ownership structure, financial ratios etc.) would be statistically
significant default determinants for banks of B type; and non-significant for banks of A
type. Thus the very requirement of Basel II implies the possibility of unequal credit risk
assessment for the same borrower.
32 Author is grateful to anonymous referee for advising to discuss whether the observed discrepancies in risk-
weights are solely attributed to banks risk-arbitrage or may have other reasons.

BANCO DE ESPAÑA 36 ESTABILIDAD FINANCIERA, NÚM. 28
If credit risk models are based on internal statistics, market risk models are built on publicly
available market data. That is why opposite to credit risk survey results (where deviation in
risk-weights could be expected), market risk survey should have evidenced similar (close) risk
estimates between the banks. However, market risk survey resulted in similar conclusions
as the credit risk one, i. e. banks internal models produce significantly different risk and
capital charge estimates for the same hypothetical cases. To add there was another survey
launched by the Basel Committee, but not under RCAP. It was done for the purposes of
the fundamental review of the trading book being named “Analysis of the trading book
hypothetical portfolio exercise” (bcbs288; September 09, 2014). There is an important
persistent trend for the market risk models sanity check performed by regulatory bodies.
As mentioned in Goodhart (2011a; pp. 251, 280), the same significant discrepancies
(+/–25%) were already observed in 1994 on the eve of the internal market risk models
approval (nevertheless, the observed discrepancies did not prevent regulators from taking
on board those models).
Basel III regulatory wave was marked by a response to 2007-2009 crisis and one of the
problems of ‘too big to fail banks’. For the purpose of making banks self-sustainable before
central bank capital injection is needed a category of systemically important financial
institutions (SIFIs) was introduced for global (bcbs201; July 19, 2011) and domestic (bcbs233;
October 11, 2012) entities. The concept is to use indicator approach to nominate banks as
SIFIs and to impose capital surcharge on them ranging from 1% to 2.5% (theoretically to
3.5%) of CET1 capital. To be consistent it is recommended to revise the approach and
introduce special threshold levels for SIFIs not limited to capital, but also to liquidity (as
the latter was also observed to be one of causes for bank failures in 2007-2009).
Information disclosure area has 34 documents (1089 pages). Those include 9 consultative,
12 final papers, 11 reports, and 2 working papers. The area is similar in contribution to
market risk one and has 8% and 7% contribution to total number of documents and pages
published by the Basel Committee.
The workstream consists of three general areas: the initial discussion about the information
disclosure for trading and derivatives, incorporation of changes to Basel II Pillar III
standards on disclosure changes resulting from Basel III, and other.
Pillar III activity started from resolving the need to add transparency to trading operations.
The idea to standardize risk disclosure was first born in June 1979 [Goodhart (2011a), p. 471]
when Mr. Cummings wanted to obtain the Basel Committee support on draft document
named “Disclosures in financial statements in banks”. But at that time Basle Committee
was not eager to support the proposal.
On May 1, 1995 the first formalized framework (bcbs19) was published by the Basel
Committee. Overall there were 9 publications till December 1, 1999 devoted to derivative
disclosure. After that it was generalized to currently known form of Basel II Pillar III. The
development of Pillar III and derivative-disclosure-related activity was similar to liquidity
risk regulation evolution from my point of view.33
From one side, presenting information to public (and the bank’s competitors inter alia) may
distort bank’s competitive advantages in general (though it is difficult to extract something
5.8 INFORMATION DISCLOSURE
ISSUES
33 Author is grateful to anonymous reviewer for proposing to discuss what pros and cons were there when working
of information disclosure standards for derivatives, what its outcome was and potentially why.

BANCO DE ESPAÑA 37 ESTABILIDAD FINANCIERA, NÚM. 28
more than trends when only high-level non-transactional data is available). The most
constraint when trying to reach worldwide consensus on information disclosure is that the
discussion gets about a level of certain institutions, it gets to a level of national banking
systems. In my view, the inter-economy competition was the one that produced key
obstacle to information (and derivatives particularly) disclosure standards unification
before year of 2000.
From another side, information disclosure in general is a useful tool making banking
performance more transparent. To add that the degree of usefulness positively depend
with the state of unification of presented data. Of course, it is better to know more about
a bank and its risks taken, than not to know. But to compare this particular bank to
industry-averages and to assess whether a bank is over-prudent or over-risk-taking, one
has to obtain information easy to be processed by analysts or researchers.
Thus information disclosure activity at its start challenged Basel Committee-member
economies, but was able to benefit central bankers, creditors, investors and other
stakeholders. Obviously it turned out difficult to agree on the issue by balancing all pros and
cons. That is why like with liquidity risk discussion individual central banks gathered useful
information and having enough regulatory power upgraded home information disclosure
standards, including those on derivatives. As a result one may bring an example of the
United States of America and Canada that have unified derivative disclosure standards that
allow to run deep research – for details, please, refer to Ashraf, Goddard, Altunbas (2005)
and Dai, Lapointe (2010), respectively –. On opposite, to undertake similar exercise for the
European Union (EU) enormous manual work has to be done – for the unique research on
EU banks use of derivatives, please, refer to Gomayun, Penikas, Titova (2012) –.
Officially Basel II Pillar III was proposed on January 01, 2000 (bcbs65). After that it had two
principal modifications. One took place during the Basel III regulatory wave; another –
during Post-Basel III regulatory wave. Basel III (bcbs164, 165; December 01, 2009) has
introduced new terms and concepts including capital definition, leverage ratios, liquidity
ratios, remuneration rules. Those had to be reflected in the information disclosure
standards. For this reason Pillar III revision consultative document was published (bcbs286;
June 24, 2014). The document is a first stage review covering issues related to credit,
market, counterparty credit risks. Other risks and issues would be reflected in the second
stage of consultation.
Another challenge for Pillar III workstream also came in Post-Basel III regulatory wave.
That was the need to review approaches to effective risk data aggregation and risk
reporting (bcbs222; June 26, 2012). The paper focused on information systems readiness
to provide correct and up-to-date information. There were few (9) comments sent on the
paper. A progress report on the principles implementation was published on December 18,
2013 (bcbs268). It is notable that the paper was published 35 years after the concern was
first raised within the Basel Committee. According to [Goodhart (2011a), p. 132] “[in 1977]
Bonnardin stated that the question of any possible surveillance or limits (which he
suggested was ‘premature’) must be preceded by the establishment of common principles
for recording data”.
Other issues are those that seem to be peripheral to the Basel Committee activity upon
author’s opinion and thus include papers that cannot be attributable to any of the above
mentioned workstreams. The residual topics contribute to 6% and 5% of total number of
documents and pages published by the Basel Committee.
5.9 OTHER ISSUES

BANCO DE ESPAÑA 38 ESTABILIDAD FINANCIERA, NÚM. 28
There are 27 such documents (793 pages) of which 8 are consultative and 17 are final papers.
Topics covered capture electronic banking and associated risks, anti-money laundering
(AML) and know your client (KYC) principles, mortgage insurance and longevity risk discussion,
potential problem of passing through the millennium age (year 2000 problem).
Risk-management for electronic banking services preoccupied the Basel Committee since
March 1998 (bcbs35) till July 2003 (bcbs99). Though three out of 6 papers were consultative,
responses received (if any) were not disclosed to public.
Anti-money laundering subject accompanied the Basel Committee activity from the very
Basel I publication with three distinct stages: (a) debut paper was published in December
1988 (bcbsc137); (b) after a pause of 13 years the discussion was revived with the second
paper published in January 2001 (bcbs77) and ending by the Joint Forum publication in
April 2008 (joint20); (c) third stage started in the Post-Basel III regulatory wave with the
publication of the consultative document on sound practices for managing risks related to
anti-money laundering in June 2013 (bcbs252) with its final version made public on January
15, 2014 (bcbs275).
Another two issues were quiet recent and were raised within the Joint Forum: mortgage
insurance and longevity risk. If the former is a response to 2007-2009 crisis (though published
only in 2013, joint 30 and joint 33), the latter is more universal recommending supervisors
and banks how to consider risks related to ageing population and being published in 2013 also
(joint 31 and joint 34).
The Basel Committee was concerned about the potential problems arising from shifting
the millennium date of 01.01.2000 for four years having issued respectively 4 papers since
1997 (bcbs31) till 1999 (bcbs59). The papers were prepared for supervisors for them to
insure that banks smoothly transition the unique date of millennium.
The Basel Committee on Banking Supervision was established in 1974. However, by now
there was only one research of relevance that dealt with the economic history of the Basel
Committee. That was the book by Professor Goodhart [Goodhart (2011a)], but it focused
on the early history of the committee of 1974-1997 (covering Concordat and Basel I times).
Current research is a natural extension of the work started by Professor Goodhart as it
covers the whole historical period of the last 40 years. Professor Goodhart based his
research on the Basel Committee archival material as for Concordat and Basel I periods
the Basel Committee did tend to publish neither consultative34 papers, nor comments
received on those consultative papers. Current research is based on richer material of
consultative papers and comments published by the Basel Committee on the web that
enable to trace the logic of banking regulation evolution for the whole period of 1974-2014.
Since its establishment in 1974 and till 2014 the Basel Committee has developed 453
documents of 16 k pages in volume serving as the basis for the world unified standards of
risk management and risk supervision for financial (and notably credit) institutions.
Research justified five regulatory waves of banking regulation development by the Basel
Committee: Concordat (1974-1986), Basel I (1987-1998), Basel II (1999-2008), Basel III
(2009-2011), and Post-Basel III (2012-2014).
6 Concluding Remarks
34 There were no consultative papers at all before 1987; after 1987 consultative papers were published if related
to credit and market risks, financial conglomerates supervision, electronic banking and core principles of
banking supervision (for other topics consultative papers were not made public).

BANCO DE ESPAÑA 39 ESTABILIDAD FINANCIERA, NÚM. 28
A list of stylized facts describing the banking regulation development by the Basel
Committee was formulated. To summarize those 109 out of total 453 documents published
by the Basel Committee are consultative papers for which 2290 comments from 853
unique individuals (entities) from 83 countries were received.
Further research was held by workstreams accommodating for the various activities of the
Basel Committee: credit, market, operational, liquidity risk regulation; risk aggregation and
capital definition, corporate governance, recommendations for supervisors, information
disclosure and other issues.
The conducted research is of value as it enabled to trace linkages in-between the documents
that were not and are not still officially linked, though should be (e. g. economic cycle definition
for Basel II IRB models should be taken from Basel III paper). As a research outcome
recommendations to develop banking risk regulation are formulated, which include the following:
— The need to expand validation requirement from risk components produced
by banks to correlation functions offered by regulators;
— The need to formulate SIFI buffer in terms of capital, liquidity and leverage as
the three indicators were revealed by 2007-2009 crisis as being the core
sources of bank failures, not limited to capital;
— The need to abandon one of Basel III novelties: either capital buffer for SIFIs
or multiplier in RWA correlation formula for exposures to SIFIs;
— The capital buffer values and remuneration rules should be calibrated and
theoretically justified;
— Calibration and unification of confidence levels used for different risk capital
charge should be done;
The key conclusion is that more cooperation of the Basel Committee and academic
community is needed for the benefit of regulators and commercial banks to avoid the
delay in proper research findings’ implementation – e. g. there passed 12 years for Vasicek
model for credit risk; 7 years for VaR and 13 years for ES (expected shortfall) measures for
market risk to be approved by the Basel Committee for the prudential use –.
ADAM, A., M. HOUKARI and J.-P. LAURENT (2007). Spectral risk measures and portfolio selection. Available online:
http://laurent.jeanpaul.free.fr.
ARTZNER, P., F. DELBAEN, J.-M. EBER and D. HEATH (1999). «Coherent risk measures», Mathematical Finance, 9
(3), pp. 203-228.
ASHRAF, D., J. GODDARD and Y. ALTUNBAS (2005). «Determinants of the use of credit derivatives by large US
banks», Journal of Finance, 61, pp. 893-919.
BREYMANN, W., A. DIAS and P. EMBRECHTS (2003). «Dependence structures for multivariate high-frequency data
in finance», Quantitative Finance, 3, pp. 1-14.
DAI, J., and S. LAPOINTE (2010). “Discerning the impact of derivatives on asset risk: the case of Canadian banks”,
Financial markets, institutions and instruments, 19 (5).
EMBRECHTS, P., A. MCNEIL and D. STRAUMANN (1999). Correlation and Dependence in Risk Management:
Properties and Pitfalls. Available online: http://www.math.ethz.ch/~strauman/preprints/pitfalls.pdf.
FOLPMERS, M. (2012). The Impact of PD-LGD Correlation on Expected Loss and Economic Capital. Available
online: http://www.garp.org/media/885775/risk_techniques_feb_2012.pdf.
GILLARD, L. (2004). La Banque d’Amsterdam et le Florin Européen au Temps de la République Néerlandaise (1610-1820),
Paris, Éditions de l’Ehess.
GOMAYUN, N., H. PENIKAS and Y. TITOVA (2012). Do Hedging and Trading Derivatives Have the Same Impact on
Public European Banks’ Value and Share Performance?, Working Paper WP BRP 09/FE/2012, Higher School of
Economics.
REFERENCES

BANCO DE ESPAÑA 40 ESTABILIDAD FINANCIERA, NÚM. 28
GOODHART, C. (2011a). The Basel Committee on Banking Supervision. A History of the Early Years 1974-1997,
Cambridge University Press.
— (2011b). “The Changing Role of Central Banks”, Financial History Review, 18 (2), pp. 135-154.
GORDY, M., and E. LÜTKEBOHMERT (2013). «Granularity Adjustment for Regulatory Capital Assessment», International
Journal of Central Banking, 9 (3), pp. 35-71. Available online: http://www.ijcb.org/journal/ijcb13q3a2.pdf.
GRANT, L. (2011). Liquidity Transfer Pricing: A Guide to Better Practice, Occasional Paper, Financial Stability
Institute. Available online: http://www.bis.org/fsi/fsipapers10.htm.
HALDANE, A. (2009). Rethinking the financial network, Bank of England. Available online: http://www.bis.org/review/
r090505e.pdf.
MCNEIL, A. J., R. FREY and P. EMBRECHTS (2005). Quantitative Risk Management, Princeton University Press,
Princeton, NJ.
PLUTO, K., and D. TASCHE (2005). Estimating Probabilities of Default for Low Default Portfolios. Available online:
http://arxiv.org/pdf/cond-mat/0411699.pdf.
PUKHTIN, M. (2004). Multi-factor Adjustment. Risk. Available online: http://www.ressources-actuarielles.net/EXT/
ISFA/1226.nsf/0/e9c944cf9ab30ac9c12577b4001e0342/$FILE/Pykhtin-Multi-fractor%20adjustment.pdf.
REPULLO, R., and J. SAURINA (2012). «The Countercyclical Capital Buffer of Basel III. A Critical Assessment»,
Chapter 3 (pp. 45-67), The Crisis Aftermath: New Regulatory Paradigms, edited by M. Dewatripont and X. Freixas,
CEPR, March.
RISKMETRICS (1996). Technical Document, J. P. Morgan/Reuters, Fourth Edition, New York. Available online:
http://pascal.iseg.utl.pt/~aafonso/eif/rm/TD4ePt_2.pdf.
TASCHE, D. (2013). Bayesian Estimation of Probabilities of Default for Low Default Portfolios. Available online: http://
arxiv.org/pdf/1112.5550.pdf.
VASICEK, O. (1987). Probability of Loss on Loan Portfolio, KMV Corporation. Available online: http://www.
moodysanalytics.com/~/media/Insight/Quantitative-Research/Portfolio-Modeling/87-12-02-Probability-of-
Loss-on-Loan-Portfolio.ashx.
WOOD, J. (2008). A History of Central Banking in Great Britain and the United States, Cambridge University Press.

BANCO DE ESPAÑA 41 ESTABILIDAD FINANCIERA, NÚM. 28
Number of documents published Number of pages published
Category Final Cons. QIS WP FAQ Report Newsl. Total Final Cons. QIS WP FAQ Report Newsl. Total
1 Credit risk 6 4 2 3 2 3 20 4 277 166 7 232 57 12 751 5
Concentrations 6 1 1 1 9 2 127 36 36 8 207 1
Securitisation 3 4 3 1 11 2 71 162 101 70 404 2
Credit risk transfer 2 2 4 1 190 170 360 2
Accounting 8 3 11 2 208 65 273 2
Cpty credit risk 2 2 1 4 9 2 55 52 24 78 209 1
(non-)central cpty 3 5 8 2 67 155 222 1
Validation 1 2 3 1 120 10 130 1
Equity Exposures 1 1 1 3 1 14 16 47 77 0
EAD 5 5 1 138 138 1
CRM 2 1 3 1 23 25 48 0
EL / provisions 2 1 3 1 13 7 20 0
LGD 1 1 2 0 12 1 13 0
RW 3 3 1 3 3 0
Credit risk Total 41 23 2 11 5 3 9 94 21 1,195 847 7 567 86 127 26 2,855 18
2 Market risk 11 1 1 1 1 15 3 276 59 19 19 1 374 2
Netting 3 2 5 1 33 8 41 0
FX risk 1 3 4 1 44 85 129 1
Interest rate risk 2 3 5 1 83 118 201 1
Basel 1.5 3 3 1 130 130 1
Basel 2.5 2 5 7 2 48 100 148 1
Basel 3.5 3 1 4 1 275 64 339 2
Market risk Total 22 16 1 1 2 1 43 9 614 586 59 19 83 1 1,362 8
3 Operational risk 6 2 4 1 1 14 3 196 109 78 41 2 426 3
Op. Risk Principles 5 4 9 2 133 88 221 1
Op. Risk Data 1 1 2 0 197 1 198 1
Operational risk Total 11 6 5 1 2 25 6 329 197 275 41 3 845 5
4 Liquidity risk 7 4 1 1 13 3 211 123 22 69 425 3
LCR 2 2 4 1 76 20 96 1
NSFR 1 2 3 1 17 25 42 0
Liquidity risk Total 10 6 3 1 20 4 304 148 42 69 563 3
5 Aggregation and K 7 3 1 1 1 13 3 354 112 21 31 47 565 3
Stress-testing 2 1 2 5 1 50 24 101 175 1
on (B III) 2 2 3 7 2 57 62 67 186 1
B III Impl. 4 11 15 3 147 236 383 2
Reg. Framework 1 2 3 1 20 61 81 0
Basel I 3 2 1 6 1 34 60 64 158 1
Basel II 6 4 27 4 41 9 1,002 499 652 9 2,162 13
Basel III 2 1 4 7 2 154 80 305 539 3
Aggregation and K Tota 22 13 36 5 3 14 4 97 21 1,651 837 1,125 216 67 344 9 4,249 26
6 Corp. governance 2 2 0 40 40 0
Remuneration 2 1 3 1 97 59 156 1
Audit 9 4 13 3 270 109 379 2
Internal Control 2 2 0 65 65 0
Compliance 2 1 3 1 47 14 61 0
BCP 1 1 2 0 44 42 86 1
CG Principles 3 3 6 1 99 93 192 1
Corp. Governance Total 21 10 31 7 662 317 979 6
7 Supervisors 13 2 1 4 20 4 283 47 59 117 506 3
Highly leveraged Inst. 3 1 4 1 47 32 79 0
Recovery, resolution 5 2 1 4 12 3 101 120 75 260 556 3
Core principles 8 8 1 17 4 413 388 63 864 5
RCAP 3 6 9 2 88 407 495 3
Conglomerates 3 2 1 6 1 333 199 28 560 3
Sup.colleges 2 2 4 1 59 58 117 1
SIFIs and FS 4 2 3 1 10 2 81 48 150 39 318 2
Supervisors Total 41 18 6 17 82 18 1,405 860 347 883 3,495 22
Code% of
total
% of
total
SUMMARY OF BCBS PUBLICATIONS BY TOPICS, SUBTOPICS AND TYPES TABLE A.1
APPENDIX: LIST OF TABLES

BANCO DE ESPAÑA 42 ESTABILIDAD FINANCIERA, NÚM. 28
SOURCES: BIS and author’s elaboration.
Number of documents published Number of pages published
Category Final Cons. QIS WP FAQ Report Newsl. Total Final Cons. QIS WP FAQ Report Newsl. Total
8 Info. disclosure 5 4 2 6 17 4 145 172 108 180 605 4
Trading and deriv. 3 1 5 9 2 124 36 167 327 2
Info - B III 4 4 8 2 78 79 157 1
Info. Disclosure Total 12 9 2 11 34 8 347 287 108 347 1,089 7
9 E-banking 3 3 6 1 93 86 179 1
AML and KYC 8 3 1 12 3 204 66 1 271 2
Mortgage Insurance 1 1 2 0 40 42 82 1
Longevity Risk 1 1 2 0 35 30 65 0
Year 2000 issue 3 1 4 1 18 22 40 0
Other 1 1 0 156 156 1
Other Total 17 8 1 1 27 6 546 224 22 1 793 5
TOTAL 197 109 43 26 12 49 17 453 100 7,053 4,303 1,407 1,338 214 1,875 40 16,230 100
Code% of
total
% of
total
SUMMARY OF BCBS PUBLICATIONS BY TOPICS, SUBTOPICS AND TYPES (cont’d) TABLE A.1
SOURCES: BIS and author’s elaboration.
Number of docs Number of pages Joint forum as % of total
Code Non joint forum Joint forum Total Non joint forum Joint forum Total # docs # pages
Credit risk 1 87 7 94 2,248 607 2,855 7 21
Market risk 2 43 0 43 1,362 0 1,362 0 0
Operational risk 3 24 1 25 801 44 845 4 5
Liquidity risk 4 19 1 20 538 25 563 5 4
Aggregation and K 5 94 3 97 3,963 286 4,249 3 7
Corp. governance 6 28 3 31 859 120 979 10 12
Supervisors 7 73 9 82 2,911 584 3,495 11 17
Info. disclosure 8 30 4 34 944 145 1,089 12 13
Other 9 19 8 27 364 429 793 30 54
Total 417 36 453 13,990 2,240 16,230 8 14
Category
DOCUMENTS DECOMPOSITION BY SOURCE: JOINT FORUM AND NON JOINT FORUM TABLE A.2

BANCO DE ESPAÑA 43 ESTABILIDAD FINANCIERA, NÚM. 28
Wav
e 1
Con
cord
ant
Wav
e 2
Bas
el I
Wav
e 3
Bas
el II
Wav
e 4
Bas
el II
IW
ave
5B
asel
III+
Yea
rsY
ears
Yea
rsY
ears
Yea
rs
7578
7980
8182
8384
8687
8889
9091
9293
9495
9697
9899
0001
0203
0405
0607
0809
1011
1213
14
1 C
redi
t ris
k1
12
13
11
66
61
49
65
45
66
128
94
2 M
arke
t ris
k1
42
34
21
21
12
21
25
42
22
43
3 O
pera
tiona
l ris
k1
14
23
11
12
11
32
22
5
4 L
iqui
dity
ris
k1
11
31
21
12
72
0
5 A
ggre
gatio
n an
d K
11
13
13
109
43
85
11
710
57
98
97
6 C
orp.
gov
erna
nce
11
11
21
12
21
32
24
21
22
31
7 S
uper
viso
rs1
11
22
21
21
16
24
13
21
61
58
87
59
82
8 In
fo. d
iscl
osur
e2
11
34
23
12
11
22
54
34
9 O
ther
11
22
14
24
11
11
51
27
TO
TA
L1
12
11
12
11
24
23
24
45
77
51
22
41
43
31
81
81
42
52
15
16
23
33
30
26
42
43
45
3
Wav
e 1
Con
cord
ant
Wav
e 2
Bas
el I
Wav
e 3
Bas
el II
Wav
e 4
Bas
el II
IW
ave
5B
asel
III+
Yea
rsY
ears
Yea
rsY
ears
Yea
rs
7578
7980
8182
8384
8687
8889
9091
9293
9495
9697
9899
0001
0203
0405
0607
0809
1011
1213
14
1 C
redi
t ris
k9
1811
1113
939
190
334
134
4523
037
596
253
149
6913
517
034
522
02
,85
5
2 M
arke
t ris
k7
121
3183
9275
223
2644
4582
1540
109
144
139
171
113
1,3
62
3 O
pera
tiona
l ris
k7
981
4310
58
236
331
197
122
9011
18
45
4 L
iqui
dity
ris
k15
2725
108
4412
222
2210
177
56
3
5 A
ggre
gatio
n an
d K
113
3459
112
839
834
033
333
036
743
91
7331
458
215
817
629
221
04
,24
9
6 C
orp.
gov
erna
nce
632
2161
6514
2347
3914
8574
4817
887
2971
859
79
7 S
uper
viso
rs5
24
1217
2711
935
4613
137
474
112
5625
103
2825
819
235
428
426
288
256
415
3,4
95
8 In
fo. d
iscl
osur
e70
2336
115
139
4184
2411
835
1243
5413
416
11
,08
9
9 O
ther
422
3115
3724
329
749
271
8917
933
79
3
TO
TA
L5
11
57
49
12
61
86
66
32
87
81
15
31
21
44
28
11
50
17
93
93
88
35
62
1,0
99
57
67
13
76
09
66
92
85
06
31
1,0
48
1,5
13
1,1
05
87
81
,54
91
,42
51
6,2
30
Cod
e
Reg
ulat
ory
wav
eK
ey D
ocum
ents
# pp
Cod
e
To
tal
To
tal
Reg
ulat
ory
wav
eK
ey D
ocum
ents
# do
cs
OV
ER
VIE
W O
F 5
RE
GU
LA
TO
RY
WA
VE
S O
F T
HE
BA
SE
L C
OM
MIT
TE
E O
N B
AN
KIN
G S
UP
ER
VIS
ION
HIS
TO
RY
OF
RE
GU
LA
TO
RY
DO
CU
ME
NT
S P
UB
LIC
AT
ION
T
AB
LE
A.3
86
9
6
10
3
11
9
12
8
12
0
16
0
16
0
23
6
28
7
26
6
32
3
33
5
37
6
41
6
45
2
46
0
54
2
67
0
87
3
1,0
86
1,3
27
1,4
27
1,1
94
99
4
96
5
1,1
31
1,2
07
1,3
10
1,4
77
1,2
20
94
8
1,1
40
1,2
68
1,3
79
1,6
44
1,9
29
0
500
1,0
00
1,5
00
2,0
00
2,5
00
75
78
79
80
81
82
83
84
86
87
88
89
90
91
92
93
94
95
96
97
98
99
00
01
02
03
04
05
06
07
08
09
10
11
12
13
14
S&P
Wave
1 C
onco
rdant
Wave 2
Basel I
W
ave 3
Basel I
I W
ave 4
Basel I
II
Wave 5
Basel I
II+
SO
UR
CE
S: Y
ahoo
.na
nce,
BIS
and
aut
hor’s
ela
bora
tion.

BANCO DE ESPAÑA 44 ESTABILIDAD FINANCIERA, NÚM. 28
SOURCES: BIS and author’s elaboration.NOTE: Commenters having sent at least 8 comments are included in the table.
# Commenter Name # comments Country
1 Canadian Bankers Association 41 Canada2 French Banking Federation 41 France3 Japanese Bankers Association 40 Japan4 Hong Kong Association of Banks 33 Hong Kong SAR, China5 Deutsche Bank 28 Germany6 Standard Bank 27 United Kingdom7 Institute of International Finance 26 United States8 International Banking Federation 25 United Kingdom9 British Bankers Association 25 United Kingdom
10 Barclays 25 United Kingdom11 UniCredit 22 Italy12 Royal Bank of Scotland 21 United Kingdom13 UBS 20 Switzerland14 International Swaps and Derivatives Association (ISDA) 20 United States15 European Banking Federation 20 Belgium16 Saudi Banks 19 Saudi Arabia17 German Banking Industry 19 Germany18 HSBC 18 Hong Kong SAR, China19 World Council of Credit Unions 17 United States20 European Association of Co-operative Banks 17 Belgium21 BNP Paribas 17 France22 WSBI-ESBG 17 Belgium23 Italian Banking Association 16 Italy24 Austrian Federal Economic Chamber 16 Austria25 Australian Bankers Association 15 Australia26 Chris Barnard 15 Germany27 Standard & Poors 15 United States28 Dutch Banking Association 14 Netherlands29 First Rand 13 South Africa30 Deutsche Boerse Group 13 Germany31 Swedish Bankers Association 13 Sweden32 European Association of Public Banks 12 Belgium33 Zentraler Kreditausschuss 12 Germany34 American Bankers Association 12 United States35 JP Morgan Chase 11 United States36 National Research University Higher School of Economics 10 Russian Federation37 Nomura 10 Japan38 Credit Suisse 10 Switzerland39 Dubai Financial Services Authority 9 United Arab Emirates40 Norges Bank 9 Norway41 Polish Financial Supervision Authority 9 Poland42 Zhen Li 9 China43 Santander 9 Spain44 Bank of America 9 United States45 Bank of New York Mellon 9 United States46 State Street 9 United States47 CME 8 United States48 Jacques Préfontaine 8 Canada49 Goldman Sachs 8 United States50 The Clearing House Association L.L.C 8 United States51 ING 8 Netherlands
TOTAL 934
TOP-50 COMMENTERS TABLE A.4

BANCO DE ESPAÑA 45 ESTABILIDAD FINANCIERA, NÚM. 28
SOURCES: BIS and author’s elaboration.
# Commenter Name # comments % of total comments # members % of total comments
1 Commercial Bank 677 30.6 169 19.82 Other n. company 423 19.1 263 30.83 Banking Association 339 15.3 49 5.74 Other Association 226 10.2 83 9.75 Authorities 150 6.8 76 8.96 Individual 116 5.3 76 8.97 Audit, consulting, rating 85 3.8 34 4.08 Insurance Co. 46 2.1 26 3.09 Academics 39 1.8 28 3.3
10 Exchange 35 1.6 10 1.211 Other Federation 30 1.4 17 2.012 Securitisation Forum 15 0.7 4 0.513 IT company 9 0.4 4 0.514 Asset management 8 0.4 6 0.715 Manufacturing 8 0.4 6 0.716 Payment system 3 0.1 2 0.2
TOTAL 2,209 100.0 853 100.0
Subtotals Banks + Banking Assoc. 1,016 46.0 218 25.6 Academics + Indiv. 155 7.0 104 12.2
COMMENTS AND COMMENTERS DECOMPOSITION BY TYPE (PROFESSIONAL AFFILIATION) OF A COMMENTER TABLE A.5

BANCO DE ESPAÑA 46 ESTABILIDAD FINANCIERA, NÚM. 28
# Country GDP - # Comments Total comments GDP, $ bn GDP per capita, $
1 United States 520 16,800 53,1432 United Kingdom 322 2,521 39,3373 Germany 184 3,635 45,0854 Belgium 155 508 45,3875 Japan 108 4,902 38,4926 France 104 2,735 41,4217 Canada 78 1,827 51,9588 Italy 57 2,071 34,6199 Hong Kong SAR, China 55 274 38,124
10 Netherlands 54 800 47,61711 Australia 48 1,561 67,46812 Switzerland 48 650 80,47713 Spain 31 1,358 29,11814 Austria 31 416 49,05415 Denmark 29 331 58,89416 South Africa 28 351 6,61817 China 28 9,240 6,80718 Singapore 25 298 55,18219 Sweden 24 559 58,26920 Saudi Arabia 24 745 25,85221 Korea, Rep. 23 1,305 25,97722 Poland 19 518 13,43223 Finland 18 257 47,21924 Russian Federation 17 2,097 14,61225 India 16 1,877 1,49926 Norway 15 513 100,81927 United Arab Emirates 11 384 41,69228 Luxembourg 10 60 111,16229 Thailand 8 387 5,77930 Mexico 7 1,261 10,30731 Ireland 7 218 47,40032 Czech Republic 7 198 18,86133 Brazil 5 2,246 11,20834 Portugal 4 220 21,03535 Ukraine 4 177 3,90036 Hungary 4 130 13,13437 New Zealand 4 186 41,55638 Peru 4 202 6,66039 Argentina 4 612 14,76040 Israel 3 291 36,15141 Turkey 3 820 10,94642 Venezuela, RB 3 438 14,41543 Malta 3 10 22,78044 Bahrain 3 33 24,61345 Malaysia 3 312 10,51446 Colombia 3 378 7,82647 Egypt, Arab Rep. 2 272 3,31448 Kuwait 2 183 56,36749 Bulgaria 2 53 7,29650 Georgia 2 16 3,60251 Slovak Republic 2 96 17,68952 Mauritius 2 12 9,21053 Trinidad and Tobago 2 25 18,37354 Guatemala 2 54 3,47855 Barbados 2 4 14,91756 Iceland 2 15 45,26357 Chile 2 277 15,73258 Armenia 1 10 3,505
COMMENTS RECEIVED BY COUNTRY OF ORIGIN TABLE A.6
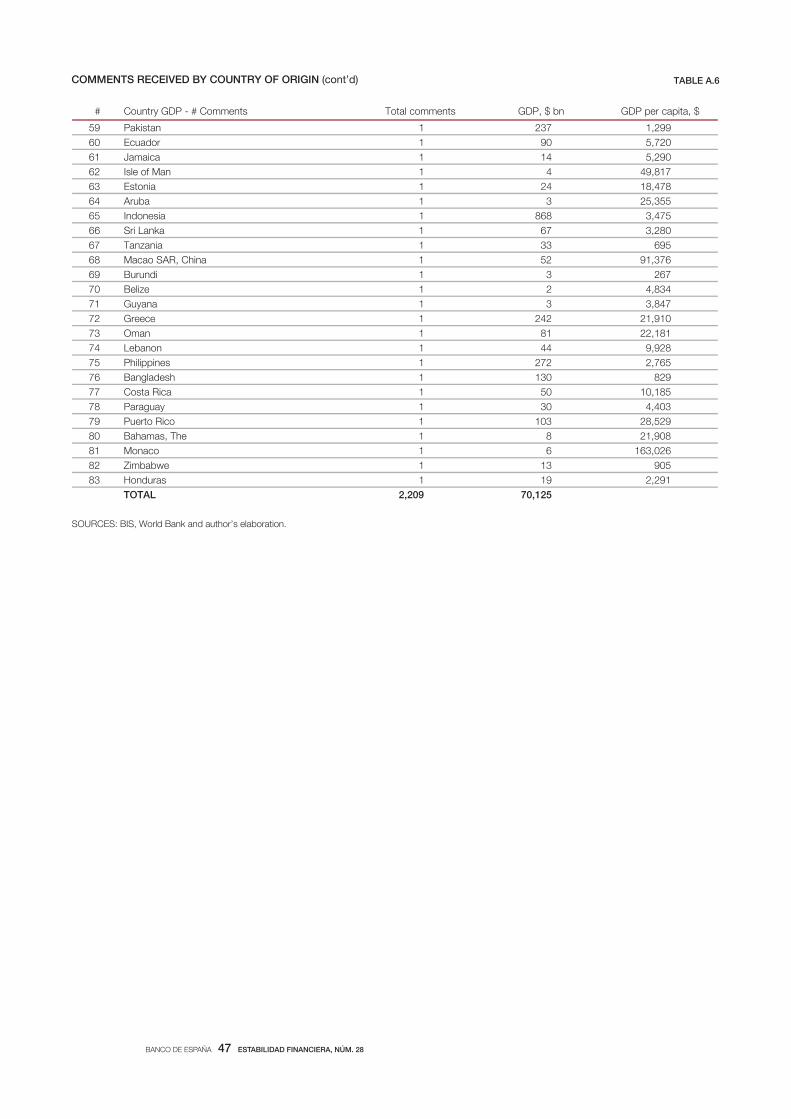
BANCO DE ESPAÑA 47 ESTABILIDAD FINANCIERA, NÚM. 28
SOURCES: BIS, World Bank and author’s elaboration.
# Country GDP - # Comments Total comments GDP, $ bn GDP per capita, $
59 Pakistan 1 237 1,29960 Ecuador 1 90 5,72061 Jamaica 1 14 5,29062 Isle of Man 1 4 49,81763 Estonia 1 24 18,47864 Aruba 1 3 25,35565 Indonesia 1 868 3,47566 Sri Lanka 1 67 3,28067 Tanzania 1 33 69568 Macao SAR, China 1 52 91,37669 Burundi 1 3 26770 Belize 1 2 4,83471 Guyana 1 3 3,84772 Greece 1 242 21,91073 Oman 1 81 22,18174 Lebanon 1 44 9,92875 Philippines 1 272 2,76576 Bangladesh 1 130 82977 Costa Rica 1 50 10,18578 Paraguay 1 30 4,40379 Puerto Rico 1 103 28,52980 Bahamas, The 1 8 21,90881 Monaco 1 6 163,02682 Zimbabwe 1 13 90583 Honduras 1 19 2,291
TOTAL 2,209 70,125
COMMENTS RECEIVED BY COUNTRY OF ORIGIN (cont’d) TABLE A.6
