history may not repeat itself, but it certainly does rhyme* * mark twain an economic and real estate...
TRANSCRIPT

History May Not Repeat Itself, But it Certainly Does Rhyme*
*Mark Twain
An Economic and Real Estate Forecast
Ted C. Jones, PhDChief Economist, Stewart Title
http://blog.stewart.com/


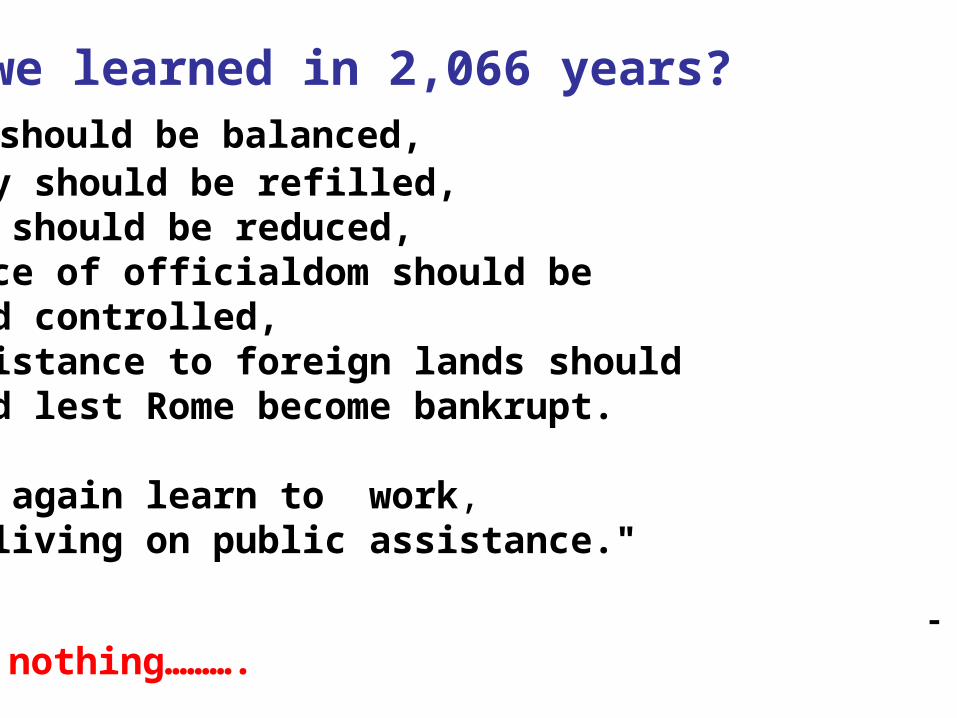
What have we learned in 2,066 years? "The budget should be balanced, the Treasury should be refilled, public debt should be reduced, the arrogance of officialdom should be tempered and controlled, and the assistance to foreign lands should be curtailed lest Rome become bankrupt.
People must again learn to work, instead of living on public assistance." - Cicero - 55 BC Evidently nothing……….
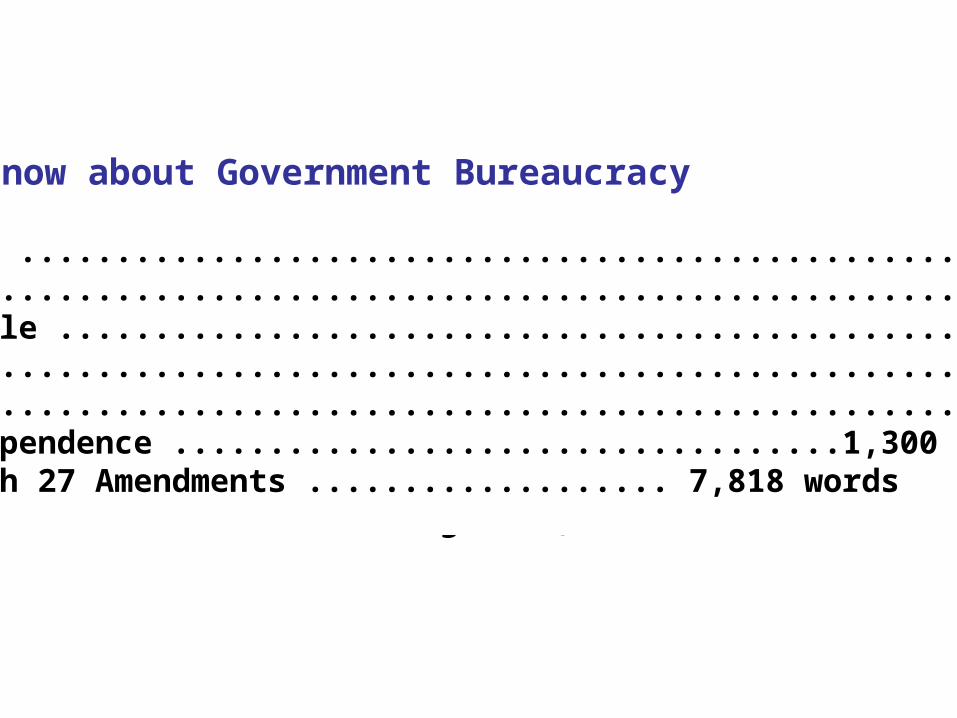
All you Need to Know about Government Bureaucracy
Pythagorean theorem ....................................................24 wordsLord's prayer ..................................................................66 wordsArchimedes' Principle ...................................................67 words10 Commandments ......................................................179 wordsGettysburg address .....................................................286 wordsDeclaration of Independence ...................................1,300 wordsUS Constitution with 27 Amendments ................... 7,818 wordsUS Government regulations on sale of cabbage 26,911 words

Jobs Are Everything
Period.

NovemberYear Millions2000 132.42010 130.5
1.81 Million Fewer Jobs
US Employment
-1.37 Percent10 Years at 100,000 Per Month
= 12 Million Needed Jobs
NovemberYear Million2000 5.6192010 5.015
604,000 Lost Jobs
Ohio Jobs
-10.6 Percent

http://taxfoundation.org/files/bp60.pdf
OHIO – 46th Worst Business Tax Environment

128
130
132
134
136
138
'07 '08 '09 '10
U.S. Job NumbersJobs (Millions) Seasonally Adjusted
7.44 Million Lost Since Jan 2008103,000 Gained in Dec 2010
1,124,000 Gained YTD
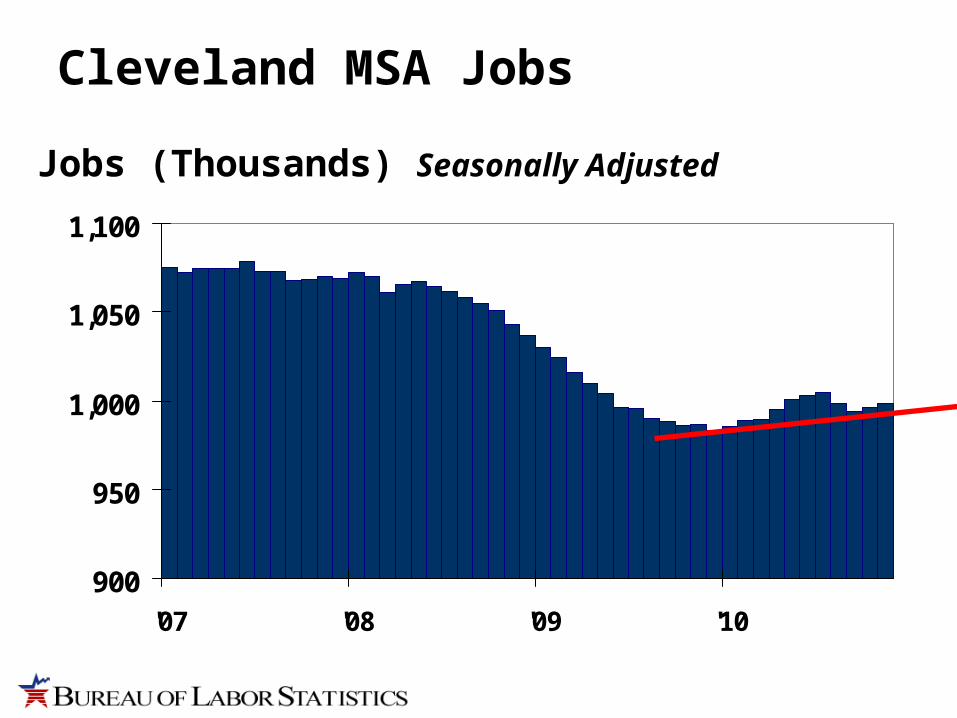
900
950
1,000
1,050
1,100
'07 '08 '09 '10
Cleveland MSA Jobs
Jobs (Thousands) Seasonally Adjusted
-8.0%
-6.0%
-4.0%
-2.0%
0.0%
2.0%
4.0%
'01 '02 '03 '04 '05 '06 '07 '08 '09 '10
US Cleveland
67
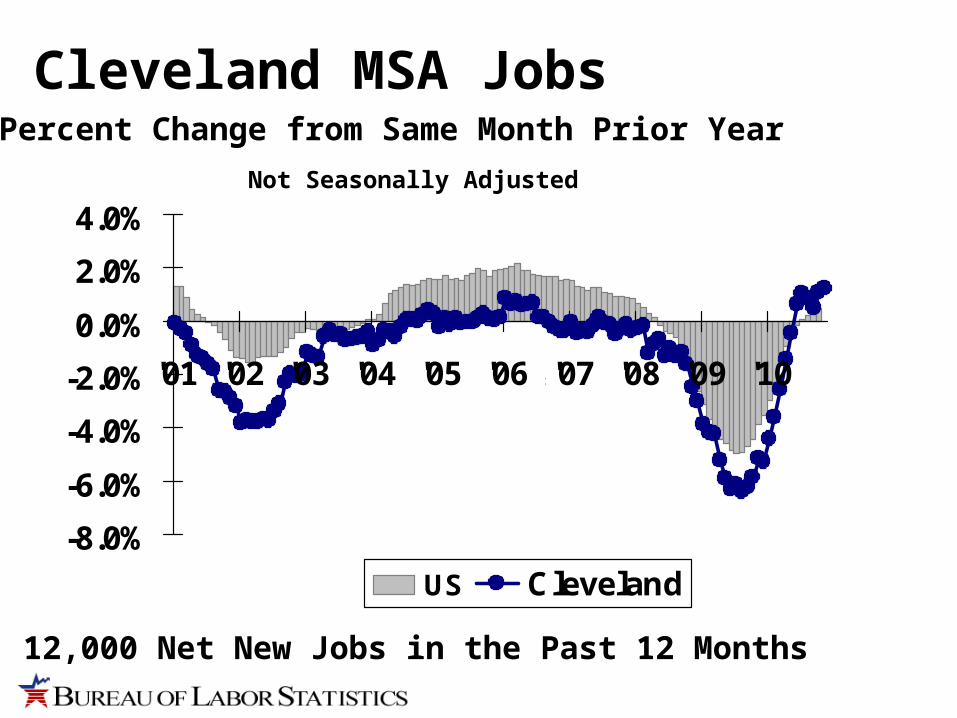
Percent Change from Same Month Prior Year
Cleveland MSA Jobs
12,000 Net New Jobs in the Past 12 Months
Not Seasonally Adjusted
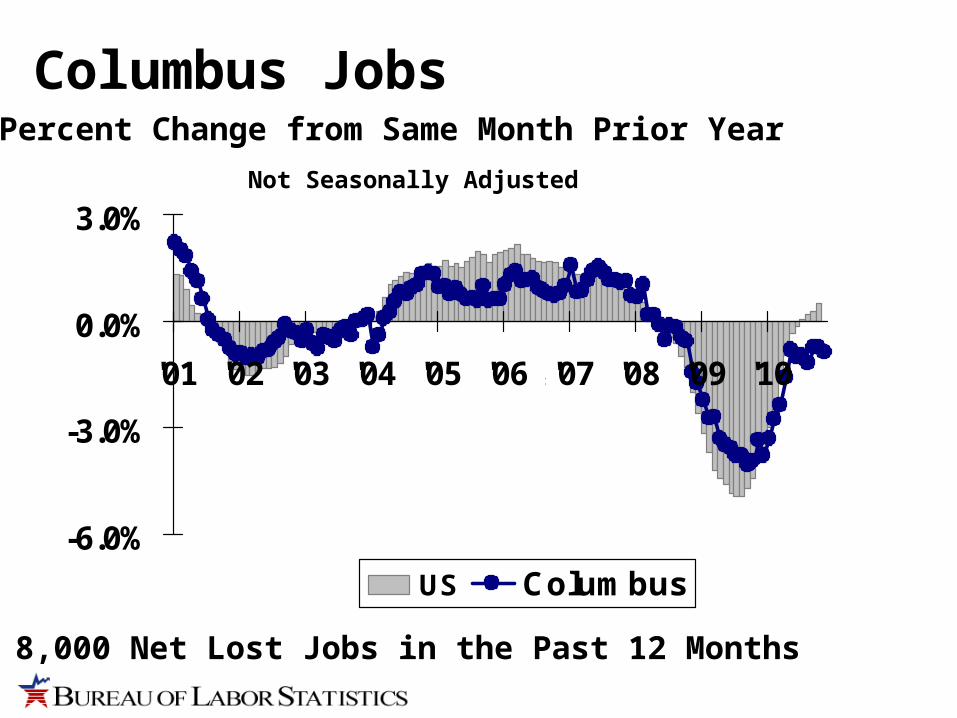
-6.0%
-3.0%
0.0%
3.0%
'01 '02 '03 '04 '05 '06 '07 '08 '09 '10
US Columbus
67
Percent Change from Same Month Prior Year
Columbus Jobs
8,000 Net Lost Jobs in the Past 12 Months
Not Seasonally Adjusted
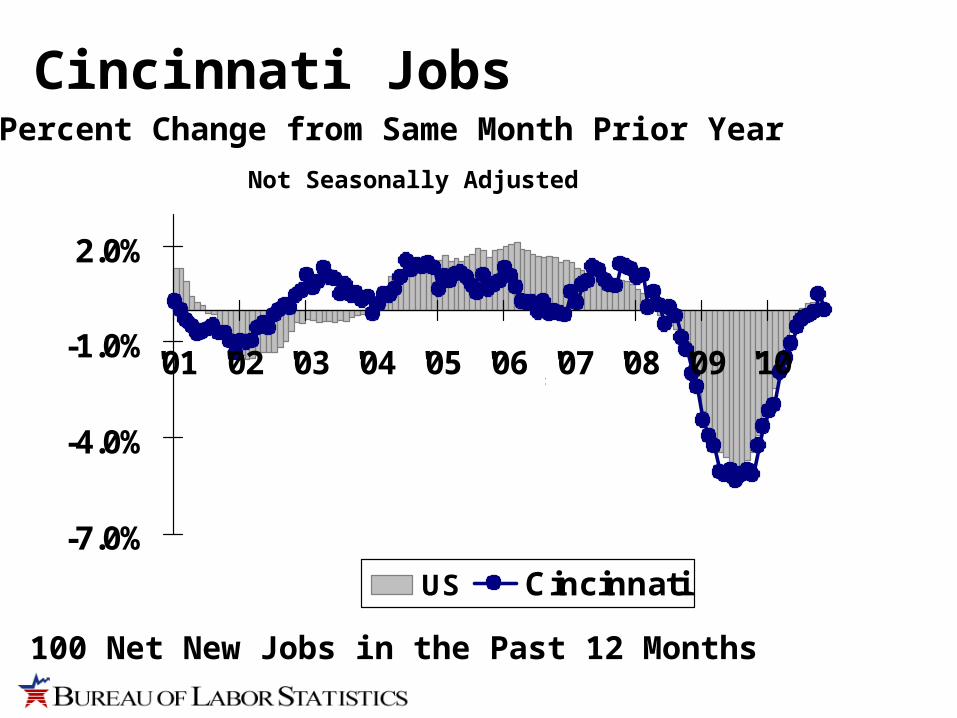
-7.0%
-4.0%
-1.0%
2.0%
'01 '02 '03 '04 '05 '06 '07 '08 '09 '10
US Cincinnati
67
Percent Change from Same Month Prior Year
Cincinnati Jobs
100 Net New Jobs in the Past 12 Months
Not Seasonally Adjusted
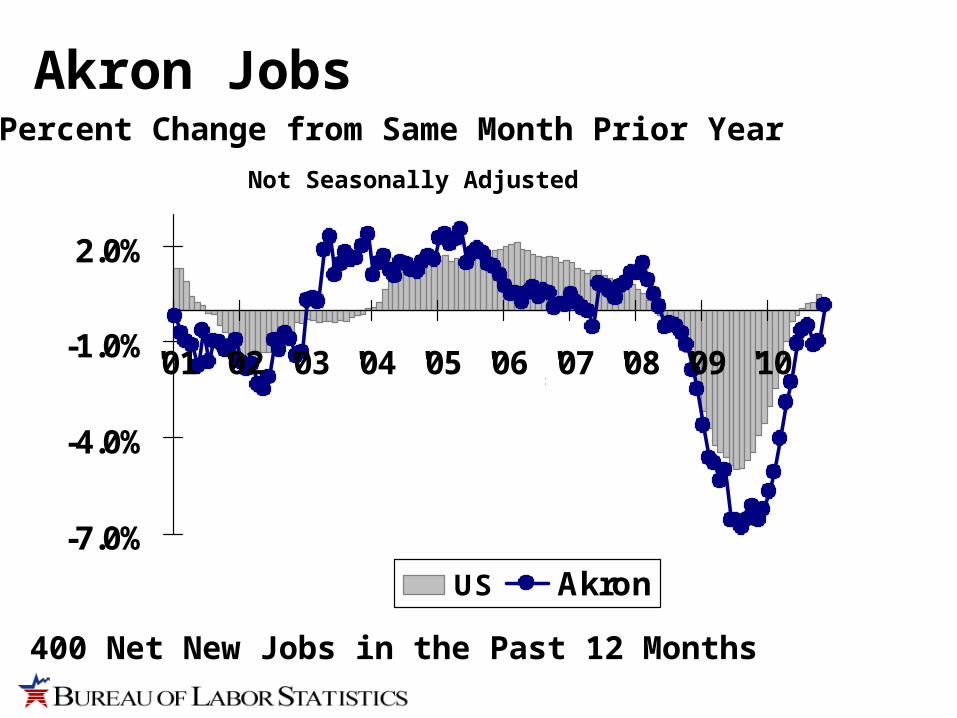
-7.0%
-4.0%
-1.0%
2.0%
'01 '02 '03 '04 '05 '06 '07 '08 '09 '10
US Akron
67
Percent Change from Same Month Prior Year
Akron Jobs
400 Net New Jobs in the Past 12 Months
Not Seasonally Adjusted
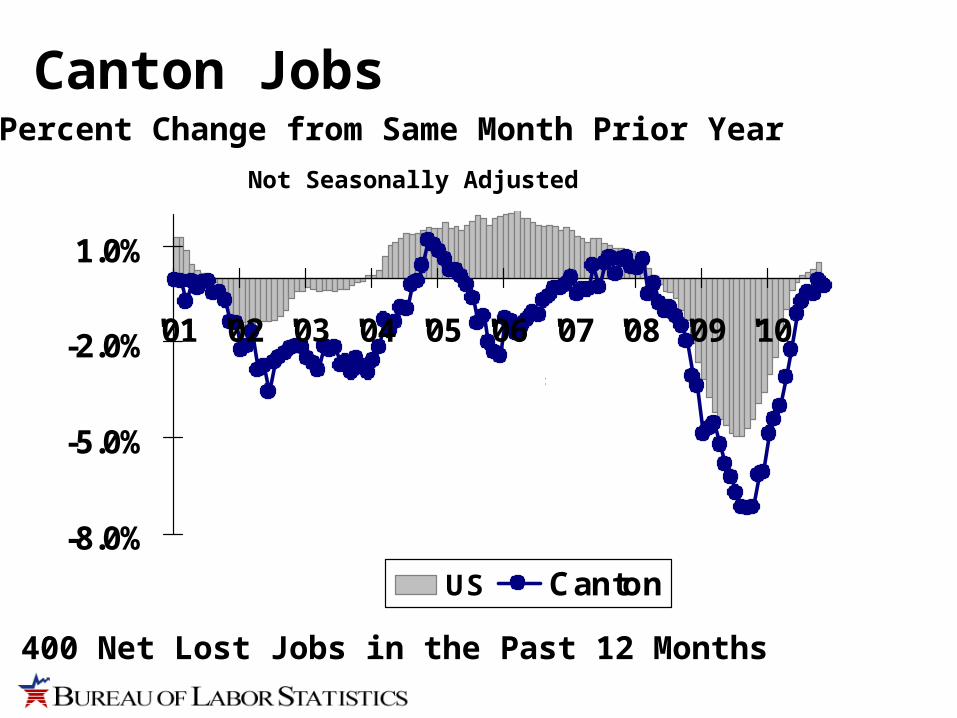
-8.0%
-5.0%
-2.0%
1.0%
'01 '02 '03 '04 '05 '06 '07 '08 '09 '10
US Canton
67
Percent Change from Same Month Prior Year
Canton Jobs
400 Net Lost Jobs in the Past 12 Months
Not Seasonally Adjusted
-8.0%
-5.0%
-2.0%
1.0%
'01 '02 '03 '04 '05 '06 '07 '08 '09 '10
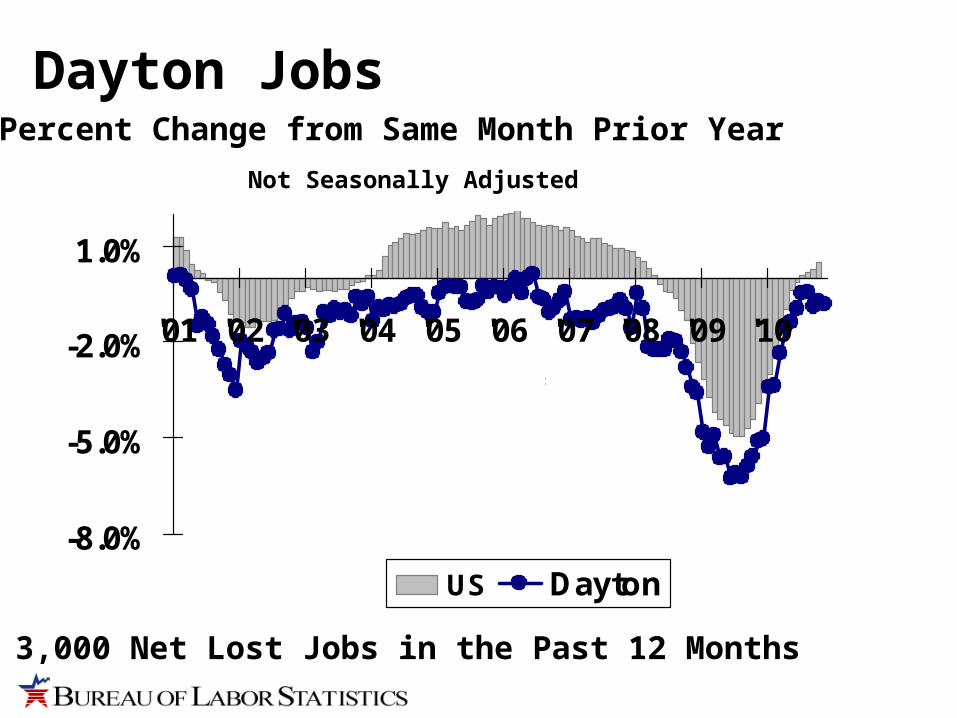
US Dayton
67
Percent Change from Same Month Prior Year
Dayton Jobs
3,000 Net Lost Jobs in the Past 12 Months
Not Seasonally Adjusted
-8.0%
-5.0%
-2.0%
1.0%
'01 '02 '03 '04 '05 '06 '07 '08 '09 '10
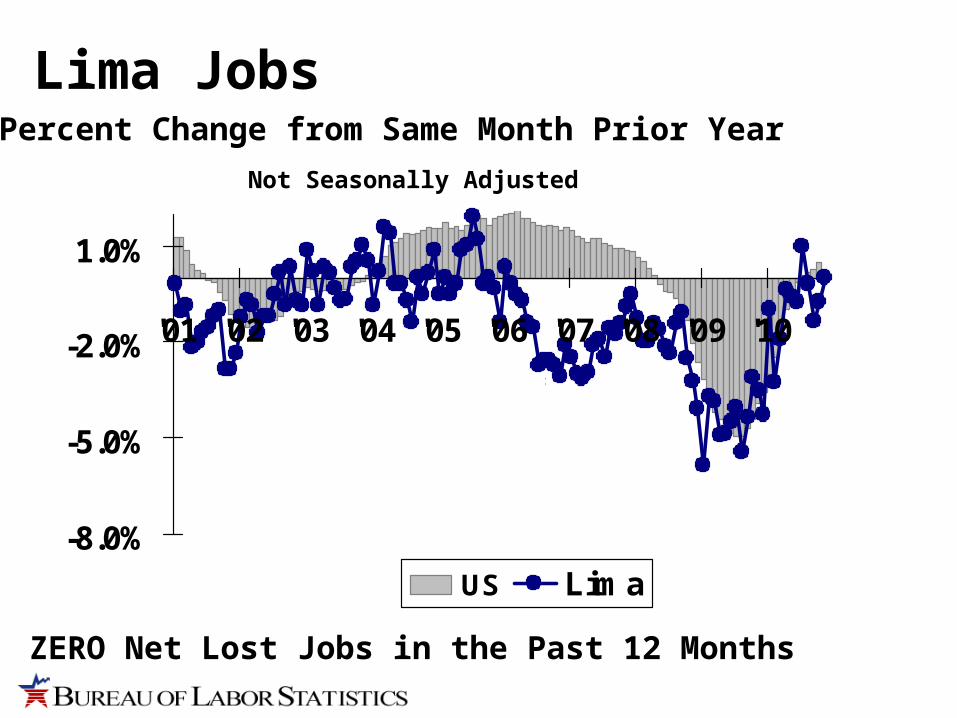
US Lima
67
Percent Change from Same Month Prior Year
Lima Jobs
ZERO Net Lost Jobs in the Past 12 Months
Not Seasonally Adjusted
-10.0%
-7.5%
-5.0%
-2.5%
0.0%
2.5%
5.0%
'01 '02 '03 '04 '05 '06 '07 '08 '09 '10
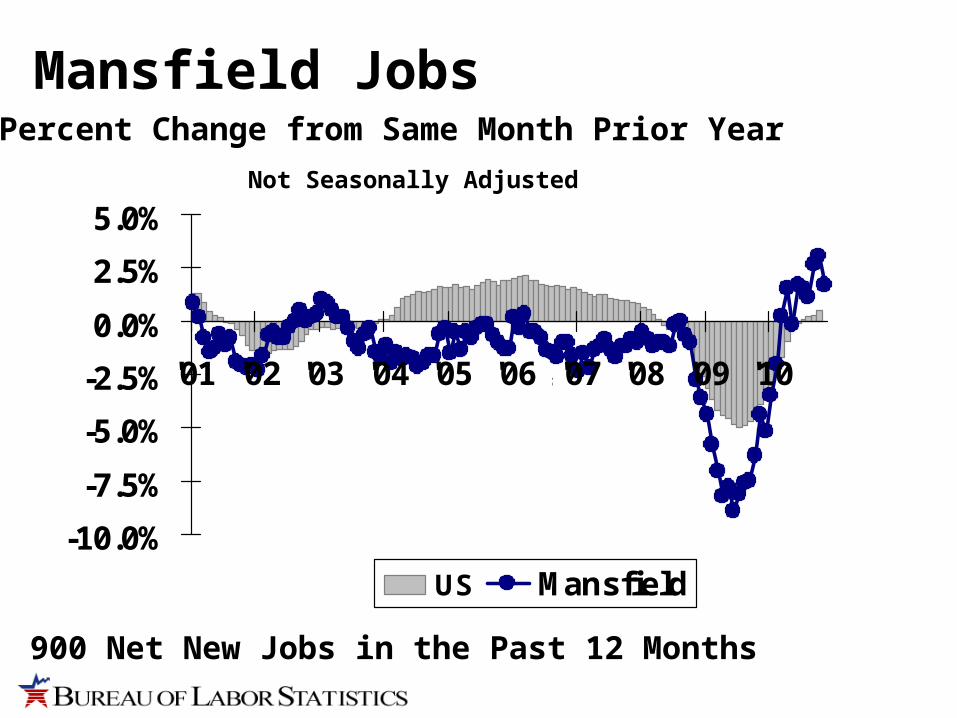
US Mansfield
67
Percent Change from Same Month Prior Year
Mansfield Jobs
900 Net New Jobs in the Past 12 Months
Not Seasonally Adjusted
-10.0%
-7.5%
-5.0%
-2.5%
0.0%
2.5%
5.0%
'01 '02 '03 '04 '05 '06 '07 '08 '09 '10
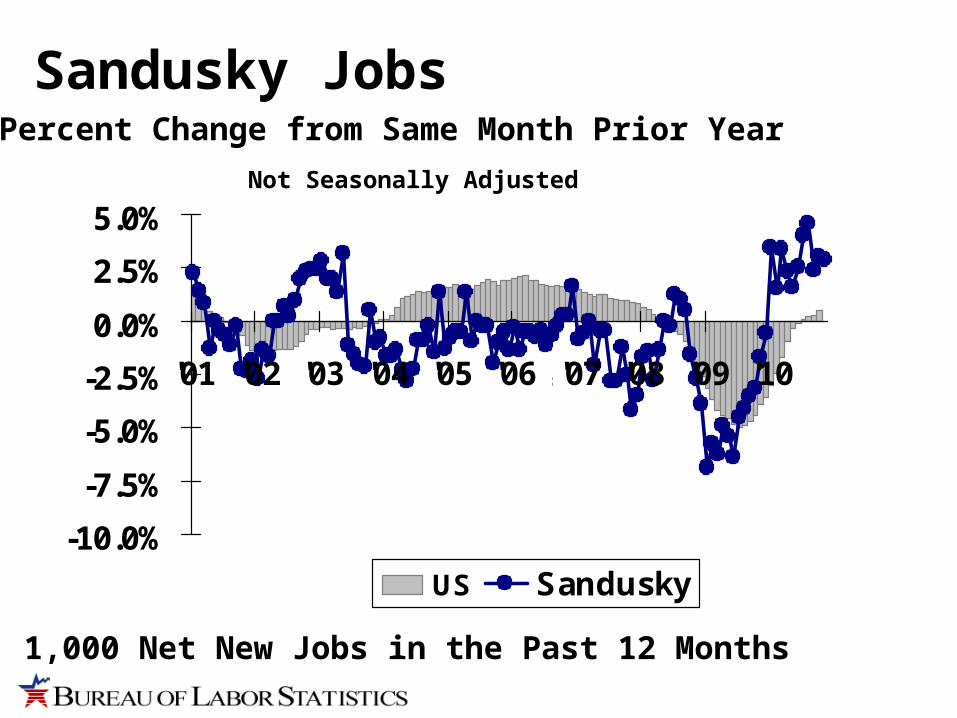
US Sandusky
67
Percent Change from Same Month Prior Year
Sandusky Jobs
1,000 Net New Jobs in the Past 12 Months
Not Seasonally Adjusted
-10.0%
-7.5%
-5.0%
-2.5%
0.0%
2.5%
'01 '02 '03 '04 '05 '06 '07 '08 '09 '10
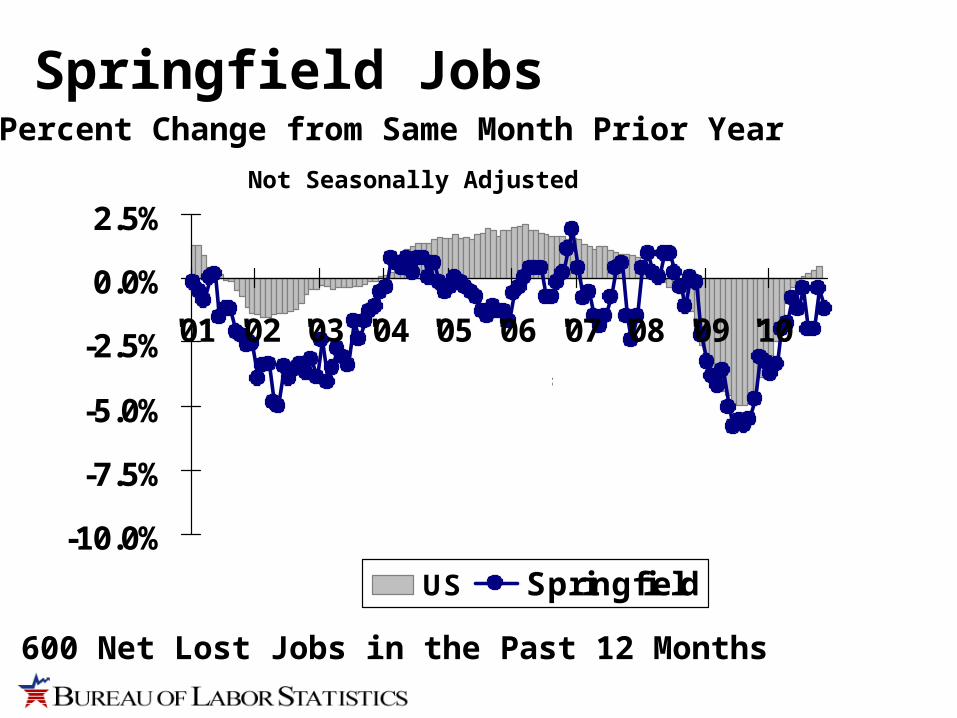
US Springfield
67
Percent Change from Same Month Prior Year
Springfield Jobs
600 Net Lost Jobs in the Past 12 Months
Not Seasonally Adjusted
-12.0%
-9.5%
-7.0%
-4.5%
-2.0%
0.5%
3.0%
'01 '02 '03 '04 '05 '06 '07 '08 '09 '10
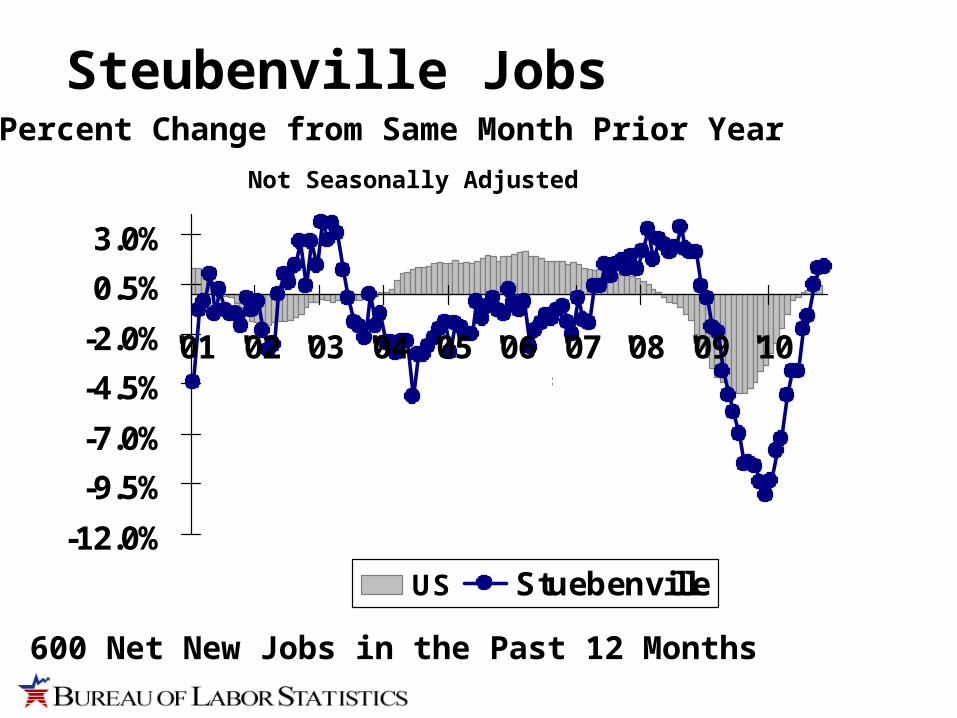
US Stuebenville
67
Percent Change from Same Month Prior Year
Steubenville Jobs
600 Net New Jobs in the Past 12 Months
Not Seasonally Adjusted
-10.0%
-8.0%
-6.0%
-4.0%
-2.0%
0.0%
2.0%
'01 '02 '03 '04 '05 '06 '07 '08 '09 '10
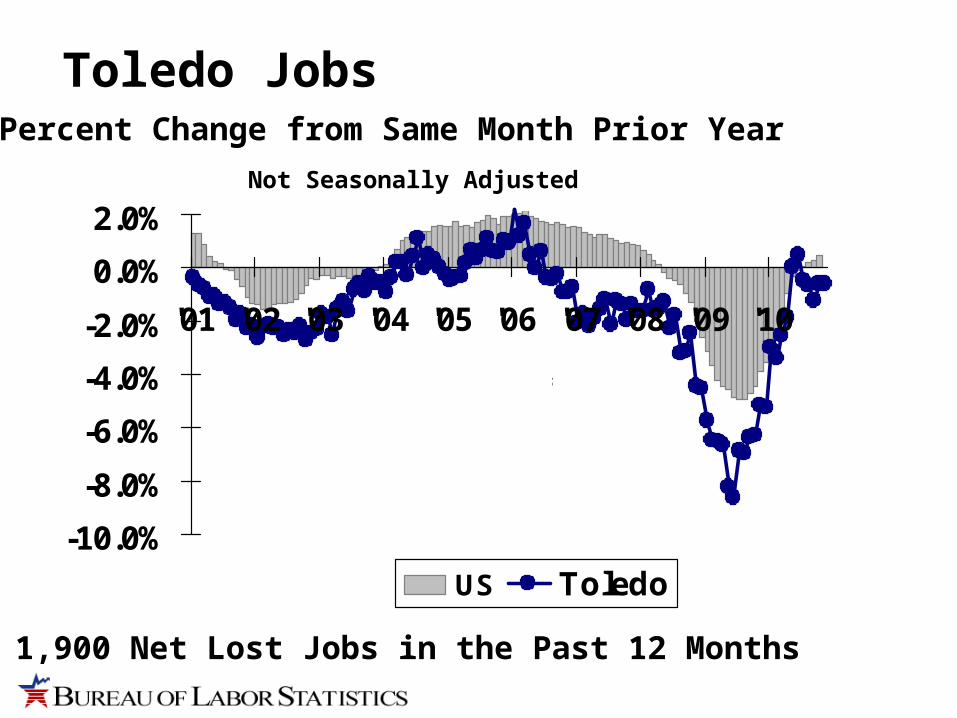
US Toledo
67
Percent Change from Same Month Prior Year
Toledo Jobs
1,900 Net Lost Jobs in the Past 12 Months
Not Seasonally Adjusted
-10.0%
-8.0%
-6.0%
-4.0%
-2.0%
0.0%
2.0%
'01 '02 '03 '04 '05 '06 '07 '08 '09 '10
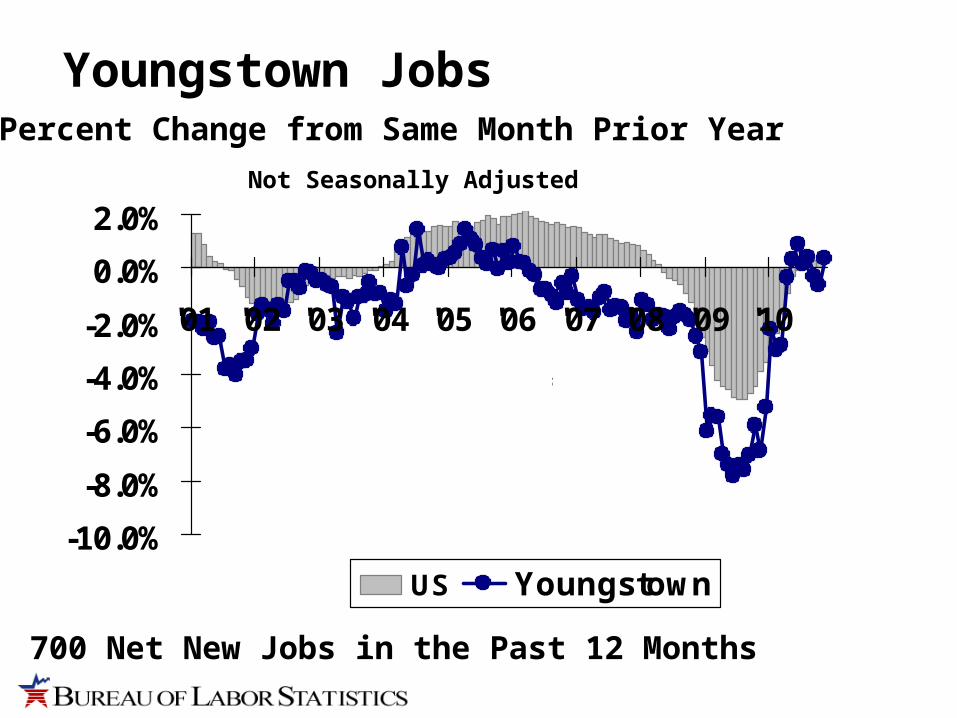
US Youngstown
67
Percent Change from Same Month Prior Year
Youngstown Jobs
700 Net New Jobs in the Past 12 Months
Not Seasonally Adjusted
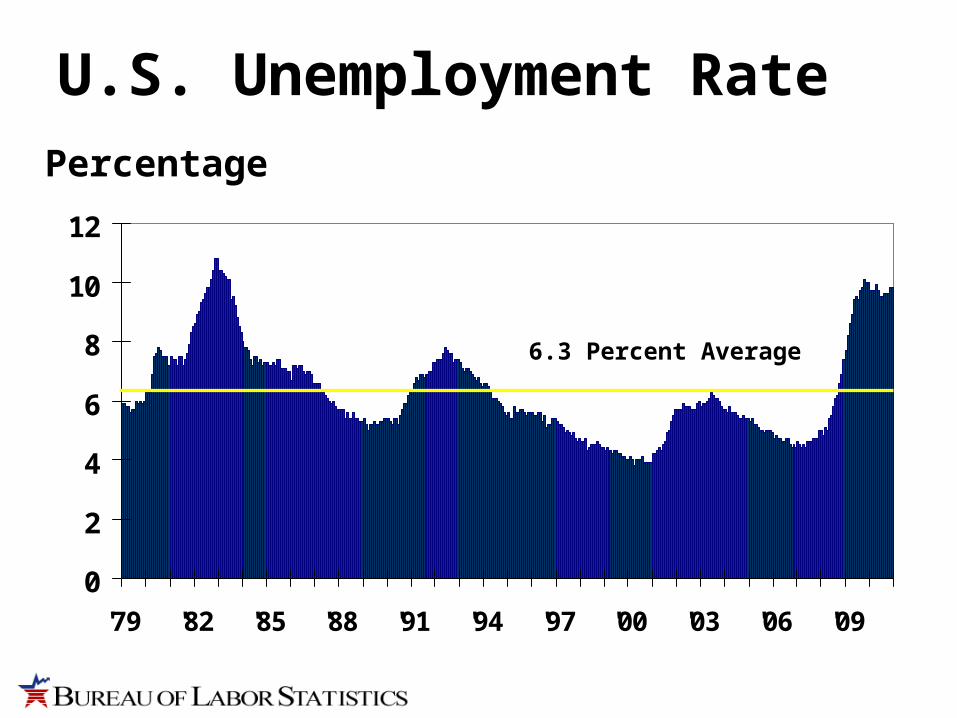
0
2
4
6
8
10
12
'79 '82 '85 '88 '91 '94 '97 '00 '03 '06 '09
U.S. Unemployment RatePercentage
6.3 Percent Average
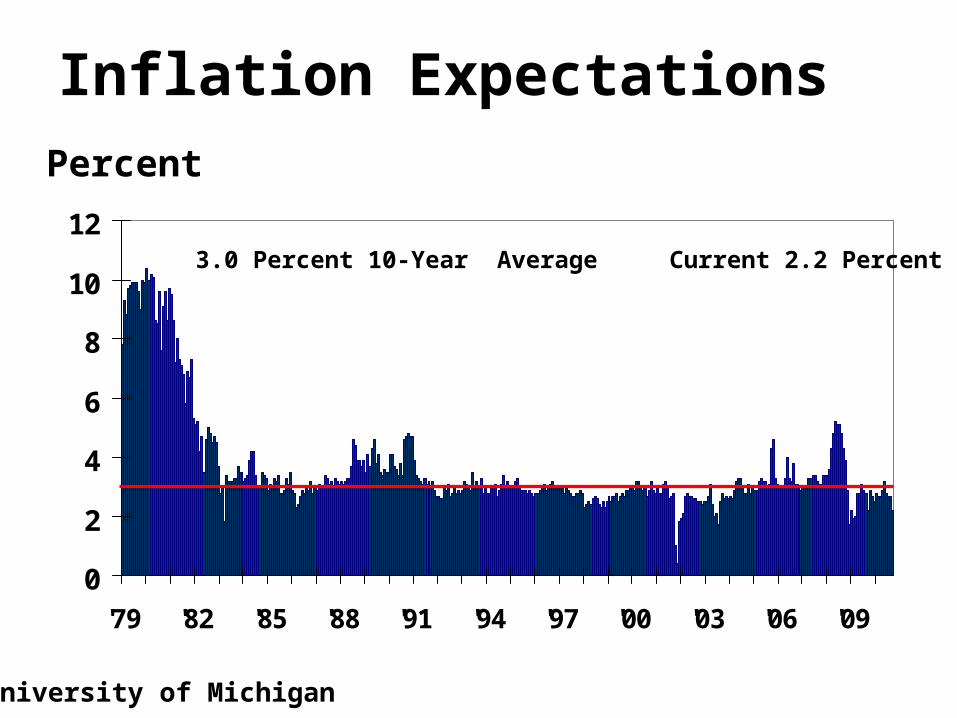
0
2
4
6
8
10
12
'79 '82 '85 '88 '91 '94 '97 '00 '03 '06 '09
Inflation ExpectationsPercent
3.0 Percent 10-Year Average Current 2.2 Percent
University of Michigan
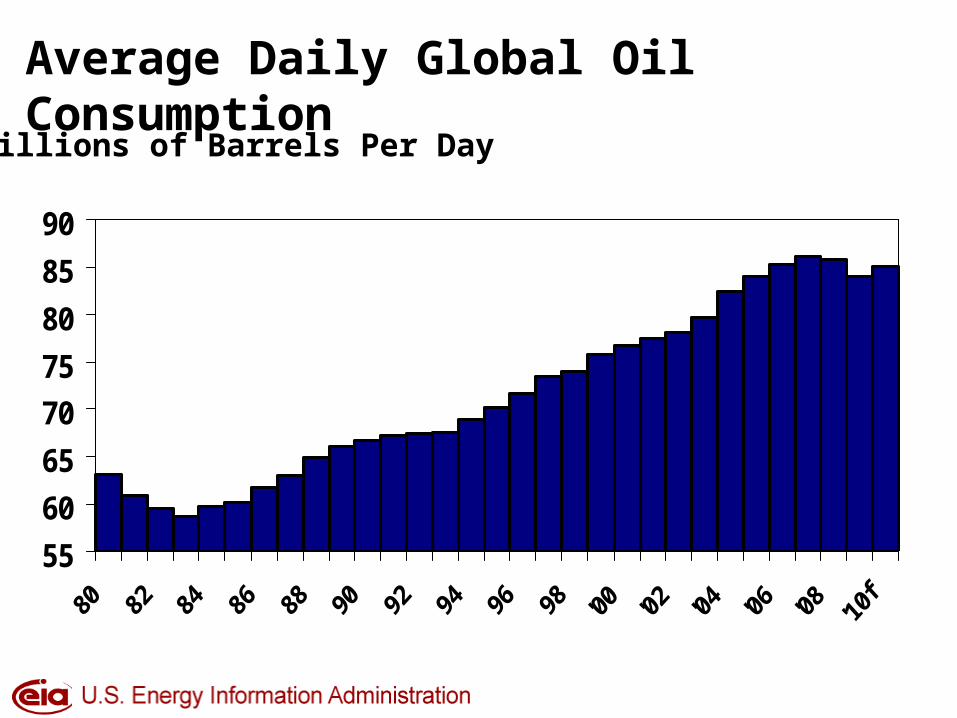
Average Daily Global Oil Consumption
55
60
65
70
75
80
85
90
Millions of Barrels Per Day
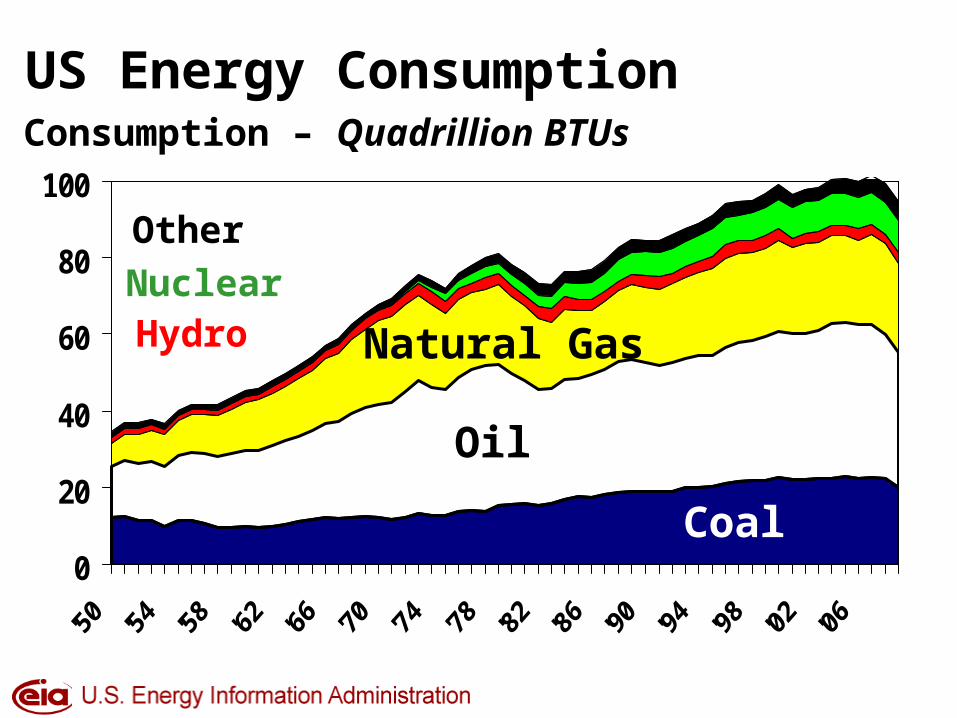
US Energy Consumption
0
20
40
60
80
100Consumption – Quadrillion BTUs
Coal
Oil
Natural GasHydroNuclear
Other

0
1,000
2,000
3,000
4,000
5,000
'80 '83 '86 '89 '92 '95 '98 '01 '04 '07 '10
Rotary Rig CountAverage Number Working Per Month

$0
$2
$4
$6
$8
$10
$12
'80 '83 '86 '89 '92 '95 '98 '01 '04 '07 '10
Well Head Natural Gas PricePrice Per 1,000 Cubic Feet – 3 Month Moving Average
$0
$20
$40
$60
$80
$100
$120
$140
'80 '83 '86 '89 '92 '95 '98 '01 '04 '07 '10
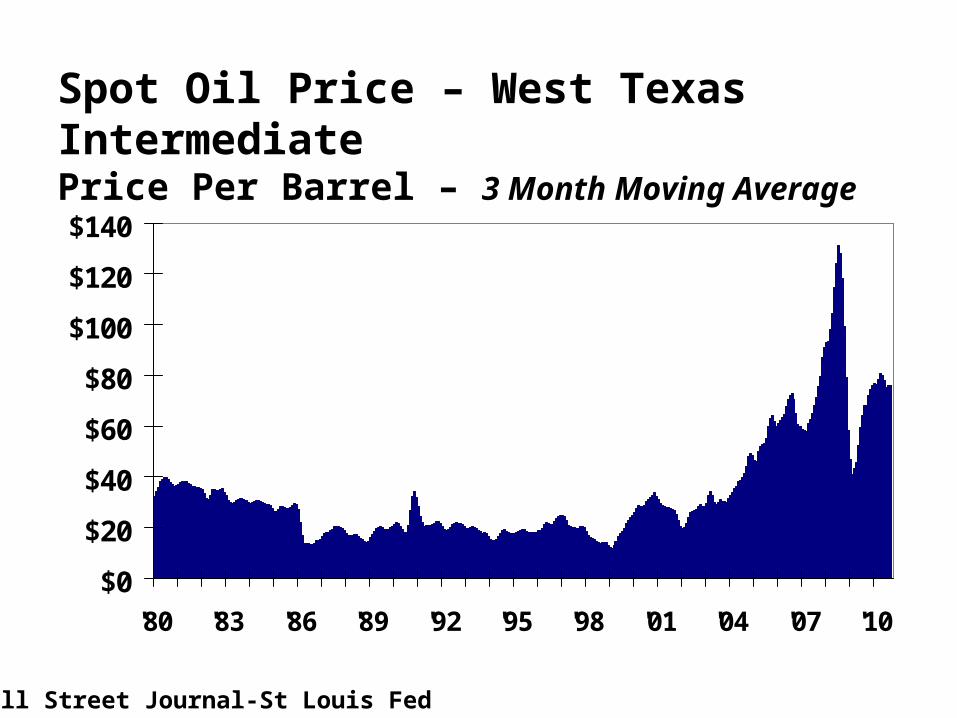
Spot Oil Price – West Texas IntermediatePrice Per Barrel – 3 Month Moving Average
Wall Street Journal-St Louis Fed
4.0
5.0
6.0
7.0
'02
'03
'04
'05
'06
'07
'08
'09
'10
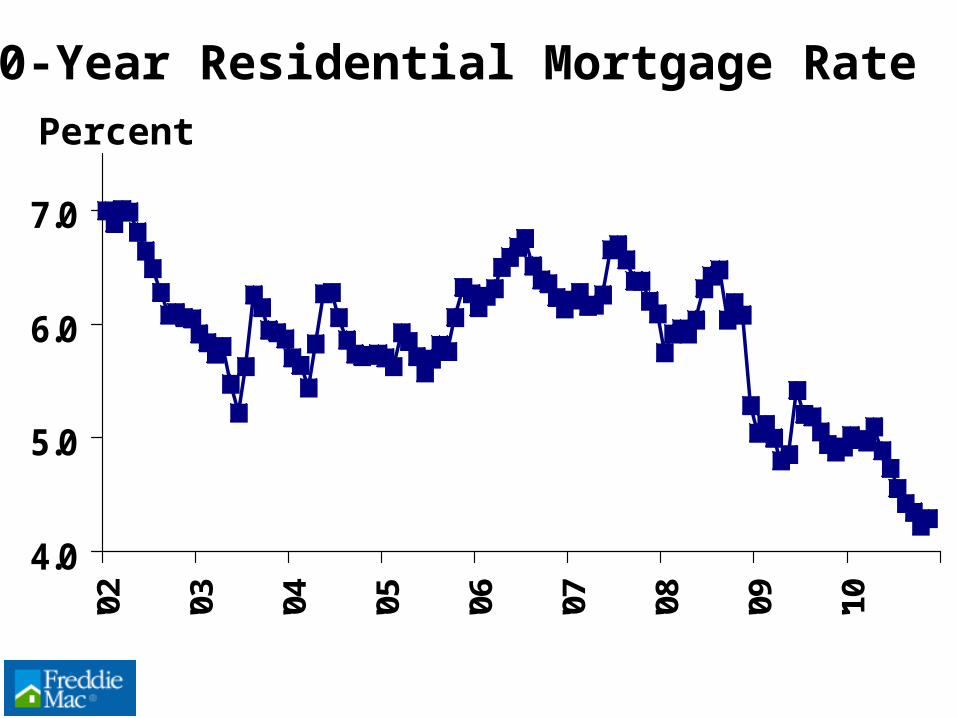
30-Year Residential Mortgage RatePercent
$0
$20
$40
$60
$80
$100
$120
$140
72 75 78 81 84 87 90 93 96 99 '02 '05 '08
2
5
8
11
14
17
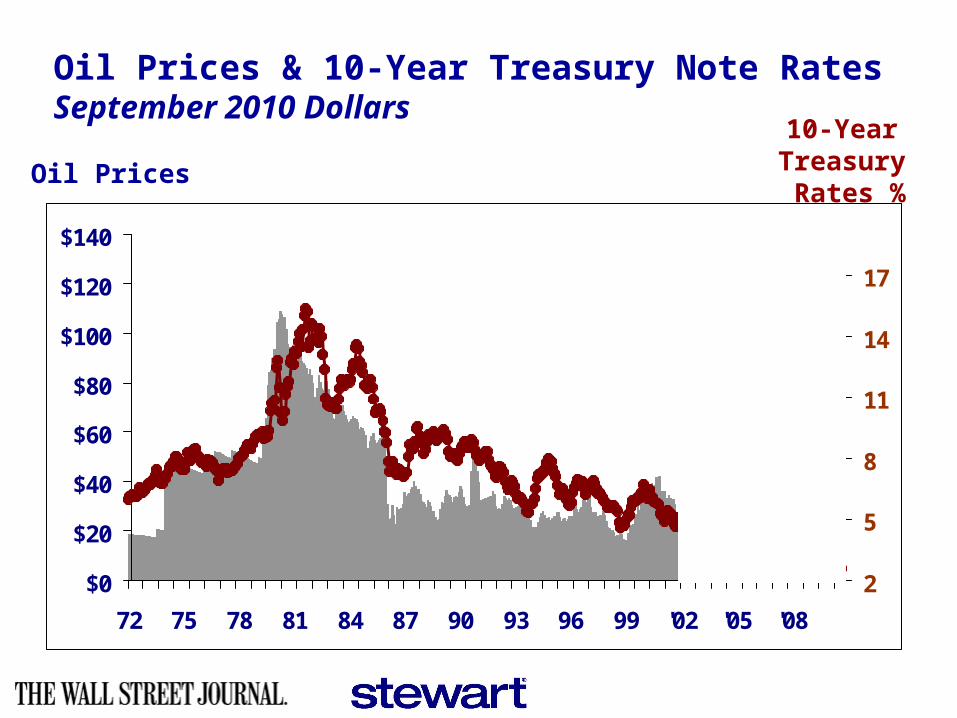
Oil Prices
10-Year Treasury Rates %
Oil Prices & 10-Year Treasury Note Rates
September 2010 Dollars
$20
$40
$60
$80
$100
$120
$140
'02 '03 '04 '05 '06 '07 '08 '09 '10
$0.85
$1.05
$1.25
$1.45
$1.65
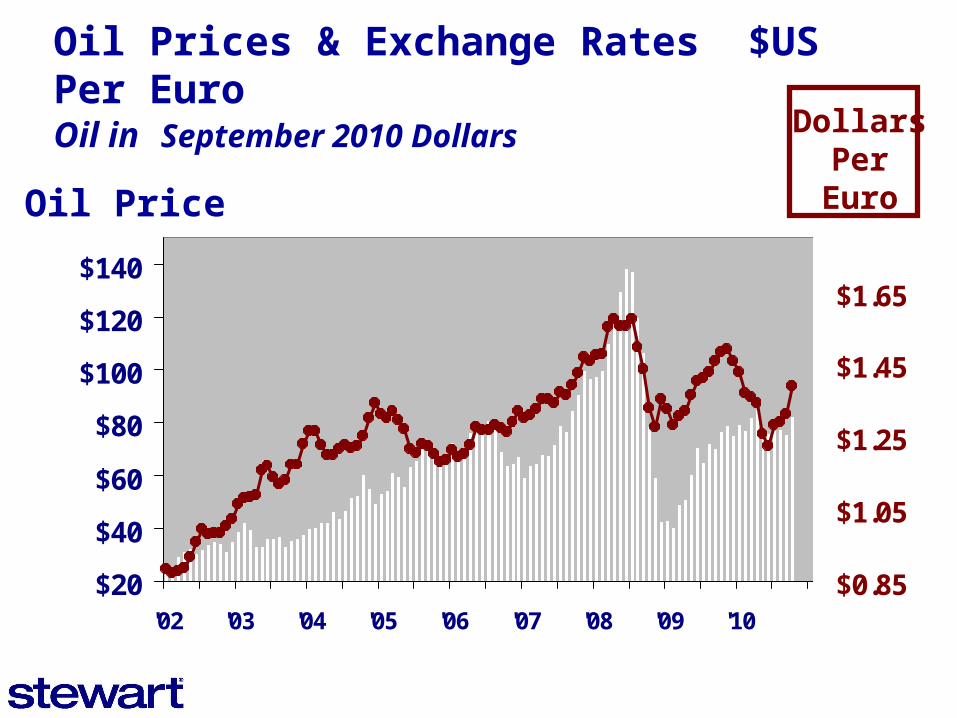
Oil Prices
DollarsPer
Euro
Oil Prices & Exchange Rates $US Per Euro Oil in September 2010 Dollars
Oil Price
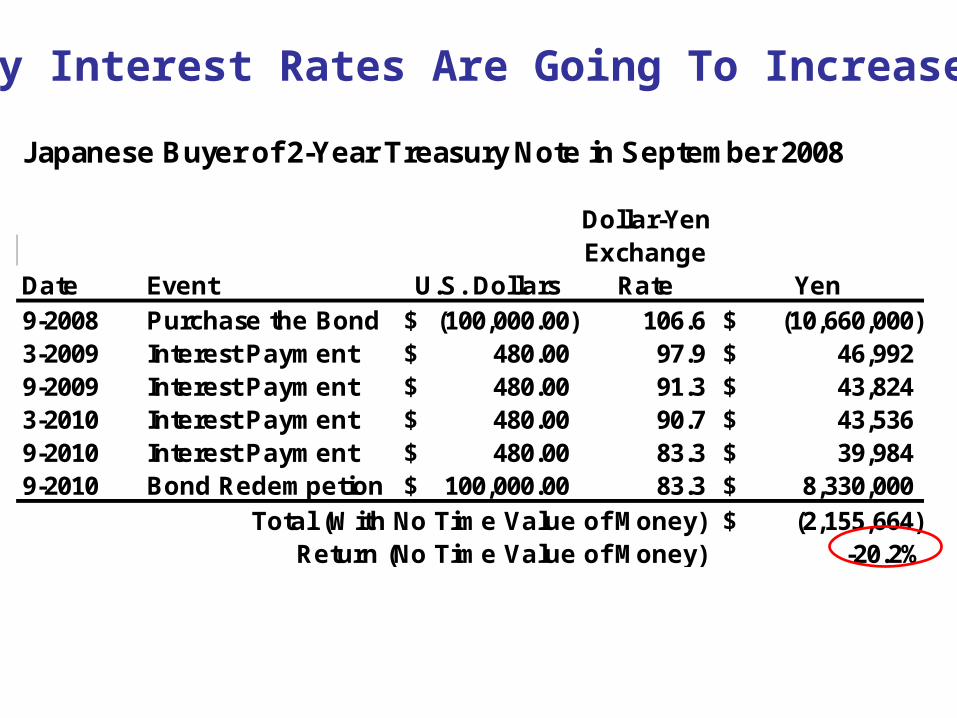
Japanese Buyer of 2-Year Treasury Note in September 2008
Dollar-YenExchange
Date Event U.S. Dollars Rate Yen9-2008 Purchase the Bond (100,000.00)$ 106.6 (10,660,000)$ 3-2009 Interest Payment 480.00$ 97.9 46,992$ 9-2009 Interest Payment 480.00$ 91.3 43,824$ 3-2010 Interest Payment 480.00$ 90.7 43,536$ 9-2010 Interest Payment 480.00$ 83.3 39,984$ 9-2010 Bond Redempetion 100,000.00$ 83.3 8,330,000$
Total (With No Time Value of Money) (2,155,664)$ Return (No Time Value of Money) -20.2%
Why Interest Rates Are Going To Increase
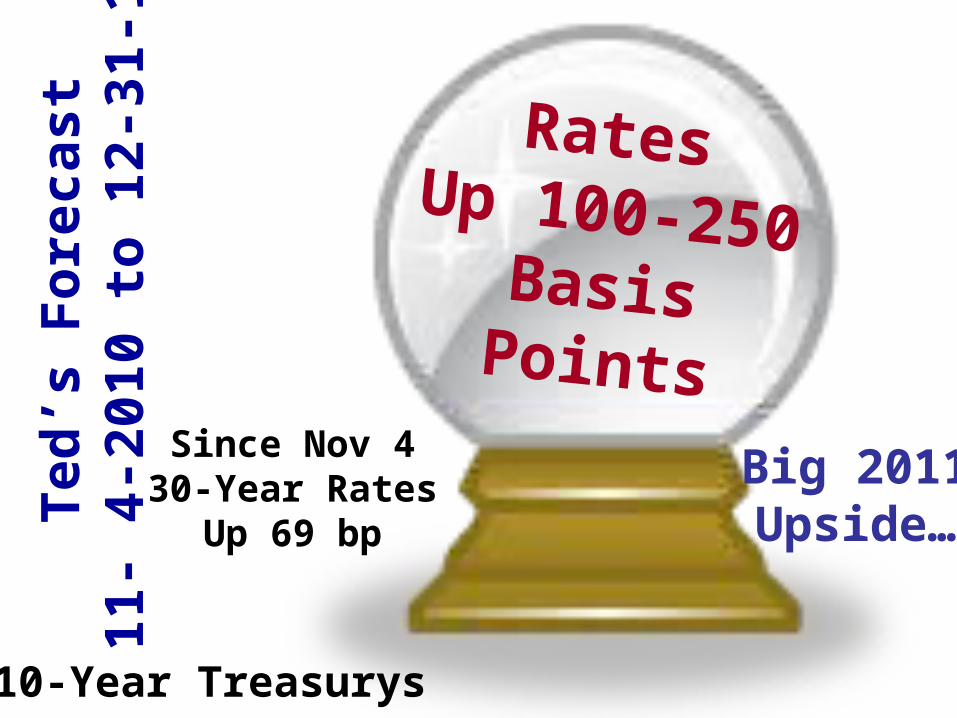
RatesUp 100-250
BasisPoints
Ted
’s F
ore
cast
11-
4-20
10 t
o 1
2-31
-11
Big 2011Upside…
10-Year Treasurys
Since Nov 430-Year Rates
Up 69 bp


So Goes Jobs,So Goes
Housing…….

3.0
4.0
5.0
6.0
7.0
8.0
'02 '03 '04 '05 '06 '07 '08 '09 '10
US Existing Home SalesSold (Millions)
National Association of REALTORS®
No
vem
ber
201
0
$8,000Tax
Credit
$0
$50
$100
$150
$200
$250
'01 '02 '03 '04 '05 '06 '07 '08 '09 '10
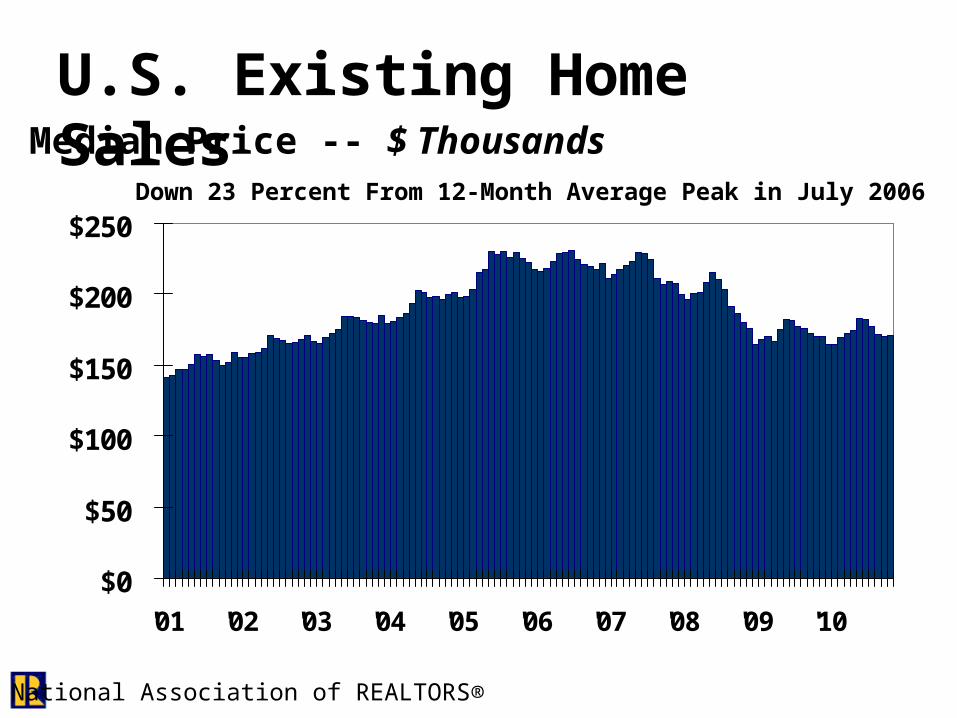
U.S. Existing Home SalesMedian Price -- $ Thousands
National Association of REALTORS®
Down 23 Percent From 12-Month Average Peak in July 2006
0
200
400
600
800
1,000
1,200
1,400
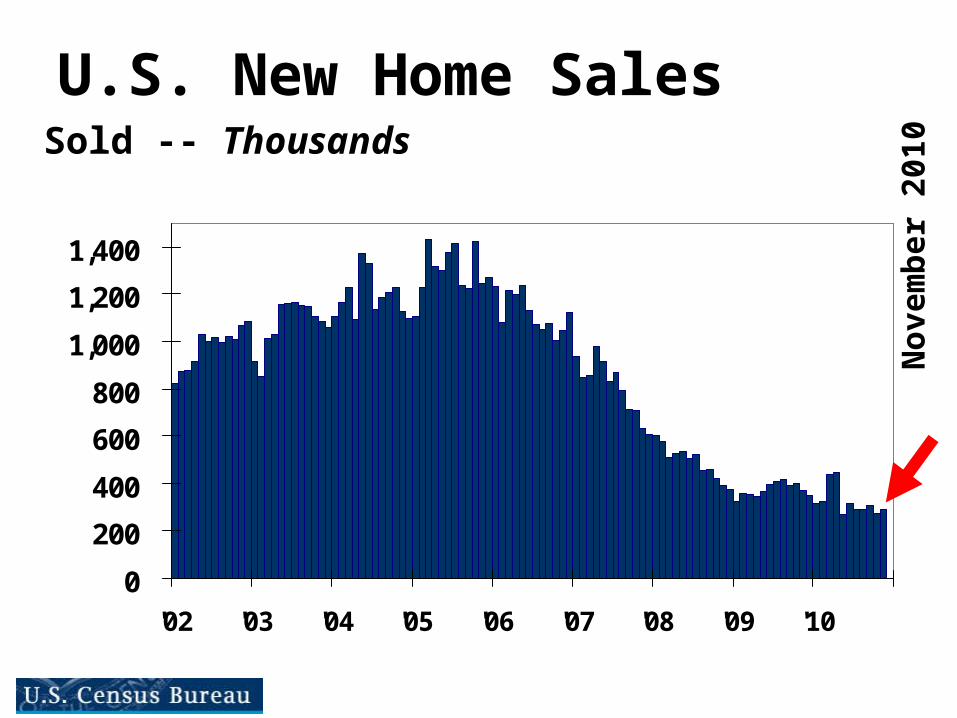
'02 '03 '04 '05 '06 '07 '08 '09 '10
U.S. New Home SalesSold -- Thousands
No
vem
ber
201
0
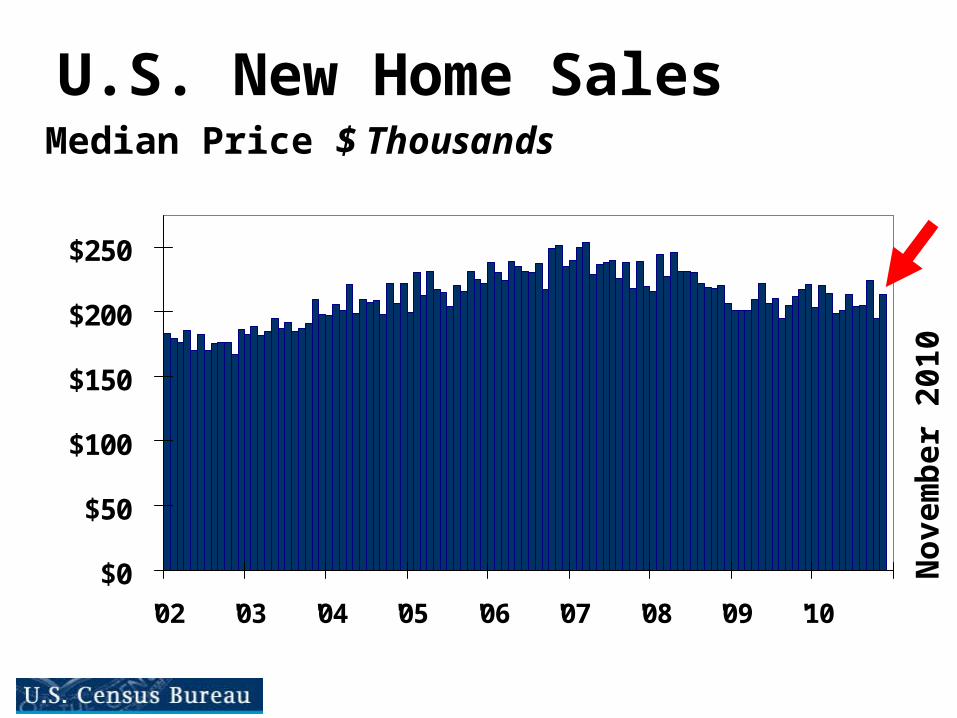
$0
$50
$100
$150
$200
$250
'02 '03 '04 '05 '06 '07 '08 '09 '10
U.S. New Home SalesMedian Price $ Thousands
No
vem
ber
201
0
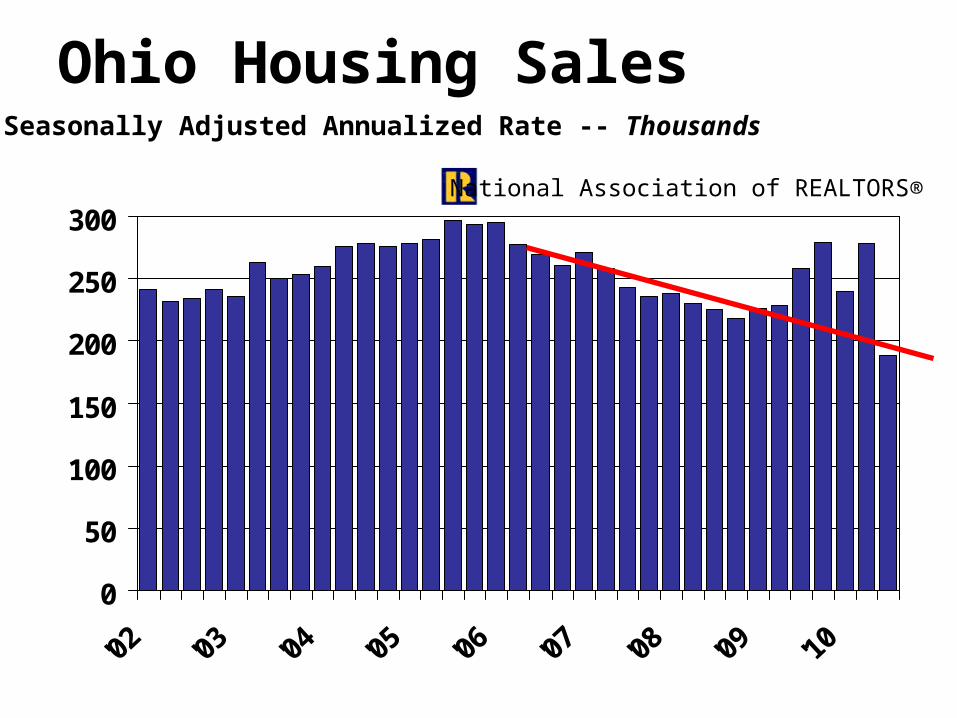
Ohio Housing Sales
0
50
100
150
200
250
300
'02 '03 '04 '05 '06 '07 '08 '09 '10
Seasonally Adjusted Annualized Rate -- Thousands
National Association of REALTORS®

Cleveland Housing Sales
$0
$25
$50
$75
$100
$125
$150
'02 '03 '04 '05 '06 '07 '08 '09 '10
Median Home Price -- $ Thousands
National Association of REALTORS®
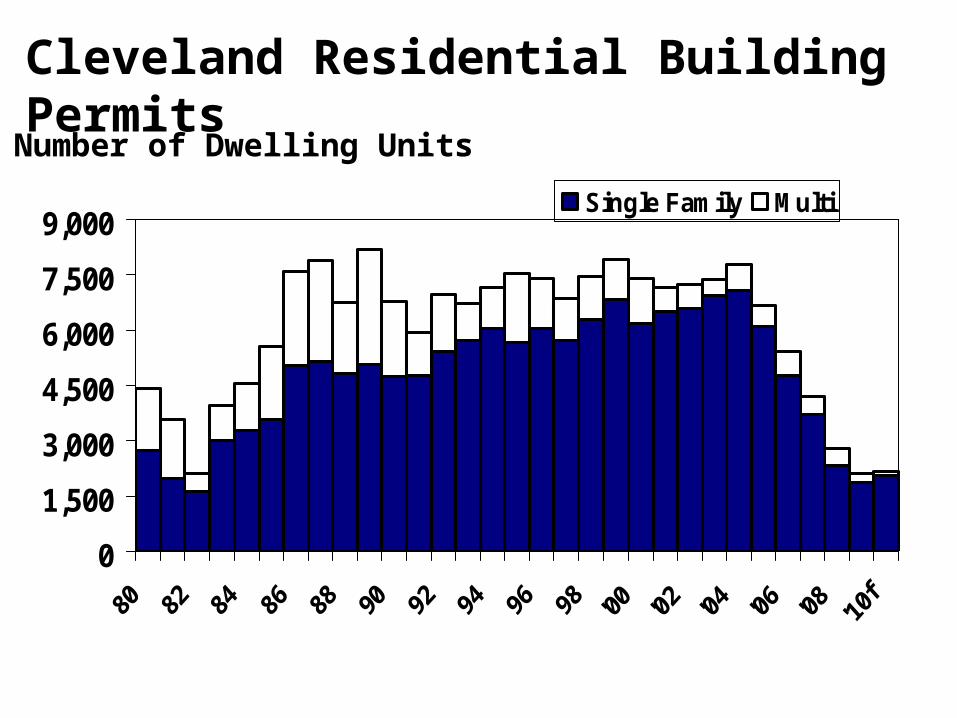
Cleveland Residential Building Permits
0
1,500
3,000
4,500
6,000
7,500
9,000Single Family Multi
Number of Dwelling Units
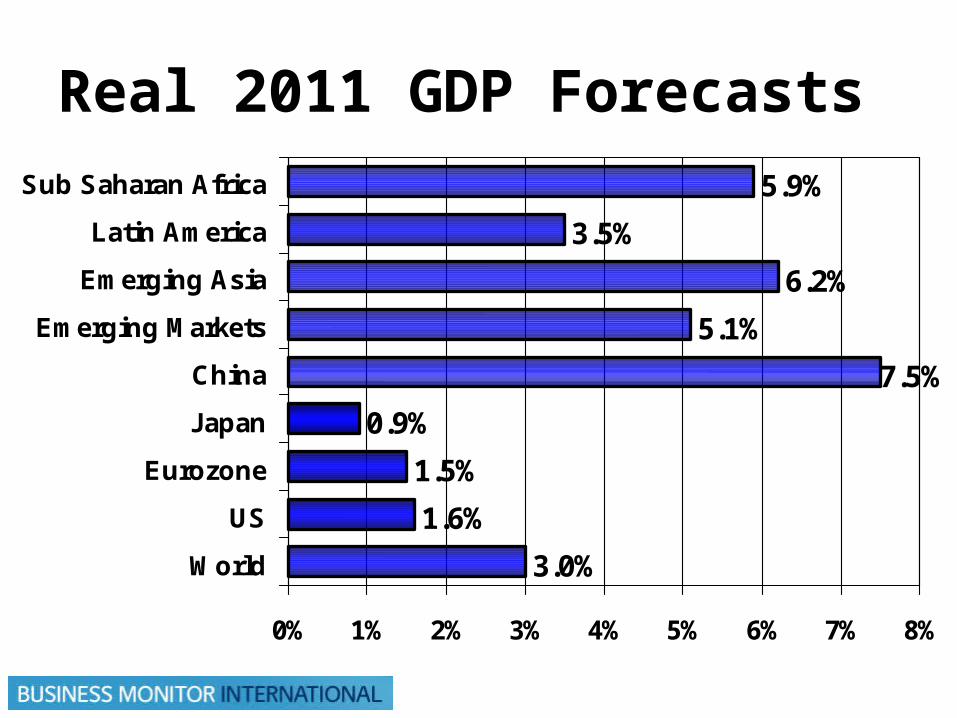
Real 2011 GDP Forecasts
3.0%
1.6%
1.5%
0.9%
5.1%
6.2%
3.5%
5.9%
7.5%
0% 1% 2% 3% 4% 5% 6% 7% 8%
World
US
Eurozone
Japan
China
Emerging Markets
Emerging Asia
Latin America
Sub Saharan Africa
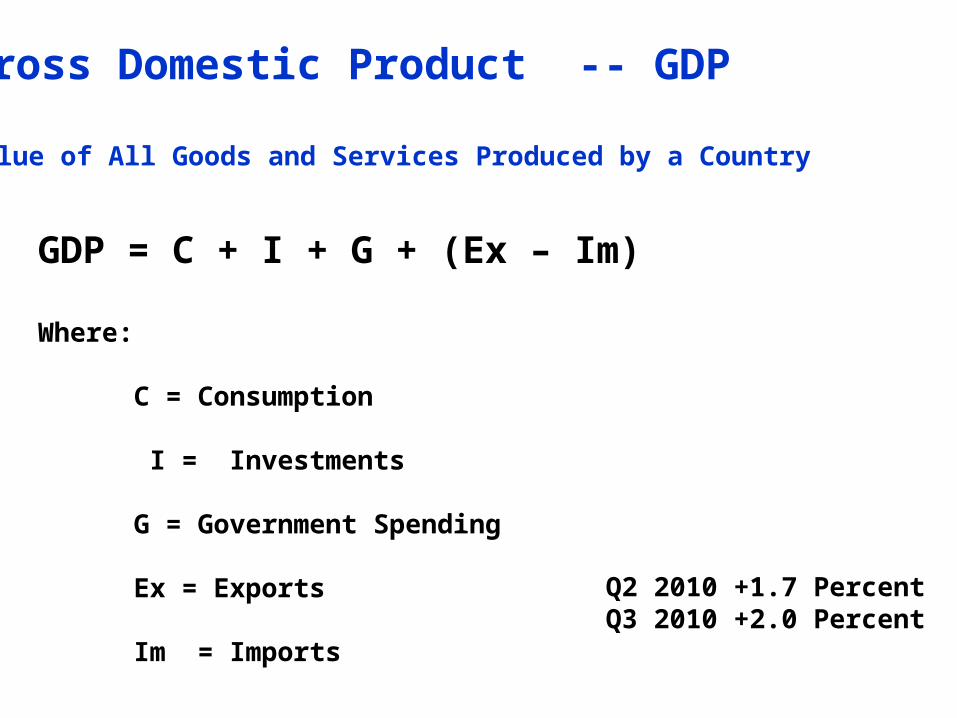
Gross Domestic Product -- GDP
Value of All Goods and Services Produced by a Country
GDP = C + I + G + (Ex – Im)
Where:
C = Consumption
I = Investments
G = Government Spending
Ex = Exports
Im = Imports
Q2 2010 +1.7 PercentQ3 2010 +2.0 Percent
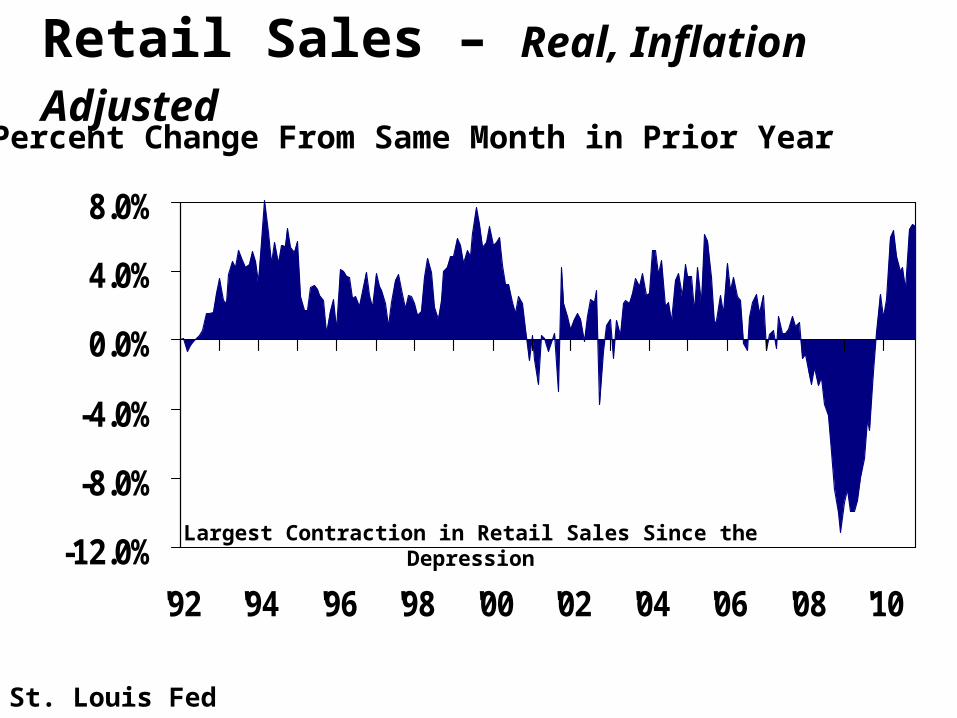
Retail Sales – Real, Inflation Adjusted
-12.0%
-8.0%
-4.0%
0.0%
4.0%
8.0%
'92 '94 '96 '98 '00 '02 '04 '06 '08 '10
Largest Contraction in Retail Sales Since the Depression
St. Louis Fed
Percent Change From Same Month in Prior Year

Investments????????????????????????????????????????????????????????????
????????????????
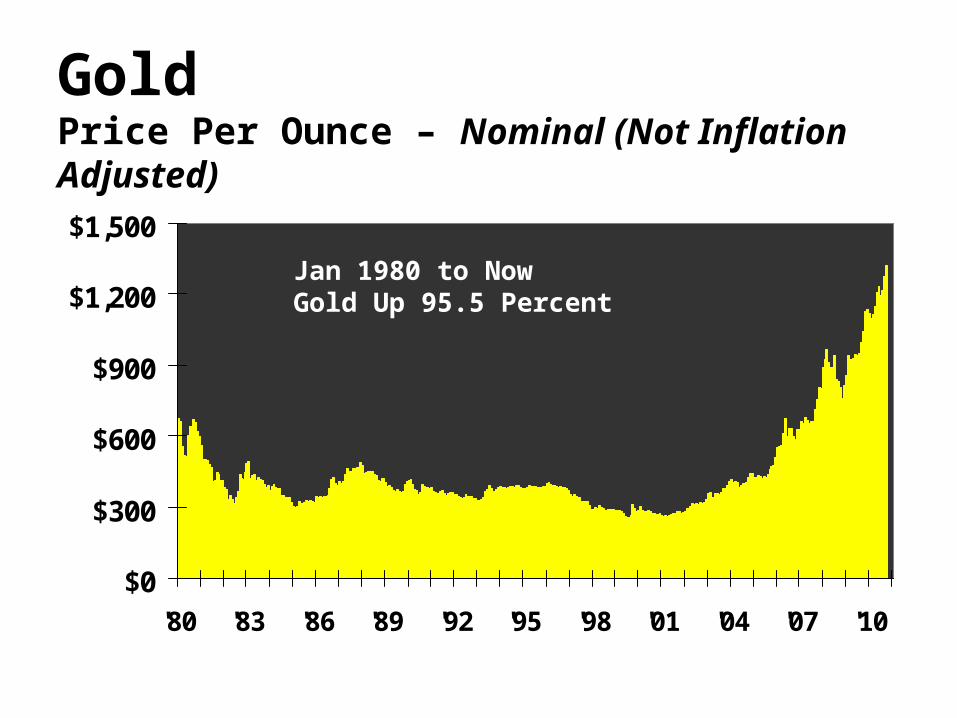
$0
$300
$600
$900
$1,200
$1,500
'80 '83 '86 '89 '92 '95 '98 '01 '04 '07 '10
GoldPrice Per Ounce – Nominal (Not Inflation Adjusted)
Jan 1980 to NowGold Up 95.5 Percent

$0$25$50$75
$100$125$150$175$200$225
'80 '82 '84 '86 '88 '90 '92 '94 '96 '98 '00 '02 '04 '06 '08 '10
Existing Home Prices$ Thousands --Nominal Average of MSA Medians
National Association of REALTORS®
Jan 1980 to NowHousing Up 252 Percent
$0
$400
$800
$1,200
$1,600
$2,000
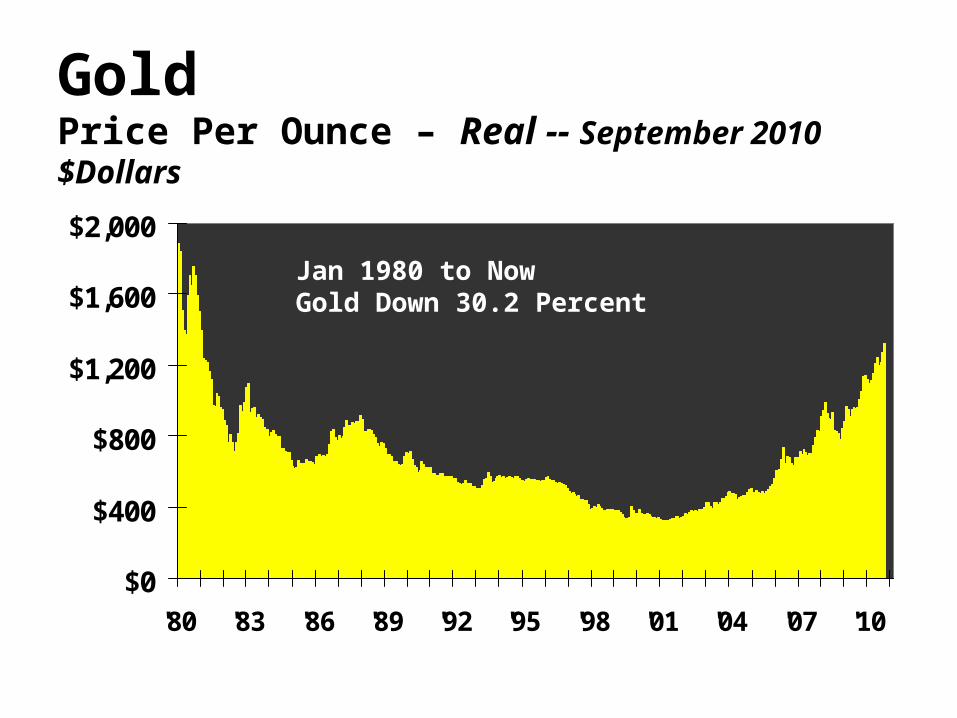
'80 '83 '86 '89 '92 '95 '98 '01 '04 '07 '10
GoldPrice Per Ounce – Real -- September 2010 $Dollars
Jan 1980 to NowGold Down 30.2 Percent
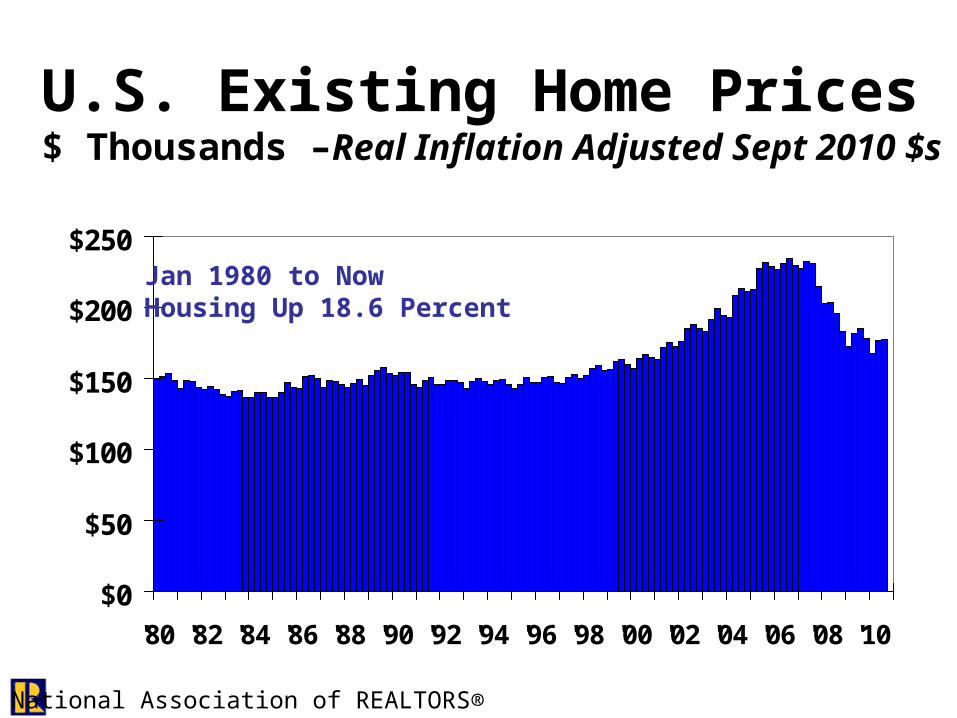
$0
$50
$100
$150
$200
$250
'80 '82 '84 '86 '88 '90 '92 '94 '96 '98 '00 '02 '04 '06 '08 '10
U.S. Existing Home Prices$ Thousands –Real Inflation Adjusted Sept 2010 $s
National Association of REALTORS®
Jan 1980 to NowHousing Up 18.6 Percent
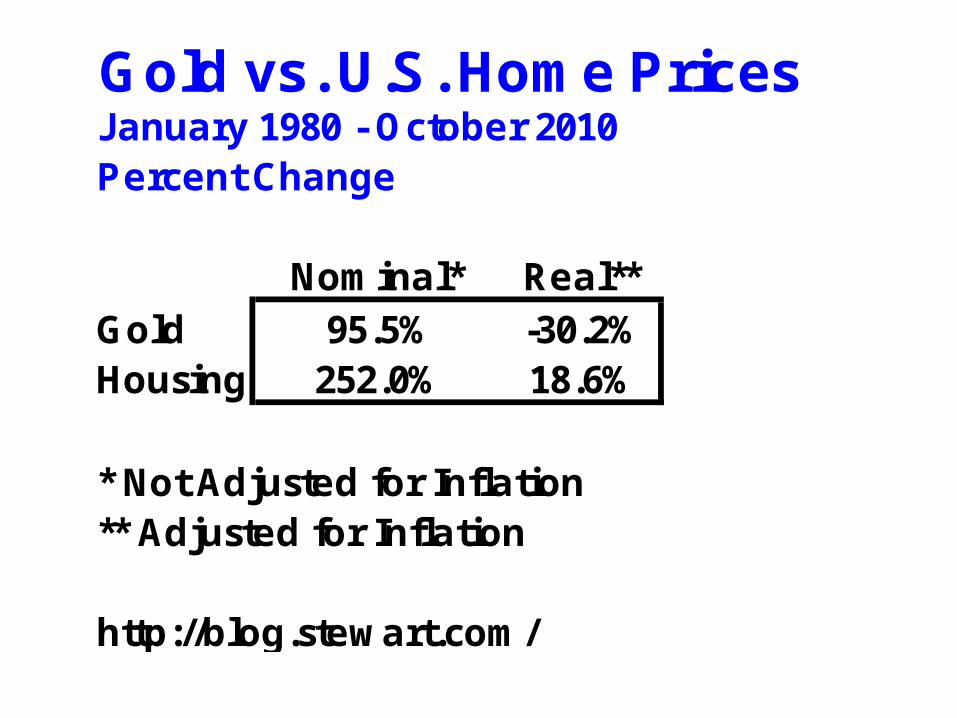
Gold vs. U.S. Home PricesJanuary 1980 - October 2010Percent Change
Nominal* Real**Gold 95.5% -30.2%Housing 252.0% 18.6%
* Not Adjusted for Inflation** Adjusted for Inflation
http://blog.stewart.com/

12Average Number of Homes Looked at by
2010 Homebuyers

Bond Yields
0
5
10
15
20
25
30
35
40
'97 '98 '99 '00 '01 '02 '03 '04 '05 '06 '07 '08 '09 '10
CCC & Less
B Corp
BB Corp
BBB Corp
A Corp
AA-AAA Corp
Percent Effective Yield
Merrill Lynch - Bloomberg
59
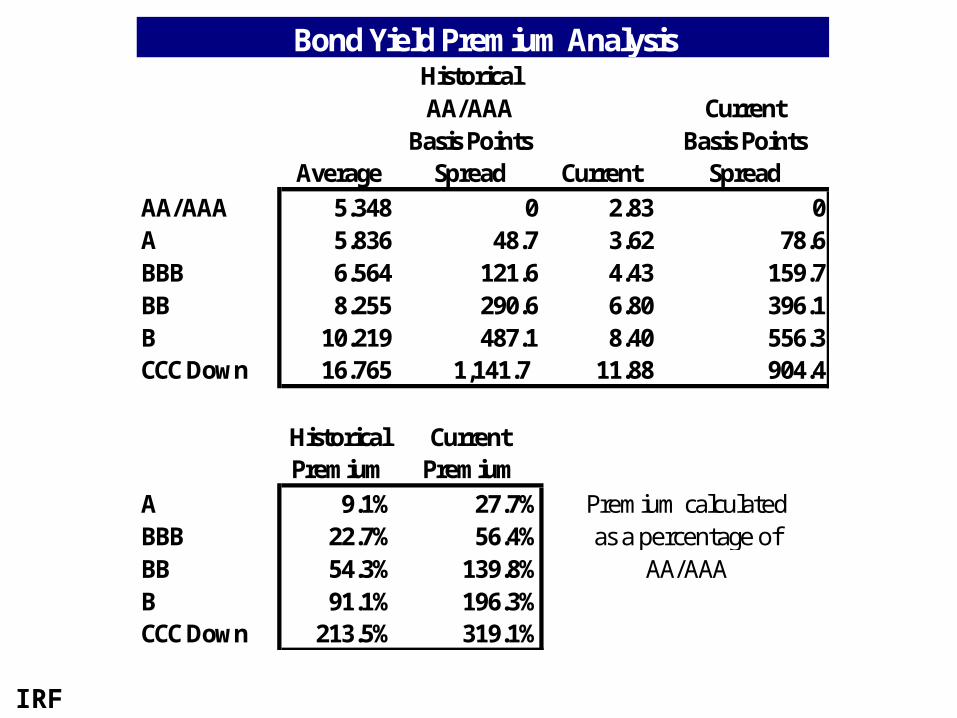
HistoricalAA/AAA Current
Basis Points Basis PointsAverage Spread Current Spread
AA/AAA 5.348 0 2.83 0A 5.836 48.7 3.62 78.6BBB 6.564 121.6 4.43 159.7BB 8.255 290.6 6.80 396.1B 10.219 487.1 8.40 556.3CCC Down 16.765 1,141.7 11.88 904.4
Historical CurrentPremium Premium
A 9.1% 27.7%BBB 22.7% 56.4%BB 54.3% 139.8%B 91.1% 196.3%CCC Down 213.5% 319.1%
Premium calculatedas a percentage of
AA/AAA
Bond Yield Premium Analysis
IRF

Some PositivesGleaned From the Painful Recession
i.e. Not Everything is Bad News
61
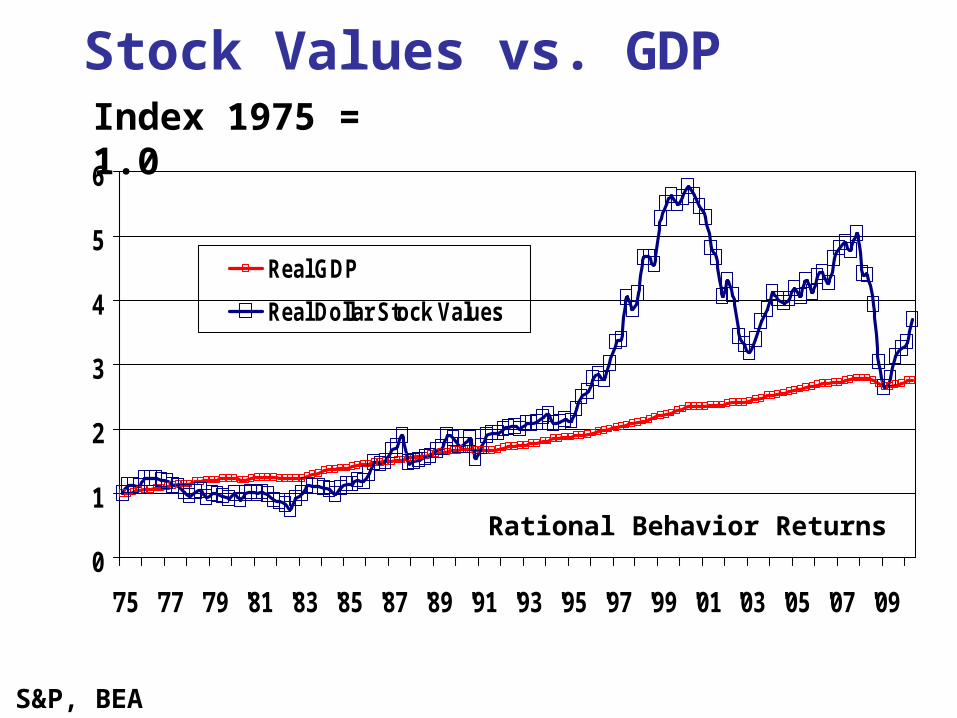
Stock Values vs. GDP
0
1
2
3
4
5
6
'75 '77 '79 '81 '83 '85 '87 '89 '91 '93 '95 '97 '99 '01 '03 '05 '07 '09
Real GDP
Real Dollar Stock Values
Index 1975 = 1.0
S&P, BEA
Rational Behavior Returns
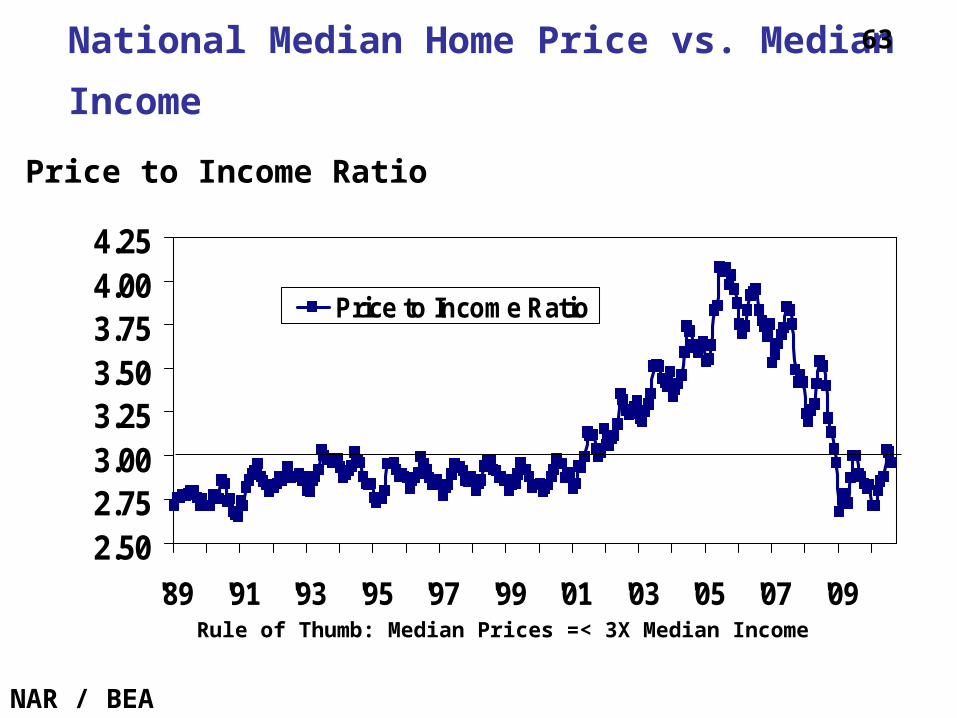
National Median Home Price vs. Median Income
2.502.753.003.253.503.754.004.25
'89 '91 '93 '95 '97 '99 '01 '03 '05 '07 '09
Price to Income Ratio
NAR / BEA
Price to Income Ratio
Rule of Thumb: Median Prices =< 3X Median Income
63
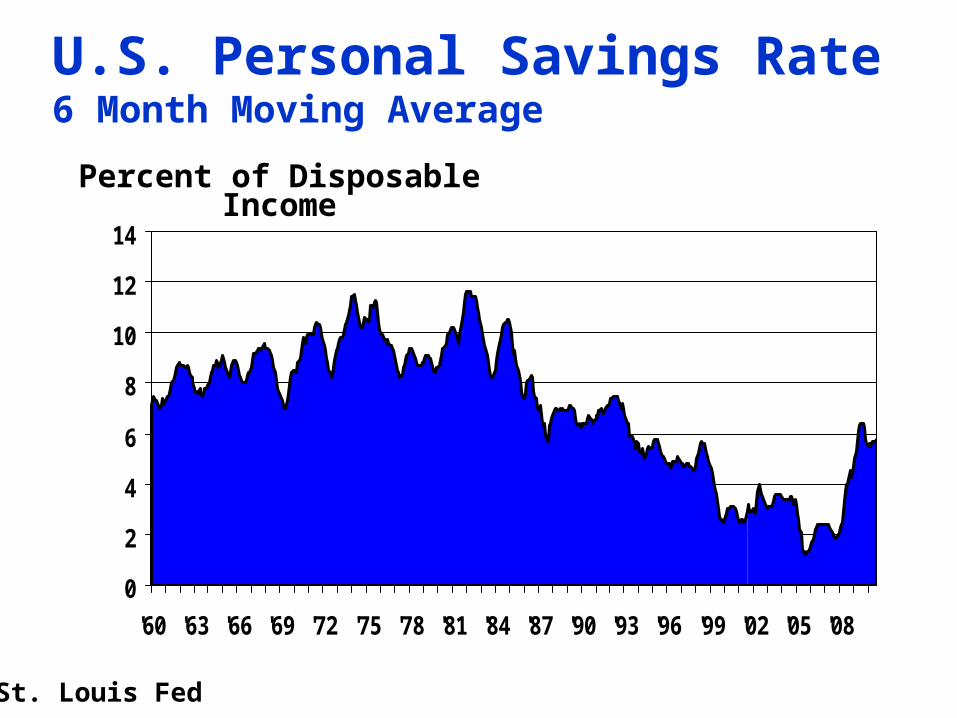
U.S. Personal Savings Rate6 Month Moving Average
0
2
4
6
8
10
12
14
'60 '63 '66 '69 '72 '75 '78 '81 '84 '87 '90 '93 '96 '99 '02 '05 '08
Percent of Disposable Income
St. Louis Fed
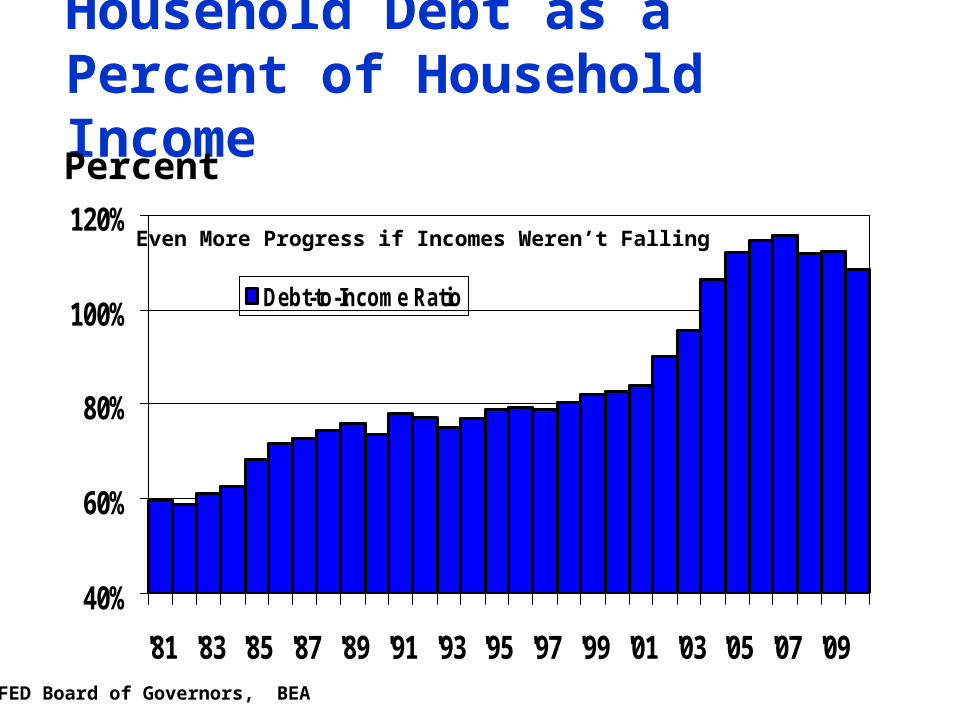
Household Debt as a Percent of Household Income
40%
60%
80%
100%
120%
'81 '83 '85 '87 '89 '91 '93 '95 '97 '99 '01 '03 '05 '07 '09
Debt-to-Income Ratio
Percent
FED Board of Governors, BEA
Even More Progress if Incomes Weren’t Falling
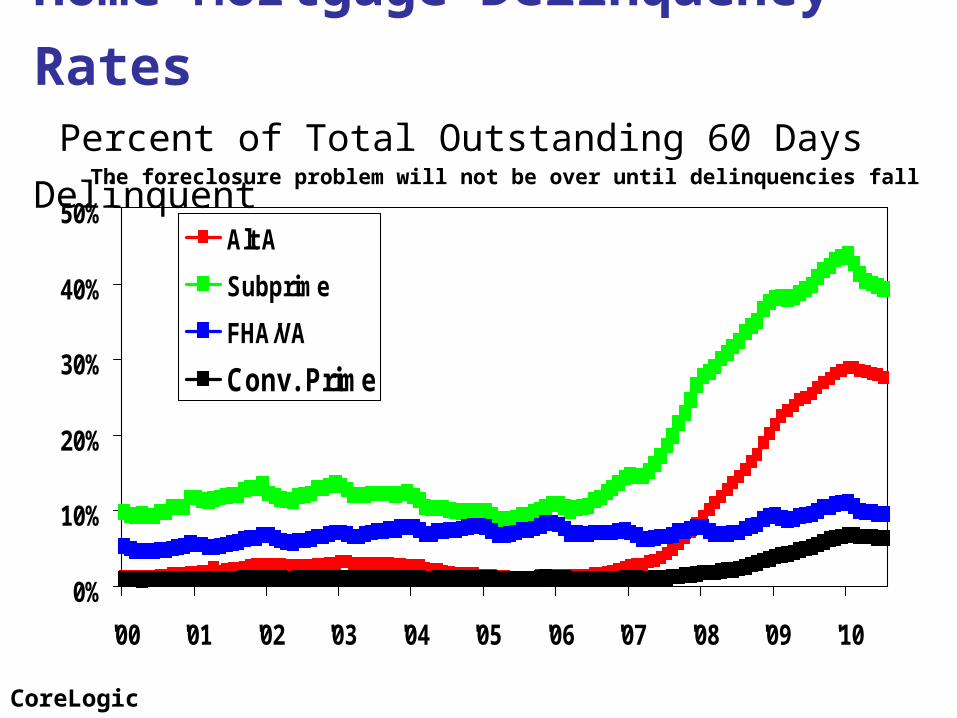
Home Mortgage Delinquency Rates Percent of Total Outstanding 60 Days Delinquent
0%
10%
20%
30%
40%
50%
'00 '01 '02 '03 '04 '05 '06 '07 '08 '09 '10
Alt A
Subprime
FHA/VA
Conv. Prime
CoreLogic
The foreclosure problem will not be over until delinquencies fall
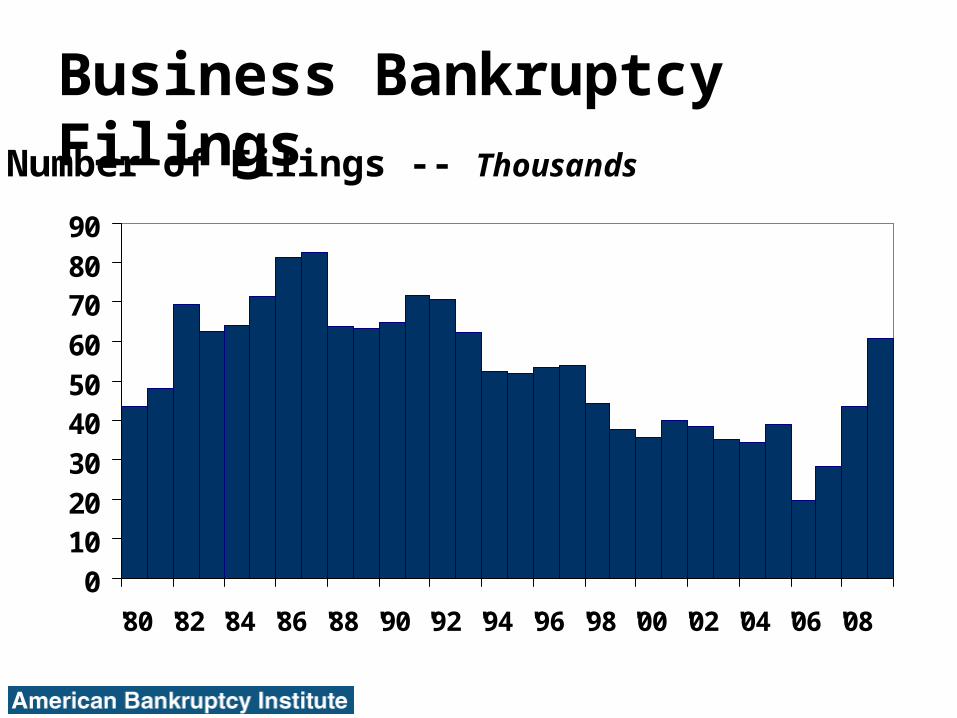
0102030405060708090
'80 '82 '84 '86 '88 '90 '92 '94 '96 '98 '00 '02 '04 '06 '08
Business Bankruptcy FilingsNumber of Filings -- Thousands

0
300
600
900
1,200
1,500
1,800
2,100
2,400
'80 '82 '84 '86 '88 '90 '92 '94 '96 '98 '00 '02 '04 '06 '08
Non-Business Bankruptcy Filings
Number of Filings -- Thousands
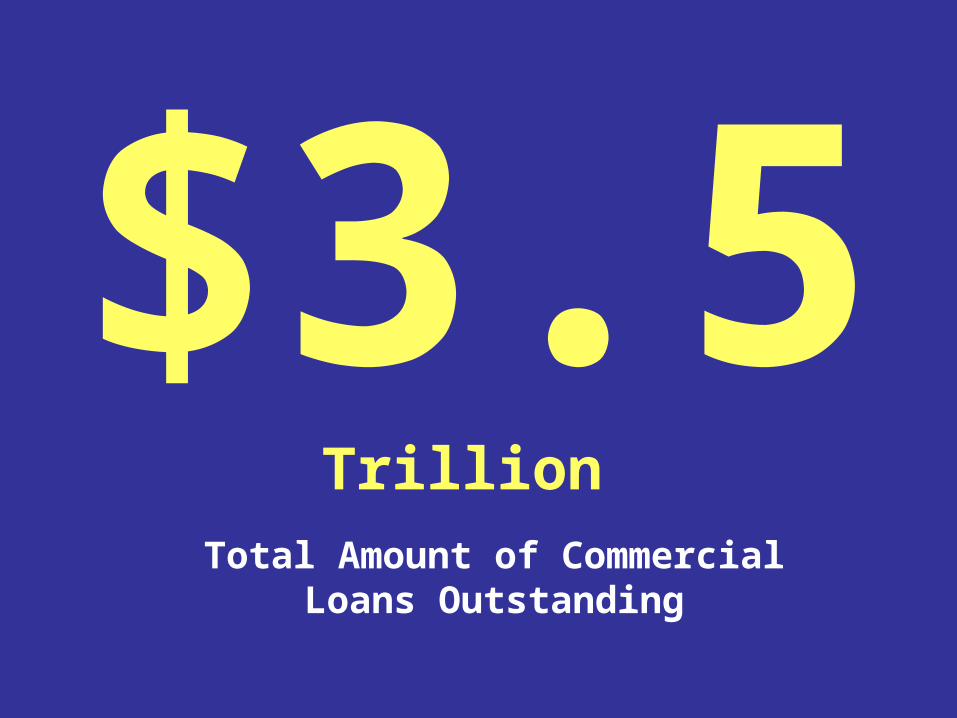
$3.5 Trillion
Total Amount of CommercialLoans Outstanding

2.5 Million
U.S. Commercial OfficeSpace Absorbed in Q4 2010
(first positive in 3 years
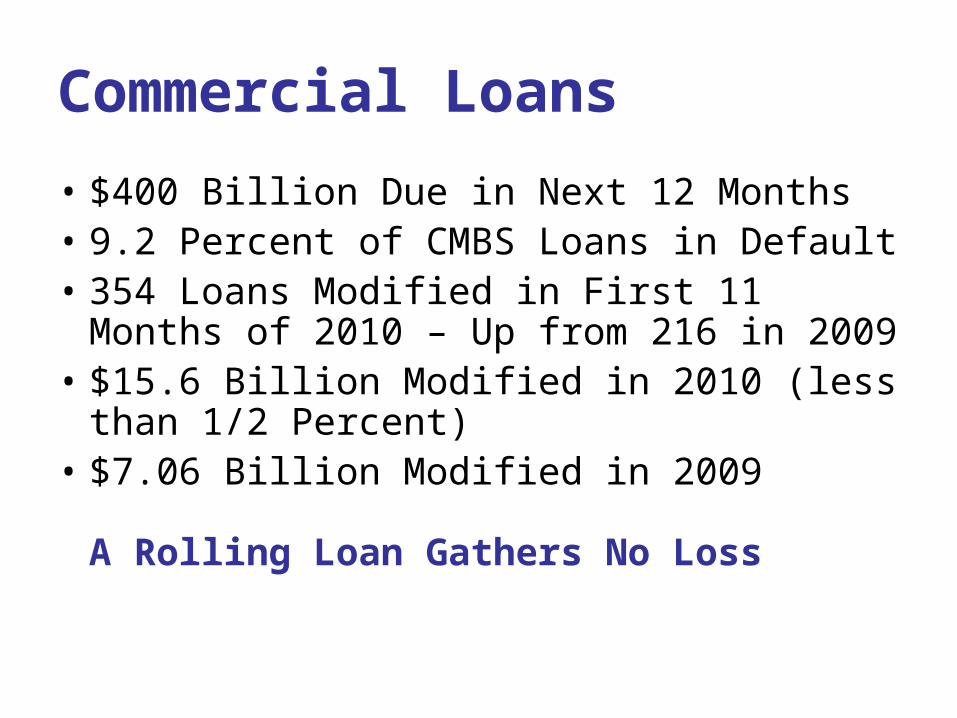
Commercial Loans
• $400 Billion Due in Next 12 Months• 9.2 Percent of CMBS Loans in Default• 354 Loans Modified in First 11 Months of
2010 – Up from 216 in 2009• $15.6 Billion Modified in 2010 (less than
1/2 Percent)• $7.06 Billion Modified in 2009
A Rolling Loan Gathers No Loss
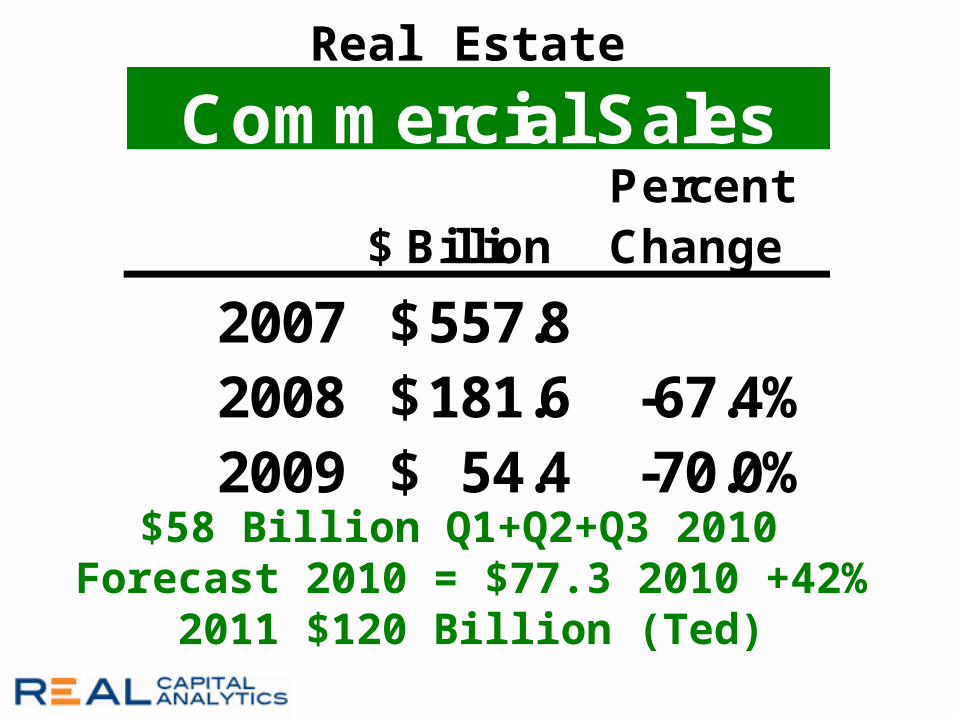
Percent$ Billion Change
2007 557.8$ 2008 181.6$ -67.4%2009 54.4$ -70.0%
Commercial Sales
$58 Billion Q1+Q2+Q3 2010 Forecast 2010 = $77.3 2010 +42%
2011 $120 Billion (Ted)
Real Estate
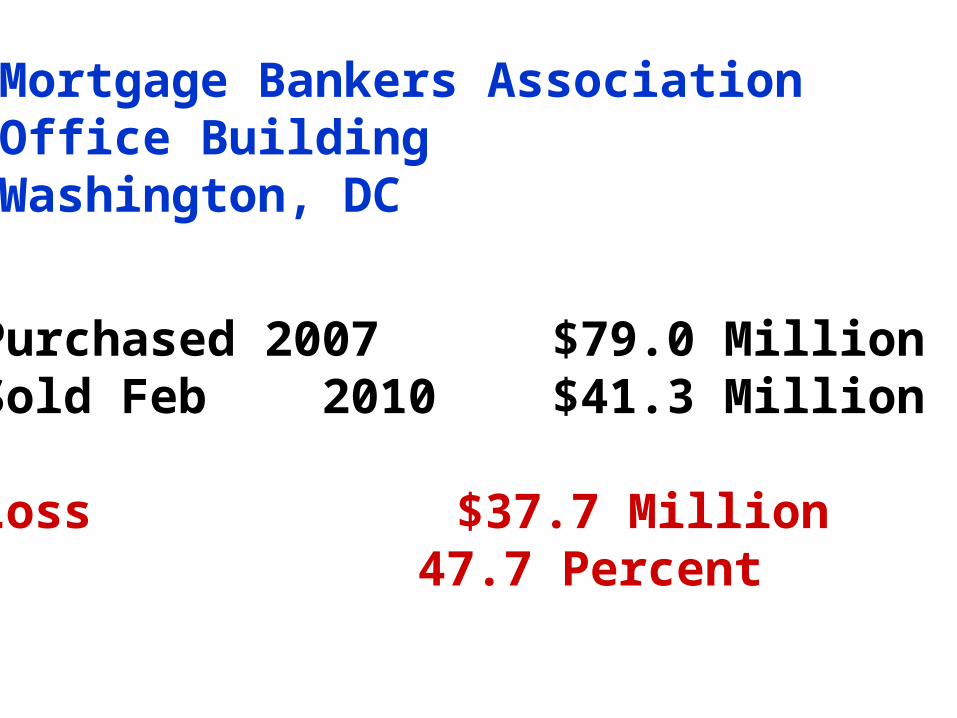
Mortgage Bankers Association Office BuildingWashington, DC
Purchased 2007 $79.0 MillionSold Feb 2010 $41.3 Million
Loss $37.7 Million 47.7 Percent
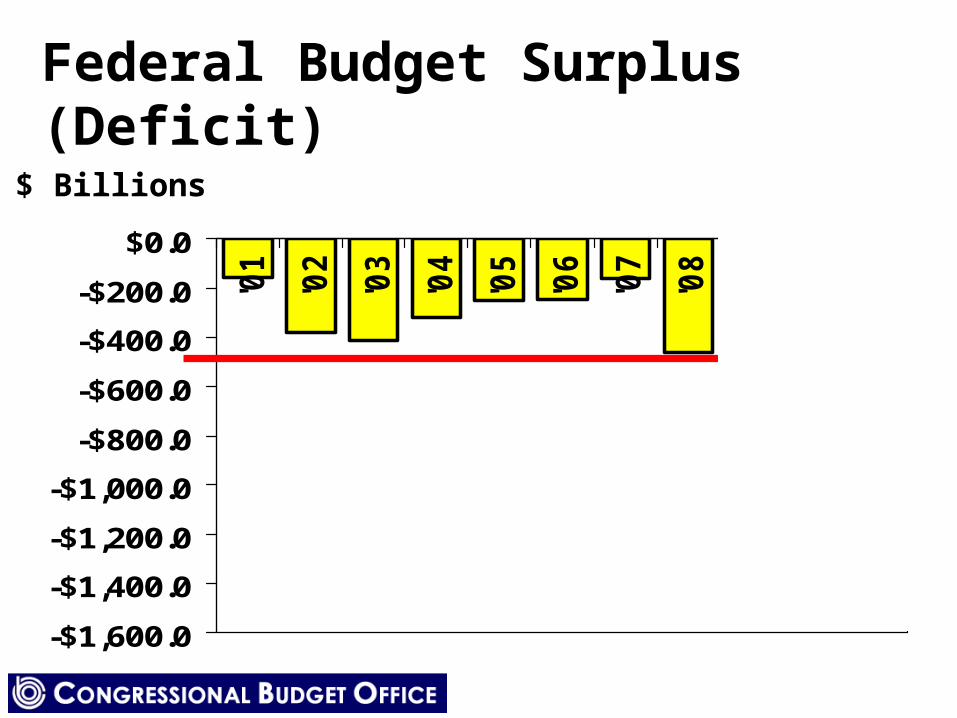
Federal Budget Surplus (Deficit)
-$1,600.0
-$1,400.0
-$1,200.0
-$1,000.0
-$800.0
-$600.0
-$400.0
-$200.0
$0.0'0
1
'02
'03
'04
'05
'06
'07
'08
'09
'10f
'11f
$ Billions
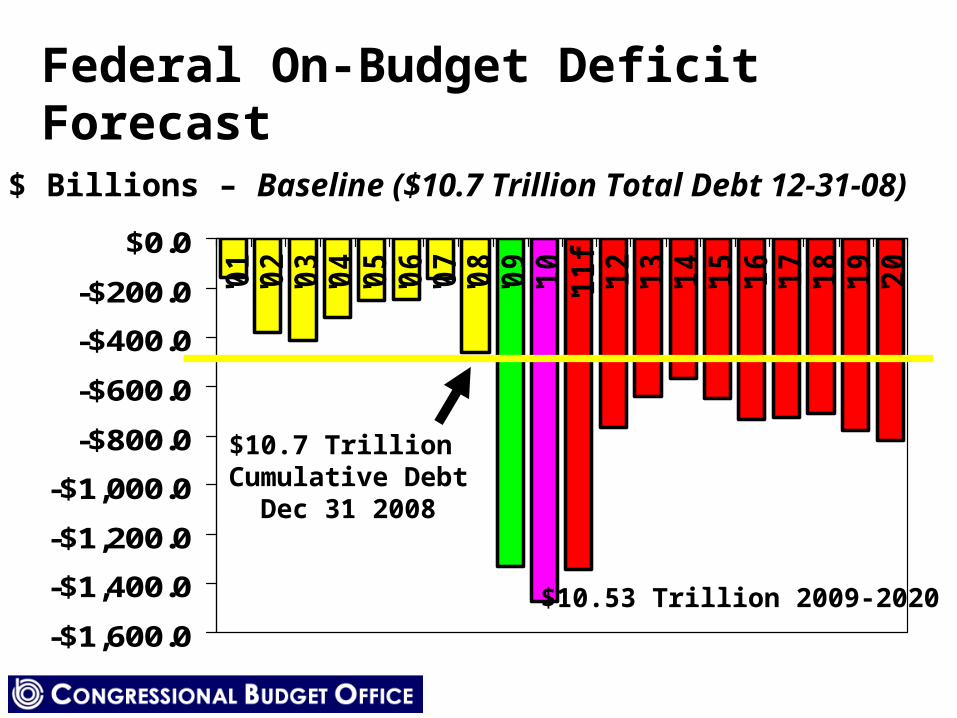
Federal On-Budget Deficit Forecast
-$1,600.0
-$1,400.0
-$1,200.0
-$1,000.0
-$800.0
-$600.0
-$400.0
-$200.0
$0.0'0
1'0
2'0
3'0
4'0
5'0
6'0
7'0
8'0
9'1
0'1
1f
'12
'13
'14
'15
'16
'17
'18
'19
'20
$ Billions – Baseline ($10.7 Trillion Total Debt 12-31-08)
$10.53 Trillion 2009-2020
$10.7 Trillion Cumulative Debt
Dec 31 2008
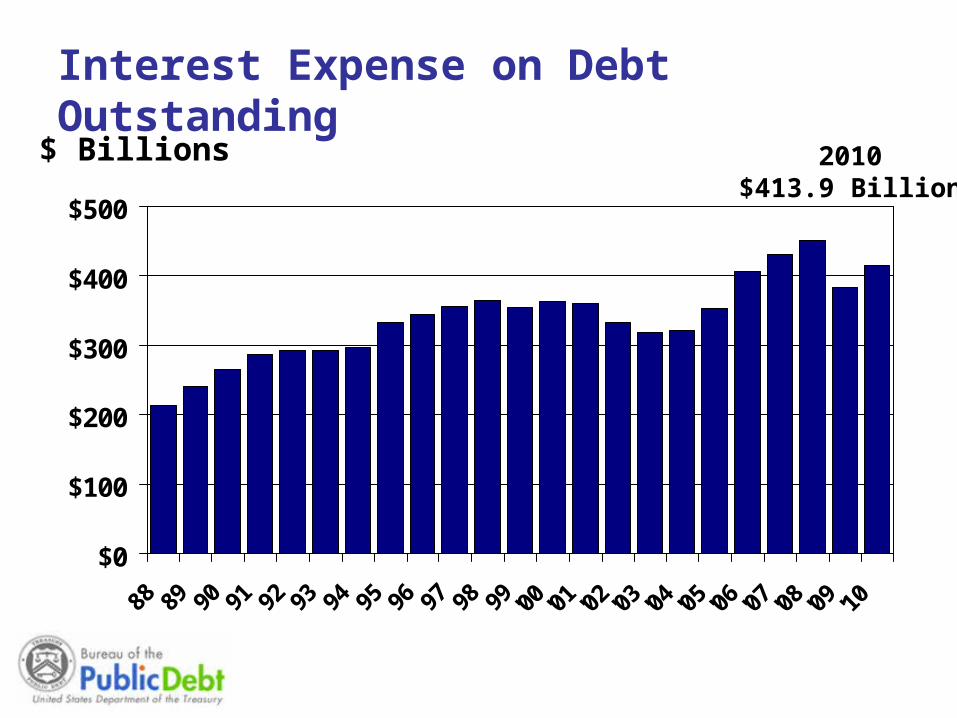
Interest Expense on Debt Outstanding
$0
$100
$200
$300
$400
$500
88 89 90 91 92 93 94 95 96 97 98 99 '00 '01 '02 '03 '04 '05 '06 '07 '08 '09 '10
$ Billions 2010$413.9 Billion
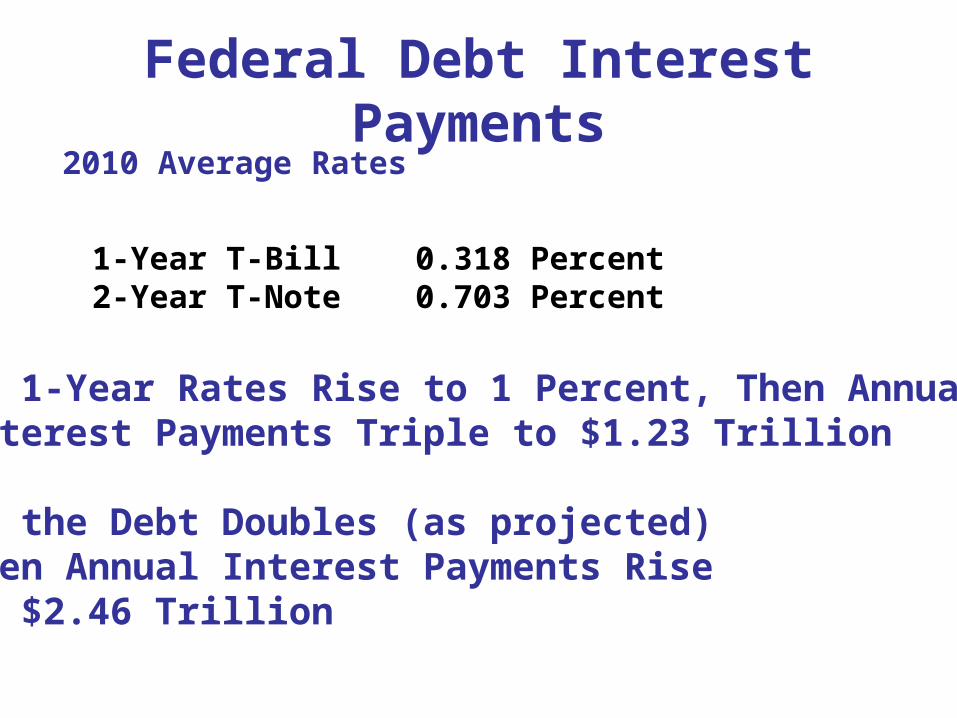
Federal Debt Interest Payments
1-Year T-Bill 0.318 Percent2-Year T-Note 0.703 Percent
2010 Average Rates
If 1-Year Rates Rise to 1 Percent, Then Annual Interest Payments Triple to $1.23 Trillion
If the Debt Doubles (as projected)Then Annual Interest Payments Rise to $2.46 Trillion

Ted’s Bloghttp://blog.stewart.com/
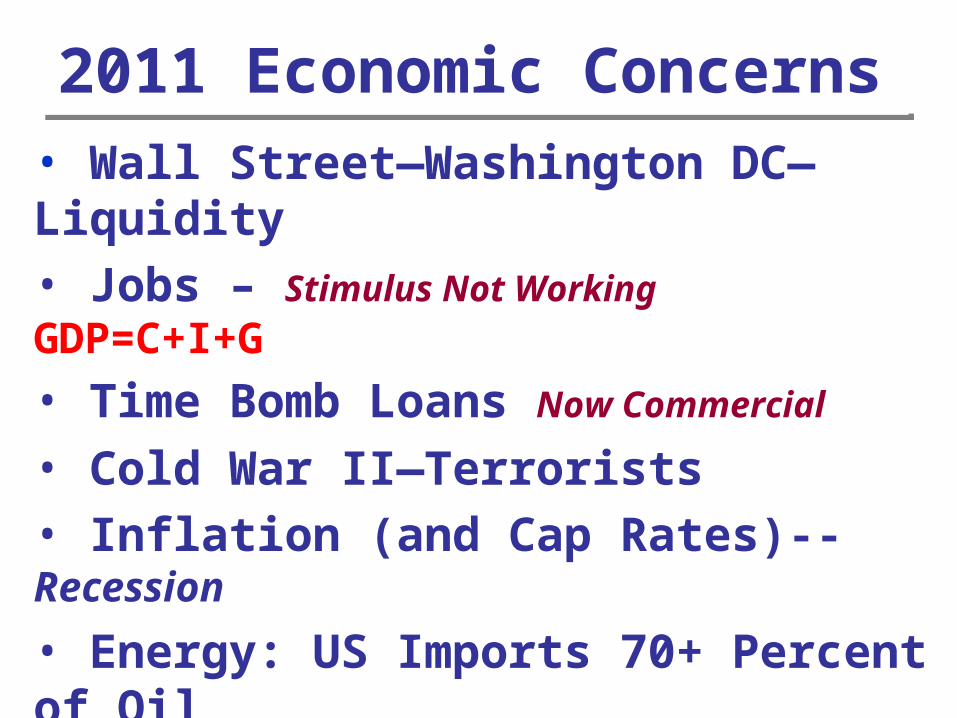
2011 Economic Concerns• Wall Street—Washington DC—Liquidity• Jobs – Stimulus Not Working GDP=C+I+G
• Time Bomb Loans Now Commercial
• Cold War II—Terrorists• Inflation (and Cap Rates)--Recession
• Energy: US Imports 70+ Percent of Oil
• Real Estate-Autos-Credit Cards-Banks


Ted C. Jones, PhD Chief Economist
Stewart Title Guaranty Co.
http://blog.stewart.com/

Ted C. Jones, PhD Chief Economist Stewart Title Guaranty Co.
http://blog.stewart.com/

Ted C. Jones, PhD Chief Economist
Stewart Title Guaranty Co.
http://blog.stewart.com/

Ted C. Jones, PhD Chief Economist
Stewart Title Guaranty Co. http://blog.stewart.com/