historical vegetation of three salmon-bearing watersheds
TRANSCRIPT
PSU McNair Scholars Online Journal PSU McNair Scholars Online Journal
Volume 8 Issue 1 The Impact of Innovation: New Frontiers in Undergraduate Research
Article 4
2014
Historical Vegetation of Three Salmon-Bearing Historical Vegetation of Three Salmon-Bearing
Watersheds in the Interior Columbia River Basin Watersheds in the Interior Columbia River Basin
Tyanna Smith Portland State University
Follow this and additional works at: https://pdxscholar.library.pdx.edu/mcnair
Part of the Aquaculture and Fisheries Commons, and the Terrestrial and Aquatic Ecology Commons
Let us know how access to this document benefits you.
Recommended Citation Recommended Citation Smith, Tyanna (2014) "Historical Vegetation of Three Salmon-Bearing Watersheds in the Interior Columbia River Basin," PSU McNair Scholars Online Journal: Vol. 8: Iss. 1, Article 4. https://doi.org/0.15760/mcnair.2014.29
This open access Article is distributed under the terms of the Creative Commons Attribution-NonCommercial-ShareAlike 4.0 International License (CC BY-NC-SA 4.0). All documents in PDXScholar should meet accessibility standards. If we can make this document more accessible to you, contact our team.

1
Portland State University McNair Research Journal 2014
Historical vegetation of three salmon-bearing watersheds in the interior Columbia River basin
By Tyanna Smith
Mentor: Seth White
Smith, Tyanna. (2014) “Historical vegetation of three salmon-bearing watersheds
in the interior Columbia River Basin” Portland State University McNair Scholars
Online Journal, Vol. 8, 2014

1
Abstract Land use practices can be a contributing factor to environmental degradation and have been the focus of many ecological studies. One aspect that is less addressed is land use history and the effects that past practices, such as logging and grazing, can have on the current landscape. This paper describes research and the synthesis of material on the environmental history and watershed characteristics for three watersheds located within spawning and rearing areas for Chinook salmon in the Grande Ronde River Basin in Northeast Oregon: upper Grande Ronde River, Catherine Creek, and Minam River. The Grande Ronde Basin is critical spawning and rearing habitat for salmonids listed under the Endangered Species Act. The primary historical data sources for reconstructing 19th century stream and riparian conditions are the General Land Office township survey notes from 1863 - 1901. Data about the habitat conditions of the landscape were extracted from notes of each township survey source regarding vegetation, stream crossings, and other features found on the landscape in tabular and spatial forms. Data were organized to describe common stream and riparian conditions for the historical time period using a geographic information system. Watershed basin, Chinook salmon life history, ecoregion and surveyor were analyzed using multivariate techniques to determine which parameters were strongly connected to historical vegetation. Ecoregion had the strongest correlation with plant communities. For future research, these historical data could be compared to current habitat survey data, such as the Oregon Department of Fish & Wildlife’s Aquatic Habitat Inventories, to evaluate the degree of change over time of stream and riparian conditions.
Introduction Land use practices, past and current, in watersheds can have negative impacts on the structure and proper function of water bodies (Maloney et al., 2008; Harding, Benfield, Bolstad, Helfman, & Jones, 1998). Humans have influenced the environment on a landscape scale and have disrupted the geomorphic and riparian processes that maintain streams and rivers and their biota. This can result in stream habitat that is degraded and less heterogeneous (Allan, 2004). Agriculture is the main land use activity by humans that covers the largest fraction of land area, or watershed catchment areas, in many developed watersheds (Allan, 2004). Urban areas usually make up a small percentage of total catchment areas, but often have a large influence on the associated rivers and streams. Other types of land use that negatively affect streams are forestry, mining and recreation (Allan, 2004), which are predominant within the study area. The negative impacts from land use come in various forms. Agriculture is present in the project area and has many different effects on watersheds. Effects that can harm salmon habitat include soil erosion, sediment transport and deposition downstream, on-site pollution from overuse and secondary effects of fertilizers and pesticides, off-site pollution of adjacent areas, deforestation, desertification, degradation of aquifers, salinization, accumulation of toxic metals and organic compounds, and loss of biodiversity (Botkin & Keller, 2009). An overload of nutrients can lead to algal growth, deposition, and decomposition by bacteria which consume a majority of the dissolved oxygen in the stream (Murdoch, Cheo, & O’laughlin, 2001). Deforestation caused by agriculture, forestry, or long-term grazing can increase soil erosion and delivery of sediment into the stream channels, expose impermeable lower soil layers, and reduce the amount of canopy cover over the streams. In general, an overload of sediment into streams can result in channels being less sinuous, broader and shallower (Charlton, 2008).

2
Another important impact within our project area is cattle grazing. Cattle, grazing in the riparian zones of streams, trample the banks and consume high amounts of vegetation, destabilizing the bank and resulting in erosion. At high grazing densities, cattle can consume the vegetation faster than it can grow, which results in the loss of some plant species and a dominance of less beneficial species (Botkin & Keller, 2009). Overgrazing of riparian areas can result in destruction of fish habitat by removing overhanging vegetation, which fish use for cover and by sloughing stream banks (White & Rahel, 2008). These land use types have negative effects on the environment and have been well studied. However, there has been comparatively less research on historical agricultural practices and other types of historic land use and how this may still be affecting the environment or determining its current state. Recently there have been articles published on the environmental history of an area from the recognition that it plays a large role in its evolution. Historical land use has been shown to be a major contributor to current environmental composition from local to landscape scales. It has also been shown to affect forests by controlling the modern vegetation patterns by decreasing species diversity and homogenizing soils (Foster et al., 2003), as well as reducing the amount of woody debris located in riparian areas of streams and rivers, which negatively impacts the entire stream or river food web (Clarke & Bryce, 1997; Foster et al., 2003). Riparian vegetation plays a major role in understanding environmental history of a watershed. This vegetation has an important impact on water temperature and the amount of suspended solids entering the stream from bank stabilization. The loss of canopy cover can result in an increase in stream temperature, which can reduce the dissolved oxygen levels (Murdoch et al., 2001). The absence of riparian vegetation can destabilize stream banks and increase soil erosion entering the stream which will increase the amount of suspended solids and decrease dissolved oxygen levels (Clarke & Bryce, 1997; Murdoch et al., 2001). Sparse riparian vegetation can also lead to a decrease of large woody debris (LWD). Stream complexity is increased by LWD as water flows around and through it and creates areas in the water with different depths, velocities, substrate types, and amount of cover. Woody debris increases the amount of depth of pools large enough for salmon to use as cover and creates more diverse physical habitat. It may also create pockets of cool water which would aid survival of salmonid species (Quinn, 2005). Classifying the landscape by ecoregion where Chinook salmon (Oncorhynchus tshawytscha) currently spawn and rear can provide an ecological basis to establish boundaries that assist in identifying stream potential for supporting freshwater species distribution, unlike applying administrative boundaries that merely define states and counties. Classifying watersheds within ecoregions can help in describing the expected conditions and riparian vegetative characteristics of the watersheds and help make predictions of how watersheds in similar ecoregions will respond to certain types of land use and/or degradation (Clarke & Bryce, 1997). The objective of this research was to describe patterns of historical vegetation of the mainstems of the Upper Grande Ronde River, Catherine Creek, and the Minam River and their corresponding ecoregions in the locations where Chinook salmon currently spawn and rear using information from the Government Land Office (GLO) township surveys (1863 – 1901). The larger project objective is to classify the historical landscape of this area in order to conduct further research to be able to make comparisons with current vegetation and analyze how land use has altered the environment since the GLO surveys were conducted. Questions analyzed for this research paper are:
1. How were historical plant communities distributed in the watershed area?

3
2. Which watershed scale factors (life use area, watershed basin, or ecoregion) best
explain variation in historical vegetation patterns?
3. Are individual plant taxa indicative of these watershed scale factors?
Methods Study Area The study area is located in Northeast Oregon in the Grande Ronde Basin and includes the upper Grande Ronde River, Catherine Creek and the Minam River (Figure 1). The Upper Grande Ronde River, Minam River, and Catherine Creek have drainage areas of 1,896 km2 , 1,051 km2 , and 618 km2 respectively. The headwater topography consists of rugged mountains and a low gradient valley between the Blue and Wallowa Mountains for the Upper Grande Ronde River and Catherine Creek. The majority of these watersheds’ surface geology consists of Columbia River Basalt rocks, granitic intrusive rocks and older volcanic rocks. These watersheds have a climate of cold, moist winters and warm, dry summers. In the valleys, the average annual precipitation is 36 cm (14 in) with 152 cm (60 in) in the mountains and consisting mainly of winter snow fall (McCullough, White, Justice, Lessard, & Hill, 2013). Very recent vegetation descriptions of the study area include low elevation regions which consist of grasslands with Idaho fescue-bluebunch wheatgrass (Festuca idahoensis-Agropyron spicatum) and bluebunch wheatgrass-Sandberg’s bluegrass (Agropyron spicatum-Poa sandbergii). The higher elevations consist of shrub/scrub plants and coniferous forests, with species such as Ponderosa pine (Pinus ponderosa), lodgepole pine (Pinus contorta), Douglas fir (Pseudotsuga menziesii), grand fir (Abies grandis), subalpine fir (Abies lasiocarpa), and mountain hemlock (Tsuga mertensiana).The majority of vegetation in the riparian zone are black cottonwood (Populus trichocarpa), mountain alder (Alnus incana), willow (Salix spp.), black hawthorn (Crataegus douglasii), and mountain maple (Acer glabrum) (McCullough et al., 2013). This area has been influenced by humans since before the European settlers. Early travelers noted that Native Americans used fire as a land management technique and grazed horses (Robbins & Wolf, 1994). Many explorers and fur traders came to this area for beavers and commodity purposes which also altered the land. The Grande Ronde River has undergone much larger changes since the very early European settlement. A study conducted in 1990 retrieved stream surveys from 1941 and found that there has been a 60% loss in pool habitat and an increase in concentrations of fine sediments in Chinook salmon spawning areas since the surveys (Wissmar et al., 1994). A more recent study demonstrated that pool frequencies have increased or remained the same in 96% of minimally disturbed streams but have decreased in 52% of streams managed for the extraction of natural resources (McIntosh et al., 2000). Surveys from the Wallowa-Whitman National Forest claim that more than 70% of stream miles do not meet current Forest Plan standards for sediment, shading, temperature and adequate LWD. These factors indicate that there has been severe degradation of the stream and riparian habitat throughout the Grande Ronde Basin (Wissmar et al., 1994). Spring Chinook Salmon in Study Area

4
The three watersheds contain populations of spring Chinook salmon, which were listed as threatened in 1992 under the Endangered Species Act. Decreases in these populations can be attributed in large part to degradation of their habitat. Anthropogenic disturbances in this area consist of timber harvest, cattle grazing, levee and road construction, and stream diversions for irrigation. Limiting factors for Chinook salmon habitat quality include stream temperature, stream flow, fine sediment, habitat diversity, and large pools (McCullough et al., 2013). Chinook salmon are the largest of the Pacific salmon species and have populations that migrate upstream in the spring, summer and fall. The Grande Ronde basin currently has spring and fall Chinook populations. They spawn in areas with large gravel and cold waters in the mainstem of the Grande Ronde River and its major tributaries. In order for Chinook salmon to successfully spawn and produce offspring, there are certain habitat requirements that need to be met. Two of the most important requirements for development of salmon are cold water temperatures and high dissolved oxygen levels (Quinn, 2005). Water temperature has shown to be lacking and limiting salmon production in varying degrees in the study area (McCullough et al., 2013). Riparian vegetation is important for the survival of fish in the summer months by providing shade but also in the winter months where it moderates the loss of heat from the stream and prevents ice forming (Clarke & Bryce, 1997). Government Land Office Surveys The GLO surveys conducted in the mid to late 19th century were originally intended to provide information to prospective settlers regarding timber harvest, agriculture and animal grazing. During the GLO survey, a surveyor walked each 1 mile section line in which the township was broken up into 36 sections of 1 square mile. Surveyors also walked to boundaries of all townships. Distance at the time of the surveys was measured in chains and chain links, where 80 chains equals one mile. Most surveyors recorded when vegetation, streams/rivers/wetlands, human structures, trails/roads, or other noteworthy features or landscape objects were located on the one mile line representing a section border. Upon completing a township, the surveyor usually noted a general description of the township. Methodologies for extracting information from GLO surveys were adapted and revised from McAllister (2008). GLO survey notebooks were viewed online at the Bureau of Land Management website (http://www.blm.gov/or/landrecords/survey/) and used as a primary data source to spatially locate on a map the vegetation types, landscape characteristics, and human features described in the handwritten notes. ESRIs geographic information system (GIS) ArcMap 10 was used to map the data extracted from surveys. A point was plotted in GIS for each feature at the location along the township section line (Figure 2) and the information about the feature was recorded in a GIS attribute table. A general description was written about each section line’s vegetation and soil quality. Data recorded in the GIS attribute table which originated from the surveys consist of date surveyed, surveyor, stream crossing names, width and depth, soil type, human structures, and a number of vegetative species. Data created from the surveys include an accuracy rating of exact feature location versus point placement, animals, and Native American uses. Township summaries were recorded in a separate document along with an image of the original data (Figure 3) and hand drawn maps (Figure 4). Data Analysis
5
In order to select the points for analysis of the research questions, township and section lines were selected that crossed the GIS line features representing current spawning and rearing of Chinook salmon along the mainstem of the Grande Ronde River, Catherine Creek and Minam River. Each section line was given its own unique identifying code. The transect data, which were representative of the section lines, were then entered into tabular from to classify by their vegetation summary category which fell mutually according to Chinook salmon spawning or rearing areas. Transects were also attributed by level IV ecoregion. Nonmetric multidimensional scaling (NMS) was used to describe multivariate patterns of upland versus riparian plants across the project area. Upland and riparian plants were categorized using the Natural Resources Conservation Service riparian plant identification field guide (NRCS, 2008). A multiple response permutation procedure (MRPP) was used to test for categorical (salmon life history use, basin, ecoregion) differences in plant community taxa. Indicator species analysis (ISA) was used to test whether particular taxa were good indicators of categorical descriptors such as life stage use, basin and ecoregion. Only the taxa with an occurrence of 5% or greater were included in the analysis (Table 1). Two ecoregions were excluded from MRPP and ISA analyses due to containing only one transect (Table 2). Because GLO surveyors had varying ability to identify vegetation taxa, we also tested for the effect of surveyor on the recorded plant community structure.
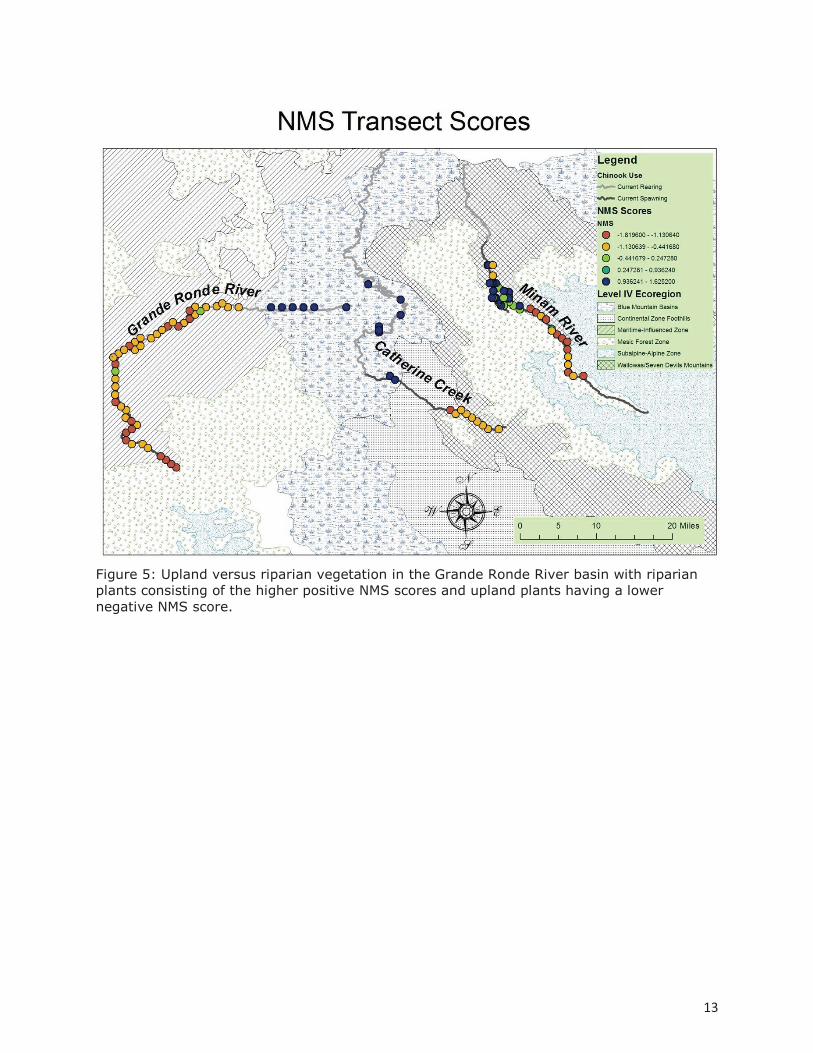
Results Question 1: Distribution of plant community types Throughout the study area, upland versus riparian plants displayed a difference in key taxa describing the community composition, as demonstrated by their NMS scores (Table 3). Riparian plants had higher positive NMS values and upland plants had lower negative values (Figure 5). This helps to display the differences in areas of growth and development of each plant taxa. The plant taxon with the highest NMS score was cottonwood (1.192) and was the most representative of a riparian taxon, while pine (-0.612) had the lowest NMS score representing upland plants. Question 2: Watershed-scale factors affecting plant communities Ecoregion, basin, life history and surveyor all were significantly representative of historical plant taxa distribution. Of the environmental factors, ecoregion revealed the strongest relationship to historic plant spatial distribution (A-statistic = 0.255), followed by basin (A-statistic = 0.108) and Chinook salmon use (A-statistic = 0.019, Table 4). Surveyor was also strongly correlated with the highest NMS score representing the vegetative distribution (A-statistic = 0.484). An ordination plot revealed that the ecoregions Wallowas/Seven Devils Mts and Mesic Forest had similar species composition, while the Maritime Influenced Zone represented more upland plants and the Blue Mt Basin was more reflective of riparian plant species (Figure 6).
Question 3: Plant taxa indicators The ISA phi scores show that individual plant taxa were statistically indicative of certain ecoregions (p = 0.05) (Table 5). Species with statistically significant relationships with the Maritime Ecoregion were grass (phi = 0.409), pine (phi = 0.457) and tamarack (phi = 0.230). Species with statistically significant relationships with the Blue Mt Basin were cottonwood (phi = 0.587) and willows (phi = 0.470), while balm (phi = 0.378) was indicative of the Wallowas/Seven Devils Mts (Figure 7). The Mesic forest zone was included

6
in the analysis but did not have any statistically significant indicator taxa. Fir, spruce and alder were not statistically indicative of any of the ecoregions analyzed.
Discussion
GLO survey data for key plant taxa revealed a significant difference when data were stratified by position on the landscape (e.g., riparian vs. upland). A study conducted by Pabst and Spies (1998) demonstrated the composition of vegetation as representing a complex environmental gradient from the streamside to the lower hillslopes with the vegetative patterns being related to specific landforms and topography. This helps to explain expected plant taxa composition and distribution with emphasis on their location. The differences in the NMS scores between the community types show that the GLO surveys exhibited consistency regardless of observer which matches what we know about major vegetative transitions from riparian to upland areas (Pabst & Spies, 1998). Spawning versus rearing areas were analyzed only in the Upper Grande Ronde River and Catherine Creek because data in the rearing areas of the Minam River were not retrievable on the BLM site. This factor may be important to explain why the smallest A-statistic is in the life history and not any of the other parameters analyzed. Though surveyor had the strongest statistical significance, there needs to be more data exploration in order to conclude its legitimacy. Therefore, ecoregion is interpreted to display the closest connection to vegetation distribution due to its lack of potential biases. This result is supported by McAllister (2008) study who also found that some plant taxa are highly ecoregion specific and others are not. This helps to verify the use of ecoregions when displaying plant characteristics and distribution. Not including the surveyor data, basin has the second highest connection to vegetation type. The Maritime Influenced Zone ecoregion contains only transects in the upper Grande Ronde River. The Wallowas/Seven Devils Mts contains part of the Minam River and Catherine Creek while the Blue Mt Basin contains the Minam River and the upper Grande Ronde River. Since each ecoregion contains only one or two of the study basins boundaries within it, basin in conjunction with ecoregion can be used as a second predictor of the plant communities present. Analyzing plant distribution from various factors can show how it can be predicted by landscape attributes, such as ecoregion and basin. A study conducted by Kooch, Jalilvand, Bahmanyar, & Pormajidian (2008) identified indicator species to show differential distributions between plant groups and to help distinguish between different plant groups which validated how certain species can be indicative of a plant type or location. Clarke & Bryce (1997) describe the Maritime Influenced Zone as receiving some of the most precipitation within the Blue Mountains. The higher relative precipitation across the Maritime Influenced Zone causes xeric (e.g., characterized by Ponderosa pine and bunchgrass) upland habitats to be found at lower elevations than in other ecoregions of the Blue Mountains. Pine was indicative of the maritime influenced zone in our ISA results. Willow was an indicator species for the Blue Mt Basin ecoregion which has a dynamic relationship with its floodplain and is heavily grazed by cattle and elk. Balm, which is believed to be the evergreen shrub Ceanothus velutinus, has common names mountain balm and snowbrush and was indicative of the Wallowas/Seven Devils Mountains. Clarke & Bryce (1997) described the native vegetation of this ecoregion to include pines, firs, and various types of evergreen and deciduous shrubs (i.e., Mountain big sagebrush (Artemisia tridentata vaseyana) mallow ninebark (Physocarpus malvaceus), and western serviceberry (Amelanchier alnifolia)).
7
This study showed the significance of ecoregions influencing the distribution of upland and riparian vegetation. Chinook salmon habitat conditions are being monitored in three study watersheds within the Grande Ronde basin (the upper Grande Ronde River, Catherine Creek, and the Minam River) (McCullough et al., 2013). Riparian vegetation restoration to potential natural conditions is essential to the full recovery of the listed spring Chinook salmon populations in these watersheds. Identifying historical indicator plant communities within the riparian zones of various local ecoregions from historical surveys could be a means to identify reference conditions for restoration goals of Chinook salmon spawning and rearing areas which have been affected by anthropogenic land use practices. Monitoring the current landscape for the indicator plant species distribution and abundance, which are assumed to be the representative plant communities of historical ecoregions, could be a gage on how much change has occurred and how much effort will be needed for restoration. A source of error in the data could be surveyor bias. Methodologies and protocols used to survey the land were different for regions and time periods in which the surveys were conducted. “Bearing” trees (i.e., trees used to sight compass bearings from points on the section lines) were recorded only if they had a diameter greater than 2.95 in (7.5 cm) and the level of completeness in data entry varied from surveyor to surveyor (Collins & Montgomery, 2001). Some surveyors presumably had more knowledge about vegetation than others and some may have had more familiarity with Eastern U.S. plants and not of Western plants. Therefore, plants may have been misidentified due to surveyor lack of knowledge of plant species of the Pacific Northwest. Surveyors were also looking at the landscape for potential resource extraction and were biased in describing plants that could be harvested for timber or were indicators of rich soil for farming. Settlements and roads were recorded in the GLO surveys indicating that there has been some land use activity in this area before the surveys were conducted, meaning that some areas may have already had their vegetation altered and did not represent the true historical vegetation. Since we have not collected all the data yet for the study area, another source of error is variation in sample sizes and the exclusion of the Minam River basin in the rearing data. Excluding the Minam River basin in the rearing analysis does not provide a complete analysis of the study area and may be biasing the results due to potential differences in vegetation among basins. This preliminary analysis showed that the ecoregion may be the best predictor of vegetation communities and that some plant species may be indicators for an ecoregion. The historical data can be used as a tool to determine reference conditions for comparison of past and current vegetation located within a site and help predict which plant communities are to be expected at the site location. Further analysis of the different types of data noted in GLO surveyor notes could include surveyor biases, changes in stream complexity and sinuosity, changes in abundance and distribution of historical vegetation, and identifying the leading land use practices which led to changes in environmental conditions.
Acknowledgements I thank the Portland State University Ronald E. McNair scholars program and staff, Dr. Toeutu Fa’aleava, Dr. Jolina Kwong-Caputo, Jennifer Robe, and Kristy Schepker for providing funding and support to conduct this research. I also thank the Columbia River Inter-Tribal Fish Commission staff in particular Dr. Seth White, Denise Kelsey, and Dr. Dale McCullough for providing me the opportunity to conduct research. Multivariate data analyses were conducted by Dr. Seth White.

8
Literature Cited
Allan, J.D. 2004. “Landscapes and Riverscapes: The Influence of Land Use on Stream Ecosystems.” Annual Review of Ecology, Evolution, and Systematics 35: 257–284. Botkin, D.B. and Keller, E.A. 2009. Environmental Science: Earth as a Living Planet. Hoboken: John Wiley & Sons Inc. Charlton, R. 2008. Fundamentals of Fluvial Geomorphology. New York: Routledge. Clarke, S.E. and Bryce, S.A. eds. 1997. “Hierarchical Subdivisions of the Columbia Plateau
and Blue Mountains ecoregions, Oregon and Washington.” Gen. Tech. Rep. PNW-GTR-395. Portland, Or: U.S. Department of Agriculture, Forest Service, Pacific Northwest Research Station. 114 p.
Collins, B.D. and Montgomery, D.R. 2001. “Importance of Archival and Process Studies to Characterizing Pre-Settlement Riverine Geomorphic Processes and Habitat in the Puget Lowland.” Water Science and Application 4: 227-243. Foster, D., Swanson, F., Aber, J., Burke, I., Brokaw, N., Tilman, D., & Knapp, A. (2003).
The importance of land-use legacies to ecology and conservation.BioScience, 53(1), 77-88.
Harding, J. S., Benfield, E. F., Bolstad, P. V., Helfman, G. S., & Jones, E. B. D. (1998). Stream biodiversity: the ghost of land use past. Proceedings of the national academy of sciences, 95(25), 14843-14847. Kooch, Y., Jalilvand, H., Bahmanyar, M.A., Pormajidian, M.R. 2008. “Application of Two Way Indicator Species Analysis in Lowland Plant Types Classification.” Pakistan Journal of Biological Sciences 11(5):752-757. Maloney, K. O., Feminella, J. W., Mitchell, R. M., Miller, S. A., Mulholland, P. J., & Houser, J. N. (2008). Landuse legacies and small streams: identifying relationships between historical land use and contemporary stream conditions.Journal of the North American Benthological Society, 27(2), 280-294. McAllister, L.S. 2008. “Reconstructing Historical Riparian Conditions of Two River Basins in Eastern Oregon, USA.” Environmental Management 42: 412–425. McCullough, D., White, S., Justice, C., Lessard, R., Hill, L. 2013. “Monitoring Recovery Trends in Key Spring Chinook Habitat Variables and Validation of Population Viability Indicators.” 1/1/2012 - 12/31/2012, Annual Report, 2009-004-00, 118 p. McIntosh, B. A., Sedell, J. R., Thurow, R. F., Clarke, S. E., & Chandler, G. L. (2000). Historical changes in pool habitats in the Columbia River Basin.Ecological Applications, 10(5), 1478-1496. Murdoch, T., Cheo, M., O’laughlin, K. 2001. The Streamkeepers Field Guide: Watershed Inventory and Stream Monitoring Methods. Everett: The Adopt-A-Stream Foundation. Natural Resources Conservation Service [NRCS]. 2008. “Field Guide for the Identification
and Use of Common Riparian Woody Plants of the Intermountain West and Pacific Northwest Regions.” http://www.nrcs.usda.gov/Internet/FSE_PLANTMATERIALS/publications/idpmcpu7969.pdf
Pabst, R.J. and Spies, T.A. 1998. “Distribution of Herbs and Shrubs in Relation to Landform

9
and Canopy Cover in Riparian Forests of Coastal Oregon.” Canadian Journal of Botany 76: 298-315.
Quinn, T.P. 2005 The Behavior and Ecology of Pacific Salmon and Trout. Seattle: University
of Washington Press. Robbins, W. G., & Wolf, D. W. (1994). Landscape and the intermontane Northwest: an environmental history. White, S.M. and Rahel, F.J. 2008. “Complementation of Habitats for Bonneville Cutthroat Trout in Watersheds Influenced by Beavers, Livestock, and Drought. Transactions of the American Fisheries Society 137: 881-894. Wissmar, R. C., Smith, J. E., McIntosh, B. A., Li, H. W., Reeves, G. H., & Sedell, J. R. (1994). Ecological health of river basins in forested regions of eastern Washington and Oregon.

10
Figures
Figure 1: Study areas located in the Grande Ronde Basin which includes the mainstems of the Upper Grande Ronde River, Catherine Creek, and the Minam River.

11
Figure 2: Use of Geographic Information System to plot data points (colored in green) retrieved from Government Land Office Township surveys in the Grande Ronde Basin.

12
Figure 3: Example of hand written Government Land Office township summary survey document circa 1882 for the Grande Ronde River basin.
Figure 4: Example of hand drawn map based off of Government Land Office township surveys circa 1874 upon completion of township survey in the Grande Ronde Basin.
13
Figure 5: Upland versus riparian vegetation in the Grande Ronde River basin with riparian plants consisting of the higher positive NMS scores and upland plants having a lower negative NMS score.

14
Figure 6: Nonmetric Multidimensional Scaling ordination plot of upland versus riparian plants located within each ecoregion present. Tables Table 1: All plant taxa present in study area. Species with asterix (*) had a presence of 5% or greater and were used in analysis.
Taxa Alder* Hemlock Balm* Maple Birch Mt
Mahogany Cottonwood* Mt Laurel Crabapple Pine* Fir* Rose Grass* Spruce* Willow* Tamarack*

15
Table 2: Ecoregions within study area. Ecoregions with asterix (*) had locations on more than one transect.
Ecoregions Blue Mt Basin* Continental Zone
Foothills Mesic Forest Zone* Wallowas/Seven Devils
Mts* Maritime Influenced Zone*
Subalpine/Alpine Zone
Table 3: Nonmetric Multidimensional Scaling values for presence/absence of each species. Taxa NMS Value Cottonwood 1.192 Willow 1.017 Alder 0.212 Spruce -0.103 Balm -0.220 Grass -0.478 Fir -0.498 Tamarack -0.521 Pine -0.612 Table 4: Multi-Response Permutation Procedures against riparian vegetation data using Sorensen (Bray-Curtis) distance measures and rank transformed distance matrix. Category Number of
Groups A-Statistic
P-value
Chinook Use
2 0.019 0.021
Basin 3 0.108 4.70E-07 Ecoregion 4 0.255 < 1.0E-
08 Surveyor 11 0.484 < 1.0E-
08 Table 5: Indicator values for taxa type versus ecoregion. Ecoregion Taxa Phi
Scores P-value
Blue Mt Basin Willow 0.378 0.0014 Cottonwood 0.587 0.0002 Maritime Influenced Zone
Grass 0.409 0.0004
Pine 0.457 0.0002 Tamarack 0.230 0.0310

16
Wallowas/Seven Devils Mts
Balm 0.470 0.0004