historical snow cover variability in the great plains region of the usa: 1910 through to 1993
TRANSCRIPT
INTERNATIONAL JOURNAL OF CLIMATOLOGY, VOL. 16, 1005-1018 (1996) 551.521.11(4)
HISTORICAL SNOW COVER VANABILITY IN THE GREAT PLAINS REGION OF THE USA: 1910 THROUGH TO 1993
MARILYN G . HUGHES AND DAVID A. ROBINSON Department of Geography, Rutgers Universip, New Brunswick, NJ 08903, USA
e-mail: [email protected]
Received 18 July 1995 Accepted 20 November I995
The duration of seasonal (September-May) snow cover over the central and northern Great Plains region of the USA has varied considerably during this past century. Annual and decadal fluctuations are embedded in a statistically significant trend toward greater seasonal snow cover, fiom 29 days in the early part of the century to 38 days in recent decades. The variability of snow cover duration also increased throughout the century, exhibiting the largest changes in a north-west-trending zone bisecting the region. Seasonal snowfall, temperature, and precipitation show fluctuations similar to those of snow cover; however, only snowfall has increased significantly since 191 0. A post-I 970 shift toward longer autumn (September-November) snow cover duration and shorter spring (March-May) duration has been accompanied by decreases in autumn maximum and minimum temperatures and increases in spring minimum temperatures. The reliance on snow cover for hydrological and agricultural purposes in this part of the country, the sensitivity of the boundary layer climate to snow cover conditions in the Plains, and the projections by global climate models for this region to become warmer and dryer as a result of increasing atmospheric concentrations of greenhouse gases, necessitate increased study and hence a better understanding of the variability of snow cover over the Plains.
KEY WORDS: Great Plains, USA; snow cover; principal component analysis; gridded data; step-wise regression
INTRODUCTION
Satellite-derived snow cover observations have been available since the early 1970s. These records show that in the late 1980s and early 1990s snow cover was less extensive over North America than at any other time over that period of record (Robinson, 1993a). This decrease in cover is most pronounced in spring, and coincides with a warming of spring temperatures (Foster, 1989; Brown and Goodison, 1993; Karl et al., 1993). Groisman et al. (1 994) suggest that spring warming may, to a large degree, be due to an enhanced positive feedback between the snow cover and temperature. These recent findings are based on only the post-1972 period of satellite data. This short interval is insufficient for characterizing the uniqueness of these snow cover fluctuations. A longer period of record is necessary to place the changes recently noted into the proper historic perspective. For such a long-term climate analysis, historical station observations must be used. This study utilizes digital daily climate data from the Historical Daily Climate Dataset (HDCD) compiled by Robinson (1 988, 1993b). The data set provides the means for understanding and modelling the nearly century-long changes in snow cover over the central and northern Great Plains region of the USA from 19 10-1993. It also enables associations between snow cover and other components of the climate system to be quantified and analyzed.
Characterizing the natural behaviour of snow cover is important both for climate change detection and for improving snow cover models. Across much of the USA, falling snow and snow lying on the ground greatly influence hydrological, biological, chemical, and geological processes at or near the surface of the Earth. The high albedo of a snow cover, and other characteristics of snow that affect the local and regional energy balance, directly affect surface air temperatures (Namias, 1985; Walsh et al., 1985; Robinson and Dewey, 1990; Karl et a]. , 1993; Leathers and Robinson, 1993; Groisman et al., 1994). So too, is the duration of snow cover influenced by temperature and other climate variables. Snow cover can be monitored by satellite successfully, and with relative
CCC 0899-841 8/96/09-1005-14 0 1996 by the Royal Meteorological Society
1006 M. G. HUGHES AND D. A. ROBINSON
ease (Matson and Wiesnet, 1981; Wiesnet et al., 1987; Robinson, 1993a), making its potential use in climate monitoring studies great.
The correct depiction of snow cover in climate models is critical for realistic model forecasts due to known snow-ice-albedo feedback mechanisms. Meehl and Washington (1 990) found that small changes in the snow and ice albedo parameterizations affected the globally averaged surface temperatures on the order of 1" K in control runs, and 0.45" K in 2 x C02 models. Similarly, Cess et al. (1991) found that the magnitude of the snow-cover- climate feedback mechanism varied considerably among models. These findings make the validations of modelled snow cover behaviour with station and remotely sensed data critical.
The Great Plains region of the USA was selected for this study for several reasons. Earlier studies suggest that this region exhibits considerable variability in snow cover and that linkages between snow cover and other boundary level climate variables are strong (Namias, 1985; Walsh et al., 1985; Robinson and Hughes, 1991; Leathers and Robinson, 1993). This region is susceptible to patterns of extreme drought and severe weather and has considerable domestic and international agricultural importance (Warrick, 1980; Rosenzweig, 1985; U.S. EPA, 1990). Finally, general circulation models project that this region will become warmer and dryer as levels of atmospheric greenhouse gases continue to increase, placing a potentially extreme environmental and economic strain on the area (U.S. EPA, 1990).
Three principle questions are addressed in this study. (i) How has seasonal snow cover varied both spatially and temporally throughout the past century? (ii) Have observed variations in snow cover been associated with changes in precipitation and temperature? (iii) Are the most recent changes in snow cover and temperature an indication of a significant natural or anthropogenic climate change or do they lie within the natural variability of Plains climate?
DATA AND ANALYSIS TECHNIQUES
The Historical Daily Climate Dataset (HDCD) contains long-term digitized records of daily snow cover, snowfall, precipitation, and maximum and minimum temperatures. Data are available for more than 1100 cooperative climate stations distributed throughout the USA, approximately 220 of which are in the central and northern Great Plains. This study utilizes all stations within a region that extends from the Rocky Mountains east to the Mississippi River, and from the Canadian border south to the Kansas-Oklahoma border. The HDCD is the only source of digitized long-term daily snow cover data for the USA. Records extend back prior to 1920 for more than 65 per cent of the stations in the study region, with 44 per cent of the stations reporting data before 1910. Earlier than 19 10, there were too few stations to provide adequate spatial coverage for this study. Previous studies of ours revealed that the quality and quantity of snow depth measurements are more likely to be suspect or missing than any other variable observed (Robinson and Hughes, 1991). Other researchers confirmed similar problems working with snow data (Karl et al., 1989). These findings prompted us to establish a series of quality control procedures to identify, flag, and hand-correct questionable observations (Robinson, 1993b). Data that could not be corrected were eliminated from fiwther analysis.
On average, 18 per cent of the snow cover data from selected study stations are missing. Gaps in snow cover observations are filled when daily values of snowfall and temperature are present, using the depth-change method developed and tested successfully in Hughes and Robinson (1993). This method uses daily data to develop regionally and seasonally specific regression equations relating changes in snow depth to mean temperatures. These equations are then used in conjunction with snowfall observations to estimate whether snow cover is present, and if so, its depth.
For each station, seasonal (September of one year through to May of the following year), autumn (September through to November), winter (December through to February), and spring (March through to May) time series are computed for the following variables: (i) number of days reporting at least 7.6 cm (3 in.) of snow cover, (ii) total snowfall, (iii) total precipitation, (iv) average maximum temperature, and (v) average minimum temperature. If more than 3 days in any month are found to be missing, the entire season is eliminated. At depths of less than 7.6 cm the measurements of snow cover are considered more observer-dependent owing to the frequently patchy nature of such covers, and less significant as an influential factor in the climate system (Robinson, 1988). From here on, snow covered days will refer to depths of at least 7.6 cm.
GREAT PLAINS SNOW COVER 1007
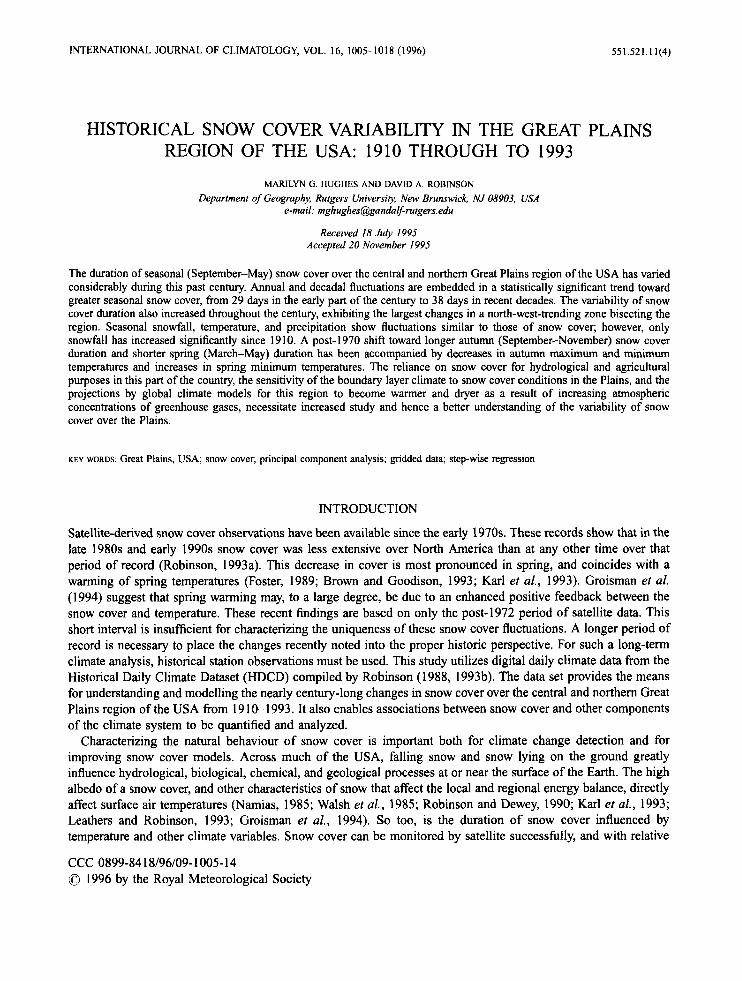
The resulting station time series vary considerably with regard to length of record and temporal completeness. Rather than eliminate stations with missing records, the data are gridded. Establishing a gridded data set enables the irregularly spaced station data with its missing records, and differing start dates, to be converted to a regularly spaced, temporally and spatially complete surface. This also minimizes the biases associated with point-specific station data. The following procedure is used. Each station location is transformed from a latitude-longitude point to an X-Y Cartesian coordinate centred at 43"N latitude, 1OO"W longitude. For each year, all climate variables are extracted, placed in individual files, and are gridded independently using an inverse distance algorithm (SURFER, 1995). Up to 10 stations are used in the interpolation of each grid-point, selected using a nearest neighbour routine within a 200 km search radius. The output is a series of snow cover-climate grids for each year from 1910 to 1993. The grids are then 'layered's0 that each grid-point in the region is represented by an 84 year time series. The square boundaries used for gridding purposes in this region extend from 37"N to 49"N latitude and 109"W to 9 1 OW longitude. Where these do not coincide with the defined study region, the gridded value is left blank. Based on cell dimensions, there are 13 latitude and 2 1 longitude lines. To eliminate an edge bias the two easternmost and westernmost longitude lines are eliminated. The resulting grid is 13 x 17 or 221 values per grid. Each cell is 1 1 1 km north-south and 8 1 km east-west (1 O x 1 O at 43"N and 100" W). The location of the Great Plains stations and the associated station grid is shown in Figure 1.
RESULTS
Great Plains snow cover variability
The northern and central Great Plains share many climatic characteristics such as their considerable intra- and interannual variability, and cycles of drought and recovery. Despite this, considerable variation on seasonal and annual scales is observed across the region. We begin with an evaluation of Great Plains climate data, computed by adding all grid-cells in the region together. Although not necessarily representative of any specific location within the Plains, this will provide a useful overview of regional conditions, particularly when used for comparison with other regions in North America and elsewhere in the Northern Hemisphere.
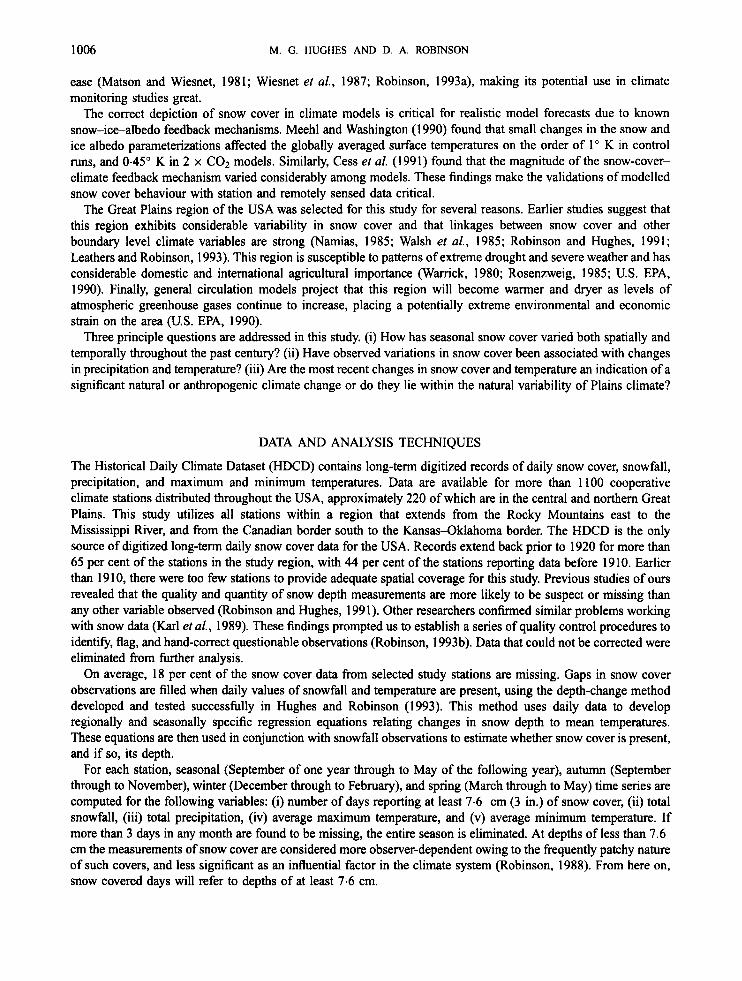
Seasonal snow cover on the Great Plains exhibits considerable year-to-year variation (Figure 2). There is a 14- day standard deviation centred around a mean of 34 snow covered days ( 1 7 . 6 cm). Within the region, the 84 years of data show a range in cover from more than 7 weeks in the north to approximately 1 week in the south. The lowest duration of cover occurred in 193 1 with only 12 days, and the highest in 1979 with 84 days. Throughout the length of record, there are occasional periods where four or more consecutive years are below or above the century- long mean. Runs of below normal cover occurred between 1921 and 1928, 1941 and 1947, and 1989 and 1992,
Scale in Kilometers 3
Figure 1. Location of Great Plains stations used in this study (@). Centre of 1 1 I km x 81 km cells are indicated ( +)
1008 M. G. HUGHES AND D. A. ROBINSON
100
8 80 rA
3 8 " 3
2 40 v)
0 (r
I ' & 20
z o I I I 1 1 I I I 1910 1920 1930 1940 1950 1960 1970 1980 1990 2000
Figure 2. Snow cover duration of 2 7.6 cm over the Great Plains for the snow season September-May 1909-1910 through September-May 1992-1993. The data are smoothed using a nine-point binomial filter.
with average durations of 22,26, and 25 days, respectively. From 1948 to 1952 and from 1969 to 1976 snow cover was consistently high, averaging 43 days.
During the greater part of the first half of the century, from 1910 to 1949, cover averaged 29 days, with only 13 of those years above the full study period average. From 1950 to 1993 cover averaged 38 days, with 21 of those years above the period average. A linear regression analysis on the smoothed time series indicates that the number of days with snow cover increased significantly (99 per cent level) from 19 10 to 1993 at an average rate of 0.2 days year - ', from approximately 29 days in the early part of the century to 38 days in recent decades. The 1920s stand out as the decade with the lowest snow cover, followed closely by the 1930s (Figure 3). Decadal means increased steadily to a high in the 1970s. Since then, snow cover duration has decreased, but generally remains above the average found in the first half of the century.
The interannual variability of snow covered days, as measured by the coefficient of variation (standard deviation/mean) increases slightly from the first to the second half of the century (Table 1). The 192Os, 194Os, 1950s and 1970s, the decades with long runs of consistent snow cover, are marked by low variability. In contrast, the 1960s and the first part of the 1990s are marked by high variability of cover.
Seasonal snow cover variability
Snow cover in the Great Plains is predominantly a winter (DJF) phenomenon. Winter snow cover duration averages 25 days. The minimum number of snow covered days occurred in 193 1, with 5 days, and the maximum in 1979, with 63 days. Within this range, considerable variability is found. A linear regression on the smoothed time series indicates that from 19 10 to 1993 the number of winter snow covered days increased significantly (99 per cent level) at a rate of 0.16 days year-' (Figure 4). The 1920s and 1930s were the decades with the lowest cover, averaging 19 and 20 days, respectively (Figure 5). Snow cover duration then increased to a high in the 1970s of 35 days. Since then, duration has decreased, although the 1980s and 1990s are still above the near century long mean of 34 days. The interdecadal range in snow covered days increased considerably in the 1970s and remains high through the present.
Autumn (SON) and spring (MAM) snow covers are less common, averaging slightly more than 2 days in autumn and 6 days in spring. Considerable variability exists in these swing seasons, with autumn cover ranging from no snow covered days in 1939 to 10 days in 1919, and spring totals ranging from one day in 1981 to 19 days in 1960. Despite relatively low cover in these seasons, an interesting seasonal snow cover shift has been observed in recent decades. In the 1960s, autumn snow cover was the lowest of the century, and spring cover the highest. Both spring and autumn cover were high in the 1970s. From there on, autumn snow cover has generally increased and is the highest of the record for the first half of the 1990s (Figure 6). Concurrently, since the 1970s, spring cover has

GREAT PLAINS SNOW COVER
Trend = 0.16 day slyear -
-
- -
-
I I L -
1009
3 e 2 35 0
25 1910 1920 1930 1940 1950 1960 1970 1980 1990+
Decade
Figure 3. Average Great Plains seasonal snow cover duration 2 7.6 cm by decades. *1990-1993 only
Table I. Great Plains (September-May) snow cover 2 7.6 cm duration (in days).
Years Minimum Maximum Range Mean Coefficient of variation
19161993 191 61949 1 9 5 w 993 1916l919 19261929 19361939 1940- 1949 19561959 19661 969 19761 979 19861 989 199w993
12 12 15 14 13 12 20 22 22 29 15 20
84 53 84 53 45 46 52 52 60 84 62 61
72 41 69 39 32 39 33 30 38 55 47 40
34 29 38 33 26 27 31 34 36 46 37 32
0.4 1 0.38 0.40 0.42 0.35 0.41 0.32 0.29 0.42 0.35 0.4 1 0.59
70 1 1 I I I I I I 1
1910 1920 1930 1940 1950 1960 1970 1980 1990 2000 Figure 4. Snow cover duration of 2 7.6 cm over the Great Plains for the winter (DJF) December-February 1909-1910 through December-
February 1992-1993. The data are smoothed using a nine-point binomial filter.

1010 M. G. HUGHES AND D. A. ROBlNSON
40 I 1 I I I I I I I I 1
1910 1920 1930 1940 1950 1960 1970 1980 1990'
Decade Figure 5. Average Great Plains winter (DJF) snow cover duration 2 7.6 cm by decades. *1990-1993 only.
decreased steadily and now approaches the low cover found in the late 1920s and early 1930s (Figure 7). Brown et al. (1 995) have suggested that this change in recent decades is a reflection of a change in atmospheric circulation. Since the 196Os, a shift to more positive values of the Pacific North American (PNA) teleconnection index has been noted (Leathers and Palecki, 1992). This shift has been accompanied by an increase in spring snow-cover- temperature sensitivity, resulting in a stronger positive feedback between snow cover and temperature (Brown et al., 1995).
Intra-regional snow cover variability
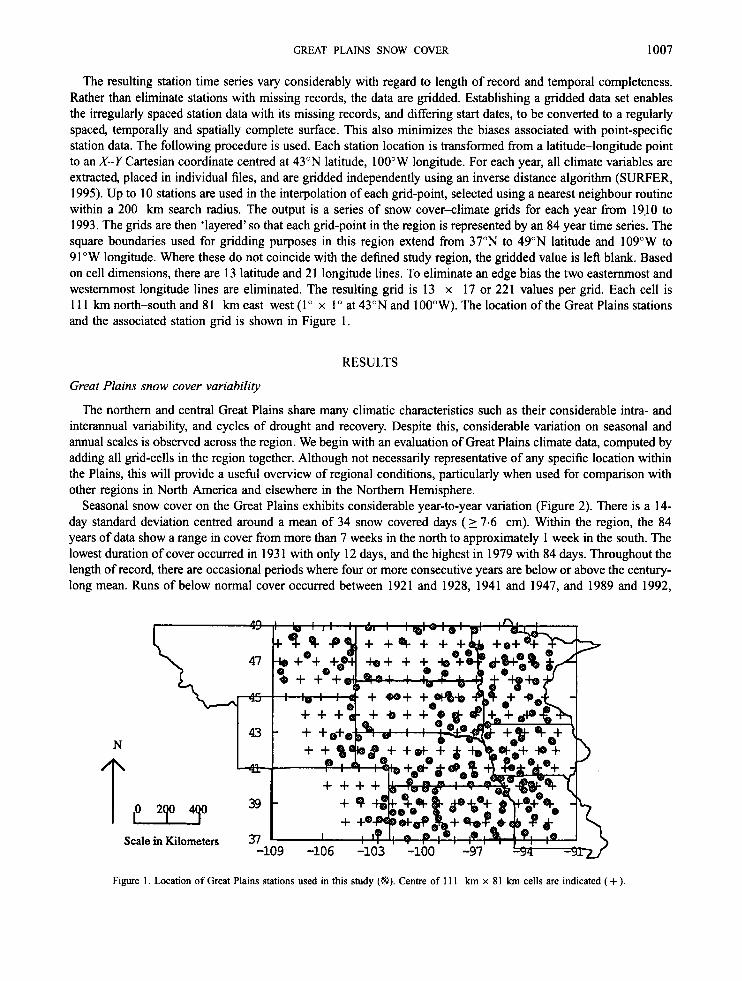
Principal components analysis (PCA) is used to identify areas within the Plains exhibiting temporally similar snow cover characteristics (SYSTAT, 1992). From the set of 221 gridded snow cover time series, a subset of 13 1 well-distributed, temporally complete series are selected as input to the PCA. The PCA identifies eight snow cover components representing 84.2 per cent of the total variance from the original seasonal snow cover duration data matrix (Table 11). The eight components are rotated using an orthogonal varimax rotation to aid in the spatial interpretation (Figure 8). A cluster analysis using a partitioned approach based on Pearson correlations is run on the factor loadings to statistically separate them into eight unique regions (SY STAT, 1992). All of the gridded data
5 , I I I I I I I 1 1 1
1910 1920 1930 1940 1950 1960 1970 1980 1990,
Decade Figure 6. Average Great Plains autumn (SON) snow cover duration 2 7.6 cm by decades. *1990-1993 only.

GREAT PLAINS SNOW COVER 101 1
10 , I I 1 I I I I I I
1910 1920 1930 1940 1950 1960 1970 1980 1990.
Decade
Figure 7. Average Great Plains spring (MAM) snow cover duration 2 7.6 cm by decades. *199&1993 only.
within each of the eight PCA-defmed regions are then averaged to obtain the intra-regional climate means. From here on the smaller regions are referred to by the number corresponding to the principal component, i.e. region 1 refers to PC 1.
Within the Great Plains, the mean seasonal duration of snow cover ranges from a high of 77 days from central North Dakota to western Minnesota (PC5) to a low of 10 days in eastern Kansas and western Missouri (PC1). The variability of snow cover duration increases from north to south as the certainty of winter cover decreases. On average, the northern regions have snow cover for seven or more weeks every year. The central regions average between 3 and 4 weeks of cover every year, whereas the southern ones average only 1-2 weeks of cover.
Snow cover generally decreases from east to west across the Plains. Large differences in cover occur in the north, where duration decreases from 77 days year- ' in the east (PC5) to 48 days year-'in the west (PC2). On average in winter, an upper level ridge is centred over the western Great Plains, and a trough is centred over the north-eastern Plains. This meridional pattern contributes to colder temperatures and a more persistent snow cover in the east than in the west. In addition, the western Plains is subject to Chinook winds throughout the winter. These warm winds blowing down the eastern slopes of the Rockies cause rapid melting of snow on the eastern side of the mountains and large differences in snow cover over relatively short distances.
Time series of seasonal snow duration from each of the eight regions exhibit considerable year-to-year variability. Linear regression analyses on these smoothed time series indicates that each of the regions experienced significant (99 per cent level) increases in snow cover since 1910. The largest increases are found in eastern Nebraska (PC7), where snow cover increases from 17 to 28 days year-' (65 per cent), and in eastern Kansas and Missouri (PCl), where snow cover increases from 8 to 12 days year-' (50 per cent). Increases in the mean number
Table 11. Variation described by the first eight principal components
Component Percentage Variance Cumulative explained percentage variance
PC 1 PC2 PC3 PC4 PC5 PC6 PC7 PC8
12.0 14.2 13.2 7.9
10.8 10.7 11.9 3.5
12.0 26.2 39.4 47.3 58.1 68.8 80.7 84.2
1012 M. G. HUGHES AND D. A. ROBINSON
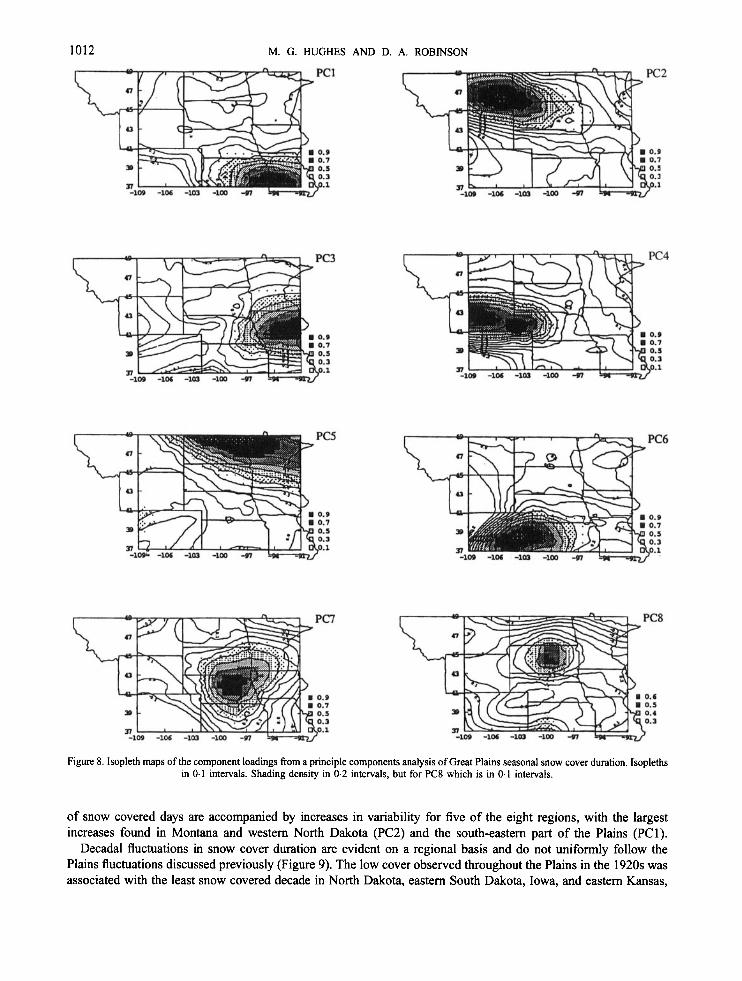
Figure 8. lsopleth maps of the component loadings from a principle components analysis of Great Plains seasonal snow cover duration. lsopleths in 0.1 intervals. Shading density in 0.2 intervals, but for PC8 which is in 0.1 intervals.
of snow covered days are accompanied by increases in variability for five of the eight regions, with the largest increases found in Montana and western North Dakota (PC2) and the south-eastern part of the Plains (PC1).
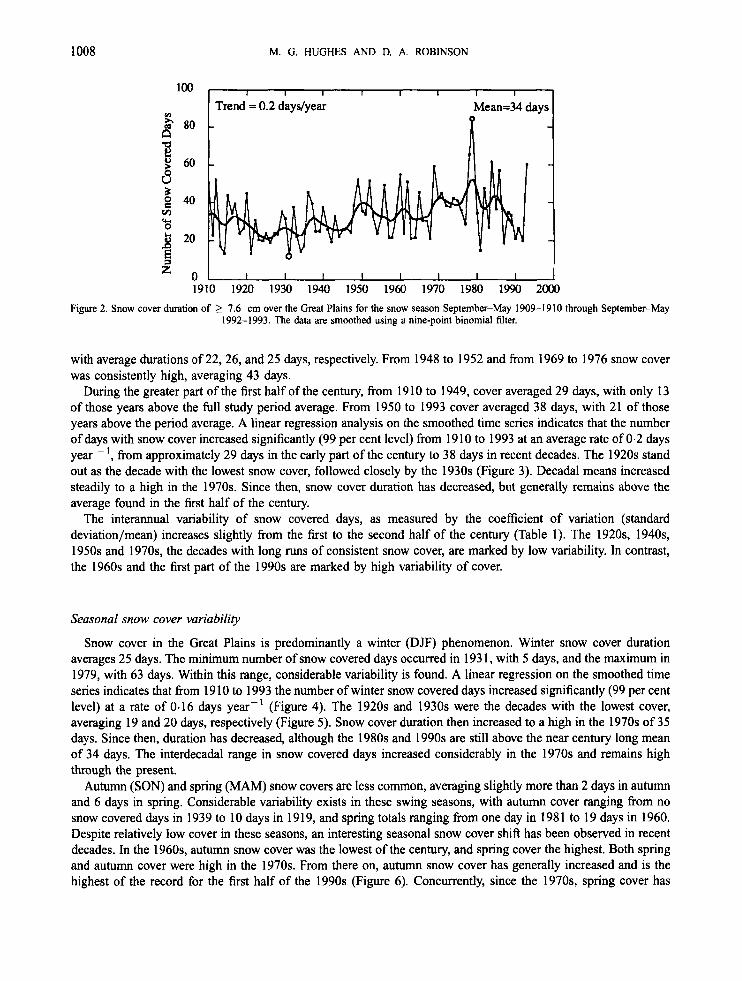
Decadal fluctuations in snow cover duration are evident on a regional basis and do not uniformly follow the Plains fluctuations discussed previously (Figure 9). The low cover observed throughout the Plains in the 1920s was associated with the least snow covered decade in North Dakota, eastern South Dakota, Iowa, and eastern Kansas,

GREAT PLAINS SNOW COVER 1013
Pl pc2
and the second least snow covered decade for eastern Nebraska, Colorado, and western Kansas. In eastern Montana, eastern Wyoming, and western Nebraska, however, snow cover was average to above average. In the 194Os, the pattern was reversed, whereby low snow cover was common in Montana, Wyoming, and western Nebraska, whereas the rest of the Plains region had average to above average cover. The very high cover in the 1970s was observed throughout all regions within the Plains except for those located in the south-west, and west central portions of the area. Despite very low snow cover in the 1980-1981, the 1980s was a decade of above average snow cover for all regions but the north-west. Snow cover during the fist part of the 1990s has been above average in the western and central Plains, and below average in the northern Plains.
pc3 la
V
1910~-1990s* by Decade
10 " " " " ' Pc4
1910s-l990s* by Decade
lo " " " " '
Pc6
19 10s-l990s* by Decade V
U 1910~-1990's* by Decade
1910~-1990s* by Decade
8
6
4
2
n " 1910~-199O's* by Decade
8
6
4
2
1910'~-1990s* by Decade Figure 9. Cumulative rank of seasonal snow cover by decades for each of the PCA-defined regions. Data are averaged by decades and ranked from 1 (lowest) to 9 (highest). The ranks are summed to obtain a regional decadal rank. Each bar represents one decade. *199&1993 only.

1014 M. G. HUGHES AND D. A. ROBINSON
Association of snow cover with other climate variables
To determine whether the variability within the snow cover record is associated with changes in other climate variables, Great Plains precipitation and temperature observations are examined. The time series for average snowfall, precipitation, and temperature from September through May, like snow cover duration, exhibit a considerable amount of temporal variability. Across the Plains, snowfall decreases from an average of 89 cm in the northern regions to approximately 50 cm in the southern regions (Table 111). Precipitation decreases in the opposite direction, ranging from a high of 61 cm in the southern regions to a low of 25 cm in the northern regions. Total precipitation in the eastern Plains is, in general, higher than in the western Plains. In the south-eastern part of the region, average temperatures are generally close to or above freezing throughout the snow season, thereby increasing the proportion of precipitation that falls as rain. The highest maximum and minimum temperatures are found in the southem part of the region, and the lowest are found in the north.
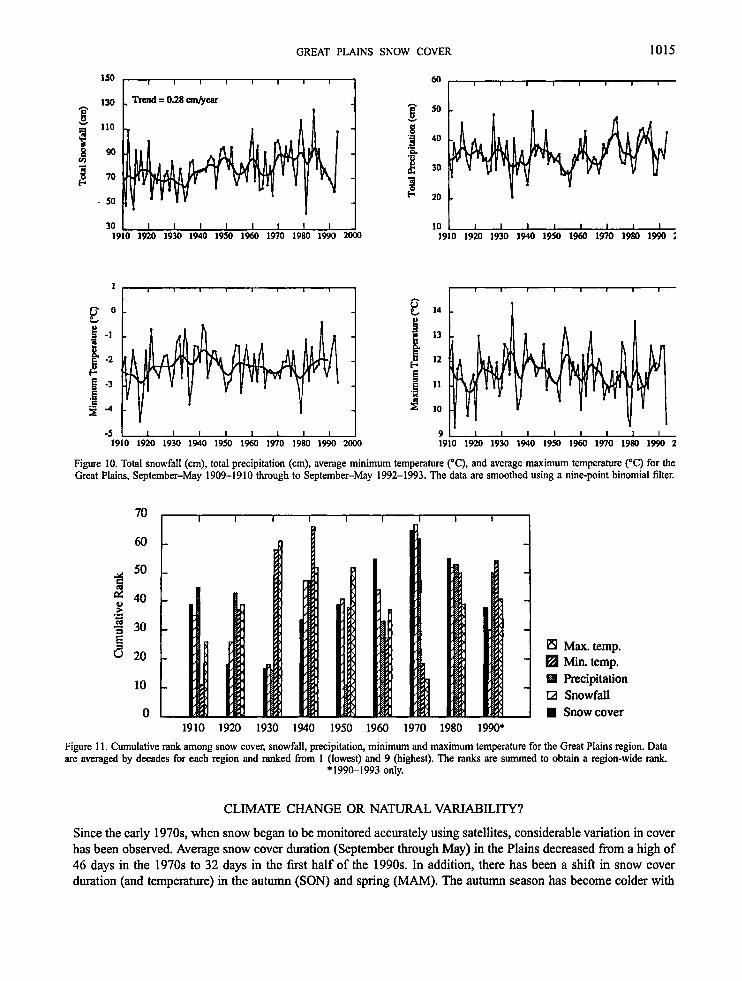
Linear regression analyses for all variables across the Plains from 1910 to 1993 indicate that increases in snow cover duration are accompanied by statistically significant increases in seasonal snowfall of 0.28 cm year-’ primarily in the northem and central Plains (Figure 10). No significant seasonal changes in average temperature or total precipitation are recognized.
Within decades, snowfall, temperature and precipitation are associated with snow cover duration, although relationships are not consistent from one decade to another (Figure 11). For example, moderate seasonal snow cover duration across the Plains in the 1910s is associated with moderate snowfall, abundant precipitation, and low temperatures. Similar snow cover duration in the 1950s, however, is accompanied by moderate snowfall, above average maximum temperatures, average minimum temperatures, and the lowest total precipitation on record. The extensive Plains snow cover of the 1970s is associated with the highest snowfall and the lowest maximum and minimum temperatures. The 198Os, the decade second only to the 1970s in snow cover had high snowfall, but average maximum and above average minimum temperatures. Linear regression analyses using winter (DJF) climate data for each of the eight regions finds that a positive correlation between snow cover and snowfall exists and is significant at the 99 per cent level (R2 = 0.7). Negative correlations between snow cover duration and temperature (maximum and minimum) are significant at the 99 per cent level (R2 = 0.6 and 0.4 respectively) (Figure 12).
A step-wise linear regression analysis using all the available climate variables shows that no more than three are needed to estimate snow cover for any region. R2 values range from a low of 0.59 in the west central (PC4) Plains to a high of 0.85 in the east central Plains (PC3). Six of the eight regions have R2 values of > 0.70, indicating that over 70 per cent of the variance in snow cover duration is explained by only two or three of the available climate variables (Table IV). In the southern regions, where duration and snowfall are lowest, snowfall is the most important climate variable for determining snow cover duration. In the northern regions, where moderate to high winter snowfall occurs, maximum temperature is the most significant variable. This is consistent with recent findings by Brown et al. (1995) who found that an increase in the sensitivity between snow cover duration and temperature occurs with increasing amounts of snowfall.
Table 111. Average September-May climate for Great Plains regionsa
Region
Variable PC 1 PC2 PC3 PC4 PC5 PC6 PC7 PC8 GP
Snow cover (d) 10 48 30 24 77 13 23 46 34 Snowfall ( cm) 46.2 89.9 74.7 109.2 90.0 62.2 71.9 85.3 78.8 Precipitation ( cm) 59.9 20.8 52.1 23.4 27.7 26.2 39.1 34.3 35.4
Maximum Temperature (“C) 15.6 9.3 11.6 11.6 6.1 15.6 13.2 9.6 11.6 Minimum Temperature (“C) 2.9 - 4.8 - 0.5 - 3.7 - 6.4 - 1.1 - 0.4 - 3.3 - 2.2
‘Mean number of snow cover days, average total snowfall and precipitation ( cm), and average maximum and minimum temperatures (“C) for 1910 to 1993.
GREAT PLAINS SNOW COVER 1015
I I I I I I I
-5 I I I I I I I I I
30 L I I I I I I I I I 10 1 I I I I I I I I 1910 1920 1930 1940 1950 1960 1970 1980 1990 Zoo0 1910 1920 1930 1940 1950 1960 1970 1980 1990 ;
9 1 1 I I I I I I I
Figure 10. Total snowfall (cm), total precipitation (cm), average minimum temperature (“C), and average maximum temperature (“C) for the Great Plains, September-May 1909-1910 through to September-May 1992-1993. The data are smoothed using a nine-point binomial filter.
70
60
50 ’ u 40 .L 2 30 4 4
z 8 20
10
0
Max.temp. Min. temp. I Precipitation GI Snowfall 1 Snowcover
1910 1920 1930 1940 1950 1960 1970 1980 1990* Figure 11. Cumulative rank among snow cover, snowfall, precipitation, minimum and maximum temperature for the Great Plains region. Data are averaged by decades for each region and ranked from 1 (lowest) and 9 (highest). The ranks are summed to obtain a region-wide rank.
* 199& I 993 only.
CLIMATE CHANGE OR NATURAL VARIABILITY?
Since the early 1970s, when snow began to be monitored accurately using satellites, considerable variation in cover has been observed. Average snow cover duration (September through May) in the Plains decreased from a high of 46 days in the 1970s to 32 days in the first half of the 1990s. In addition, there has been a shift in snow cover duration (and temperature) in the autumn (SON) and spring (MAM). The autumn season has become colder with

1016 M. G. HUGHES AND D. A. ROBINSON
80
K)
Q n
E
30
20
10 - 0 1 0 2 0 3 0 4 0 5 0 8 D 7 0
Snow cover 2 7.6 cm (days)
-6
u^ e-8 e! a t? -10 8
-12 E3 E E .- c -14
-16
I I 1 I 1 I - R'= 0.41
a .
10 I I 1 1 I I
2 9 R=0.14
. . 8 -
I . - . 3 - '
2 m 0 10 20 30 40 50 80 70
Snow cover 2 7.6 cm (days)
- 2 -
Snow cover 2 7.6 cm (days) Snow cover 2 7.6 cm (days) Figure 12. Association between winter (DJF) snow cover duration and snowfall, precipitation, minimum and maximum temperature.
Table IV. Significant variables resulting from the step-wise linear regression analysis for each regiona
Region
Variable PC 1 PC2 PC3 PC4 PC5 PC6 PC7 PC8
** * * - * ** Snowfall * * Precipitation ** - - - - Minimum temperature * * * ~ - - - Maximum temperature -
- - - *
** ** * ** * ** ** R2 0.74 0.8 1 0.85 0.59 0.67 0.75 0.76 0.77
"Significant variables are marked with an asterisk (*). The variable representing the greatest contributor to the total variance is marked with (**).

GREAT PLAINS SNOW COVER 1017
more snow covered days, and the spring has become warmer (particularly minimum temperatures) with fewer snow covered days, consistent with findings by Karl et al. (1993) and Groisman et al. (1994). Are these changes an indication of an anthropogenic climate change in response to increasing amounts of greenhouse gases in the atmosphere, or are they within the natural variability of the climate system?
When looking back over the near century-long record, it is clear that just more than two decades of satellite observations are not enough to draw conclusions regarding a human-induced climate change. When changes from the 1970s through to the 1990s are placed within the context of 84 years of climate fluctuations one may conclude that the 1970s, not the 1980s and 1990s, is a decade of anomalous snow cover. Snow cover duration in the 1980s and 199Os, although low compared with the 197Os, is well within the Plains-wide average for the century. Further research is needed to examine in more detail the recent changes in autumn and spring snow cover duration and their relationship to temperature and atmospheric circulation in this region. Autumn cover has reached its highest level of the past 84 years, and spring cover now approaches low levels not seen since the dust bowl years of the 1920s and 1930s. This shift in autumn and spring cover appears to correlate with changes in atmospheric circulation.
Since 1910, the Great Plains has experienced three snow ‘droughts’ accompanied by warmer than normal temperatures. Two of these (in the 1920s and 1940s) occurred when greenhouse gas concentrations were still rather close to pre-industrial levels. Given the large natural Variability in climate throughout the Plains over the past century, it is impossible to draw statistical conclusions regarding a recent anthropogenic climate change. Careful analysis of all available climate data is needed to recognize a shift away from the natural behaviour of snow cover in this region.
CONCLUSION
The variation of Great Plains snow cover, and its interactions with other surface climate variables has been examined for most of this century (1 9 10-1 993) using daily climate data for over 200 Plains stations. Considerable interannual spatial and temporal variability of snow cover is observed, along with a significant trend towards greater cover (0.2 days year-’). Also accompanying the increase in snow cover are notable fluctuations of the order of a decade in length. The interannual variability of duration has increased as well, with the largest changes found in the north-west, and south-east parts of the region. The increase in snow cover duration throughout the Plains is accompanied by an increase in snowfall, although no significant century-long trends in precipitation or temperatures are found. Snow cover in this region is linked closely to the other boundary surface climate variables, and in particular to snowfall and maximum temperature.
Long-term historical snow cover observations provide valuable insights into the nature and structure of climate variability. The historical snow data permit the placement of recent swings in climate into a long-term perspective. Owing to the serious climate change impacts predicted for the Plains region under an enhanced greenhouse scenario, the task of understanding snow cover variability, and quantifying the relationship between snow cover and the other surface climate variables has become even more important.
Results from our study suggest that the climate fluctuations observed in the Great Plains within the past few decades are within the range of the natural variability over the past century. Should the future Plains climate deviate, as projected by GCMs, from what has been observed this past century, it is reasonable to assume that the snow cover will change significantly as well. Therefore, understanding the past and current snow dynamics of the region is essential for recognizing any future changes in regional climate.
ACKNOWLEDGEMENTS
This work is supported by a NASA Global Climate Change Graduate Fellowship. It was also supported by National Science Foundation grants SES-9011869, ATM-93 1472 1, and SBR-9320786, and NASA grant NAGW- 3568.

1018 M. G. HUGHES AND D. A. ROBINSON
REFERENCES
Brown, R. D., Hughes, M. G. and Robinson, D. A. 1995. ‘Characterizing the long-term variability of snow cover extent over the interior of North
Brown, R. D. and Goodison, B. E. 1993. ‘Recent observed trends and modeled interannual variability in Canadian snow cover’, Proceedings of
Cess, R. D., et al. (19 co-authors) 1991. ‘Interpretation of snow-climate feedback as produced by 17 General Circulation Models’, Science, 253,
Foster, J. L. 1989. ‘The significance of the date of snow disappearance on the Arctic tundra as a possible indicator of climate change’, Arctic
Groisman, P, Karl, T. R. and Knight, R. W. 1994. ‘Observed impact of snow cover on the heat balance and the rise of continental spring
Hughes, M. G. and Robinson, D. A. 1993. ‘Creating temporally complete snow cover records using a new method for modeling snow depth
Karl T. R., Groisman, P, Knight, R. W. and Heim, R. R. Jr. 1993. ‘Recent variations of snow cover and snowfall in North America and their
Karl, T. R., Tarpley, D., Quayle, R. G., Dim, H. F., Robinson, D. A. and Bradley, R. S. 1989. ‘The recent climate record what it c& and cannot
Leathers, D. J. and Robinson, D. A. 1993. ‘The association between extremes in North American snow cover extent and United States
Leathers, D. J. and Palecki, M. A. 1992. ‘The Pacific/North American teleconnection pattern and United States climate. Part 11. Temporal
Matson, M. and Wiesnet, D. R. 1981. ‘New data base for climate studies’, Nature, 289, no. 5797, 451456. Meehl, G. A. and Washington, W. M. 1990. ‘CO2 climate sensitivity and snow-sea-ice albedo parameterization in an atmospheric GCM
Namias, J. 1985. ‘Some empirical evidence for the influence of snow cover on temperature and precipitation’, Mon. Wea. Rev, 113, 1542-1553. Robinson, D. A. 1988. ’Construction of a United States historical snow data base’, Proceedings of the 45th Eastern Snow Conference, pp.50-59. Robinson, D. A. 1993a. ‘Hemispheric snow cover from satellites’, Ann. of Glaciol., 17, 367-371. Robinson, D. A. 1993b. ‘Historical Daily Climatic Data for the United States’, Proceedings of the Eighth Conference on Applied Climatology,
Robinson, D. A. and Dewey, K. F. 1990. ‘Recent secular variations in the extent of northern hemisphere snow cover’, Geophys. Res. Lett., 17,
Robinson, D. A. and Hughes, M. G. 1991. ‘Snow cover variability in the Northern and Central Great Plains’, Great Plains Research, 1,93-I 13. Rosenweig, C. 1985. ’Potential C02-induced climate effects on North American wheat-producing regions’, Climate Change, 7, 367-389. SURFER, 1995. Golden Software, Yersion, 5.02, Golden, CO. SYSTAT Inc. 1992. Statistics, Yersion 5.2 Edition, SYSTAT, Inc., Evanston, Ill. U. S. EPA (Office of Research and Development, Office of Policy, Planning and Evaluation) 1990. ‘The Great Plains’, in Smith, J. B. and Tirpak,
D. A. (eds) The potential effects of global climate change in the United States, Hemisphere Publishing Corp., Washington, DC, pp. 25 1-280. Walsh, J. E., Jasperson, W. H. and Ross, B. 1985. ‘Influences of snow cover and soil moisture on monthly air temperature’, Mon. Wea. Rev,, 113,
756-768. Wanick, R. A. 1980. ‘Drought in the Great Plains: a case study of research on climate and society in the USA’, in Ausubel, J. and Biswas, A. K.
(eds) Climatic Constmints and Human Activities, Pergamon, New York, pp. 93-124. Wiesnet, D. R., Ropelewski, C. F., Kukla, G. J. and Robinson, D. A. 1987. ‘A discussion of the accuracy of NOAA satellite-derived global
seasonal snow cover measurements’, in Large Scale Effects of Seasonal Snow Cover. Proceedings of the Yancouver Symposium, August 1987, Publication 166, International Association of Hydrological Sciences, pp. 29 1-304.
America’, Ann. Glaciol., 21, 45-50.
the 50th Eastern Snow Conference, 1993, Quebec City, pp. 389-397.
888-892.
Alpine Res., 21, 6G70.
temperatures’, Science, 263, 198-200.
changes’, Proceedings of the Snow Watch Conference, Niagam-on-the-Lake, Ontario, Canada, March 29-April 1, pp. 15&163.
relation to precipitation and temperature variations’, 1 Climate, 6, 1327-1344.
tell us’, Rev Geophys., 27, 405-430.
temperatures’, 1 Climate, 6, 1345-1355.
characteristics and index specifications’, 1 Climate, 5, 707-716.
coupled to a mixed-layer ocean model’, Climate Change, 16, 283-306.
Anaheim, CA, pp. 264-269.
1557-1 560.