historical biomass of limnocalanus in lake michigan
TRANSCRIPT
Journal of Great Lakes Research 37 (2011) 159–164
Contents lists available at ScienceDirect
Journal of Great Lakes Research
j ourna l homepage: www.e lsev ie r.com/ locate / jg l r
Historical biomass of Limnocalanus in Lake Michigan
Jonathan P. Doubek ⁎, John T. LehmanDepartment of Ecology and Evolutionary Biology, University of Michigan, Natural Science Building, 830 North University Blvd, Ann Arbor, MI 48109-1048, USA
⁎ Corresponding author. Tel.: +1 734 763 4680.E-mail addresses: [email protected] (J.P. Doubek),
(J.T. Lehman).
0380-1330/$ – see front matter © 2010 International Adoi:10.1016/j.jglr.2010.11.012
a b s t r a c t
a r t i c l e i n f oArticle history:Received 14 July 2010Accepted 12 November 2010Available online 24 December 2010
Communicated by Makarewicz
Index words:Length–weight regressionDiel vertical migrationUnivoltine reproduction
The magnitude of a reported recent increase in the biomass of Limnocalanus macrurus Sars in Lake Michiganwas based on a length–weight regression model developed for a different species, Diaptomus siciloides. Wecreated a length–weight model specifically for Limnocalanus in Lake Michigan and discovered that the D.siciloides model gives satisfactory estimates for animals in May but not in subsequent months. AfterLimnocalanus mature to C6 copepodid instars, animals progressively add mass through June, July, and Augustwhile maintaining near-constant metasome lengths and widths. Adults begin to lose mass in September asmating and reproduction begins. By August, mass estimates based on D. siciloides can underestimateLimnocalanus biomass by more than four-fold. We inspected archival Lake Michigan collections ofLimnocalanus from 1985 to 1992 and calculated a mean summer biomass of 16.2 mg DW/m3, which isapproximately 3.5 times greater than previously reported. The pattern displayed by Limnocalanus isconsistent with its univoltine life history and synchronized cohort structure. Biomass may have genuinelyincreased since 2004, but the magnitude of the increase is likely much greater than reported. Increasednumerical abundance of Limnocalanus cohorts surviving to reproductive age appears to be themain reason fortheir increased biomass. This has important consequences for trophic interactions, bioenergetic considera-tions, and relative dominance with respect to Cladocera and Diaptomidae in Lake Michigan.
© 2010 International Association for Great Lakes Research. Published by Elsevier B.V. All rights reserved.
Introduction
Limnocalanus macrurus Sars is a large, glacial-relict, hypolimneticcopepod found in all five Laurentian Great Lakes of North America(Barbiero et al., 2001), in several other freshwater lakes in NorthAmerica once connected with the ocean (Carter et al., 1980), and inother circumpolar locations in Europe and Asia (Balcer et al., 1984).Because of its narrow physiological tolerances to temperature andoxygen (Carter, 1969; Gannon and Beeton, 1971; Kane et al., 2004; Roff,1973), its nutritional value for predators (Birge and Juday, 1922; Fish,1960; Price, 1963) and omnivorous habit (Bowers and Warren, 1977;Warren, 1983, 1985), L. macrurus may be a sensitive indicator species.
Limnocalanus, unlike diaptomid copepods, broadcast their eggsinto the surrounding water after fertilization; they do not brood them(Carter, 1969; Roff, 1972). The species is univoltine, andmating occursfrom late summer through winter as convective cooling deepens themixed layer. Nauplii grow throughout the winter and molt in thespring into copepodids, taking advantage of the increased food supply(Carter, 1969; Selgeby, 1975). It takes about 6 to 8 months for an eggto develop into an adult, and adults may live an additional 6 months.
ssociation for Great Lakes Research
C6 adults typically range from 2.4 mm to 2.9 mm in total length, andfemales are usually slightly larger in length than males (Balcer et al.,1984; Conway, 1977).
LakeMichigan has experienced a series of foodweb alterations, thepotential causes of which are active areas of research. It is episodicallyinvaded by non-native species (Bryan et al., 2005; Lehman, 1987;Stepien et al., 2005), and is now experiencing oligotrophication(Barbiero et al., 2002). Barbiero et al. (2009) reported substantiallyincreased L. macrurus summer biomass in Lake Michigan since 2004,compared to relatively stable levels between 1984 and 2003. Amongindividual crustaceans greater than 0.9 mm in length, the authorsreported that L. macrurus averaged 20% of the biomass in northernLake Michigan and 14% of the total zooplankton biomass in southernLake Michigan between 30 July and 1 September from 1984 to 2003.Between 2004 and 2006 these percentages increased to 62% and 46%,respectively. The authors noted that the L. macrurus increase wascontemporaneous with a decrease in the large zooplankter Daphniamendotae as well as with decreases in certain planktivorous fishes likealewife and bloater (see also Bunnell et al., 2009).
Barbiero et al. (2009) reported that their dry mass estimates forLimnocalanus were obtained from existing literature (Downing andRigler, 1984), but, in fact, Downing and Rigler do not provide length–weight regressions for Limnocalanus. Instead, Barbiero et al. (2009)used the length–weight equation for what they regarded to be theclosest taxon morphologically: Diaptomus siciloides (R. P. Barbiero,personal communication, 31 March 2009).
. Published by Elsevier B.V. All rights reserved.
160 J.P. Doubek, J.T. Lehman / Journal of Great Lakes Research 37 (2011) 159–164
We examined archival zooplankton samples collected fromMay toSeptember in Lake Michigan from 1985 to 1992, in order to quantifythe historical, seasonal patterns of abundance, biomass, and verticaldistribution of Limnocalanus. Furthermore, we created our ownlength–weight regression using L. macrurus to examine how closelyLimnocalanus conforms to the D. siciloides model and to evaluate anysystematic error in biomass that may have resulted from anunsuitable regression model.
Methods
Study area and zooplankton sampling
Plankton samples were collected throughout northern andsouthern Lake Michigan from 1985 to 1992 (Table 1). The principaltime-series reference station (St 2) was located 36 km offshore (100-m depth) of Grand Haven, Michigan. Surveys were conducted fromMay to September or October. All sites in Table 1 were used forgeographical biomass distribution. St 2 was usedmainly for analysis ofvertical distribution. Most of our length–weight analyses wereconducted with St 2 samples, although some measurements fromnorthern sampling sites were taken for comparison of length–weightrelationships around the lake.
Plankton were collected by submersible pumps and vertical nets.Pump samples of 250 L or 500 L were filtered through either 80-μm or150-μm net mesh aperture depending on targeted zooplankton size.Pumps were used in 1985 and 1986 only, and Puget Sound closingnets were used from 1985 to 1992. The nets had a 1-m diametermouth, aspect ratio of 5:1, and mesh apertures of either 130 μm or300 μm. In most cases, three replicate tows with the ship at anchorwere split with a Folsom plankton splitter and physically combinedfor composite counts (Lehman, 1987; Lehman and Caceres, 1993).Samples were obtained both day and night and at various depth stratawithin the water column to account for vertical distribution. Speci-mens were preserved in sucrose-formalin (Haney and Hall, 1973).
Limnocalanus length–weight relationships
Dry weight (W, μg) was estimated from length (L, mm) accordingto McCauley in Downing and Rigler (1984), as:
ln Wð Þ = ln að Þ + bð Þln Lð Þ ð1aÞ
or, alternatively,
W = aLb ð1bÞ
where ln(a) is the y-intercept, and (b) is the slope, both obtained bylinear regression using Eq. (1a).
Table 1Lake Michigan stations for Limnocalanus collections from 1985 to 1992.
Station Latitude (°N) Longitude (°W) Sample depth (m)
2 43° 86° 40' 903 43° 40' 87° 1507 43° 57' 86° 40.5' 908 43° 57' 86° 46.4' 16010 45° 86° 30' 20016 44° 30' 87° 18.7' 9017 44° 87° 10518 43° 11.4' 87° 40.2' 9020 43° 87° 25' 90X2 43° 86° 25' 70SK3 42° 42.9' 86° 27.1' 75MC3 44° 5.5' 87° 26' W 75MW4 43° 11.2' N 87° 40.13' W 90
Specimens were isolated and rinsed individually from archivedcollections and were sorted into seven different metasome lengthclasses (1.1 mm–1.7 mm, in increments of 0.1 mm) using a Wild M5Astereomicroscope equipped with a calibrated eyepiece micrometer.Depending on specimen length, six to fourteen individuals of equallength were placed on tared light-gauge aluminum boats (Dumontet al., 1975; Edmondson and Winberg, 1971; Makarewicz and Likens,1979), and dried to constant weight overnight at 60 °C (e.g., Burns,1969; Makarewicz and Likens, 1979; Pace and Orcutt, 1981). Afterdrying, samples were cooled to room temperature over silica gel forabout 30 minutes before being weighed using a CAHN 29 electro-balance, with silica gel inside the measuring chamber. Weights weregiven about 3 minutes to stabilize before being recorded. Initial tareweights were subtracted from final weights and divided by number ofspecimens contained to determinemean individual dryweight values.
Linear regression
The length–weight regression reported by McCauley (1984) forD. siciloides used total length, excluding caudal setae, as its lengthmetric. We measured metasome length for Limnocalanus in oursamples. In order to permit a direct comparison of data sets, weconstructed a regression for Limnocalanus that could predict totallength from metasome length. Animals were measured with a WildM5A stereomicroscope equipped with a calibrated eyepiece microm-eter as encountered in a Petri dish. Both metasome length and totallength excluding caudal setae were measured for each animal (N=38specimens). The length measurements were taken from samplescollected by vertical tows (90-m to the surface) at St 2 on 16 May1986, 4 June 1986, and 9 September 1986. The data were subjected tolinear regression, with the result:
Ltot = 1:481Lmeta + 0:1305 ð2Þ
The goodness-of-fit of the linear regression (r2) was 0.968.For D. siciloides, McCauley (1984) reported ln(a)=1.05 and
b=2.46 with L based on total specimen length excluding the caudalsetae. McCauley (1984) assembled these regression statistics fromPace and Orcutt (1981), who reported a sample size of 26 specimensand goodness-of-fit of the linear regression equal to 0.59, but the timeperiod or range of instars included was not reported.
Biomass estimates
Metasome lengths for 30 Limnocalanus from each sample weremeasured as haphazardly encountered in a Petri dish. Average valuesfor individual biomass (μg) were calculated by using first Eq. (2) andthen Eq. (1b) with coefficients specific to Limnocalanus. Biomass percubic meter was then calculated by multiplying mean individualbiomass by numerical abundance in the collection. Populationbiomass was reported as mg DW/m3 to conform with published data.
Vertical distribution
Data from closing nets documented the dielmigration of L. macrurusduring various months in the years 1985 to 1990 with the exception of1988. We selected stage hauls taken around mid-day and midnight toquantify maximum diel migrations.
We calculated the centroids of the population at each sampling sitefrom the fraction of the total censused population in each depthstratum. Centroid depth (zc) was computed from stratum midpoints(zi) and fractions of population in each stratum (Pi) as:
zc = Σ zi × Pi ð3Þ
where i is the stratum index.
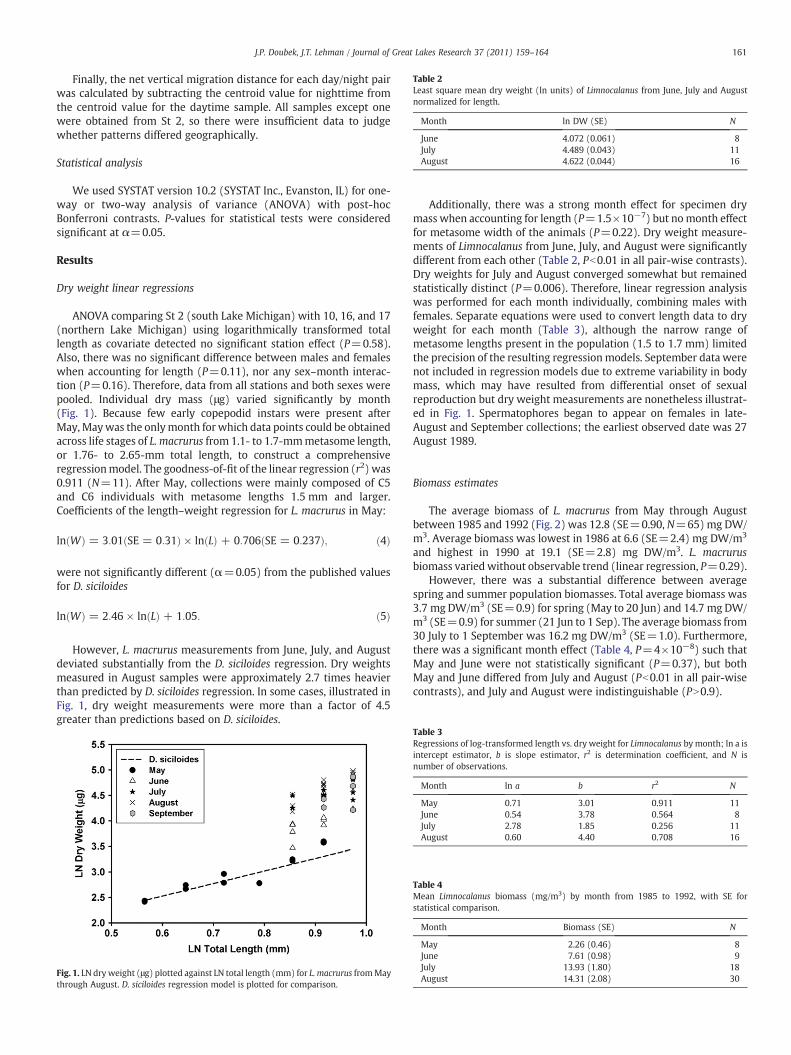
Table 2Least square mean dry weight (ln units) of Limnocalanus from June, July and Augustnormalized for length.
Month ln DW (SE) N
June 4.072 (0.061) 8July 4.489 (0.043) 11August 4.622 (0.044) 16
161J.P. Doubek, J.T. Lehman / Journal of Great Lakes Research 37 (2011) 159–164
Finally, the net vertical migration distance for each day/night pairwas calculated by subtracting the centroid value for nighttime fromthe centroid value for the daytime sample. All samples except onewere obtained from St 2, so there were insufficient data to judgewhether patterns differed geographically.
Statistical analysis
We used SYSTAT version 10.2 (SYSTAT Inc., Evanston, IL) for one-way or two-way analysis of variance (ANOVA) with post-hocBonferroni contrasts. P-values for statistical tests were consideredsignificant at α=0.05.
Results
Dry weight linear regressions
ANOVA comparing St 2 (south Lake Michigan) with 10, 16, and 17(northern Lake Michigan) using logarithmically transformed totallength as covariate detected no significant station effect (P=0.58).Also, there was no significant difference between males and femaleswhen accounting for length (P=0.11), nor any sex–month interac-tion (P=0.16). Therefore, data from all stations and both sexes werepooled. Individual dry mass (μg) varied significantly by month(Fig. 1). Because few early copepodid instars were present afterMay, Maywas the onlymonth for which data points could be obtainedacross life stages of L. macrurus from 1.1- to 1.7-mmmetasome length,or 1.76- to 2.65-mm total length, to construct a comprehensiveregressionmodel. The goodness-of-fit of the linear regression (r2) was0.911 (N=11). After May, collections were mainly composed of C5and C6 individuals with metasome lengths 1.5 mm and larger.Coefficients of the length–weight regression for L. macrurus in May:
ln Wð Þ = 3:01 SE = 0:31ð Þ × ln Lð Þ + 0:706 SE = 0:237ð Þ; ð4Þ
were not significantly different (α=0.05) from the published valuesfor D. siciloides
ln Wð Þ = 2:46 × ln Lð Þ + 1:05: ð5Þ
However, L. macrurus measurements from June, July, and Augustdeviated substantially from the D. siciloides regression. Dry weightsmeasured in August samples were approximately 2.7 times heavierthan predicted by D. siciloides regression. In some cases, illustrated inFig. 1, dry weight measurements were more than a factor of 4.5greater than predictions based on D. siciloides.
Fig. 1. LN dryweight (μg) plotted against LN total length (mm) for L. macrurus fromMaythrough August. D. siciloides regression model is plotted for comparison.
Additionally, there was a strong month effect for specimen drymass when accounting for length (P=1.5×10⁻⁷) but nomonth effectfor metasome width of the animals (P=0.22). Dry weight measure-ments of Limnocalanus from June, July, and August were significantlydifferent from each other (Table 2, Pb0.01 in all pair-wise contrasts).Dry weights for July and August converged somewhat but remainedstatistically distinct (P=0.006). Therefore, linear regression analysiswas performed for each month individually, combining males withfemales. Separate equations were used to convert length data to dryweight for each month (Table 3), although the narrow range ofmetasome lengths present in the population (1.5 to 1.7 mm) limitedthe precision of the resulting regressionmodels. September data werenot included in regression models due to extreme variability in bodymass, which may have resulted from differential onset of sexualreproduction but dry weight measurements are nonetheless illustrat-ed in Fig. 1. Spermatophores began to appear on females in late-August and September collections; the earliest observed date was 27August 1989.
Biomass estimates
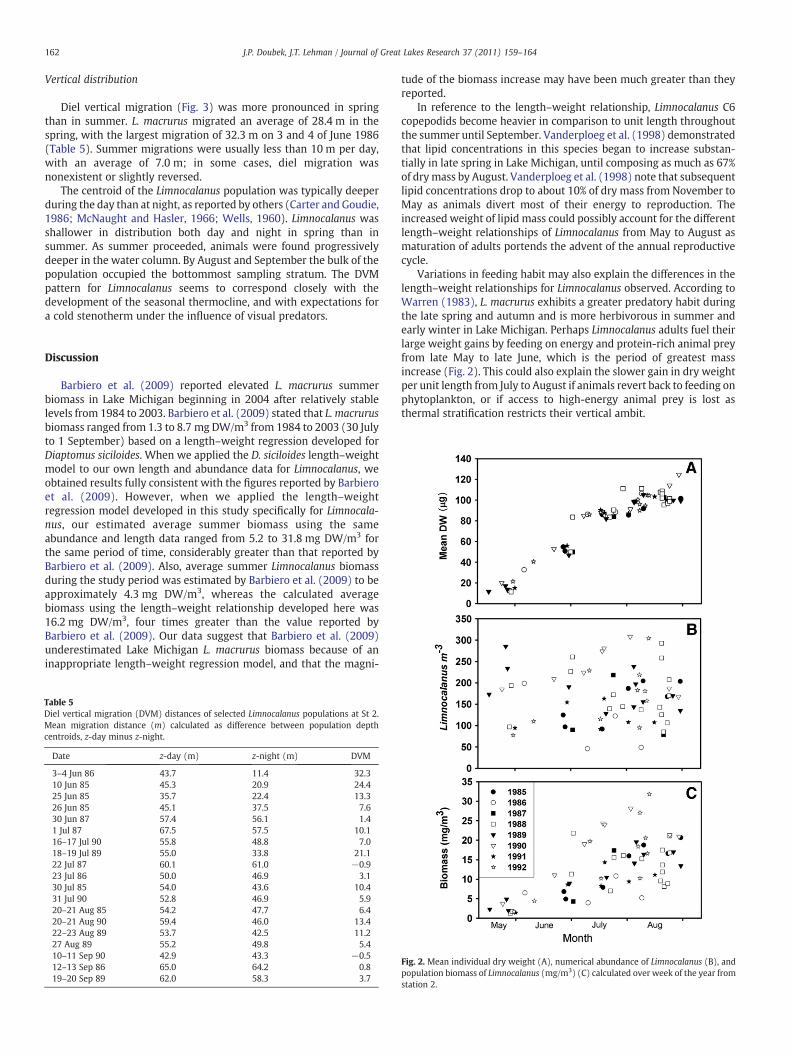
The average biomass of L. macrurus from May through Augustbetween 1985 and 1992 (Fig. 2) was 12.8 (SE=0.90, N=65) mg DW/m3. Average biomass was lowest in 1986 at 6.6 (SE=2.4) mg DW/m3
and highest in 1990 at 19.1 (SE=2.8) mg DW/m3. L. macrurusbiomass varied without observable trend (linear regression, P=0.29).
However, there was a substantial difference between averagespring and summer population biomasses. Total average biomass was3.7 mg DW/m3 (SE=0.9) for spring (May to 20 Jun) and 14.7 mg DW/m3 (SE=0.9) for summer (21 Jun to 1 Sep). The average biomass from30 July to 1 September was 16.2 mg DW/m3 (SE=1.0). Furthermore,there was a significant month effect (Table 4, P=4×10⁻⁸) such thatMay and June were not statistically significant (P=0.37), but bothMay and June differed from July and August (Pb0.01 in all pair-wisecontrasts), and July and August were indistinguishable (PN0.9).
Table 3Regressions of log-transformed length vs. dry weight for Limnocalanus bymonth; ln a isintercept estimator, b is slope estimator, r2 is determination coefficient, and N isnumber of observations.
Month ln a b r2 N
May 0.71 3.01 0.911 11June 0.54 3.78 0.564 8July 2.78 1.85 0.256 11August 0.60 4.40 0.708 16
Table 4Mean Limnocalanus biomass (mg/m3) by month from 1985 to 1992, with SE forstatistical comparison.
Month Biomass (SE) N
May 2.26 (0.46) 8June 7.61 (0.98) 9July 13.93 (1.80) 18August 14.31 (2.08) 30
162 J.P. Doubek, J.T. Lehman / Journal of Great Lakes Research 37 (2011) 159–164
Vertical distribution
Diel vertical migration (Fig. 3) was more pronounced in springthan in summer. L. macrurus migrated an average of 28.4 m in thespring, with the largest migration of 32.3 m on 3 and 4 of June 1986(Table 5). Summer migrations were usually less than 10 m per day,with an average of 7.0 m; in some cases, diel migration wasnonexistent or slightly reversed.
The centroid of the Limnocalanus population was typically deeperduring the day than at night, as reported by others (Carter and Goudie,1986; McNaught and Hasler, 1966; Wells, 1960). Limnocalanus wasshallower in distribution both day and night in spring than insummer. As summer proceeded, animals were found progressivelydeeper in the water column. By August and September the bulk of thepopulation occupied the bottommost sampling stratum. The DVMpattern for Limnocalanus seems to correspond closely with thedevelopment of the seasonal thermocline, and with expectations fora cold stenotherm under the influence of visual predators.
Discussion
Barbiero et al. (2009) reported elevated L. macrurus summerbiomass in Lake Michigan beginning in 2004 after relatively stablelevels from 1984 to 2003. Barbiero et al. (2009) stated that L. macrurusbiomass ranged from 1.3 to 8.7 mg DW/m3 from 1984 to 2003 (30 Julyto 1 September) based on a length–weight regression developed forDiaptomus siciloides. When we applied the D. siciloides length–weightmodel to our own length and abundance data for Limnocalanus, weobtained results fully consistent with the figures reported by Barbieroet al. (2009). However, when we applied the length–weightregression model developed in this study specifically for Limnocala-nus, our estimated average summer biomass using the sameabundance and length data ranged from 5.2 to 31.8 mg DW/m3 forthe same period of time, considerably greater than that reported byBarbiero et al. (2009). Also, average summer Limnocalanus biomassduring the study period was estimated by Barbiero et al. (2009) to beapproximately 4.3 mg DW/m3, whereas the calculated averagebiomass using the length–weight relationship developed here was16.2 mg DW/m3, four times greater than the value reported byBarbiero et al. (2009). Our data suggest that Barbiero et al. (2009)underestimated Lake Michigan L. macrurus biomass because of aninappropriate length–weight regression model, and that the magni-
Table 5Diel vertical migration (DVM) distances of selected Limnocalanus populations at St 2.Mean migration distance (m) calculated as difference between population depthcentroids, z-day minus z-night.
Date z-day (m) z-night (m) DVM
3–4 Jun 86 43.7 11.4 32.310 Jun 85 45.3 20.9 24.425 Jun 85 35.7 22.4 13.326 Jun 85 45.1 37.5 7.630 Jun 87 57.4 56.1 1.41 Jul 87 67.5 57.5 10.116–17 Jul 90 55.8 48.8 7.018–19 Jul 89 55.0 33.8 21.122 Jul 87 60.1 61.0 −0.923 Jul 86 50.0 46.9 3.130 Jul 85 54.0 43.6 10.431 Jul 90 52.8 46.9 5.920–21 Aug 85 54.2 47.7 6.420–21 Aug 90 59.4 46.0 13.422–23 Aug 89 53.7 42.5 11.227 Aug 89 55.2 49.8 5.410–11 Sep 90 42.9 43.3 −0.512–13 Sep 86 65.0 64.2 0.819–20 Sep 89 62.0 58.3 3.7
tude of the biomass increase may have been much greater than theyreported.
In reference to the length–weight relationship, Limnocalanus C6copepodids become heavier in comparison to unit length throughoutthe summer until September. Vanderploeg et al. (1998) demonstratedthat lipid concentrations in this species began to increase substan-tially in late spring in Lake Michigan, until composing as much as 67%of drymass by August. Vanderploeg et al. (1998) note that subsequentlipid concentrations drop to about 10% of dry mass from November toMay as animals divert most of their energy to reproduction. Theincreased weight of lipid mass could possibly account for the differentlength–weight relationships of Limnocalanus from May to August asmaturation of adults portends the advent of the annual reproductivecycle.
Variations in feeding habit may also explain the differences in thelength–weight relationships for Limnocalanus observed. According toWarren (1983), L. macrurus exhibits a greater predatory habit duringthe late spring and autumn and is more herbivorous in summer andearly winter in Lake Michigan. Perhaps Limnocalanus adults fuel theirlarge weight gains by feeding on energy and protein-rich animal preyfrom late May to late June, which is the period of greatest massincrease (Fig. 2). This could also explain the slower gain in dry weightper unit length from July to August if animals revert back to feeding onphytoplankton, or if access to high-energy animal prey is lost asthermal stratification restricts their vertical ambit.
Fig. 2. Mean individual dry weight (A), numerical abundance of Limnocalanus (B), andpopulation biomass of Limnocalanus (mg/m3) (C) calculated over week of the year fromstation 2.
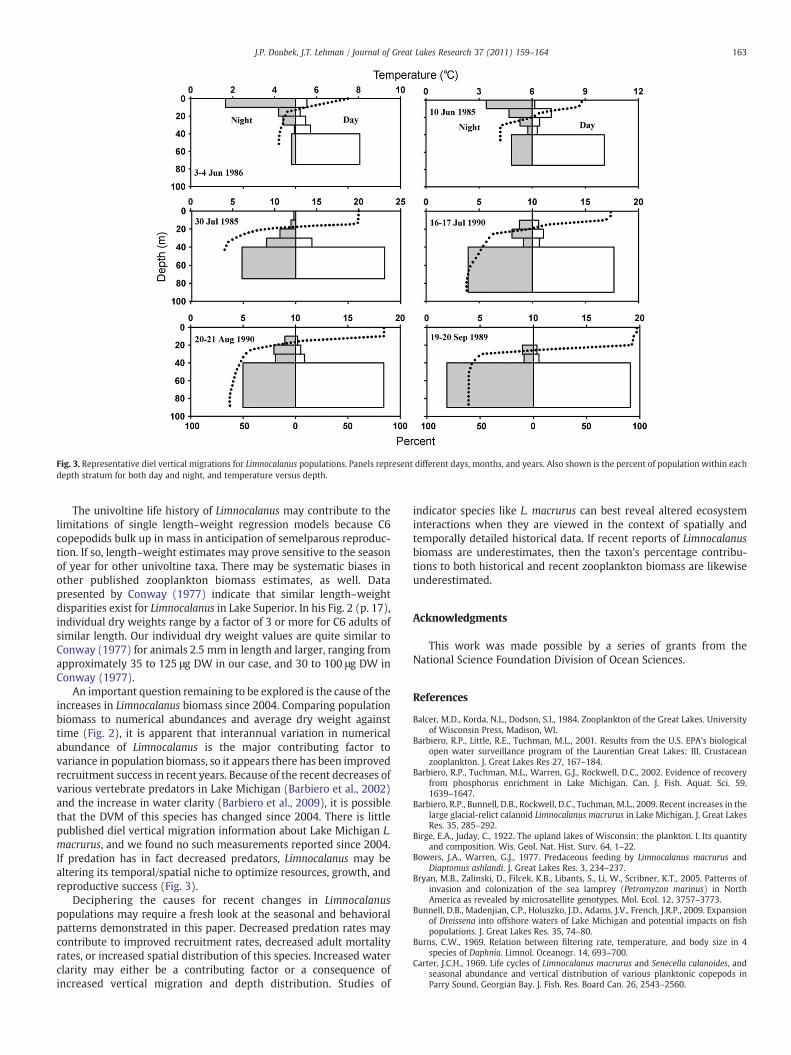
Fig. 3. Representative diel vertical migrations for Limnocalanus populations. Panels represent different days, months, and years. Also shown is the percent of population within eachdepth stratum for both day and night, and temperature versus depth.
163J.P. Doubek, J.T. Lehman / Journal of Great Lakes Research 37 (2011) 159–164
The univoltine life history of Limnocalanus may contribute to thelimitations of single length–weight regression models because C6copepodids bulk up in mass in anticipation of semelparous reproduc-tion. If so, length–weight estimates may prove sensitive to the seasonof year for other univoltine taxa. There may be systematic biases inother published zooplankton biomass estimates, as well. Datapresented by Conway (1977) indicate that similar length–weightdisparities exist for Limnocalanus in Lake Superior. In his Fig. 2 (p. 17),individual dry weights range by a factor of 3 or more for C6 adults ofsimilar length. Our individual dry weight values are quite similar toConway (1977) for animals 2.5 mm in length and larger, ranging fromapproximately 35 to 125 μg DW in our case, and 30 to 100 μg DW inConway (1977).
An important question remaining to be explored is the cause of theincreases in Limnocalanus biomass since 2004. Comparing populationbiomass to numerical abundances and average dry weight againsttime (Fig. 2), it is apparent that interannual variation in numericalabundance of Limnocalanus is the major contributing factor tovariance in population biomass, so it appears there has been improvedrecruitment success in recent years. Because of the recent decreases ofvarious vertebrate predators in Lake Michigan (Barbiero et al., 2002)and the increase in water clarity (Barbiero et al., 2009), it is possiblethat the DVM of this species has changed since 2004. There is littlepublished diel vertical migration information about Lake Michigan L.macrurus, and we found no such measurements reported since 2004.If predation has in fact decreased predators, Limnocalanus may bealtering its temporal/spatial niche to optimize resources, growth, andreproductive success (Fig. 3).
Deciphering the causes for recent changes in Limnocalanuspopulations may require a fresh look at the seasonal and behavioralpatterns demonstrated in this paper. Decreased predation rates maycontribute to improved recruitment rates, decreased adult mortalityrates, or increased spatial distribution of this species. Increased waterclarity may either be a contributing factor or a consequence ofincreased vertical migration and depth distribution. Studies of
indicator species like L. macrurus can best reveal altered ecosysteminteractions when they are viewed in the context of spatially andtemporally detailed historical data. If recent reports of Limnocalanusbiomass are underestimates, then the taxon's percentage contribu-tions to both historical and recent zooplankton biomass are likewiseunderestimated.
Acknowledgments
This work was made possible by a series of grants from theNational Science Foundation Division of Ocean Sciences.
References
Balcer, M.D., Korda, N.L., Dodson, S.I., 1984. Zooplankton of the Great Lakes. Universityof Wisconsin Press, Madison, WI.
Barbiero, R.P., Little, R.E., Tuchman, M.L., 2001. Results from the U.S. EPA's biologicalopen water surveillance program of the Laurentian Great Lakes: III. Crustaceanzooplankton. J. Great Lakes Res 27, 167–184.
Barbiero, R.P., Tuchman, M.L., Warren, G.J., Rockwell, D.C., 2002. Evidence of recoveryfrom phosphorus enrichment in Lake Michigan. Can. J. Fish. Aquat. Sci. 59,1639–1647.
Barbiero, R.P., Bunnell, D.B., Rockwell, D.C., Tuchman, M.L., 2009. Recent increases in thelarge glacial-relict calanoid Limnocalanus macrurus in Lake Michigan. J. Great LakesRes. 35, 285–292.
Birge, E.A., Juday, C., 1922. The upland lakes of Wisconsin: the plankton. I. Its quantityand composition. Wis. Geol. Nat. Hist. Surv. 64, 1–22.
Bowers, J.A., Warren, G.J., 1977. Predaceous feeding by Limnocalanus macrurus andDiaptomus ashlandi. J. Great Lakes Res. 3, 234–237.
Bryan, M.B., Zalinski, D., Filcek, K.B., Libants, S., Li, W., Scribner, K.T., 2005. Patterns ofinvasion and colonization of the sea lamprey (Petromyzon marinus) in NorthAmerica as revealed by microsatellite genotypes. Mol. Ecol. 12, 3757–3773.
Bunnell, D.B., Madenjian, C.P., Holuszko, J.D., Adams, J.V., French, J.R.P., 2009. Expansionof Dreissena into offshore waters of Lake Michigan and potential impacts on fishpopulations. J. Great Lakes Res. 35, 74–80.
Burns, C.W., 1969. Relation between filtering rate, temperature, and body size in 4species of Daphnia. Limnol. Oceanogr. 14, 693–700.
Carter, J.C.H., 1969. Life cycles of Limnocalanus macrurus and Senecella calanoides, andseasonal abundance and vertical distribution of various planktonic copepods inParry Sound, Georgian Bay. J. Fish. Res. Board Can. 26, 2543–2560.
164 J.P. Doubek, J.T. Lehman / Journal of Great Lakes Research 37 (2011) 159–164
Carter, J.C.H., Goudie, K.A., 1986. Diel vertical migrations and horizontal distributions ofLimnocalanus macrurus and Senecella calanoides (Copepoda, Calanoida) in Lakes ofSouthern Ontario in relation to planktivorous fish. Can. J. Fish. Aquat. Sci. 12,2508–2514.
Carter, J.C.H., Dadswell, M.J., Roff, J.C., Sprules, W.G., 1980. Distribution andzoogeography of planktonic crustaceans and dipterans in glaciated eastern NorthAmerica. Can. J. Zool. 57, 940–942.
Conway, J.B., 1977. Seasonal and depth distribution of Limnocalanus macrurus at a siteon western Lake Superior. J. Great Lakes Res. 3, 15–19.
Downing, J.A., Rigler, F.H., 1984. Manual on methods for the assessment of secondaryproductivity in fresh waters. Blackwell Scientific Publications, Oxford, UK.
Dumont, H.J., van de Velde, I., Dumont, S., 1975. The dry weight estimate of biomass in asection of Cladocera, Copepoda and Rotifera from the plankton, periphyton andbenthos of continental waters. Oecologia 19, 75–97.
Edmondson, W.T., Winberg, G.G., 1971. A manual on methods for the assessment ofsecondary productivity in fresh waters. Blackwell Scientific Publications, Oxford,UK.
Fish, C.J., 1960. Limnological survey of eastern and central Lake Erie, 1928-1929. U.S.Fish. Wildl. Serv., Spec. Sci. Rpt. Fish. No., 334.
Gannon, J.E., Beeton, A.M., 1971. The decline of the large zooplankter Limnocalanusmacrurus Sars (Copepoda, Calanoida). Lake Erie. In Proc. 14th Conf. Great Lakes Res. :Great Lakes Res. Div. University of Michigan, pp. 27–38.
Haney, J.F., Hall, D.J., 1973. Sugar-coated Daphnia – preservation technique forCladocera. Limnol. Oceanogr. 18, 331–333.
Kane, D.D., Gannon, J.E., Culver, D.A., 2004. The status of Limnocalanus macrurus(Copepoda: Calanoida: Centropagidae) in Lake Erie. J. Great Lakes Res. 30, 22–30.
Lehman, J.T., 1987. Palearctic predator invades North American Great Lakes. Oecologia74, 478–480.
Lehman, J.T., Caceres, C., 1993. Food web responses to species invasion by a predatoryinvertebrate: Bythotrephes in Lake Michigan. Limnol. Oceanogr. 37, 879–891.
Makarewicz, J.C., Likens, G.E., 1979. Structure and function of the zooplanktoncommunity of Mirror Lake New Hampshire. Ecol. Monogr. 49, 109–127.
McCauley, E., 1984. The estimation of the abundance and biomass of zooplankton insamples. In: Downing, J.A., Rigler, F.H. (Eds.), Manual on methods for theassessment of secondary productivity in fresh waters. Blackwell ScientificPublications, Oxford, UK, pp. 228–265.
McNaught, D.C., Hasler, A.C., 1966. Photoenvironments of planktonic Crustacea in LakeMichigan. Verh. Int. Ver. Limnol. 16, 194–203.
Pace, M.L., Orcutt, J.D., 1981. The relative importance of protozoans, rotifers andcrustaceans in a freshwater zooplankton community. Limnol. Oceanogr. 26, 822–830.
Price, J.W., 1963. A studyof the foodhabits of someLake Eriefish. Bull. OhioBiol. Surv. 2 (1),1–89.
Roff, J.C., 1972. Aspects of the reproductive biology of the planktonic copepodLimnocalanus macrurus. Crustaceana 22, 155–160.
Roff, J.C., 1973. Oxygen consumption of Limnocalanus macrurus Sars (Calanoida,Copepoda) in relation to environmental conditions. Can. J. Zool. 51, 877–885.
Selgeby, J.H., 1975. Life histories and abundance of Crustacean zooplankton in the outletof Lake Superior, 1971-1972. J. Fish. Res. Board Can. 32, 461–470.
Stepien, C.A., Brown, J.E., Neilson, M.E., Tumeo, M.A., 2005. Genetic diversity of invasivespecies in the Great Lakes versus their Eurasian source populations: Insights for riskanalysis. Risk Anal. 4, 1043–1060.
Vanderploeg, H.A., Cavaletto, J.F., Liebig, J.R., Gardner, W.S., 1998. Limnocalanusmacrurus (Copepoda: Calanoida) retains a marine arctic lipid and life cycle strategyin Lake Michigan. J. Plankton Res. 20, 1581–1597.
Warren, G.J., 1983. Predation by Limnocalanus as a potentially major food source ofwinter naupliar mortality in Lake Michigan. J. Great Lakes Res. 9, 389–395.
Warren, G.J., 1985. Predaceous feeding habits of Limnocalanus macrurus. J. Plankton Res.7, 537–552.
Wells, L., 1960. Seasonal abundance and vertical movements of planktonic crustacea inLake Michigan. U.S. Fish Wildl. Serv. Fish. Bull. 60, 343–369.