historic data bonds, stocks
DESCRIPTION
Damodaran Historic DataTRANSCRIPT
Returns by year
Page 1
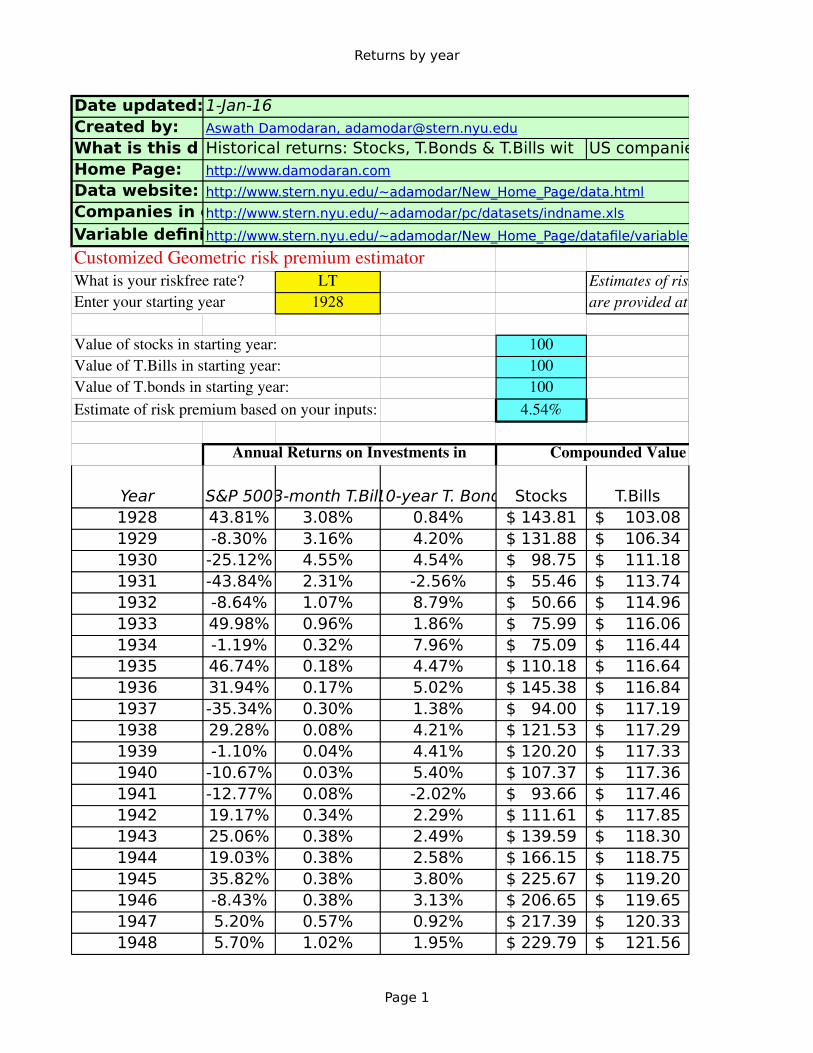
Date updated:1-Jan-16Created by:What is this d Historical returns: Stocks, T.Bonds & T.Bills wit US companiesHome Page:Data website:Companies in eVariable defini
Customized Geometric risk premium estimatorWhat is your riskfree rate? LT Estimates of risk premiums from 1928, over the last 50 years and over the last 10 yearsEnter your starting year 1928 are provided at the bottom of this table.
Value of stocks in starting year: 100Value of T.Bills in starting year: 100Value of T.bonds in starting year: 100Estimate of risk premium based on your inputs: 4.54%
Annual Returns on Investments in Compounded Value of $ 100
Year S&P 5003-month T.Bill10-year T. Bond Stocks T.Bills1928 43.81% 3.08% 0.84% $ 143.81 $ 103.08 1929 -8.30% 3.16% 4.20% $ 131.88 $ 106.34 1930 -25.12% 4.55% 4.54% $ 98.75 $ 111.18 1931 -43.84% 2.31% -2.56% $ 55.46 $ 113.74 1932 -8.64% 1.07% 8.79% $ 50.66 $ 114.96 1933 49.98% 0.96% 1.86% $ 75.99 $ 116.06 1934 -1.19% 0.32% 7.96% $ 75.09 $ 116.44 1935 46.74% 0.18% 4.47% $ 110.18 $ 116.64 1936 31.94% 0.17% 5.02% $ 145.38 $ 116.84 1937 -35.34% 0.30% 1.38% $ 94.00 $ 117.19 1938 29.28% 0.08% 4.21% $ 121.53 $ 117.29 1939 -1.10% 0.04% 4.41% $ 120.20 $ 117.33 1940 -10.67% 0.03% 5.40% $ 107.37 $ 117.36 1941 -12.77% 0.08% -2.02% $ 93.66 $ 117.46 1942 19.17% 0.34% 2.29% $ 111.61 $ 117.85 1943 25.06% 0.38% 2.49% $ 139.59 $ 118.30 1944 19.03% 0.38% 2.58% $ 166.15 $ 118.75 1945 35.82% 0.38% 3.80% $ 225.67 $ 119.20 1946 -8.43% 0.38% 3.13% $ 206.65 $ 119.65 1947 5.20% 0.57% 0.92% $ 217.39 $ 120.33 1948 5.70% 1.02% 1.95% $ 229.79 $ 121.56
Aswath Damodaran, [email protected]
http://www.damodaran.com
http://www.stern.nyu.edu/~adamodar/New_Home_Page/data.html
http://www.stern.nyu.edu/~adamodar/pc/datasets/indname.xls
http://www.stern.nyu.edu/~adamodar/New_Home_Page/datafile/variable.htm
Returns by year
Page 2
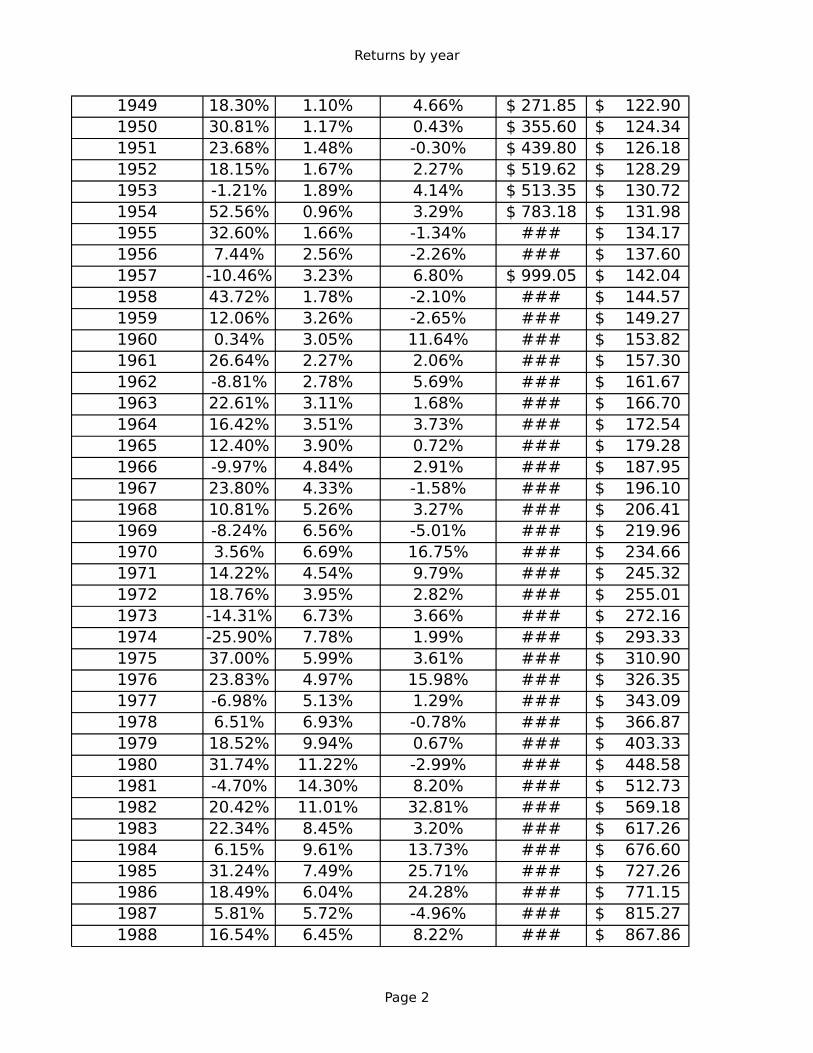
1949 18.30% 1.10% 4.66% $ 271.85 $ 122.90 1950 30.81% 1.17% 0.43% $ 355.60 $ 124.34 1951 23.68% 1.48% -0.30% $ 439.80 $ 126.18 1952 18.15% 1.67% 2.27% $ 519.62 $ 128.29 1953 -1.21% 1.89% 4.14% $ 513.35 $ 130.72 1954 52.56% 0.96% 3.29% $ 783.18 $ 131.98 1955 32.60% 1.66% -1.34% ### $ 134.17 1956 7.44% 2.56% -2.26% ### $ 137.60 1957 -10.46% 3.23% 6.80% $ 999.05 $ 142.04 1958 43.72% 1.78% -2.10% ### $ 144.57 1959 12.06% 3.26% -2.65% ### $ 149.27 1960 0.34% 3.05% 11.64% ### $ 153.82 1961 26.64% 2.27% 2.06% ### $ 157.30 1962 -8.81% 2.78% 5.69% ### $ 161.67 1963 22.61% 3.11% 1.68% ### $ 166.70 1964 16.42% 3.51% 3.73% ### $ 172.54 1965 12.40% 3.90% 0.72% ### $ 179.28 1966 -9.97% 4.84% 2.91% ### $ 187.95 1967 23.80% 4.33% -1.58% ### $ 196.10 1968 10.81% 5.26% 3.27% ### $ 206.41 1969 -8.24% 6.56% -5.01% ### $ 219.96 1970 3.56% 6.69% 16.75% ### $ 234.66 1971 14.22% 4.54% 9.79% ### $ 245.32 1972 18.76% 3.95% 2.82% ### $ 255.01 1973 -14.31% 6.73% 3.66% ### $ 272.16 1974 -25.90% 7.78% 1.99% ### $ 293.33 1975 37.00% 5.99% 3.61% ### $ 310.90 1976 23.83% 4.97% 15.98% ### $ 326.35 1977 -6.98% 5.13% 1.29% ### $ 343.09 1978 6.51% 6.93% -0.78% ### $ 366.87 1979 18.52% 9.94% 0.67% ### $ 403.33 1980 31.74% 11.22% -2.99% ### $ 448.58 1981 -4.70% 14.30% 8.20% ### $ 512.73 1982 20.42% 11.01% 32.81% ### $ 569.18 1983 22.34% 8.45% 3.20% ### $ 617.26 1984 6.15% 9.61% 13.73% ### $ 676.60 1985 31.24% 7.49% 25.71% ### $ 727.26 1986 18.49% 6.04% 24.28% ### $ 771.15 1987 5.81% 5.72% -4.96% ### $ 815.27 1988 16.54% 6.45% 8.22% ### $ 867.86
Returns by year
Page 3
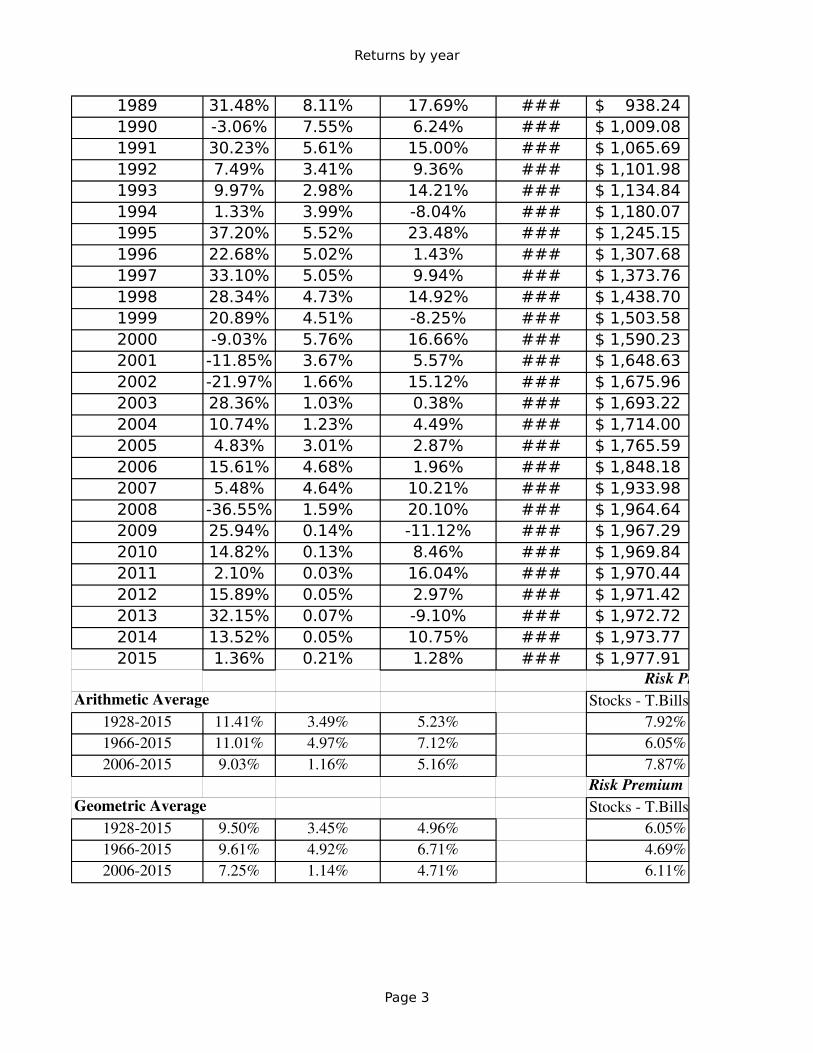
1989 31.48% 8.11% 17.69% ### $ 938.24 1990 -3.06% 7.55% 6.24% ### $ 1,009.08 1991 30.23% 5.61% 15.00% ### $ 1,065.69 1992 7.49% 3.41% 9.36% ### $ 1,101.98 1993 9.97% 2.98% 14.21% ### $ 1,134.84 1994 1.33% 3.99% -8.04% ### $ 1,180.07 1995 37.20% 5.52% 23.48% ### $ 1,245.15 1996 22.68% 5.02% 1.43% ### $ 1,307.68 1997 33.10% 5.05% 9.94% ### $ 1,373.76 1998 28.34% 4.73% 14.92% ### $ 1,438.70 1999 20.89% 4.51% -8.25% ### $ 1,503.58 2000 -9.03% 5.76% 16.66% ### $ 1,590.23 2001 -11.85% 3.67% 5.57% ### $ 1,648.63 2002 -21.97% 1.66% 15.12% ### $ 1,675.96 2003 28.36% 1.03% 0.38% ### $ 1,693.22 2004 10.74% 1.23% 4.49% ### $ 1,714.00 2005 4.83% 3.01% 2.87% ### $ 1,765.59 2006 15.61% 4.68% 1.96% ### $ 1,848.18 2007 5.48% 4.64% 10.21% ### $ 1,933.98 2008 -36.55% 1.59% 20.10% ### $ 1,964.64 2009 25.94% 0.14% -11.12% ### $ 1,967.29 2010 14.82% 0.13% 8.46% ### $ 1,969.84 2011 2.10% 0.03% 16.04% ### $ 1,970.44 2012 15.89% 0.05% 2.97% ### $ 1,971.42 2013 32.15% 0.07% -9.10% ### $ 1,972.72 2014 13.52% 0.05% 10.75% ### $ 1,973.77 2015 1.36% 0.21% 1.28% ### $ 1,977.91
Risk PremiumArithmetic Average Stocks T.Bills
19282015 11.41% 3.49% 5.23% 7.92%19662015 11.01% 4.97% 7.12% 6.05%20062015 9.03% 1.16% 5.16% 7.87%
Risk PremiumGeometric Average Stocks T.Bills
19282015 9.50% 3.45% 4.96% 6.05%19662015 9.61% 4.92% 6.71% 4.69%20062015 7.25% 1.14% 4.71% 6.11%
Returns by year
Page 4
1-Jan-16
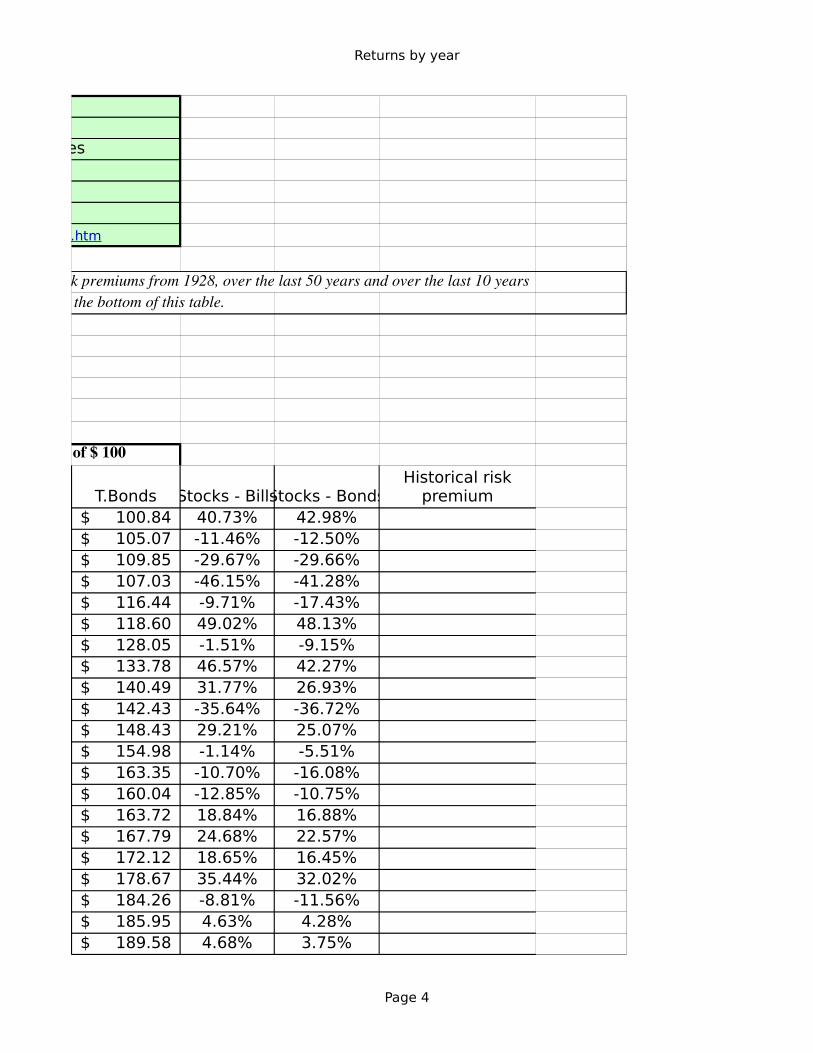
US companies
Estimates of risk premiums from 1928, over the last 50 years and over the last 10 yearsare provided at the bottom of this table.
Compounded Value of $ 100
T.Bonds Stocks - BillsStocks - Bonds $ 100.84 40.73% 42.98% $ 105.07 -11.46% -12.50% $ 109.85 -29.67% -29.66% $ 107.03 -46.15% -41.28% $ 116.44 -9.71% -17.43% $ 118.60 49.02% 48.13% $ 128.05 -1.51% -9.15% $ 133.78 46.57% 42.27% $ 140.49 31.77% 26.93% $ 142.43 -35.64% -36.72% $ 148.43 29.21% 25.07% $ 154.98 -1.14% -5.51% $ 163.35 -10.70% -16.08% $ 160.04 -12.85% -10.75% $ 163.72 18.84% 16.88% $ 167.79 24.68% 22.57% $ 172.12 18.65% 16.45% $ 178.67 35.44% 32.02% $ 184.26 -8.81% -11.56% $ 185.95 4.63% 4.28% $ 189.58 4.68% 3.75%
http://www.stern.nyu.edu/~adamodar/New_Home_Page/data.html
http://www.stern.nyu.edu/~adamodar/pc/datasets/indname.xls
http://www.stern.nyu.edu/~adamodar/New_Home_Page/datafile/variable.htm
Historical risk premium
Returns by year
Page 5
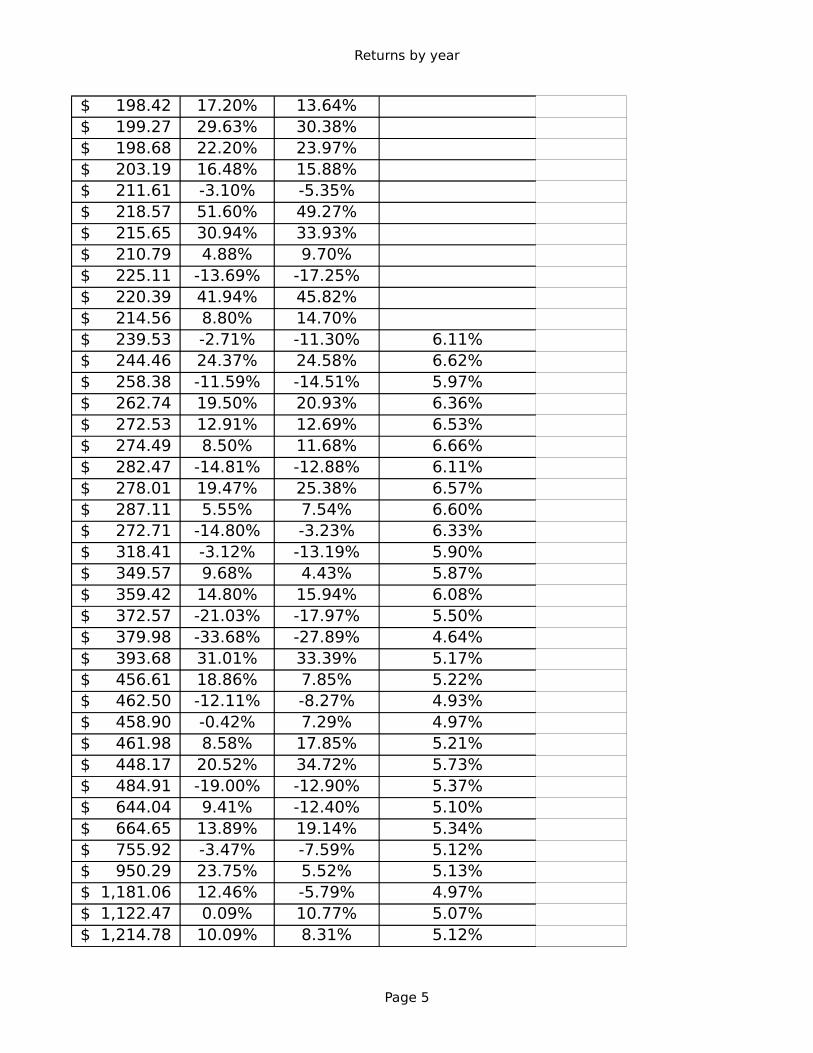
$ 198.42 17.20% 13.64% $ 199.27 29.63% 30.38% $ 198.68 22.20% 23.97% $ 203.19 16.48% 15.88% $ 211.61 -3.10% -5.35% $ 218.57 51.60% 49.27% $ 215.65 30.94% 33.93% $ 210.79 4.88% 9.70% $ 225.11 -13.69% -17.25% $ 220.39 41.94% 45.82% $ 214.56 8.80% 14.70% $ 239.53 -2.71% -11.30% 6.11% $ 244.46 24.37% 24.58% 6.62% $ 258.38 -11.59% -14.51% 5.97% $ 262.74 19.50% 20.93% 6.36% $ 272.53 12.91% 12.69% 6.53% $ 274.49 8.50% 11.68% 6.66% $ 282.47 -14.81% -12.88% 6.11% $ 278.01 19.47% 25.38% 6.57% $ 287.11 5.55% 7.54% 6.60% $ 272.71 -14.80% -3.23% 6.33% $ 318.41 -3.12% -13.19% 5.90% $ 349.57 9.68% 4.43% 5.87% $ 359.42 14.80% 15.94% 6.08% $ 372.57 -21.03% -17.97% 5.50% $ 379.98 -33.68% -27.89% 4.64% $ 393.68 31.01% 33.39% 5.17% $ 456.61 18.86% 7.85% 5.22% $ 462.50 -12.11% -8.27% 4.93% $ 458.90 -0.42% 7.29% 4.97% $ 461.98 8.58% 17.85% 5.21% $ 448.17 20.52% 34.72% 5.73% $ 484.91 -19.00% -12.90% 5.37% $ 644.04 9.41% -12.40% 5.10% $ 664.65 13.89% 19.14% 5.34% $ 755.92 -3.47% -7.59% 5.12% $ 950.29 23.75% 5.52% 5.13% $ 1,181.06 12.46% -5.79% 4.97% $ 1,122.47 0.09% 10.77% 5.07% $ 1,214.78 10.09% 8.31% 5.12%
Returns by year
Page 6
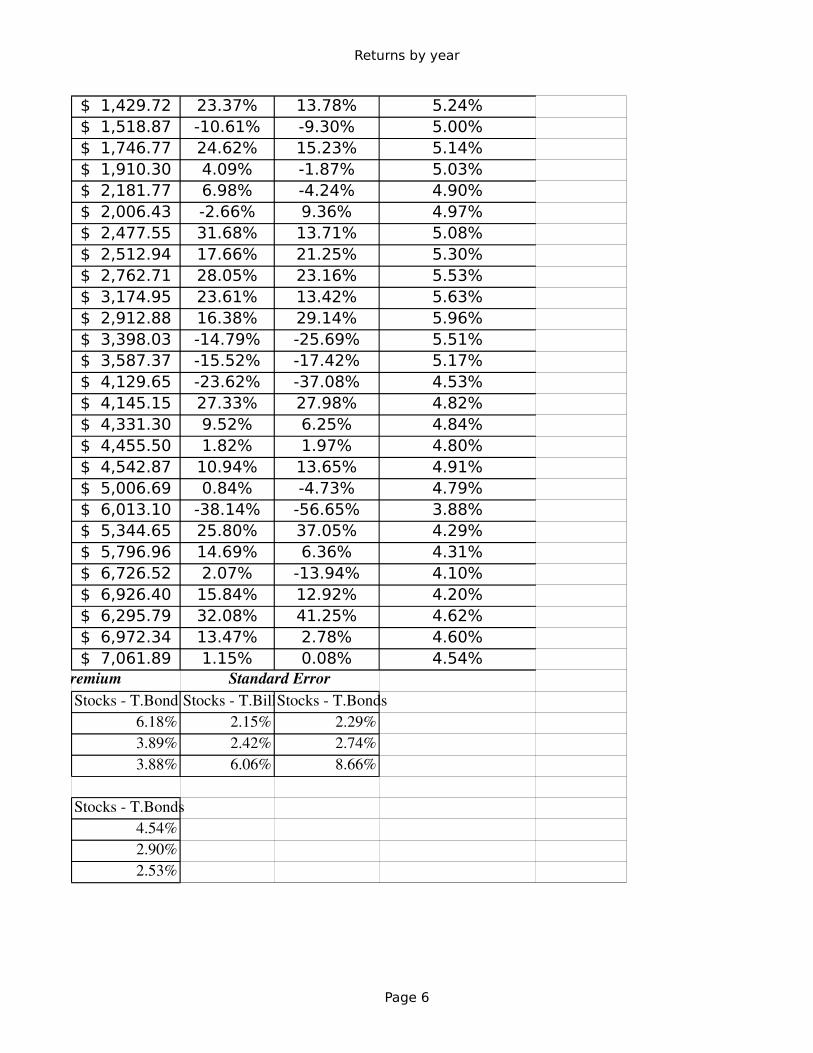
$ 1,429.72 23.37% 13.78% 5.24% $ 1,518.87 -10.61% -9.30% 5.00% $ 1,746.77 24.62% 15.23% 5.14% $ 1,910.30 4.09% -1.87% 5.03% $ 2,181.77 6.98% -4.24% 4.90% $ 2,006.43 -2.66% 9.36% 4.97% $ 2,477.55 31.68% 13.71% 5.08% $ 2,512.94 17.66% 21.25% 5.30% $ 2,762.71 28.05% 23.16% 5.53% $ 3,174.95 23.61% 13.42% 5.63% $ 2,912.88 16.38% 29.14% 5.96% $ 3,398.03 -14.79% -25.69% 5.51% $ 3,587.37 -15.52% -17.42% 5.17% $ 4,129.65 -23.62% -37.08% 4.53% $ 4,145.15 27.33% 27.98% 4.82% $ 4,331.30 9.52% 6.25% 4.84% $ 4,455.50 1.82% 1.97% 4.80% $ 4,542.87 10.94% 13.65% 4.91% $ 5,006.69 0.84% -4.73% 4.79% $ 6,013.10 -38.14% -56.65% 3.88% $ 5,344.65 25.80% 37.05% 4.29% $ 5,796.96 14.69% 6.36% 4.31% $ 6,726.52 2.07% -13.94% 4.10% $ 6,926.40 15.84% 12.92% 4.20% $ 6,295.79 32.08% 41.25% 4.62% $ 6,972.34 13.47% 2.78% 4.60% $ 7,061.89 1.15% 0.08% 4.54%
Risk Premium Standard ErrorStocks T.Bond Stocks T.BillStocks T.Bonds
6.18% 2.15% 2.29%3.89% 2.42% 2.74%3.88% 6.06% 8.66%
Stocks T.Bonds4.54%2.90%2.53%
S&P 500 & Raw Data
Page 7
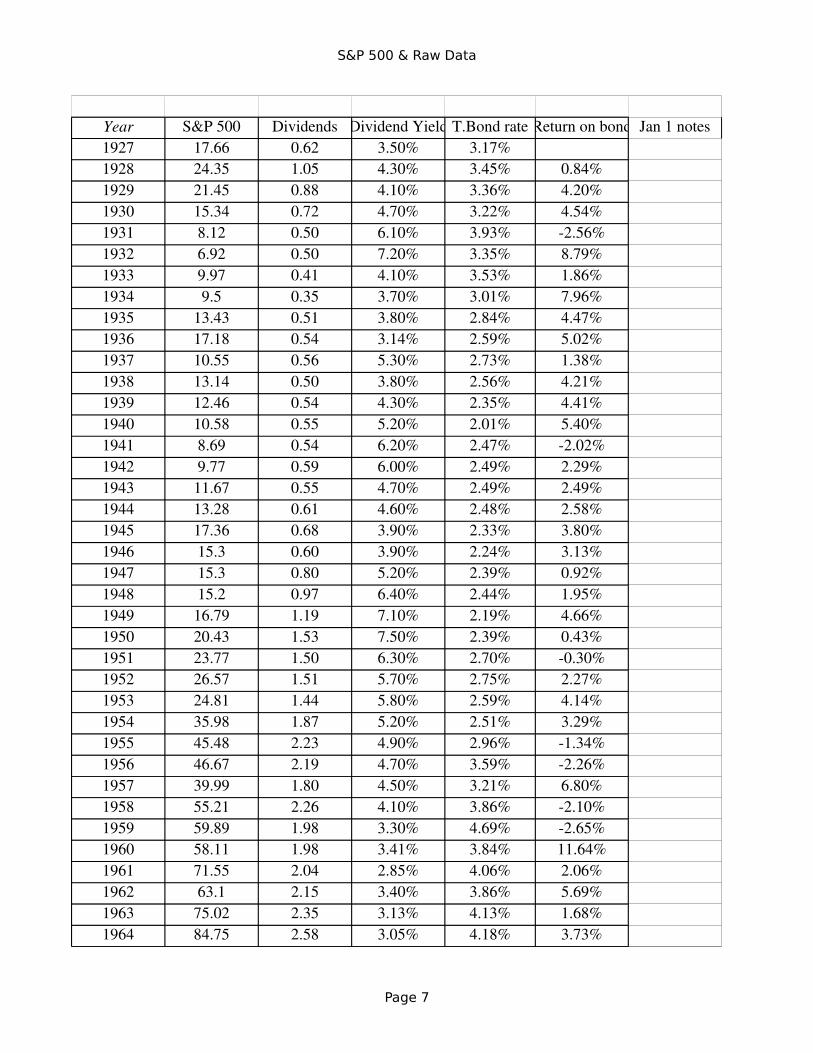
Year S&P 500 Dividends Dividend Yield T.Bond rate Return on bond Jan 1 notes1927 17.66 0.62 3.50% 3.17%1928 24.35 1.05 4.30% 3.45% 0.84%1929 21.45 0.88 4.10% 3.36% 4.20%1930 15.34 0.72 4.70% 3.22% 4.54%1931 8.12 0.50 6.10% 3.93% 2.56%1932 6.92 0.50 7.20% 3.35% 8.79%1933 9.97 0.41 4.10% 3.53% 1.86%1934 9.5 0.35 3.70% 3.01% 7.96%1935 13.43 0.51 3.80% 2.84% 4.47%1936 17.18 0.54 3.14% 2.59% 5.02%1937 10.55 0.56 5.30% 2.73% 1.38%1938 13.14 0.50 3.80% 2.56% 4.21%1939 12.46 0.54 4.30% 2.35% 4.41%1940 10.58 0.55 5.20% 2.01% 5.40%1941 8.69 0.54 6.20% 2.47% 2.02%1942 9.77 0.59 6.00% 2.49% 2.29%1943 11.67 0.55 4.70% 2.49% 2.49%1944 13.28 0.61 4.60% 2.48% 2.58%1945 17.36 0.68 3.90% 2.33% 3.80%1946 15.3 0.60 3.90% 2.24% 3.13%1947 15.3 0.80 5.20% 2.39% 0.92%1948 15.2 0.97 6.40% 2.44% 1.95%1949 16.79 1.19 7.10% 2.19% 4.66%1950 20.43 1.53 7.50% 2.39% 0.43%1951 23.77 1.50 6.30% 2.70% 0.30%1952 26.57 1.51 5.70% 2.75% 2.27%1953 24.81 1.44 5.80% 2.59% 4.14%1954 35.98 1.87 5.20% 2.51% 3.29%1955 45.48 2.23 4.90% 2.96% 1.34%1956 46.67 2.19 4.70% 3.59% 2.26%1957 39.99 1.80 4.50% 3.21% 6.80%1958 55.21 2.26 4.10% 3.86% 2.10%1959 59.89 1.98 3.30% 4.69% 2.65%1960 58.11 1.98 3.41% 3.84% 11.64%1961 71.55 2.04 2.85% 4.06% 2.06%1962 63.1 2.15 3.40% 3.86% 5.69%1963 75.02 2.35 3.13% 4.13% 1.68%1964 84.75 2.58 3.05% 4.18% 3.73%
S&P 500 & Raw Data
Page 8
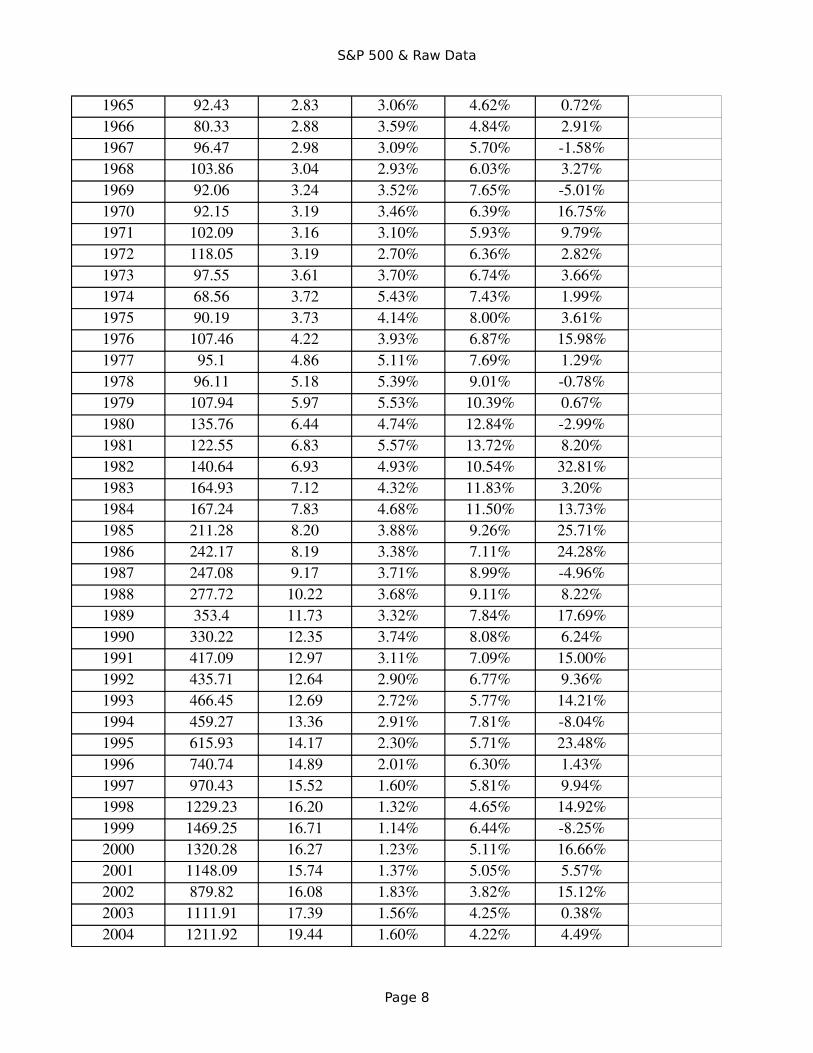
1965 92.43 2.83 3.06% 4.62% 0.72%1966 80.33 2.88 3.59% 4.84% 2.91%1967 96.47 2.98 3.09% 5.70% 1.58%1968 103.86 3.04 2.93% 6.03% 3.27%1969 92.06 3.24 3.52% 7.65% 5.01%1970 92.15 3.19 3.46% 6.39% 16.75%1971 102.09 3.16 3.10% 5.93% 9.79%1972 118.05 3.19 2.70% 6.36% 2.82%1973 97.55 3.61 3.70% 6.74% 3.66%1974 68.56 3.72 5.43% 7.43% 1.99%1975 90.19 3.73 4.14% 8.00% 3.61%1976 107.46 4.22 3.93% 6.87% 15.98%1977 95.1 4.86 5.11% 7.69% 1.29%1978 96.11 5.18 5.39% 9.01% 0.78%1979 107.94 5.97 5.53% 10.39% 0.67%1980 135.76 6.44 4.74% 12.84% 2.99%1981 122.55 6.83 5.57% 13.72% 8.20%1982 140.64 6.93 4.93% 10.54% 32.81%1983 164.93 7.12 4.32% 11.83% 3.20%1984 167.24 7.83 4.68% 11.50% 13.73%1985 211.28 8.20 3.88% 9.26% 25.71%1986 242.17 8.19 3.38% 7.11% 24.28%1987 247.08 9.17 3.71% 8.99% 4.96%1988 277.72 10.22 3.68% 9.11% 8.22%1989 353.4 11.73 3.32% 7.84% 17.69%1990 330.22 12.35 3.74% 8.08% 6.24%1991 417.09 12.97 3.11% 7.09% 15.00%1992 435.71 12.64 2.90% 6.77% 9.36%1993 466.45 12.69 2.72% 5.77% 14.21%1994 459.27 13.36 2.91% 7.81% 8.04%1995 615.93 14.17 2.30% 5.71% 23.48%1996 740.74 14.89 2.01% 6.30% 1.43%1997 970.43 15.52 1.60% 5.81% 9.94%1998 1229.23 16.20 1.32% 4.65% 14.92%1999 1469.25 16.71 1.14% 6.44% 8.25%2000 1320.28 16.27 1.23% 5.11% 16.66%2001 1148.09 15.74 1.37% 5.05% 5.57%2002 879.82 16.08 1.83% 3.82% 15.12%2003 1111.91 17.39 1.56% 4.25% 0.38%2004 1211.92 19.44 1.60% 4.22% 4.49%
S&P 500 & Raw Data
Page 9
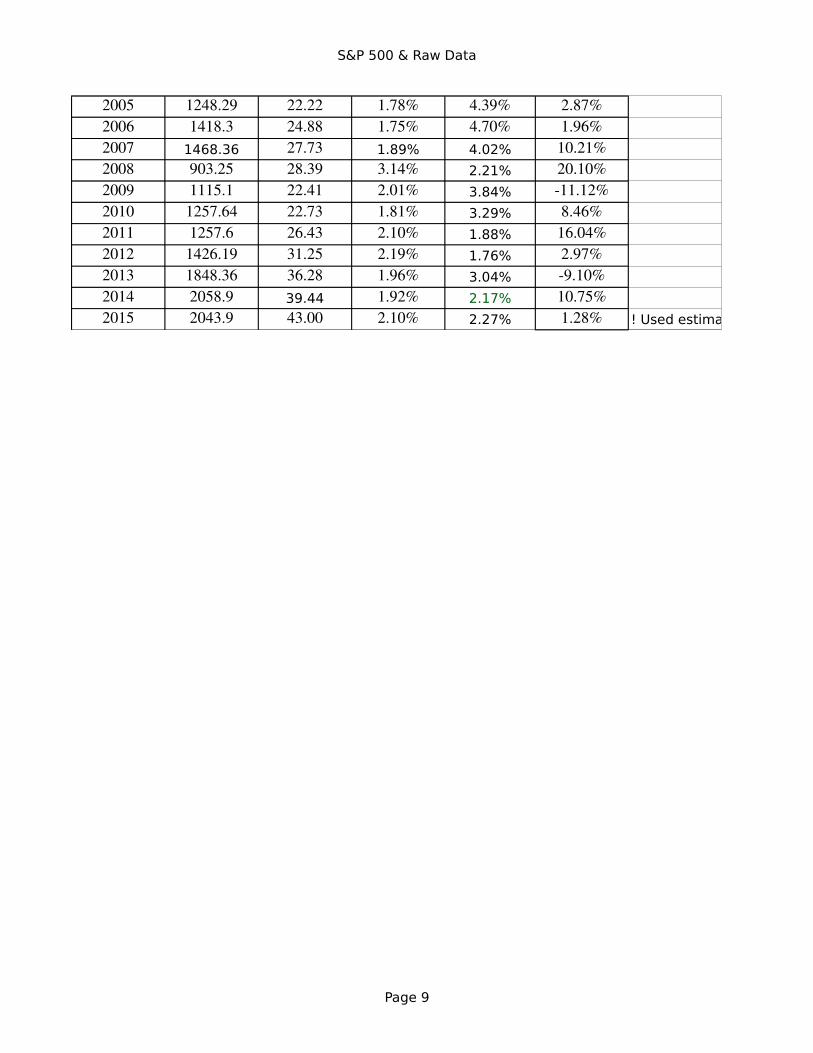
2005 1248.29 22.22 1.78% 4.39% 2.87%2006 1418.3 24.88 1.75% 4.70% 1.96%2007 1468.36 27.73 1.89% 4.02% 10.21%2008 903.25 28.39 3.14% 2.21% 20.10%2009 1115.1 22.41 2.01% 3.84% 11.12%2010 1257.64 22.73 1.81% 3.29% 8.46%2011 1257.6 26.43 2.10% 1.88% 16.04%2012 1426.19 31.25 2.19% 1.76% 2.97%2013 1848.36 36.28 1.96% 3.04% 9.10%2014 2058.9 39.44 1.92% 2.17% 10.75%2015 2043.9 43.00 2.10% 2.27% 1.28% ! Used estimated dividend for 2014, based upon Dec 2014 estimated dividend yield for S&P 500
S&P 500 & Raw Data
Page 10
S&P 500 & Raw Data
Page 11
S&P 500 & Raw Data
Page 12
! Used estimated dividend for 2014, based upon Dec 2014 estimated dividend yield for S&P 500
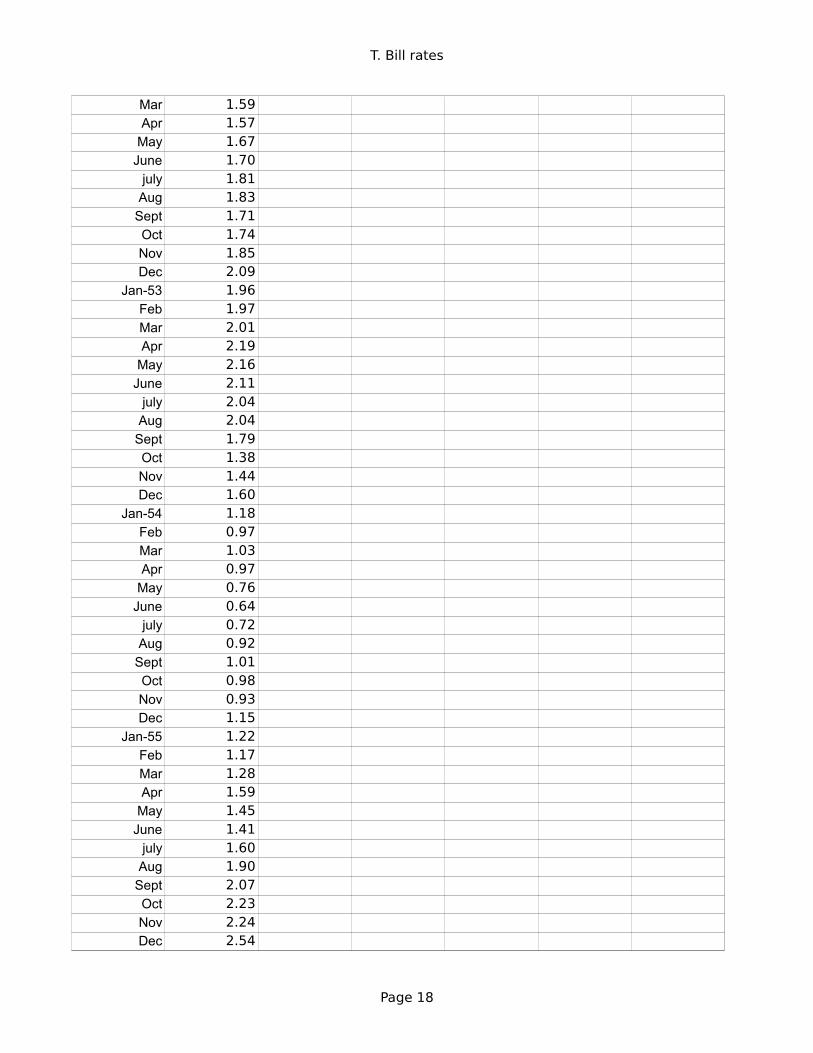
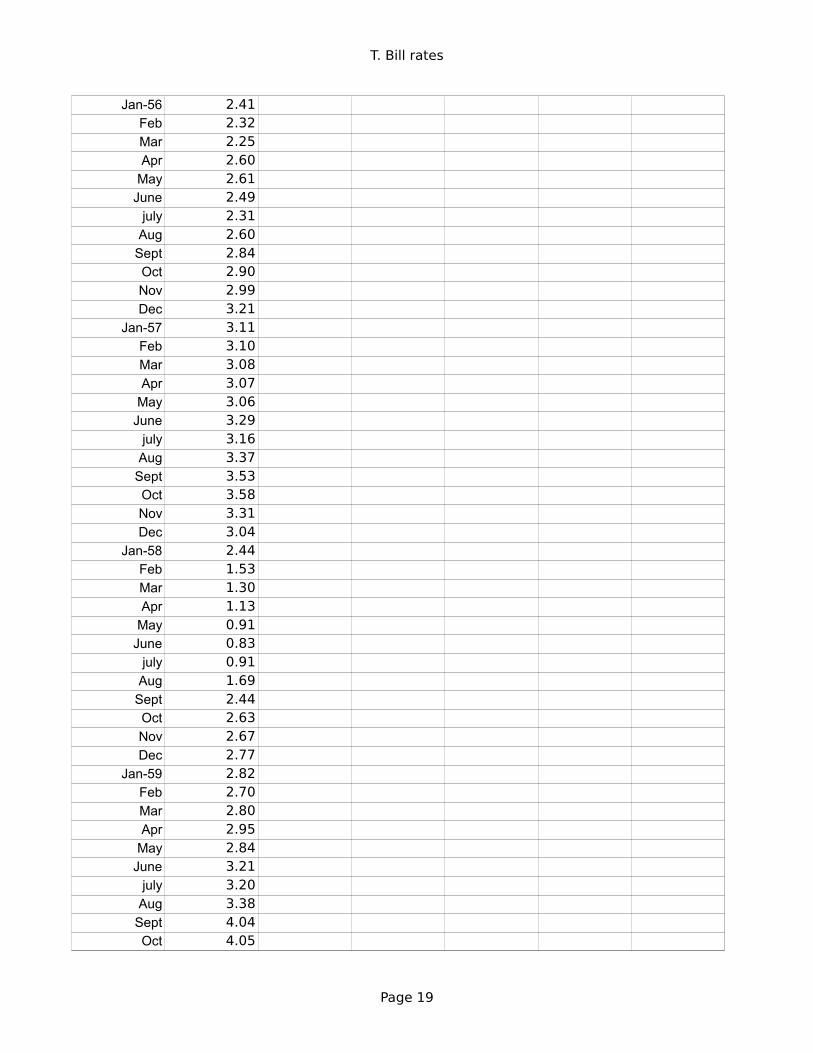
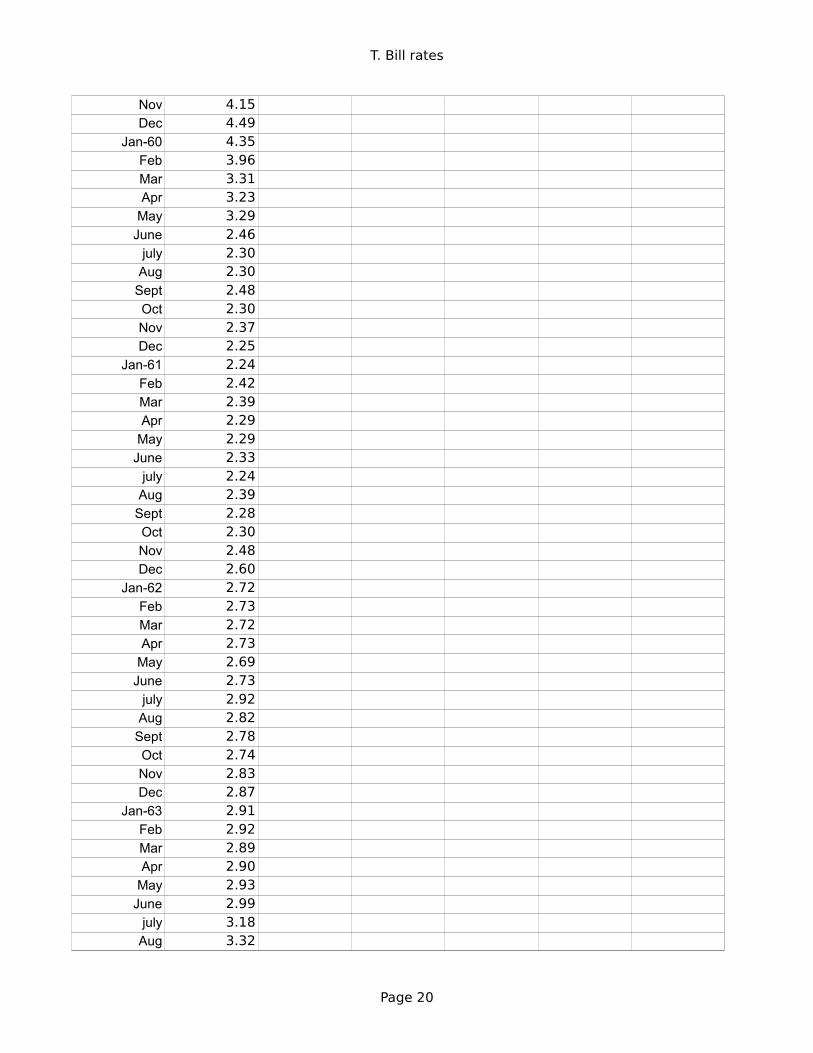
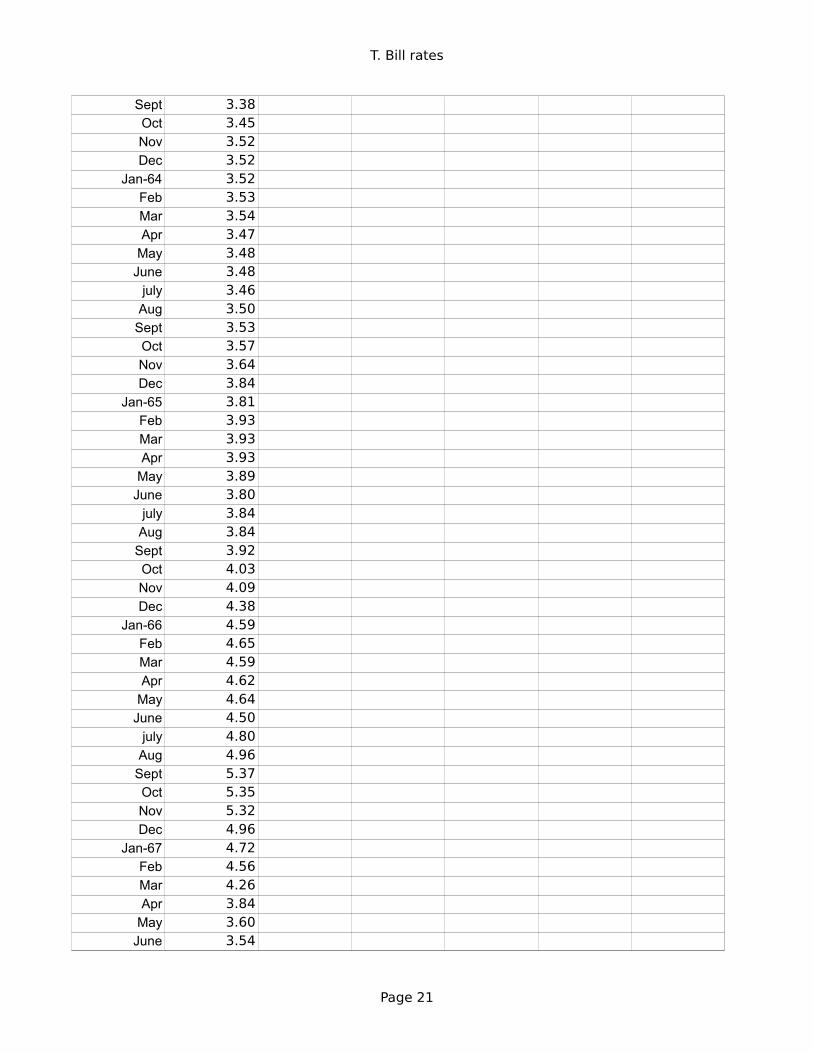
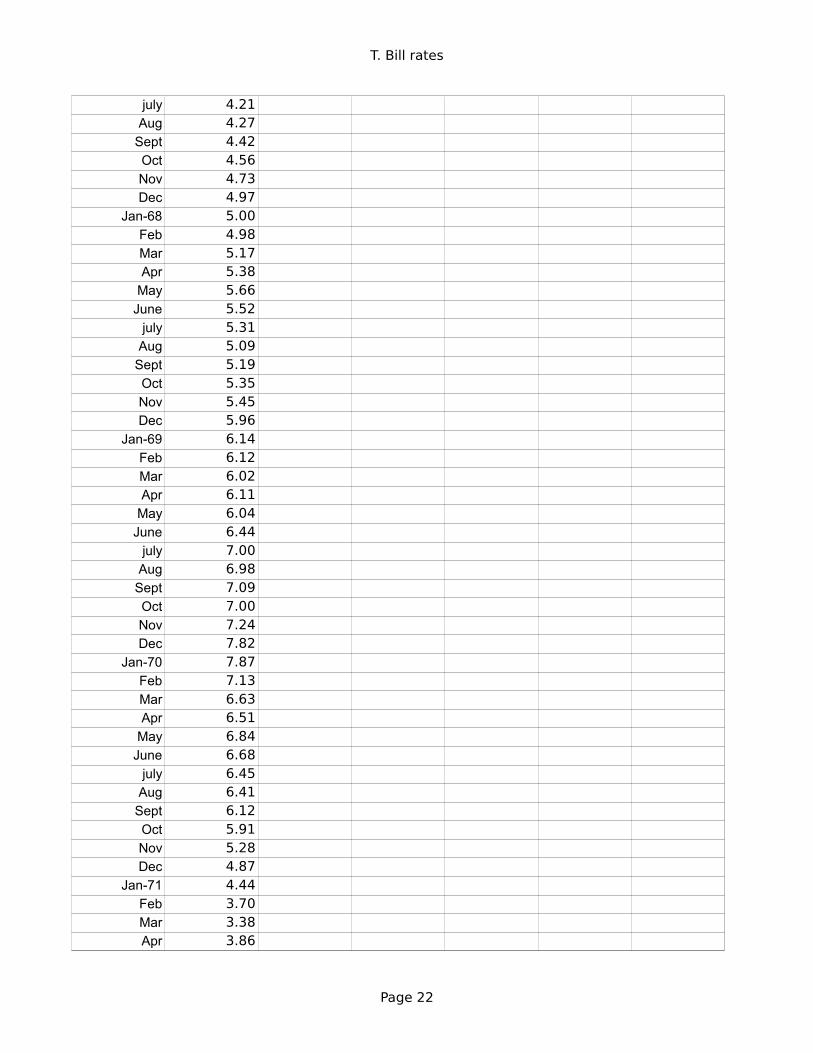
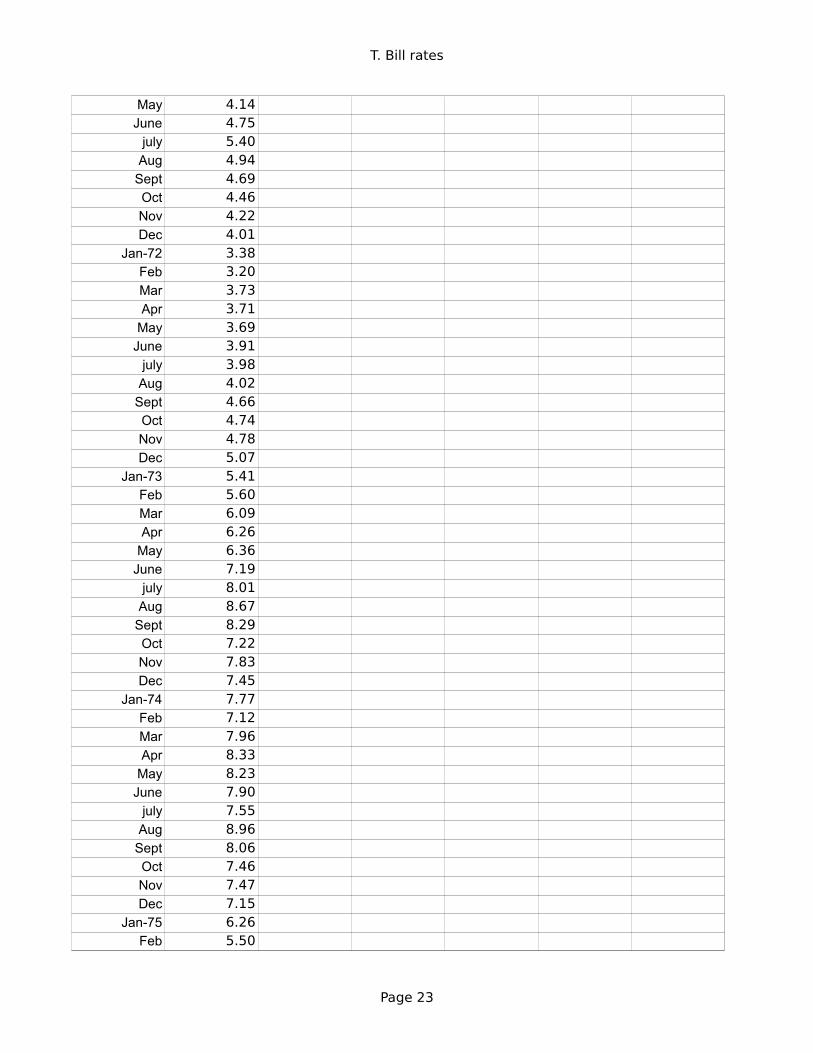
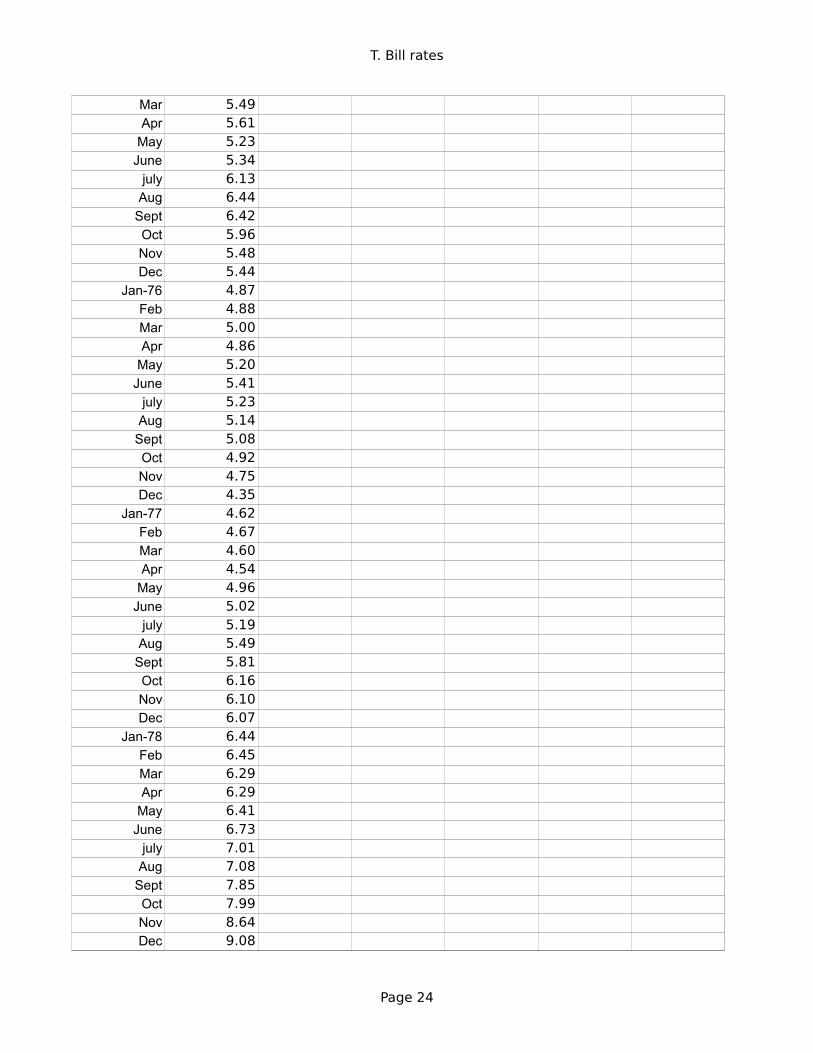
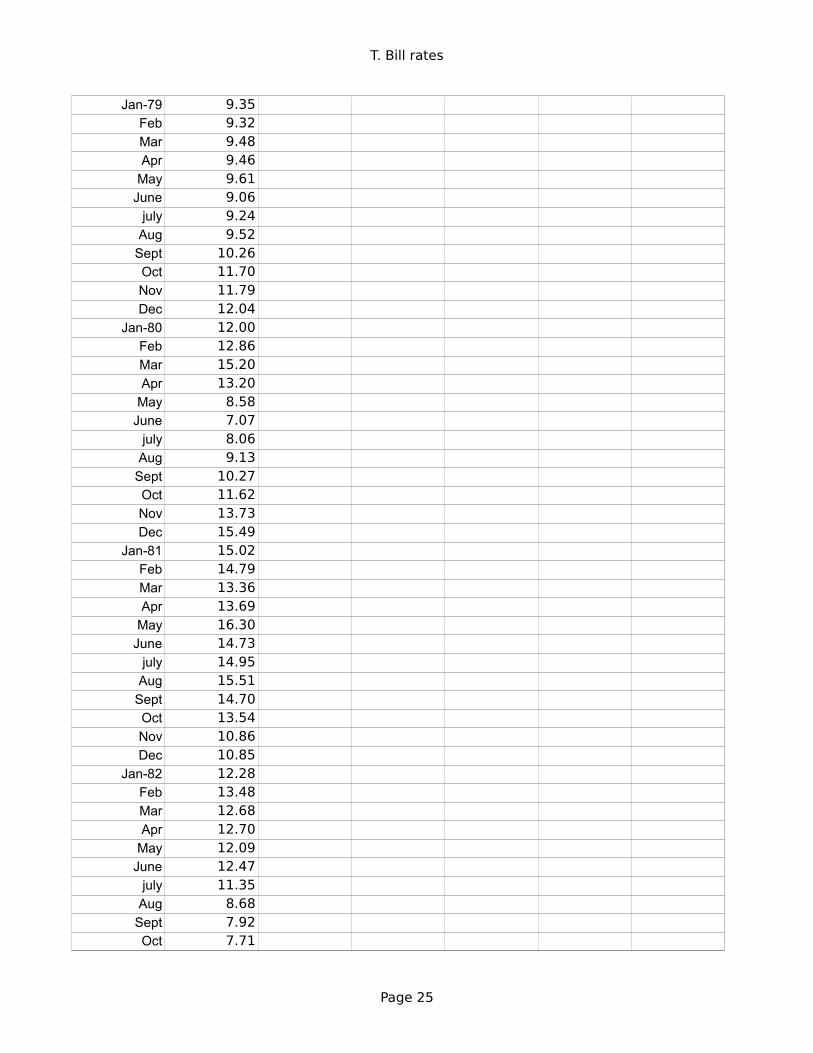
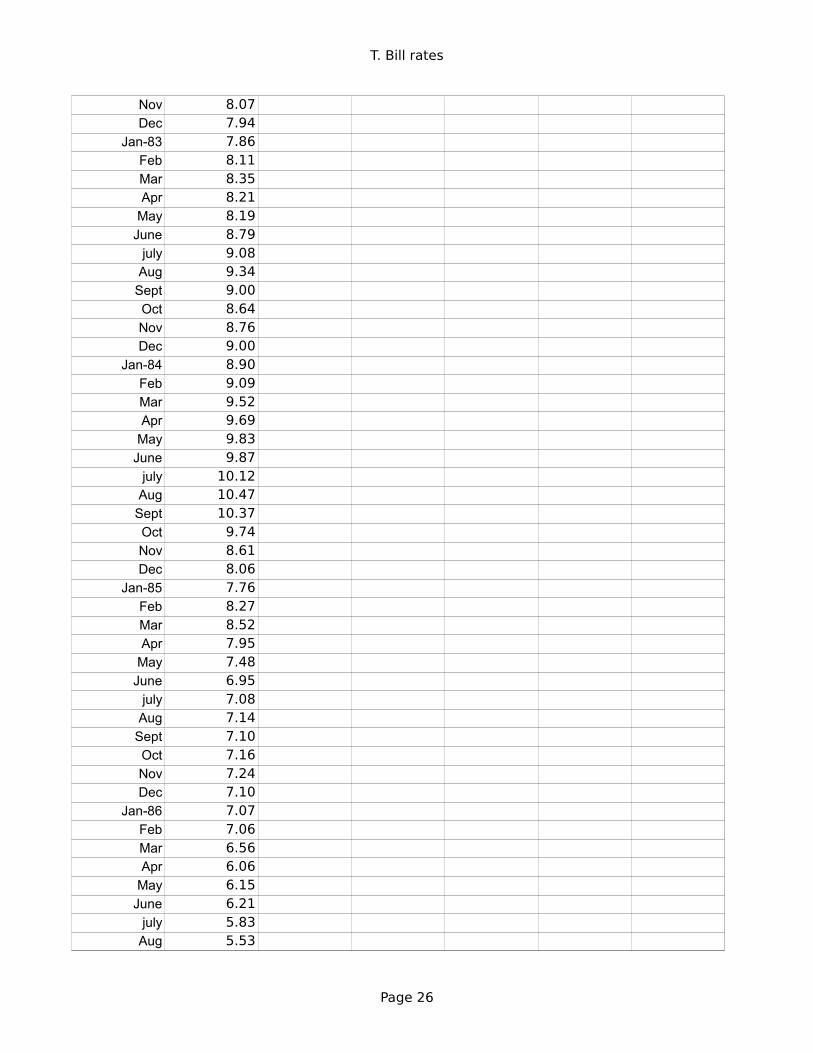
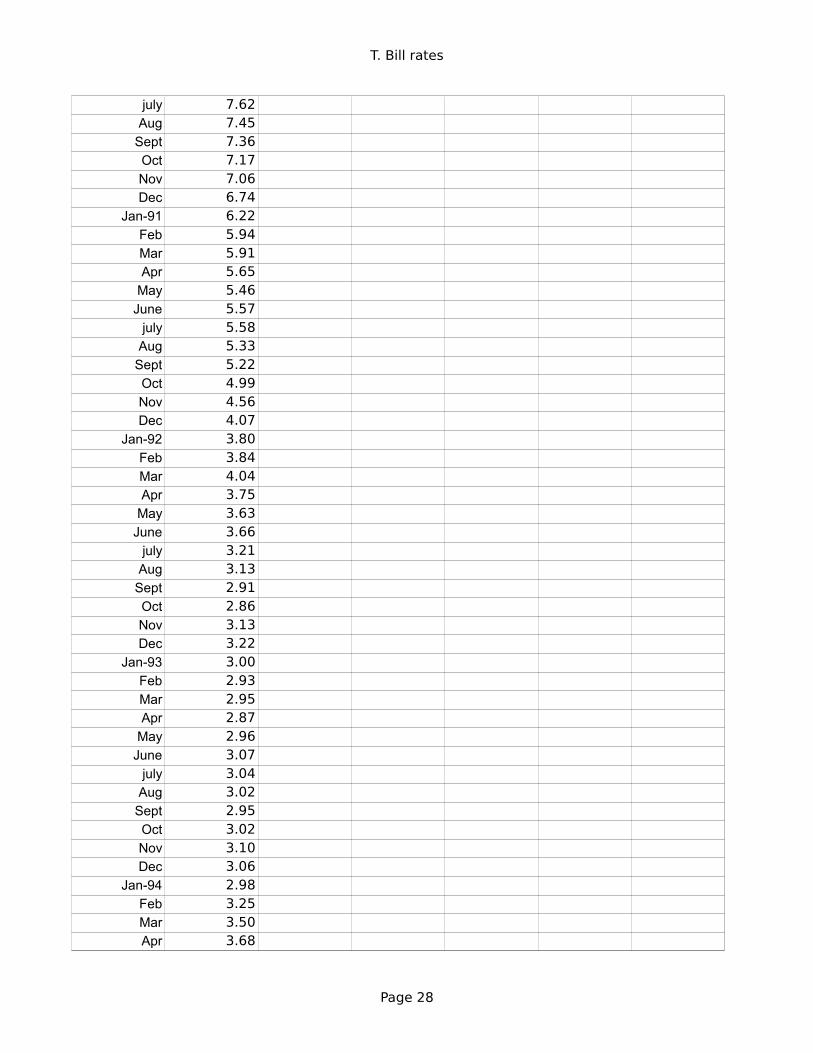
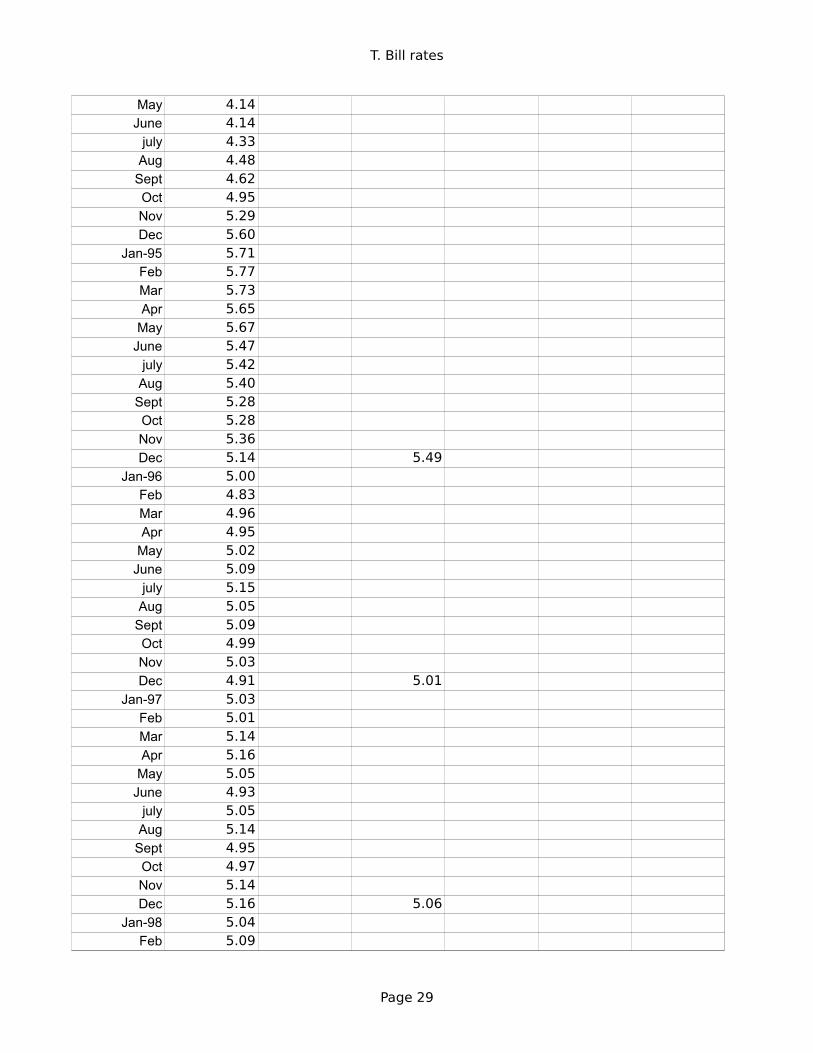
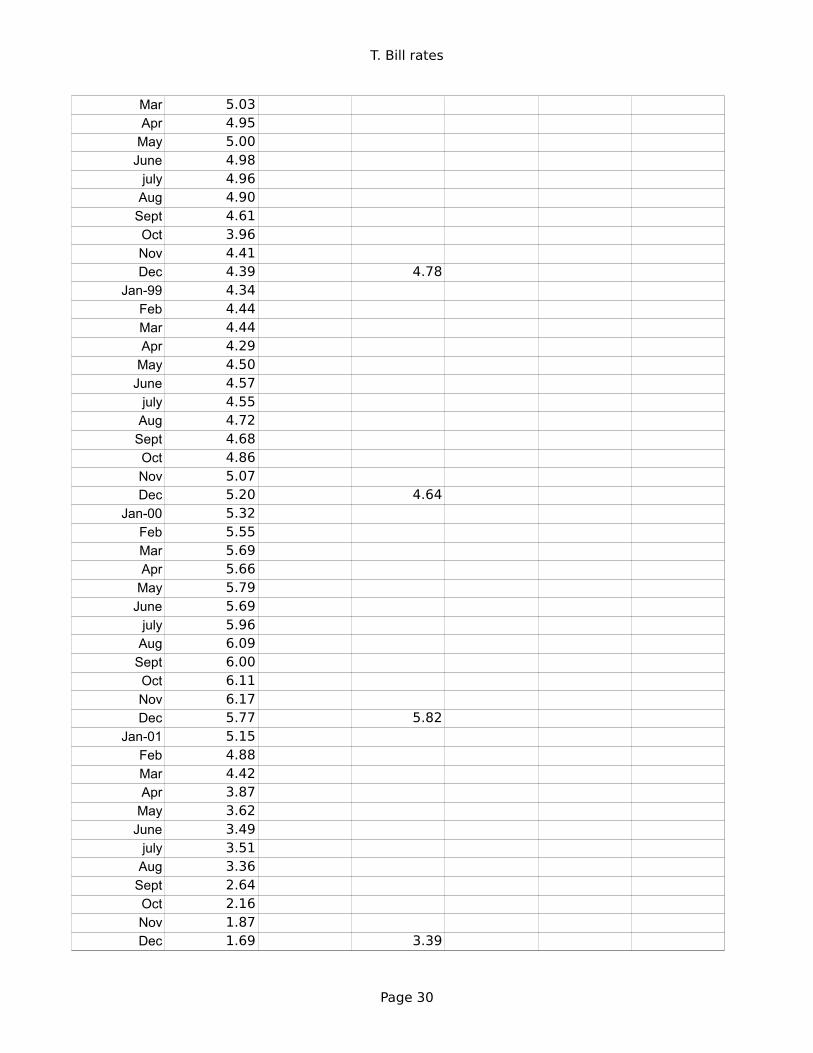
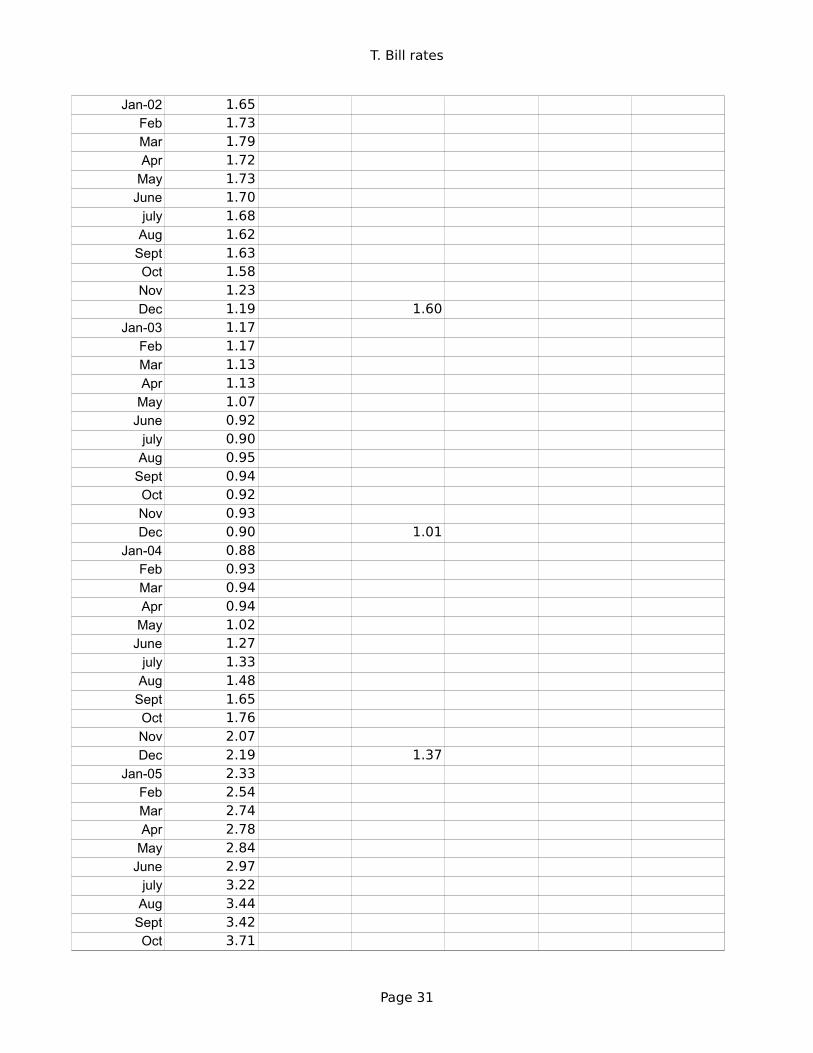
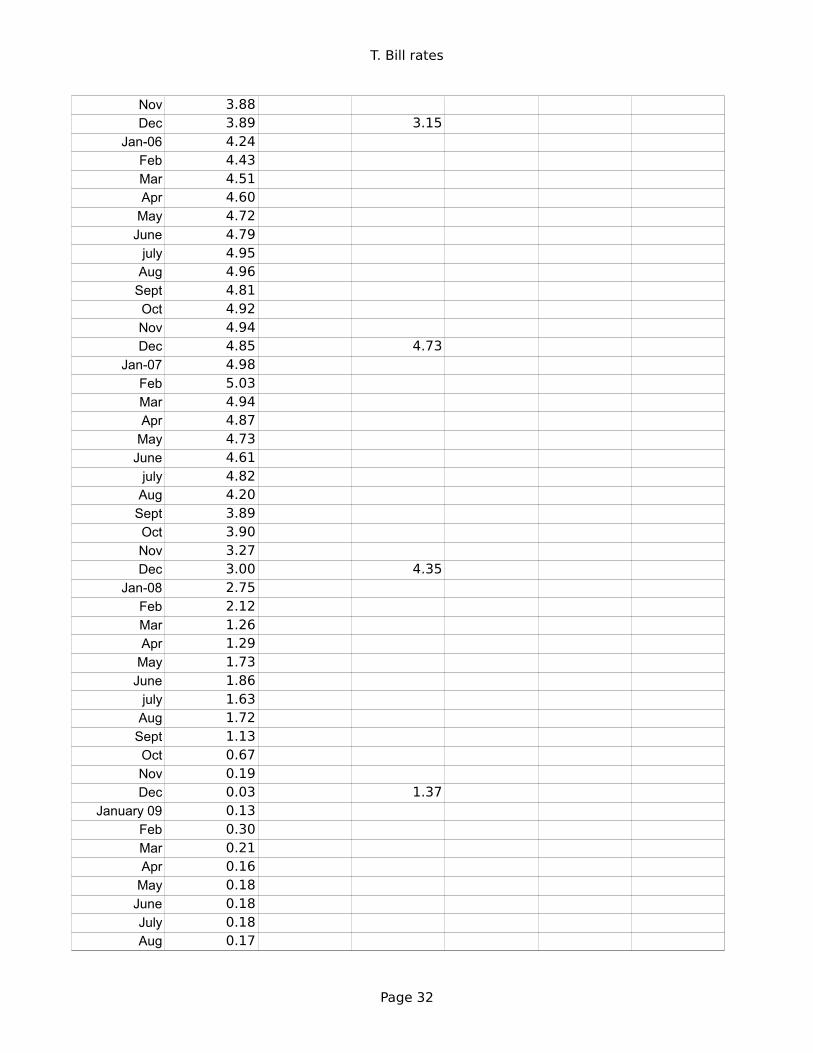
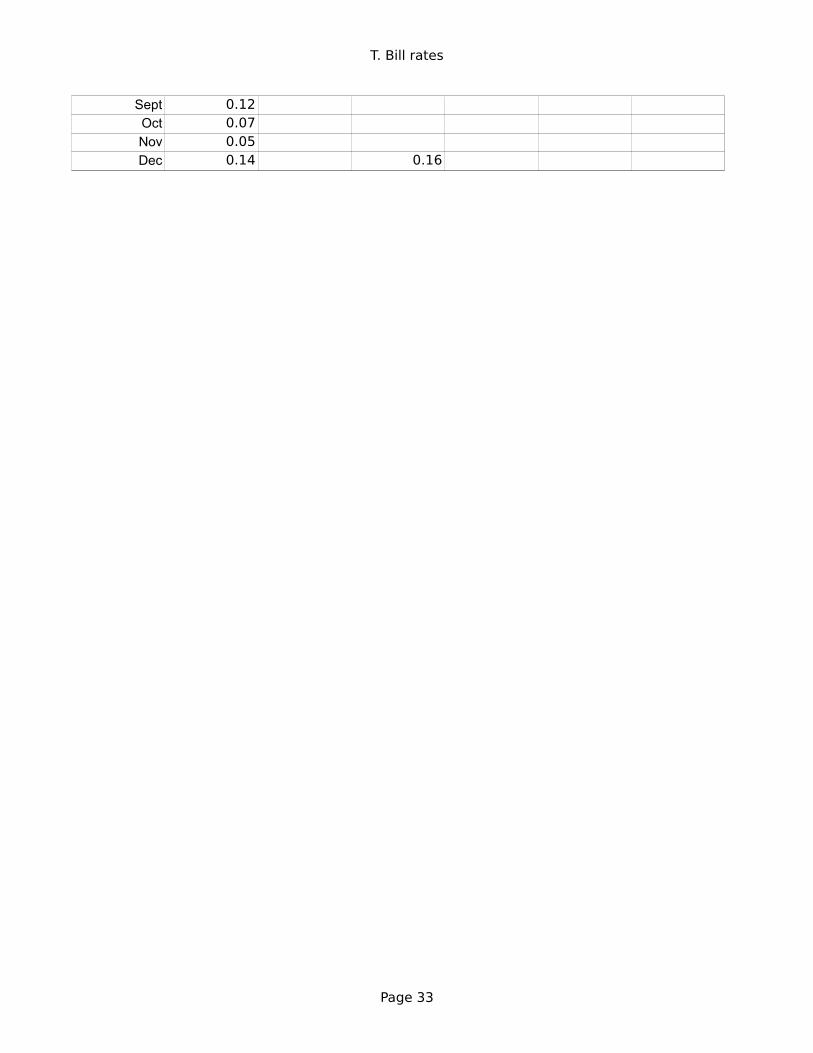
T. Bill rates
Page 13
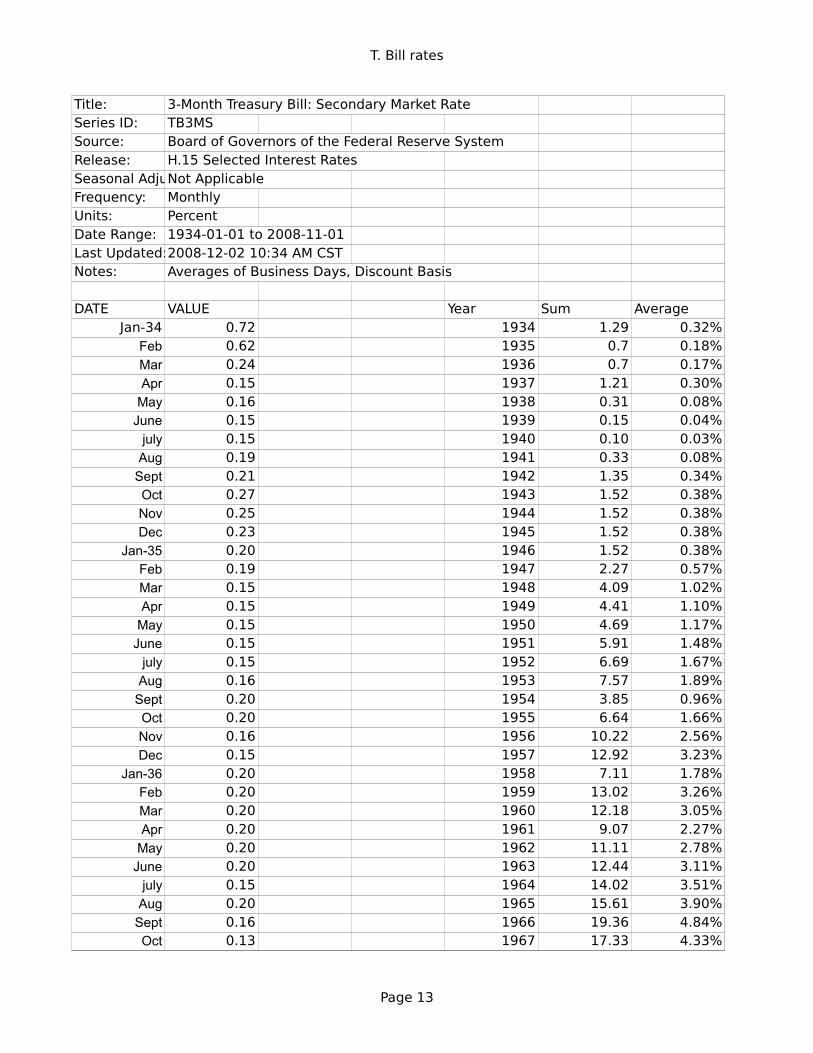
Title: 3-Month Treasury Bill: Secondary Market RateSeries ID: TB3MSSource: Board of Governors of the Federal Reserve SystemRelease: H.15 Selected Interest RatesSeasonal AdjuNot ApplicableFrequency: MonthlyUnits: PercentDate Range: 1934-01-01 to 2008-11-01Last Updated:2008-12-02 10:34 AM CSTNotes: Averages of Business Days, Discount Basis
DATE VALUE Year Sum AverageJan-34 0.72 1934 1.29 0.32%
Feb 0.62 1935 0.7 0.18%Mar 0.24 1936 0.7 0.17%Apr 0.15 1937 1.21 0.30%
May 0.16 1938 0.31 0.08%June 0.15 1939 0.15 0.04%
july 0.15 1940 0.10 0.03%Aug 0.19 1941 0.33 0.08%
Sept 0.21 1942 1.35 0.34%Oct 0.27 1943 1.52 0.38%Nov 0.25 1944 1.52 0.38%Dec 0.23 1945 1.52 0.38%
Jan-35 0.20 1946 1.52 0.38%Feb 0.19 1947 2.27 0.57%Mar 0.15 1948 4.09 1.02%Apr 0.15 1949 4.41 1.10%
May 0.15 1950 4.69 1.17%June 0.15 1951 5.91 1.48%
july 0.15 1952 6.69 1.67%Aug 0.16 1953 7.57 1.89%
Sept 0.20 1954 3.85 0.96%Oct 0.20 1955 6.64 1.66%Nov 0.16 1956 10.22 2.56%Dec 0.15 1957 12.92 3.23%
Jan-36 0.20 1958 7.11 1.78%Feb 0.20 1959 13.02 3.26%Mar 0.20 1960 12.18 3.05%Apr 0.20 1961 9.07 2.27%
May 0.20 1962 11.11 2.78%June 0.20 1963 12.44 3.11%
july 0.15 1964 14.02 3.51%Aug 0.20 1965 15.61 3.90%
Sept 0.16 1966 19.36 4.84%Oct 0.13 1967 17.33 4.33%
T. Bill rates
Page 14
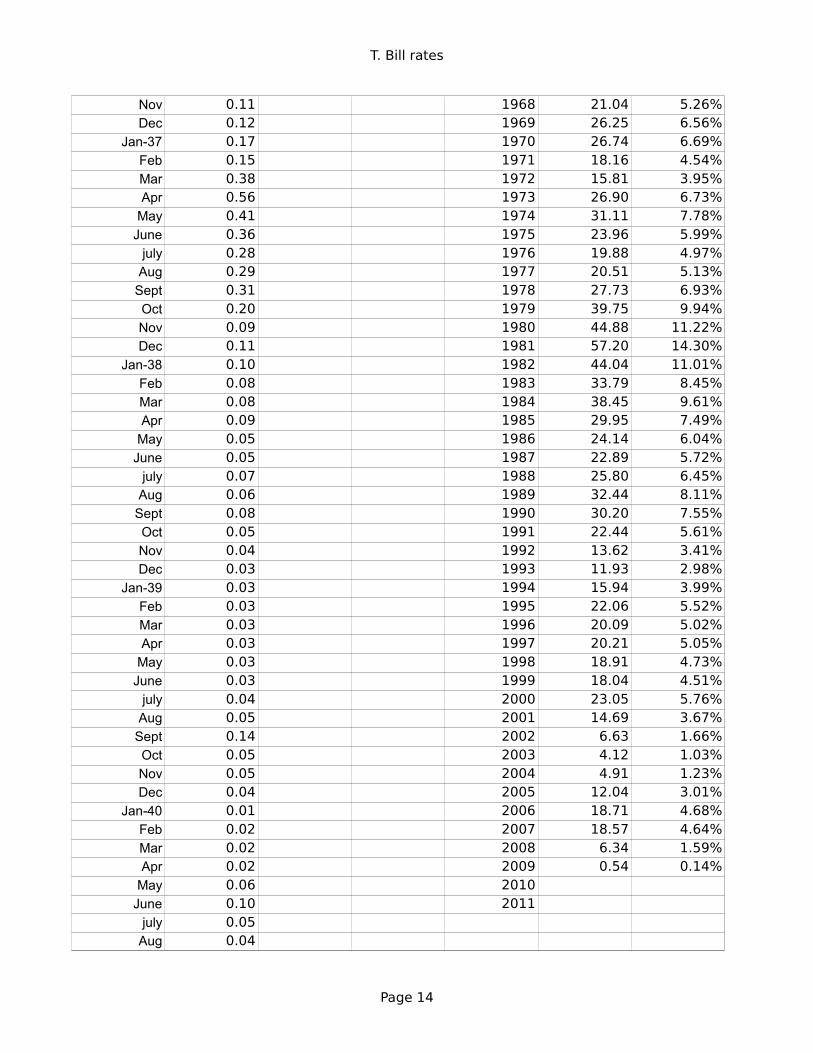
Nov 0.11 1968 21.04 5.26%Dec 0.12 1969 26.25 6.56%
Jan-37 0.17 1970 26.74 6.69%Feb 0.15 1971 18.16 4.54%Mar 0.38 1972 15.81 3.95%Apr 0.56 1973 26.90 6.73%
May 0.41 1974 31.11 7.78%June 0.36 1975 23.96 5.99%
july 0.28 1976 19.88 4.97%Aug 0.29 1977 20.51 5.13%
Sept 0.31 1978 27.73 6.93%Oct 0.20 1979 39.75 9.94%Nov 0.09 1980 44.88 11.22%Dec 0.11 1981 57.20 14.30%
Jan-38 0.10 1982 44.04 11.01%Feb 0.08 1983 33.79 8.45%Mar 0.08 1984 38.45 9.61%Apr 0.09 1985 29.95 7.49%
May 0.05 1986 24.14 6.04%June 0.05 1987 22.89 5.72%
july 0.07 1988 25.80 6.45%Aug 0.06 1989 32.44 8.11%
Sept 0.08 1990 30.20 7.55%Oct 0.05 1991 22.44 5.61%Nov 0.04 1992 13.62 3.41%Dec 0.03 1993 11.93 2.98%
Jan-39 0.03 1994 15.94 3.99%Feb 0.03 1995 22.06 5.52%Mar 0.03 1996 20.09 5.02%Apr 0.03 1997 20.21 5.05%
May 0.03 1998 18.91 4.73%June 0.03 1999 18.04 4.51%
july 0.04 2000 23.05 5.76%Aug 0.05 2001 14.69 3.67%
Sept 0.14 2002 6.63 1.66%Oct 0.05 2003 4.12 1.03%Nov 0.05 2004 4.91 1.23%Dec 0.04 2005 12.04 3.01%
Jan-40 0.01 2006 18.71 4.68%Feb 0.02 2007 18.57 4.64%Mar 0.02 2008 6.34 1.59%Apr 0.02 2009 0.54 0.14%
May 0.06 2010June 0.10 2011
july 0.05Aug 0.04
T. Bill rates
Page 15
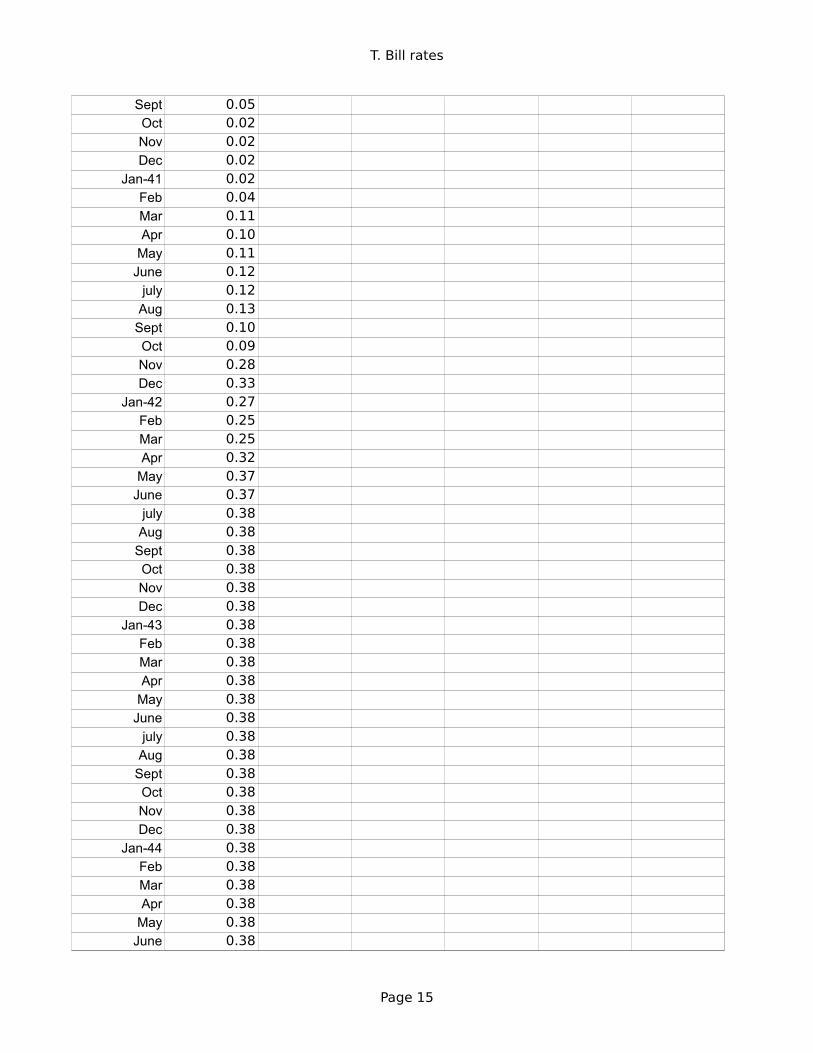
Sept 0.05Oct 0.02Nov 0.02Dec 0.02
Jan-41 0.02Feb 0.04Mar 0.11Apr 0.10
May 0.11June 0.12
july 0.12Aug 0.13
Sept 0.10Oct 0.09Nov 0.28Dec 0.33
Jan-42 0.27Feb 0.25Mar 0.25Apr 0.32
May 0.37June 0.37
july 0.38Aug 0.38
Sept 0.38Oct 0.38Nov 0.38Dec 0.38
Jan-43 0.38Feb 0.38Mar 0.38Apr 0.38
May 0.38June 0.38
july 0.38Aug 0.38
Sept 0.38Oct 0.38Nov 0.38Dec 0.38
Jan-44 0.38Feb 0.38Mar 0.38Apr 0.38
May 0.38June 0.38
T. Bill rates
Page 16
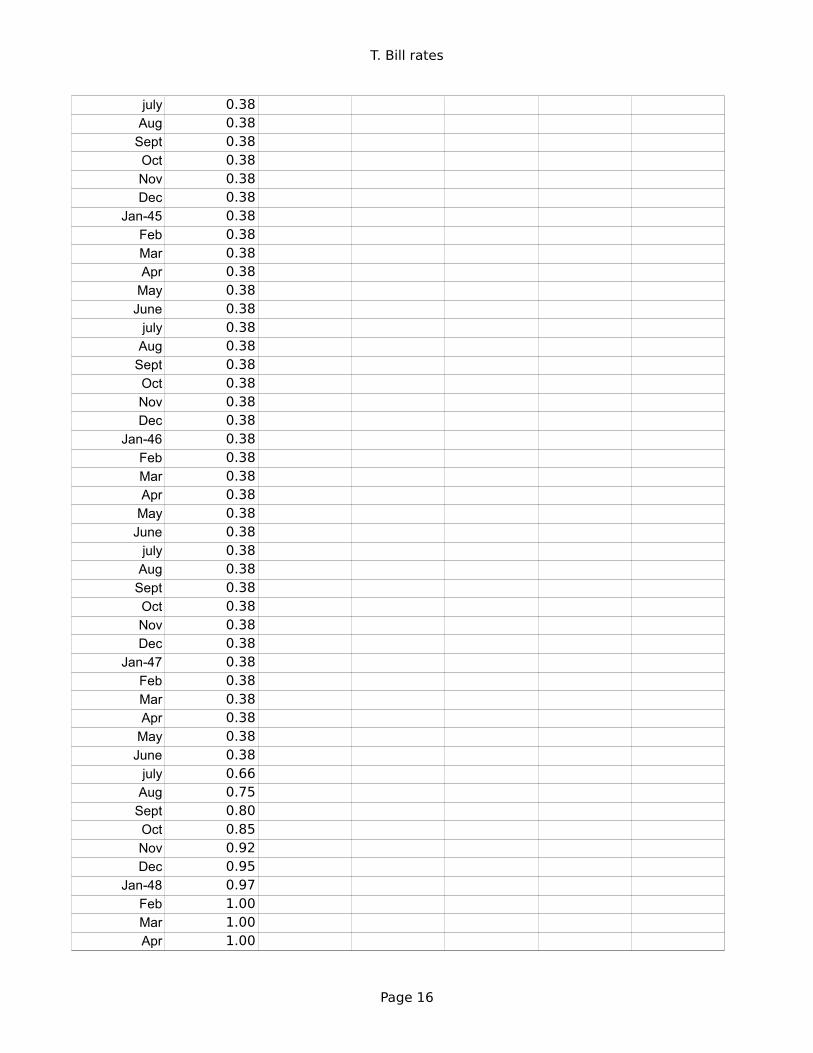
july 0.38Aug 0.38
Sept 0.38Oct 0.38Nov 0.38Dec 0.38
Jan-45 0.38Feb 0.38Mar 0.38Apr 0.38
May 0.38June 0.38
july 0.38Aug 0.38
Sept 0.38Oct 0.38Nov 0.38Dec 0.38
Jan-46 0.38Feb 0.38Mar 0.38Apr 0.38
May 0.38June 0.38
july 0.38Aug 0.38
Sept 0.38Oct 0.38Nov 0.38Dec 0.38
Jan-47 0.38Feb 0.38Mar 0.38Apr 0.38
May 0.38June 0.38
july 0.66Aug 0.75
Sept 0.80Oct 0.85Nov 0.92Dec 0.95
Jan-48 0.97Feb 1.00Mar 1.00Apr 1.00

T. Bill rates
Page 17
May 1.00June 1.00
july 1.00Aug 1.06
Sept 1.09Oct 1.12Nov 1.14Dec 1.16
Jan-49 1.17Feb 1.17Mar 1.17Apr 1.17
May 1.17June 1.17
july 1.02Aug 1.04
Sept 1.07Oct 1.05Nov 1.08Dec 1.10
Jan-50 1.07Feb 1.12Mar 1.12Apr 1.15
May 1.16June 1.15
july 1.16Aug 1.20
Sept 1.30Oct 1.31Nov 1.36Dec 1.34
Jan-51 1.34Feb 1.36Mar 1.40Apr 1.47
May 1.55June 1.45
july 1.56Aug 1.62
Sept 1.63Oct 1.54Nov 1.56Dec 1.73
Jan-52 1.57Feb 1.54
T. Bill rates
Page 18
Mar 1.59Apr 1.57
May 1.67June 1.70
july 1.81Aug 1.83
Sept 1.71Oct 1.74Nov 1.85Dec 2.09
Jan-53 1.96Feb 1.97Mar 2.01Apr 2.19
May 2.16June 2.11
july 2.04Aug 2.04
Sept 1.79Oct 1.38Nov 1.44Dec 1.60
Jan-54 1.18Feb 0.97Mar 1.03Apr 0.97
May 0.76June 0.64
july 0.72Aug 0.92
Sept 1.01Oct 0.98Nov 0.93Dec 1.15
Jan-55 1.22Feb 1.17Mar 1.28Apr 1.59
May 1.45June 1.41
july 1.60Aug 1.90
Sept 2.07Oct 2.23Nov 2.24Dec 2.54
T. Bill rates
Page 19
Jan-56 2.41Feb 2.32Mar 2.25Apr 2.60
May 2.61June 2.49
july 2.31Aug 2.60
Sept 2.84Oct 2.90Nov 2.99Dec 3.21
Jan-57 3.11Feb 3.10Mar 3.08Apr 3.07
May 3.06June 3.29
july 3.16Aug 3.37
Sept 3.53Oct 3.58Nov 3.31Dec 3.04
Jan-58 2.44Feb 1.53Mar 1.30Apr 1.13
May 0.91June 0.83
july 0.91Aug 1.69
Sept 2.44Oct 2.63Nov 2.67Dec 2.77
Jan-59 2.82Feb 2.70Mar 2.80Apr 2.95
May 2.84June 3.21
july 3.20Aug 3.38
Sept 4.04Oct 4.05
T. Bill rates
Page 20
Nov 4.15Dec 4.49
Jan-60 4.35Feb 3.96Mar 3.31Apr 3.23
May 3.29June 2.46
july 2.30Aug 2.30
Sept 2.48Oct 2.30Nov 2.37Dec 2.25
Jan-61 2.24Feb 2.42Mar 2.39Apr 2.29
May 2.29June 2.33
july 2.24Aug 2.39
Sept 2.28Oct 2.30Nov 2.48Dec 2.60
Jan-62 2.72Feb 2.73Mar 2.72Apr 2.73
May 2.69June 2.73
july 2.92Aug 2.82
Sept 2.78Oct 2.74Nov 2.83Dec 2.87
Jan-63 2.91Feb 2.92Mar 2.89Apr 2.90
May 2.93June 2.99
july 3.18Aug 3.32
T. Bill rates
Page 21
Sept 3.38Oct 3.45Nov 3.52Dec 3.52
Jan-64 3.52Feb 3.53Mar 3.54Apr 3.47
May 3.48June 3.48
july 3.46Aug 3.50
Sept 3.53Oct 3.57Nov 3.64Dec 3.84
Jan-65 3.81Feb 3.93Mar 3.93Apr 3.93
May 3.89June 3.80
july 3.84Aug 3.84
Sept 3.92Oct 4.03Nov 4.09Dec 4.38
Jan-66 4.59Feb 4.65Mar 4.59Apr 4.62
May 4.64June 4.50
july 4.80Aug 4.96
Sept 5.37Oct 5.35Nov 5.32Dec 4.96
Jan-67 4.72Feb 4.56Mar 4.26Apr 3.84
May 3.60June 3.54
T. Bill rates
Page 22
july 4.21Aug 4.27
Sept 4.42Oct 4.56Nov 4.73Dec 4.97
Jan-68 5.00Feb 4.98Mar 5.17Apr 5.38
May 5.66June 5.52
july 5.31Aug 5.09
Sept 5.19Oct 5.35Nov 5.45Dec 5.96
Jan-69 6.14Feb 6.12Mar 6.02Apr 6.11
May 6.04June 6.44
july 7.00Aug 6.98
Sept 7.09Oct 7.00Nov 7.24Dec 7.82
Jan-70 7.87Feb 7.13Mar 6.63Apr 6.51
May 6.84June 6.68
july 6.45Aug 6.41
Sept 6.12Oct 5.91Nov 5.28Dec 4.87
Jan-71 4.44Feb 3.70Mar 3.38Apr 3.86
T. Bill rates
Page 23
May 4.14June 4.75
july 5.40Aug 4.94
Sept 4.69Oct 4.46Nov 4.22Dec 4.01
Jan-72 3.38Feb 3.20Mar 3.73Apr 3.71
May 3.69June 3.91
july 3.98Aug 4.02
Sept 4.66Oct 4.74Nov 4.78Dec 5.07
Jan-73 5.41Feb 5.60Mar 6.09Apr 6.26
May 6.36June 7.19
july 8.01Aug 8.67
Sept 8.29Oct 7.22Nov 7.83Dec 7.45
Jan-74 7.77Feb 7.12Mar 7.96Apr 8.33
May 8.23June 7.90
july 7.55Aug 8.96
Sept 8.06Oct 7.46Nov 7.47Dec 7.15
Jan-75 6.26Feb 5.50
T. Bill rates
Page 24
Mar 5.49Apr 5.61
May 5.23June 5.34
july 6.13Aug 6.44
Sept 6.42Oct 5.96Nov 5.48Dec 5.44
Jan-76 4.87Feb 4.88Mar 5.00Apr 4.86
May 5.20June 5.41
july 5.23Aug 5.14
Sept 5.08Oct 4.92Nov 4.75Dec 4.35
Jan-77 4.62Feb 4.67Mar 4.60Apr 4.54
May 4.96June 5.02
july 5.19Aug 5.49
Sept 5.81Oct 6.16Nov 6.10Dec 6.07
Jan-78 6.44Feb 6.45Mar 6.29Apr 6.29
May 6.41June 6.73
july 7.01Aug 7.08
Sept 7.85Oct 7.99Nov 8.64Dec 9.08
T. Bill rates
Page 25
Jan-79 9.35Feb 9.32Mar 9.48Apr 9.46
May 9.61June 9.06
july 9.24Aug 9.52
Sept 10.26Oct 11.70Nov 11.79Dec 12.04
Jan-80 12.00Feb 12.86Mar 15.20Apr 13.20
May 8.58June 7.07
july 8.06Aug 9.13
Sept 10.27Oct 11.62Nov 13.73Dec 15.49
Jan-81 15.02Feb 14.79Mar 13.36Apr 13.69
May 16.30June 14.73
july 14.95Aug 15.51
Sept 14.70Oct 13.54Nov 10.86Dec 10.85
Jan-82 12.28Feb 13.48Mar 12.68Apr 12.70
May 12.09June 12.47
july 11.35Aug 8.68
Sept 7.92Oct 7.71
T. Bill rates
Page 26
Nov 8.07Dec 7.94
Jan-83 7.86Feb 8.11Mar 8.35Apr 8.21
May 8.19June 8.79
july 9.08Aug 9.34
Sept 9.00Oct 8.64Nov 8.76Dec 9.00
Jan-84 8.90Feb 9.09Mar 9.52Apr 9.69
May 9.83June 9.87
july 10.12Aug 10.47
Sept 10.37Oct 9.74Nov 8.61Dec 8.06
Jan-85 7.76Feb 8.27Mar 8.52Apr 7.95
May 7.48June 6.95
july 7.08Aug 7.14
Sept 7.10Oct 7.16Nov 7.24Dec 7.10
Jan-86 7.07Feb 7.06Mar 6.56Apr 6.06
May 6.15June 6.21
july 5.83Aug 5.53

T. Bill rates
Page 27
Sept 5.21Oct 5.18Nov 5.35Dec 5.53
Jan-87 5.43Feb 5.59Mar 5.59Apr 5.64
May 5.66June 5.67
july 5.69Aug 6.04
Sept 6.40Oct 6.13Nov 5.69Dec 5.77
Jan-88 5.81Feb 5.66Mar 5.70Apr 5.91
May 6.26June 6.46
july 6.73Aug 7.06
Sept 7.24Oct 7.35Nov 7.76Dec 8.07
Jan-89 8.27Feb 8.53Mar 8.82Apr 8.65
May 8.43June 8.15
july 7.88Aug 7.90
Sept 7.75Oct 7.64Nov 7.69Dec 7.63
Jan-90 7.64Feb 7.74Mar 7.90Apr 7.77
May 7.74June 7.73
T. Bill rates
Page 28
july 7.62Aug 7.45
Sept 7.36Oct 7.17Nov 7.06Dec 6.74
Jan-91 6.22Feb 5.94Mar 5.91Apr 5.65
May 5.46June 5.57
july 5.58Aug 5.33
Sept 5.22Oct 4.99Nov 4.56Dec 4.07
Jan-92 3.80Feb 3.84Mar 4.04Apr 3.75
May 3.63June 3.66
july 3.21Aug 3.13
Sept 2.91Oct 2.86Nov 3.13Dec 3.22
Jan-93 3.00Feb 2.93Mar 2.95Apr 2.87
May 2.96June 3.07
july 3.04Aug 3.02
Sept 2.95Oct 3.02Nov 3.10Dec 3.06
Jan-94 2.98Feb 3.25Mar 3.50Apr 3.68
T. Bill rates
Page 29
May 4.14June 4.14
july 4.33Aug 4.48
Sept 4.62Oct 4.95Nov 5.29Dec 5.60
Jan-95 5.71Feb 5.77Mar 5.73Apr 5.65
May 5.67June 5.47
july 5.42Aug 5.40
Sept 5.28Oct 5.28Nov 5.36Dec 5.14 5.49
Jan-96 5.00Feb 4.83Mar 4.96Apr 4.95
May 5.02June 5.09
july 5.15Aug 5.05
Sept 5.09Oct 4.99Nov 5.03Dec 4.91 5.01
Jan-97 5.03Feb 5.01Mar 5.14Apr 5.16
May 5.05June 4.93
july 5.05Aug 5.14
Sept 4.95Oct 4.97Nov 5.14Dec 5.16 5.06
Jan-98 5.04Feb 5.09
T. Bill rates
Page 30
Mar 5.03Apr 4.95
May 5.00June 4.98
july 4.96Aug 4.90
Sept 4.61Oct 3.96Nov 4.41Dec 4.39 4.78
Jan-99 4.34Feb 4.44Mar 4.44Apr 4.29
May 4.50June 4.57
july 4.55Aug 4.72
Sept 4.68Oct 4.86Nov 5.07Dec 5.20 4.64
Jan-00 5.32Feb 5.55Mar 5.69Apr 5.66
May 5.79June 5.69
july 5.96Aug 6.09
Sept 6.00Oct 6.11Nov 6.17Dec 5.77 5.82
Jan-01 5.15Feb 4.88Mar 4.42Apr 3.87
May 3.62June 3.49
july 3.51Aug 3.36
Sept 2.64Oct 2.16Nov 1.87Dec 1.69 3.39
T. Bill rates
Page 31
Jan-02 1.65Feb 1.73Mar 1.79Apr 1.72
May 1.73June 1.70
july 1.68Aug 1.62
Sept 1.63Oct 1.58Nov 1.23Dec 1.19 1.60
Jan-03 1.17Feb 1.17Mar 1.13Apr 1.13
May 1.07June 0.92
july 0.90Aug 0.95
Sept 0.94Oct 0.92Nov 0.93Dec 0.90 1.01
Jan-04 0.88Feb 0.93Mar 0.94Apr 0.94
May 1.02June 1.27
july 1.33Aug 1.48
Sept 1.65Oct 1.76Nov 2.07Dec 2.19 1.37
Jan-05 2.33Feb 2.54Mar 2.74Apr 2.78
May 2.84June 2.97
july 3.22Aug 3.44
Sept 3.42Oct 3.71
T. Bill rates
Page 32
Nov 3.88Dec 3.89 3.15
Jan-06 4.24Feb 4.43Mar 4.51Apr 4.60
May 4.72June 4.79
july 4.95Aug 4.96
Sept 4.81Oct 4.92Nov 4.94Dec 4.85 4.73
Jan-07 4.98Feb 5.03Mar 4.94Apr 4.87
May 4.73June 4.61
july 4.82Aug 4.20
Sept 3.89Oct 3.90Nov 3.27Dec 3.00 4.35
Jan-08 2.75Feb 2.12Mar 1.26Apr 1.29
May 1.73June 1.86
july 1.63Aug 1.72
Sept 1.13Oct 0.67Nov 0.19Dec 0.03 1.37
January 09 0.13Feb 0.30Mar 0.21Apr 0.16
May 0.18June 0.18July 0.18Aug 0.17
T. Bill rates
Page 33
Sept 0.12Oct 0.07Nov 0.05Dec 0.14 0.16
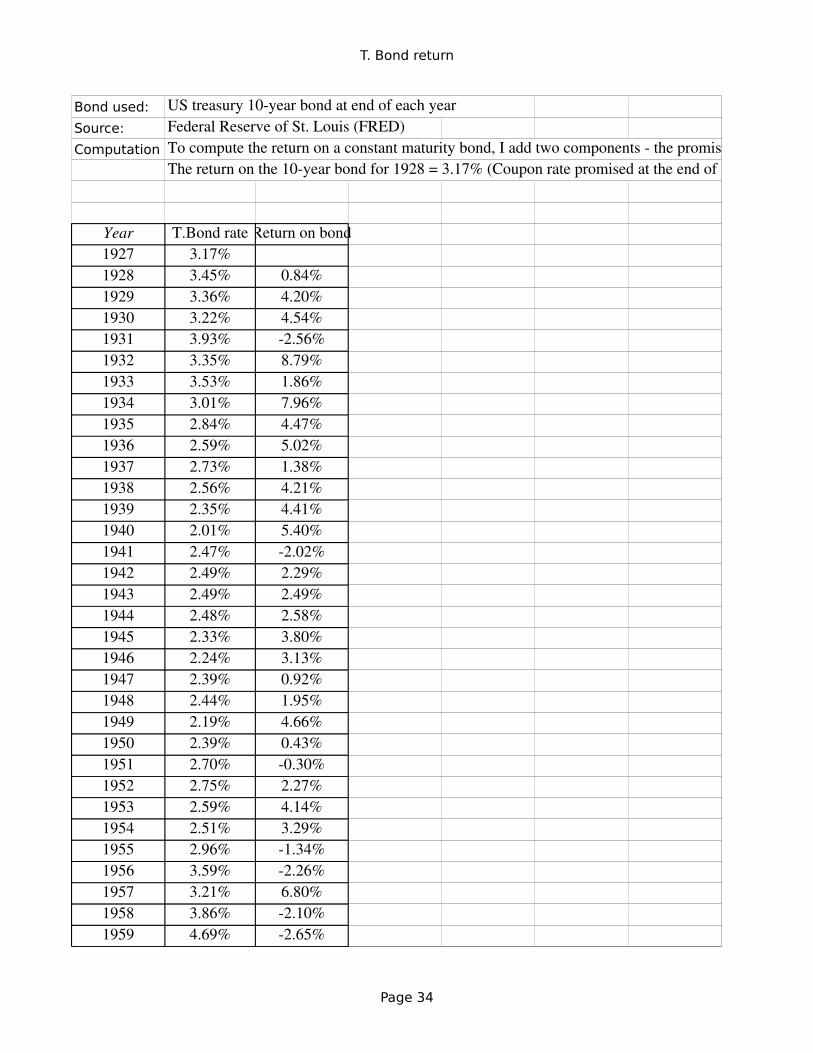
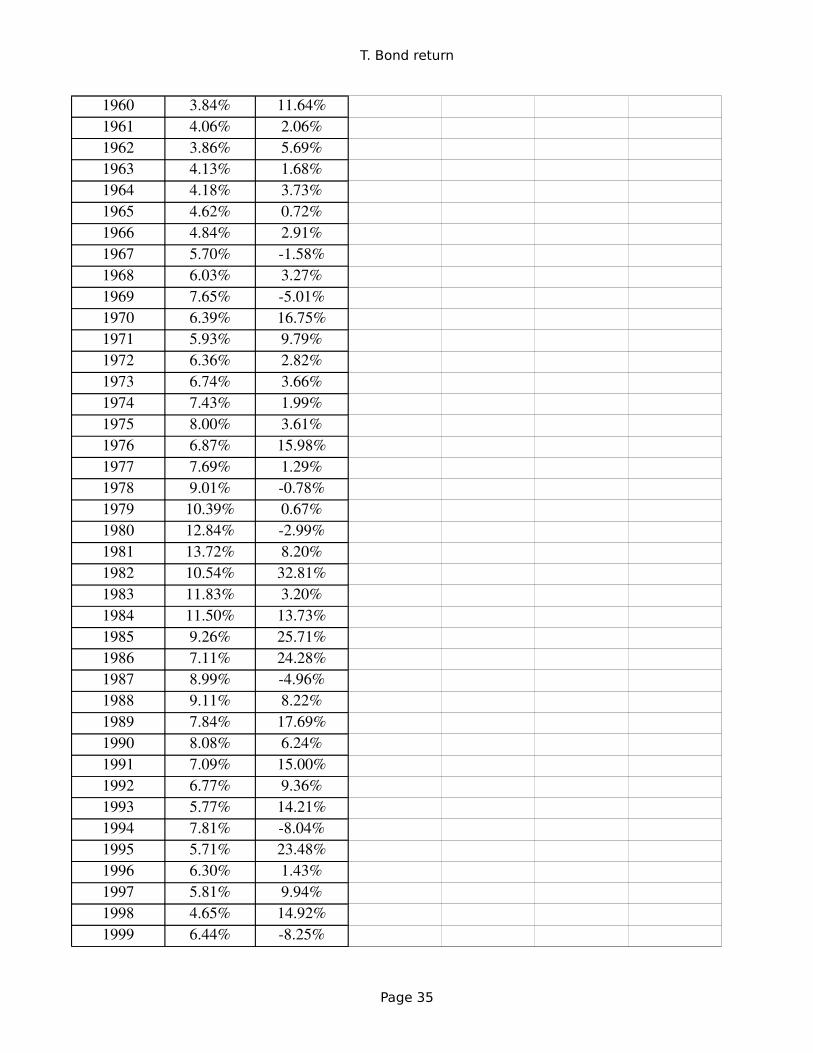
T. Bond return
Page 34
Bond used: US treasury 10year bond at end of each yearSource: Federal Reserve of St. Louis (FRED)Computation To compute the return on a constant maturity bond, I add two components the promised coupon at the start of the year and the price change due to interest rate changes.
The return on the 10year bond for 1928 = 3.17% (Coupon rate promised at the end of 1927) Price change on a bond with a coupon rate of 3.17%, when the interest rate goes to 3.45%.
Year T.Bond rate Return on bond1927 3.17%1928 3.45% 0.84%1929 3.36% 4.20%1930 3.22% 4.54%1931 3.93% 2.56%1932 3.35% 8.79%1933 3.53% 1.86%1934 3.01% 7.96%1935 2.84% 4.47%1936 2.59% 5.02%1937 2.73% 1.38%1938 2.56% 4.21%1939 2.35% 4.41%1940 2.01% 5.40%1941 2.47% 2.02%1942 2.49% 2.29%1943 2.49% 2.49%1944 2.48% 2.58%1945 2.33% 3.80%1946 2.24% 3.13%1947 2.39% 0.92%1948 2.44% 1.95%1949 2.19% 4.66%1950 2.39% 0.43%1951 2.70% 0.30%1952 2.75% 2.27%1953 2.59% 4.14%1954 2.51% 3.29%1955 2.96% 1.34%1956 3.59% 2.26%1957 3.21% 6.80%1958 3.86% 2.10%1959 4.69% 2.65%
T. Bond return
Page 35
1960 3.84% 11.64%1961 4.06% 2.06%1962 3.86% 5.69%1963 4.13% 1.68%1964 4.18% 3.73%1965 4.62% 0.72%1966 4.84% 2.91%1967 5.70% 1.58%1968 6.03% 3.27%1969 7.65% 5.01%1970 6.39% 16.75%1971 5.93% 9.79%1972 6.36% 2.82%1973 6.74% 3.66%1974 7.43% 1.99%1975 8.00% 3.61%1976 6.87% 15.98%1977 7.69% 1.29%1978 9.01% 0.78%1979 10.39% 0.67%1980 12.84% 2.99%1981 13.72% 8.20%1982 10.54% 32.81%1983 11.83% 3.20%1984 11.50% 13.73%1985 9.26% 25.71%1986 7.11% 24.28%1987 8.99% 4.96%1988 9.11% 8.22%1989 7.84% 17.69%1990 8.08% 6.24%1991 7.09% 15.00%1992 6.77% 9.36%1993 5.77% 14.21%1994 7.81% 8.04%1995 5.71% 23.48%1996 6.30% 1.43%1997 5.81% 9.94%1998 4.65% 14.92%1999 6.44% 8.25%
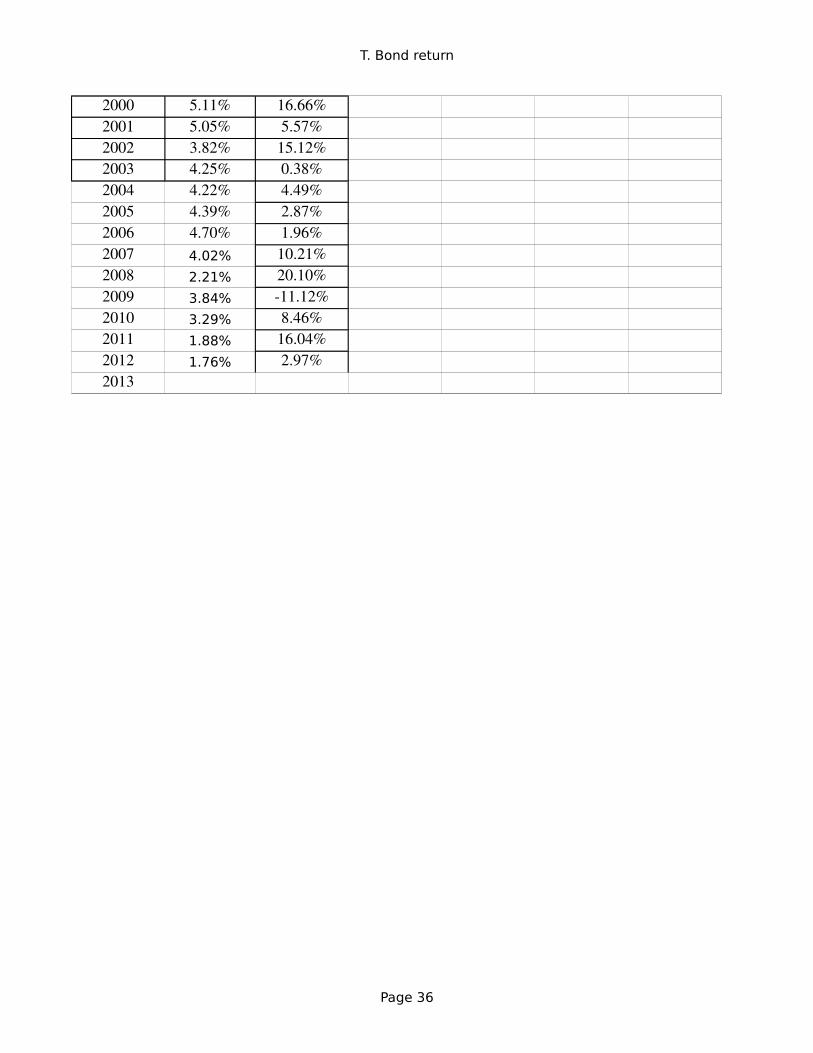
T. Bond return
Page 36
2000 5.11% 16.66%2001 5.05% 5.57%2002 3.82% 15.12%2003 4.25% 0.38%2004 4.22% 4.49%2005 4.39% 2.87%2006 4.70% 1.96%2007 4.02% 10.21%2008 2.21% 20.10%2009 3.84% 11.12%2010 3.29% 8.46%2011 1.88% 16.04%2012 1.76% 2.97%2013

T. Bond return
Page 37
To compute the return on a constant maturity bond, I add two components the promised coupon at the start of the year and the price change due to interest rate changes.The return on the 10year bond for 1928 = 3.17% (Coupon rate promised at the end of 1927) Price change on a bond with a coupon rate of 3.17%, when the interest rate goes to 3.45%.

T. Bond return
Page 38

T. Bond return
Page 39

Summary for ppt
Page 40
Arithmetic Average Geometric AverageStocks - T. BillsStocks - T. BondsStocks - T. BillsStocks - T. Bonds
1928-2015 7.92% 6.18% 6.05% 4.54%Std Error 2.15% 2.29%1966-2015 6.05% 3.89% 4.69% 2.90%Std Error 2.42% 2.74%2006-2015 7.87% 3.88% 6.11% 2.53%Std Error 6.06% 8.66%

Summary for ppt
Page 41
Stocks - T. Bonds