historic context late 19th and arly 20th entury …
TRANSCRIPT
HISTORIC CONTEXT
LATE 19TH AND EARLY 20TH CENTURY PLANTATIONS AND FARMS IN THE CENTER AND LOWER TOWNSHIPS OF RICHLAND COUNTY, SOUTH CAROLINA
Christopher Ohm Clement Applied Research Division
South Carolina Institute of Archaeology and Anthropology
Prepared for:
The South Carolina National Guard 1 National Guard Rd. Columbia, SC 29201
March 2009

ii
CONTENTS List of Figures ..............................................................................................................................iii List of Tables ................................................................................................................................ v Acknowledgements......................................................................................................................vi Introduction................................................................................................................................... 1 Summary of Cultural Resources on Fort Jackson and McEntire ............................................ 2 Physiography of Richland County .......................................................................................... 6 Upland South vs. Plantations .................................................................................................. 8 The Plantation Tradition ................................................................................................... 8 The Upland South — A summary .................................................................................... 9 Geographic Scope ..................................................................................................... 10 Report Organization.............................................................................................................. 12 Historical Sketch of Post-Emancipation Richland County......................................................... 14 From Slavery to Free Labor.................................................................................................. 14 Infrastructural Changes......................................................................................................... 20 Summary ............................................................................................................................... 29 Agriculture and Land Tenure...................................................................................................... 30 Land Tenure .......................................................................................................................... 30 Production Strategies ............................................................................................................ 32 Summary ............................................................................................................................... 38 Archaeological Approaches to Late 19th-Early 20th Century Agricultural Sites ...................... 39 Property Types and Locational Patterns ............................................................................... 39 Settlement Patterning ............................................................................................................ 41 Refuse Disposal Patterns....................................................................................................... 47 Artifacts and Artifact Patterning........................................................................................... 49 Pitfalls in Pattern Analysis.................................................................................................... 52 Summary ............................................................................................................................... 53 Conclusion .................................................................................................................................. 55 Geographical Limits of this Context..................................................................................... 57 References Cited ......................................................................................................................... 59
iii
LIST OF FIGURES Figure 1. Locations of known 19th and/or 20th century sites on Fort Jackson ........................... 2 Figure 2. Locations of known 19th and/or 20th century sites on McEntire Air Base ................. 3 Figure 3. Details of the 1916 Soils Map of Richland County...................................................... 3 Figure 4. Physiography of Richland County................................................................................ 7 Figure 5. Schematic of pre- and post-emancipation plantation settlement pattern.................... 10 Figure 6. Map of Upland South hearth area and migration ....................................................... 11 Figure 7. South Carolina Land Commission sales by County ................................................... 16 Figure 8. Richland County in 1873............................................................................................ 17 Figure 9. Relative presence of African Americans in rural Richland County, 1890-1930........ 19 Figure 10. Portion of 1915 School District Map of Richland County showing the area
of the center township............................................................................................ 21 Figure 11. Portion of 1915 School District Map of Richland County showing the area
of the lower township............................................................................................. 22
Figure 12. Detail of 1897 Map of Richland County, South Carolina showing the center township................................................................................................................. 24
Figure 13. Detail of 1897 Map of Richland County, South Carolina showing the center
township................................................................................................................. 25 Figure 14. Comparison of farm size in the lower and center townships, 1880.......................... 33 Figure 15. Relative percentage of productive acreage devoted to corn, cotton and
other crops in the lower township.......................................................................... 35

iv
Figure 16. Relative percentage of productive acreage devoted to corn, cotton and other crops in the center township ......................................................................... 36
Figure 17. Percentage of owner-operated farms in South Carolina by county, 1920................ 38 Figure 18. Schematic of an idealized renter’s farmstead........................................................... 45

v
LIST OF TABLES Table 1. Farm size in Richland County for the years 1860 and 1870........................................ 15 Table 2. Richland County population in 10 year increments..................................................... 19 Table 3. List of non-domestic structures associated with agricultural sites .............................. 40
vi
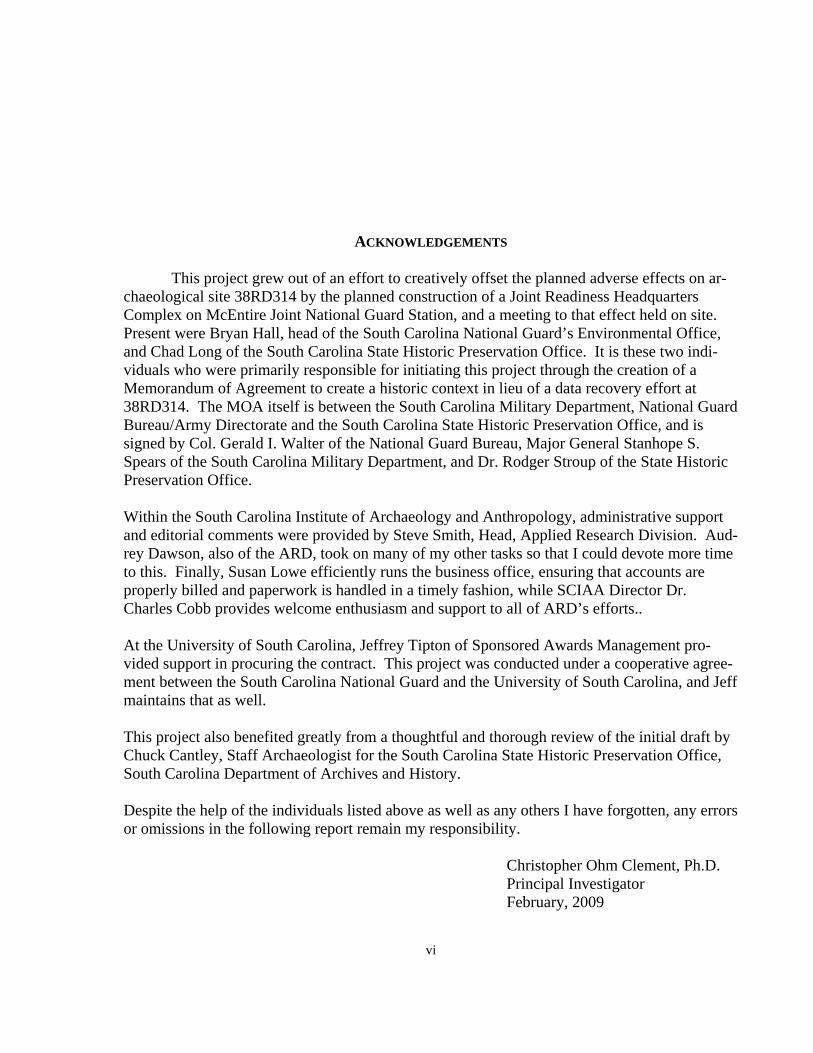
ACKNOWLEDGEMENTS This project grew out of an effort to creatively offset the planned adverse effects on ar-chaeological site 38RD314 by the planned construction of a Joint Readiness Headquarters Complex on McEntire Joint National Guard Station, and a meeting to that effect held on site. Present were Bryan Hall, head of the South Carolina National Guard’s Environmental Office, and Chad Long of the South Carolina State Historic Preservation Office. It is these two indi-viduals who were primarily responsible for initiating this project through the creation of a Memorandum of Agreement to create a historic context in lieu of a data recovery effort at 38RD314. The MOA itself is between the South Carolina Military Department, National Guard Bureau/Army Directorate and the South Carolina State Historic Preservation Office, and is signed by Col. Gerald I. Walter of the National Guard Bureau, Major General Stanhope S. Spears of the South Carolina Military Department, and Dr. Rodger Stroup of the State Historic Preservation Office. Within the South Carolina Institute of Archaeology and Anthropology, administrative support and editorial comments were provided by Steve Smith, Head, Applied Research Division. Aud-rey Dawson, also of the ARD, took on many of my other tasks so that I could devote more time to this. Finally, Susan Lowe efficiently runs the business office, ensuring that accounts are properly billed and paperwork is handled in a timely fashion, while SCIAA Director Dr. Charles Cobb provides welcome enthusiasm and support to all of ARD’s efforts.. At the University of South Carolina, Jeffrey Tipton of Sponsored Awards Management pro-vided support in procuring the contract. This project was conducted under a cooperative agree-ment between the South Carolina National Guard and the University of South Carolina, and Jeff maintains that as well. This project also benefited greatly from a thoughtful and thorough review of the initial draft by Chuck Cantley, Staff Archaeologist for the South Carolina State Historic Preservation Office, South Carolina Department of Archives and History. Despite the help of the individuals listed above as well as any others I have forgotten, any errors or omissions in the following report remain my responsibility.
Christopher Ohm Clement, Ph.D. Principal Investigator February, 2009

Introduction
INTRODUCTION
This report presents a historic context for late 19th-early 20th century farm sites in Rich-land County, South Carolina. The impetus for the project comes from archaeological site 38RD314, a site of the type and time period mentioned above located on McEntire Air National Guard Base. Site 38RD314 will be impacted by construction of a Joint Forces Headquarters. Rather than conducting standard data recovery operations in mitigation of adverse impacts, however, the SCARNG in consultation with the State History Preservation office elected to fund this historic context for similar sites in order to more effectively manage such sites both on McEntire ARNG base and on nearby McCrady Training Center, which is part of Fort Jackson. A historic context, as defined by the Advisory Council on Historic Preservation, is “an organiz-ing structure for interpreting history that groups information about historic properties which share a common theme, common geographical location, and common time period ” (National Register Bulletin 16). The purpose of a context is to identify important research themes and/or questions relating to the topic addressed, in this case late 19th-early 20th century farms. It is against these themes and questions that the significance of an individual site representing such a farms is measured, and in turn it is the significance of a site that informs eligibility determina-tions and drives management decisions. This historic context, then, is designed to provide data by which SCARNG land managers can assess the significance of a particular class of cultural resource. McEntire is within what is today known as Lower Richland County, and what was known historically as the lower township. This is the area of the county that lies roughly below Garners Ferry Rd (US76/SC378). McCrady Training Center, on the other hand, is above Gar-ners Ferry Rd in the area that was historically known as the center township. The center town-ship extends from the Wateree River to the east, westward to the city of Columbia and (roughly) N. Main St (US21) as it heads north towards Charlotte. On the north it is bounded by Kershaw County. N. Main/US21 is the traditional boundary between the center township and upper township. The present research did not delve into the origins of this nomenclature, but it was well in place by the end of the Civil War, as is evidenced on several maps dating from the late 19th and early 20th century. The geographic underpinnings of the nomenclature are very clear though, as each of the townships in Richland County occupies a different physiographic province: the upper township is in the Piedmont, the center township is in the sandhills and the lower township is in the lower coastal plain. Physiography, then, provides a backdrop for this context. As McEntire and McCrady fall in the lower and center township respectively, this con-text only peripherally considers the upper township. The geography of each of these areas has had a direct impact on the agricultural possi-bilities available to the people who lived there, and thus on their lives and lifestyles. Where the lower township was characterized by large-scale plantation agriculture prior to the Civil War,

2
Introduction
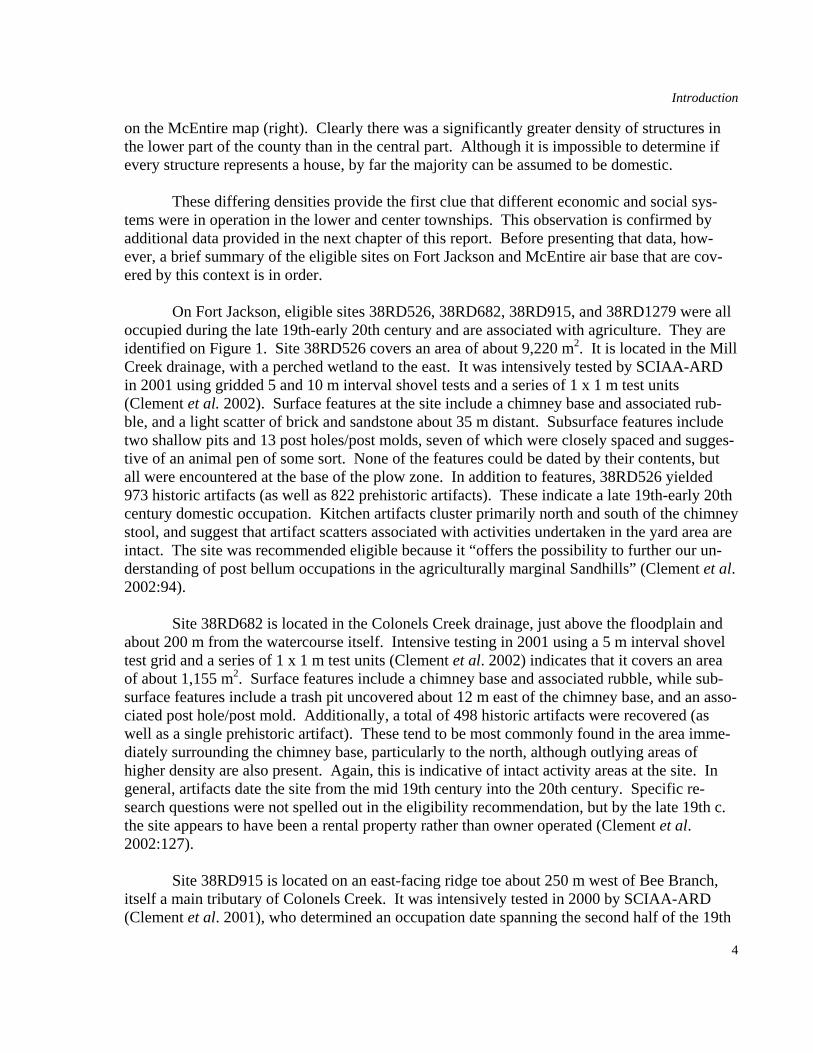
the soils in the center township discouraged such an economy and the area never saw the devel-opment of a large-scale, slave-based plantation system. Instead, an adaptation more akin to the Upland South yeoman farmer appears to characterize the area, though the “Upland South” as it has been defined by cultural geographers does not extend to the midlands of South Carolina, being instead an adaptation characteristic of the Piedmont. Nevertheless, these two alternative agricultural economic systems provide contrasting thematic elements that can be set off against one another to best illustrate the research potential of sites within the bounds of the study areas. Summary of Cultural Resources on Fort Jackson and McEntire Based on the most recent GIS data available, there are 113 archaeological sites on Fort Jackson dating from the 19th or 20th century. This represents just under 17% of the 668 known sites (Fort Jackson Integrated Cultural Resource Management Plan:3-1) on the installation. Al-though it is beyond the scope of this work to examine the individual site forms for each of the 19th and 20th century sites on the installation to determine if they are late 19th-early 20th c. farm sites, it is likely that most of the historic sites on Fort Jackson are indeed derived from this site type. Additionally, four of Fort Jackson’s eligible sites are of this type. Figure 1 shows the lo-cation of each 19th and 20th century site on Fort Jackson. Of primary importance for under-standing the economic system that produced these sites, 113 sites in Fort Jackson’s ca. 52,500 acres equates to one site for every 465 acres. Even omitting the approximately 7,400 acres of the installation that have not been subject to survey due to the known or possible presence of unexploded ordinance, there is one late 19th-early 20th century site every 400 acres on Fort Jack-son.
Historic Sites on Fort Jackson
38RD318
38RD526
38RD682
38RD1279
Gills Creek
Mill
Cre
ek
Colonels Creek
.
5,000 0 5,0002,500 Meters
Figure 1. Locations of known 19th and/or 20th century sites on Fort Jackson. Eligible sites are labeled.
3
Introduction
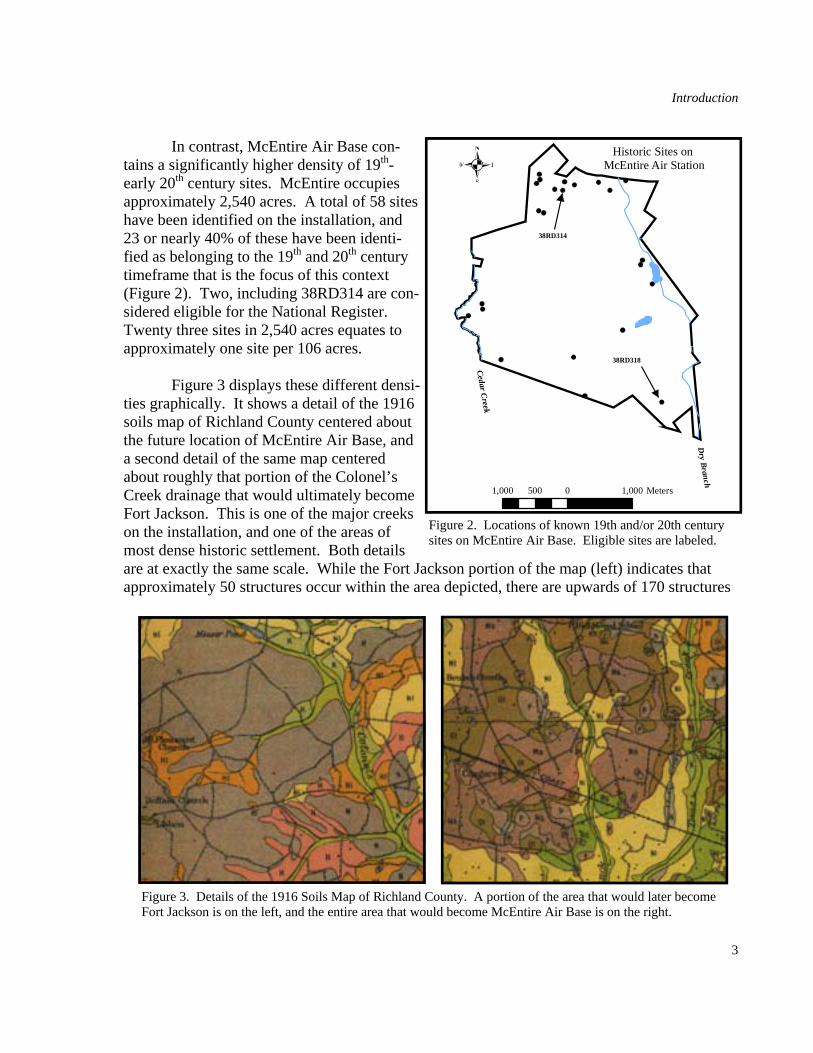
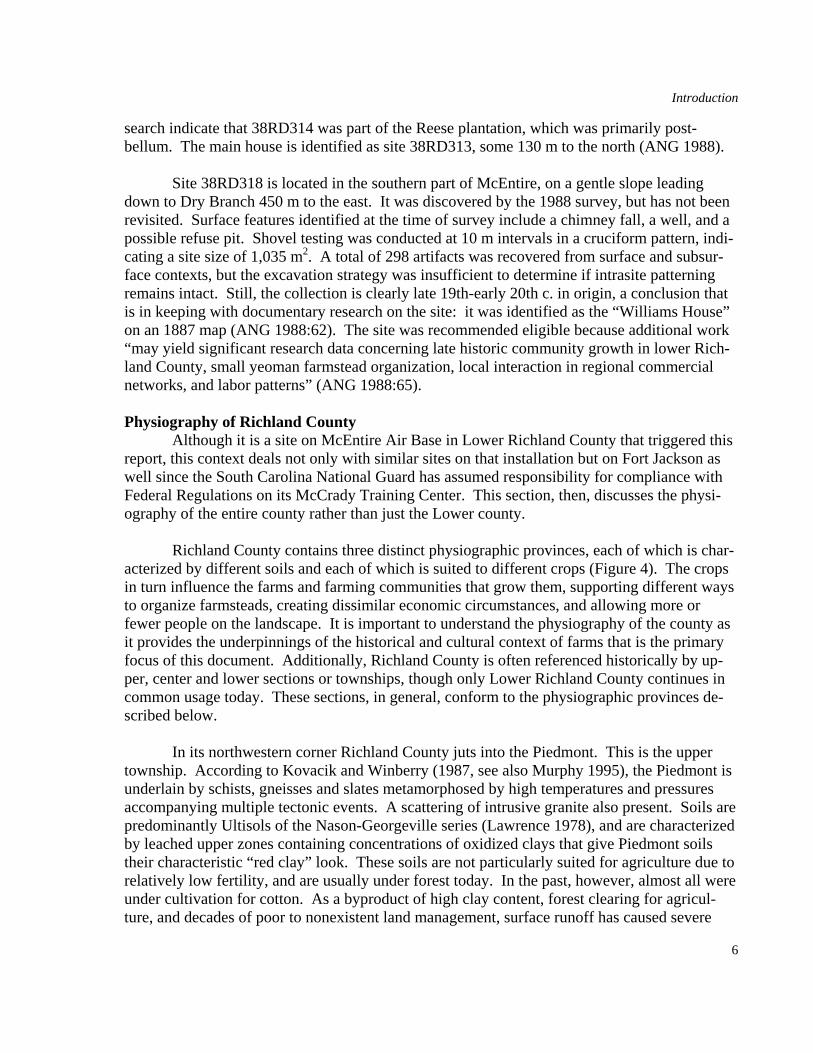
In contrast, McEntire Air Base con-tains a significantly higher density of 19th-early 20th century sites. McEntire occupies approximately 2,540 acres. A total of 58 sites have been identified on the installation, and 23 or nearly 40% of these have been identi-fied as belonging to the 19th and 20th century timeframe that is the focus of this context (Figure 2). Two, including 38RD314 are con-sidered eligible for the National Register. Twenty three sites in 2,540 acres equates to approximately one site per 106 acres. Figure 3 displays these different densi-ties graphically. It shows a detail of the 1916 soils map of Richland County centered about the future location of McEntire Air Base, and a second detail of the same map centered about roughly that portion of the Colonel’s Creek drainage that would ultimately become Fort Jackson. This is one of the major creeks on the installation, and one of the areas of most dense historic settlement. Both details are at exactly the same scale. While the Fort Jackson portion of the map (left) indicates that approximately 50 structures occur within the area depicted, there are upwards of 170 structures
1,000 0 1,000500 Meters
.
Cedar Creek
Dry Branch
Historic Sites on McEntire Air Station
38RD318
38RD314
Figure 2. Locations of known 19th and/or 20th century sites on McEntire Air Base. Eligible sites are labeled.
Figure 3. Details of the 1916 Soils Map of Richland County. A portion of the area that would later become Fort Jackson is on the left, and the entire area that would become McEntire Air Base is on the right.
4
Introduction
on the McEntire map (right). Clearly there was a significantly greater density of structures in the lower part of the county than in the central part. Although it is impossible to determine if every structure represents a house, by far the majority can be assumed to be domestic. These differing densities provide the first clue that different economic and social sys-tems were in operation in the lower and center townships. This observation is confirmed by additional data provided in the next chapter of this report. Before presenting that data, how-ever, a brief summary of the eligible sites on Fort Jackson and McEntire air base that are cov-ered by this context is in order. On Fort Jackson, eligible sites 38RD526, 38RD682, 38RD915, and 38RD1279 were all occupied during the late 19th-early 20th century and are associated with agriculture. They are identified on Figure 1. Site 38RD526 covers an area of about 9,220 m2. It is located in the Mill Creek drainage, with a perched wetland to the east. It was intensively tested by SCIAA-ARD in 2001 using gridded 5 and 10 m interval shovel tests and a series of 1 x 1 m test units (Clement et al. 2002). Surface features at the site include a chimney base and associated rub-ble, and a light scatter of brick and sandstone about 35 m distant. Subsurface features include two shallow pits and 13 post holes/post molds, seven of which were closely spaced and sugges-tive of an animal pen of some sort. None of the features could be dated by their contents, but all were encountered at the base of the plow zone. In addition to features, 38RD526 yielded 973 historic artifacts (as well as 822 prehistoric artifacts). These indicate a late 19th-early 20th century domestic occupation. Kitchen artifacts cluster primarily north and south of the chimney stool, and suggest that artifact scatters associated with activities undertaken in the yard area are intact. The site was recommended eligible because it “offers the possibility to further our un-derstanding of post bellum occupations in the agriculturally marginal Sandhills” (Clement et al. 2002:94). Site 38RD682 is located in the Colonels Creek drainage, just above the floodplain and about 200 m from the watercourse itself. Intensive testing in 2001 using a 5 m interval shovel test grid and a series of 1 x 1 m test units (Clement et al. 2002) indicates that it covers an area of about 1,155 m2. Surface features include a chimney base and associated rubble, while sub-surface features include a trash pit uncovered about 12 m east of the chimney base, and an asso-ciated post hole/post mold. Additionally, a total of 498 historic artifacts were recovered (as well as a single prehistoric artifact). These tend to be most commonly found in the area imme-diately surrounding the chimney base, particularly to the north, although outlying areas of higher density are also present. Again, this is indicative of intact activity areas at the site. In general, artifacts date the site from the mid 19th century into the 20th century. Specific re-search questions were not spelled out in the eligibility recommendation, but by the late 19th c. the site appears to have been a rental property rather than owner operated (Clement et al. 2002:127). Site 38RD915 is located on an east-facing ridge toe about 250 m west of Bee Branch, itself a main tributary of Colonels Creek. It was intensively tested in 2000 by SCIAA-ARD (Clement et al. 2001), who determined an occupation date spanning the second half of the 19th

5
Introduction
century and into the opening decades of the 20th based on materials recovered as well as his-toric maps. Recorded surface features include two sandstone chimney bases with associated rubble, sandstone piers that suggest a second structure some 20 m to the north, a well 12 m to the southeast, and a well-defined dry-laid stone terrace face marking the northern edge of the site. A small pile of brick and two additional sandstone blocks are also present, but are not im-mediately suggestive of structures. No subsurface features were encountered. The testing strat-egy included a 10 m interval shovel test grid combined with 2m interval shovel test transects across selected portions of the site. This revealed three areas of the site where subsurface arti-facts appear to cluster, one corresponding to the well and chimney bases, one near the structure to the north, and one within an area of burned soils east of the chimney bases. The report points out that these oncentrations suggest that post occupations disturbances to the site do not appear to have impacted artifact distrubutions in the yard area and that where parts of the yard were used for discard others were kept clear of artifacts. In other words, depositional pattering within the site is intact. The final eligible late 19th-early 20th century agricultural site on Fort Jackson is 38RD1279. This site is located on an unnamed tributary of Colonels Creek, which is some 1.8 km to the east. The site occupies a low ridge toe facing northwards, and is backed by high ground to the south. It was initially discovered as a “late discovery” — an isolated artifact or artifacts found where no previously identified site was known to exist — in 1999 near a docu-mented cemetery, and subsequently investigated in late 2004-early 2005 (Homsey 2005). Aside from the cemetery, which turned out to be an associated family cemetery and is located about 50 m from the main site area, surface features at 38RD1279 include a chimney base/fall, a road trace leading into the site, two possible dry-laid stone terrace faces (which may be building pads), a possible unlined well approximately 10 m south of the chimney location, and a group-ing of four cut sandstone blocks approximately 10 m east of the chimney and well. Excluding the cemetery, site 38RD1279 is about 12,000 m2. Shovel testing on grid at 10 m intervals yielded no subsurface features, but areas of artifact concentration as well as voids are apparent. The total artifact count was 305, including 83 prehistoric artifacts. The historics at the site, in combination with archival research and headstones in the cemetery, indicate an occupation be-ginning towards the end of the early 19th century and running through the early 20th century. On McEntire, sites 38RD314 and 38RD318 are eligible domestic sites associated with agriculture and date from the late 19th-early 20th c. Site 38RD314 is the site which triggered this report. It is located in the northern part of McEntire, between Dry Branch to the east and Cedar Creek to the west. The site was initially discovered during a 1988 survey (ANG 1988), and reexamined during a subsequent survey in 2002-2003 (Keene 2004). Surface features at the site include a collapsed structure (visible during the 1988 survey but gone by the time the site was revisited in 2002-2003), a brick chimney fall surrounded by a debris scatter, and two de-pressions that may mark well locations, one about 30 m south of the chimney fall and the other about 10 m to the west. The site was shovel tested on grid at a 10 m interval, yielding a site size of more than 32,000 m2. Artifacts cluster around the chimney fall and wells, but also in at least two areas to the east. A total of 253 was recovered. These, along with documentary re-
6
Introduction
search indicate that 38RD314 was part of the Reese plantation, which was primarily post-bellum. The main house is identified as site 38RD313, some 130 m to the north (ANG 1988). Site 38RD318 is located in the southern part of McEntire, on a gentle slope leading down to Dry Branch 450 m to the east. It was discovered by the 1988 survey, but has not been revisited. Surface features identified at the time of survey include a chimney fall, a well, and a possible refuse pit. Shovel testing was conducted at 10 m intervals in a cruciform pattern, indi-cating a site size of 1,035 m2. A total of 298 artifacts was recovered from surface and subsur-face contexts, but the excavation strategy was insufficient to determine if intrasite patterning remains intact. Still, the collection is clearly late 19th-early 20th c. in origin, a conclusion that is in keeping with documentary research on the site: it was identified as the “Williams House” on an 1887 map (ANG 1988:62). The site was recommended eligible because additional work “may yield significant research data concerning late historic community growth in lower Rich-land County, small yeoman farmstead organization, local interaction in regional commercial networks, and labor patterns” (ANG 1988:65). Physiography of Richland County Although it is a site on McEntire Air Base in Lower Richland County that triggered this report, this context deals not only with similar sites on that installation but on Fort Jackson as well since the South Carolina National Guard has assumed responsibility for compliance with Federal Regulations on its McCrady Training Center. This section, then, discusses the physi-ography of the entire county rather than just the Lower county. Richland County contains three distinct physiographic provinces, each of which is char-acterized by different soils and each of which is suited to different crops (Figure 4). The crops in turn influence the farms and farming communities that grow them, supporting different ways to organize farmsteads, creating dissimilar economic circumstances, and allowing more or fewer people on the landscape. It is important to understand the physiography of the county as it provides the underpinnings of the historical and cultural context of farms that is the primary focus of this document. Additionally, Richland County is often referenced historically by up-per, center and lower sections or townships, though only Lower Richland County continues in common usage today. These sections, in general, conform to the physiographic provinces de-scribed below.
In its northwestern corner Richland County juts into the Piedmont. This is the upper township. According to Kovacik and Winberry (1987, see also Murphy 1995), the Piedmont is underlain by schists, gneisses and slates metamorphosed by high temperatures and pressures accompanying multiple tectonic events. A scattering of intrusive granite also present. Soils are predominantly Ultisols of the Nason-Georgeville series (Lawrence 1978), and are characterized by leached upper zones containing concentrations of oxidized clays that give Piedmont soils their characteristic “red clay” look. These soils are not particularly suited for agriculture due to relatively low fertility, and are usually under forest today. In the past, however, almost all were under cultivation for cotton. As a byproduct of high clay content, forest clearing for agricul-ture, and decades of poor to nonexistent land management, surface runoff has caused severe

7
Introduction
erosion throughout the Piedmont. Estimates indicate that in the South Carolina Piedmont nearly 25cm of topsoil, and maybe up to 30cm in some broad areas, were lost in the 19th and early 20th century, and soils are still not recovered.
The Piedmont terminates at the fall line, which cuts off the northwestern 2/3s of Rich-land county from the remainder. The sandhills physiographic province (and the center town-ship) parallels the fall line, and particularly in the Midlands is characterized by both the Pine-hurst formation and the more typical “red” sandhills. These appear to be of dissimilar origins. The latter is made up of ancient deltaic river deposits and weathered clays from the Piedmont, imparting the “red” to the name. The former, however, may be remnants of overlying Miocene-or Holocene-aged dune formations (Kovacik and Winberry 1987; Murphy 1995; Soller and Mills 1991). Regardless, both are highly permeable, and in upland, interfluvial areas the san-
Fort Jackson
McEntire ANG
tu76
tu1
tu21
tu601
tu176
tu321
tu76
tu76
tu21Piedmont
Sandhills
Lower Coastal Plain
Floodplain
US Highways
Railroads
Military Reservation
. 10 0 105 Kilometers
Richland CountyPhysiography
Figure 4. Physiography of Richland County (after Kovacik and Winberry 1987; Soil Survey Staff, Natural Re-sources Conservation Service, United States Department of Agriculture. U.S. General Soil Map (STATSGO) for South Carolina [http://soildatamart.nrcs.usda.gov], Accessed 1 Nov 2007.) .

8
Introduction
dhills are often characterized by vegetation that is well adapted to dry, even arid, conditions. Soils are classed as Entisols, which are generally low in nutrients and organics due to rapid leaching, and are poor supporters of agriculture. They include the excessively drained Lakeland soils, the Vaucluse-Ailey-Pelion series, the Fuquay-Troup-Vaucluse series, and the Pelion-Johnston-Vaucluse series (Lawrence 1978).
Seaward of the sandhills is the lower township (Lower Richland County) on the coastal plain physiographic province, which is divided into landward (inner) and seaward (outer) por-tions. Only the former occurs within Richland County. The geological underpinnings consist of sedimentary rocks ranging in thickness from only a few meters nearest the fall line to more than 1,000m at the coast. As in the Piedmont, soils are predominantly Ultisols, but clay content is lower in the inner coastal plain. These soils are better drained and in general are the best suited for agricultural production in South Carolina. They include the Orangeburg-Norfolk-Marlboro series, the Dothan-Clarendon series, and the Persanti-Cantey-Goldsboro series. In addition to Ultisols, Lower Richland is also characterized by the broad floodplain of the Conga-ree River. This area is ½ to 5 miles wide, and is dominated by nearly level silty and clayey al-luvial sediments derived from the Piedmont and classified in the Congaree-Tawcaw-Chastain series (Lawrence 1978). The Upland South vs. Plantations This section provides a brief comparison of the concepts “Upland South” and “Plantation”. While in the first case a geographic area is used as the referent, both plantations and the upland south concept can be viewed as economic and sociocultural responses to the en-vironment encountered by early European settlers in the southeastern United States. However, where plantations derived from the settlement of the South Carolina coast via the Caribbean, the Upland South adaptation derives from settlement of the Piedmont. Within the confines of South Carolina, while the plantation system developed primarily in the coastal plain, the Upland South concept relates to the Piedmont. Furthermore, while the Upland South was largely pushed out of the Piedmont as farming technologies developed, to be replaced by a plantaion economy, it persisted in areas where farming continued to be unprofitable. The sandhills repre-sent one such agriculturally unproductive pocket, and contain McCrady Training Center. McEntire, on the other hand, is in the coastal plain. The Plantation Tradition A plantation can be defined as a large scale agricultural operation producing primarily a staple crop for a non-local market using coerced labor (Thompson 1984). This is clearly appli-cable to the midlands of South Carolina during the antebellum period. It is less clearly so post-emancipation, but this is a function of land tenure vs. land ownership. The economic realities of emancipation gave rise tenancy, including sharecropping and renting, and we tend to follow the US Census by looking at individual farms regardless of whether they were rented/sharecropped or farmed by the actual owner. Tenant farms, however, were part of larger land-holdings, and the renters and sharecroppers were not such by choice. Rather, they did not have the economic resources to buy a farm of their own, and the sharecropping system in particular was designed to support and sustain the status quo rather than provide opportunities to improve

9
Introduction
oneself economically. In this sense, then, tenants were “coerced” into providing their labor (Mandle 1978 – in Orser 1988), and the post-emancipation system of production can be seen as a continuum of the antebellum plantation system despite the end of chattel slavery (Prunty 1955). Orser (1988) refers to the plantation “tradition”, which aptly describes the continued mindset in the south about plantations and their role in agricultural production and southern so-ciety. In 1910 the US Census bureau acknowledged this continuation of the earlier tradition by changing its stance on the enumeration of rented and sharecropped properties. They defined a “tenant plantation” as “a continuous tract of land of considerable area under the general super-vision or control of a single individual or firm, all or a part of such tract being divided into at least five small tracts, which are leased to tenants” (Coulter 1913:878 – see Orser 1988:19). Significant work has been conducted on post-emancipation plantations, both by archae-ologists (e.g., Orser and Nekola 1985) and in other fields. Much of it has looked at settlement patterns, but has typically focused on large plantations with many slaves rather than smaller holdings where few slaves were employed. Both existed in Richland County, but the former was far more prevalent in the lower township. On large plantations, prior to emancipation set-tlement patterning consisted of the plantation big house with associated outbuildings and a com-pact village to house slaves. Post emancipation domestic structures were scattered further over the landscape, closer to the fields worked by their occupants. Depending on the way the land was let, these individual domestic structures may have had outbuildings for equipment, etc, or the equipment may have been stored in a central location. These differences may be visible archaeologically. Figure 5 offers pre- and post-emancipation views of a plantation in the Geor-gia Piedmont. More recent work on post-emancipation plantations has focused on their place in the world economy and on how labor relations are manifested in the kinds of artifacts recovered from tenant sites as well as their spatial arrangement on the landscape (Orser 1988), and on how they were, themselves, transformed from tenant plantations to the mechanized farms that are our primary agricultural producers today. The Upland South—A summary The Upland South concept is traditionally viewed as a set of preadaptive cultural traits that allowed American immigrants of Scots-Irish and German descent to rapidly populate fron-tier areas of the United States in the 50 years following the Revolutionary War (Newton 1974). Put simplistically, certain cultural traits possessed (in part or in whole) by these two cultural groups prior to their arrival in the United States or adopted shortly after arrival gave them an adaptive advantage over other cultural groups when it came to colonizing frontier areas of the country. Scots-Irish and German settlers who would eventually come to embody the Upland South initially occupied a “cultural hearth” that encompassed an area running along the Appala-chian front from Lancaster, Pennsylvania to Augusta, GA. This was the backcountry or Up-country of the colonial era, and it was during this timeframe – the 50 years leading up to the Revolution -- that many of the preadaptations to life on the frontier either were brought together or formed syncretically. These were enumerated by Newton (1974:152) and are summarized (and in several cases combined) below:
• Dispersed rural settlement incorporating kin-structured dispersed "hamlets" and

10
Introduction
dispersed central place functions • Generalized and productive stockman-farmer-hunter economy with the flexibility
to adjust to new markets • Log construction utilizing modular pen and crib designs • Evangelical Protestantism combined with anti-Federalism • An open class system allowing social movement through personal attainment • A County system of government utilizing courthouse towns
Following the Revolution there was a rapid dispersal of the Upland South cultural tradi-
tion from its hearth centered about the Carolina Piedmont and the Shenandoah Valley. Some eastward expansion occurred, but by far the dominant direction of travel was westward. By 1825 this tide of frontier immigration covered virtually all of the eastern woodlands south of the Great Lakes, and was lapping at the great plains where its impetus was expended, if only tem-porarily, by the different adaptive requirements of that environment (Figure 6).
Geographical Scope
Newton (1974) makes the case that following its rapid dispersal the Upland South adap-tation became characterized by cultural “relics”, or areas separated by large distances that ap-pear to contain similar cultural landscapes. He uses the term in a way similar to the “relict” of ecologists whereby an ecosystem that was once widespread geographically now occurs only in
Figure 5. Schematic of pre– and post-emancipation plantation settlement pattern (from Prunty 1955:471).

11
Introduction
isolated pockets. The mechanism for such discontinuous, or insular, distributions from an eco-logical perspective is the disruption of habitat in intervening areas, but from a cultural perspec-tive Newton points to “similar effective remoteness in terms of technical systems developed since settlement” (Newton 1974:144, emphasis in the original). In other words, in areas where new technologies are not effective for whatever reason, they will not be adopted, and old cul-tural patterns will be retained. The primary technology that transformed the South Carolina landscape prior to the 20th century was the cotton gin, which allowed the spread of large-scale cotton agrictulture and the plantation system, described previously, that accompanied it to ex-tend rapidly into the Piedmont and beyond. Thus, the geographical scope of the Plantation tra-dition is broad and continuous. Although it was initiated in the coastal plain, it was carried inland with the advent of the cotton gin and the opening of new land in the Piedmont to profit-able cotton production. Whether and how there was variation brought about by topographical differences between these two areas is open for debate (Messick et al. 2001), but that cotton agriculture spread broadly and thoroughly into the Piedmont during the 19th century is not.
Figure 6. Map of Upland South hearth area and migration (from Newton 1974:149).

12
Introduction
The soils in the sandhills, in contrast to the Piedmont proper, are poorly suited for cot-ton, and thus the area was left behind by the technological innovation that was the cotton gin, leaving an Upland South tradition in place. DeBow’s review says “the inhabitants [of the san-dhills] for the most part are the most wretchedly inert, and therefore continually stinted people to be found anywhere” (1853:622). Likewise, writing in the 1860s, Mary Boykin Chesnut re-fers to the residents of the Fort Jackson area as “sandhill tackeys.” Their Scots-Irish descent is alluded to when she points out that the 30 sandhills men serving with a local militia group in Richmond “are not exactly descendants of the Scotch Hay who fought the Danes with his plow share, or the oxen’s yoke, or anything that could hit hard and come handy” (Chesnut 1949:54). In the notes to the 1949 edition edited by Ben Ames Williams they are described as “men, poor by comparison with the planters, who owned or lived on small farms, where the soil was usu-ally unfruitful, in the low rolling hills between Camden and Columbia” (Chesnut 1949:54 n).
Smith (2008) refers to these Upland South relicts, perhaps erroneously, as “interior fron-
tiers”, but accurately describes them as “places within the core created as a result of a landscape isolated by geography, resources, and culture.” They contain poor farmland, but were well suited, indeed attractive, to the Upland South individualist, “an independent small farm owner/operator who relied on traditional solutions to everyday problems which affected their eco-nomic, social, and settlement systems” (Smith et al. 1982:9). Upland South relicts can thus be expected to occur, in one form or another, across the entire broad region depicted in Figure 6. Smith (2008) for example, argues that both Fort Polk, LA and Fort Leonard Wood, MO could be characterized as relict Upland South geographic areas prior to the acquisition of the land by the US Government. This raises the interesting possibility that relicts characterize many mili-tary bases in the Southeast, formed as they often were of agriculturally unproductive (and thus cheap) land.
All this is not to say that where relict Upland South adaptations continued to ex-
ist they were identical. Although relict areas can, in one sense, be viewed as cultural backwa-ters, it is likely that their inhabitants continued to change in the face of the conditions in which they found themselves. On what would become Fort Leonard Wood, for example, Smith notes that Upland South farmers cut and sold railroad ties for cash when they required goods that could not be acquired through more traditional means. On Fort Jackson there are indications that produce transported to Columbia for sale may have served a similar purpose.
Report Organization
This report is organized into five sections. Following this introduction in which the main themes of the report are established, a section that provides a historical sketch of the pro-ject area is presented. The historical sketch focuses, to the extent possible, specifically on Lower Richland County and the center township. It is constrained by a lack of data, due in part to the focus of previous county historians on Columbia proper, to the detriment of rural areas, and additionally on simple absence: many of the data sources useful in other counties are sim-ply not extant for Richland County. It is worth noting that, with regards to a full coverage of rural Richland County, this document is in some sense a companion piece to the work of Trinkley et al.. (2006). Their report on data recovery work at 38RD1249, 38RD1260 and

13
Introduction
38RD1262 focuses on the upper township, which is not a focus of the present work. Addition-ally, they sketch in the broader historic trends that effected rural residents of Richland County to a greater extent than is attempted here. Beyond more traditional historical references, readers are encouraged to examine Trinkley et al’s work to gain a more complete sense of Richland County as a whole as well as of the upper part of the county. Following the historic sketch, the present report contains a section that contrasts the systems of land tenure and agriculture in the lower and center townships. Despite the fact that these two parts of the county are adjacent to one another, it is clear that very different economies were in place. These likely arose due to physiographic differences between the upper coastal plain and the sandhills as detailed earlier, but they also reflect differing social systems as well. The final primary section of this report examines how archaeologists have approached late 19th to early 20th century farms. The rela-tive absence of traditional historic data in the form of documents available for rural Richland County means archaeology is one of the only ways that a fuller understanding of the lives of people who lived in the county can be gained. It is therefore important from the outset to clearly present the avenues towards recovering significant archaeological data, and constraints this data may hold. This section attempts to do that. A final section of this report is concluding remarks. The intent is to sharpen the focus on research areas and questions touched upon herein by reiterating main points from previous sections of the report.

Historical Sketch
HISTORICAL SKETCH OF POST-EMANCIPATION RICHLAND COUNTY Understanding the history of Richland County has proven difficult. No real comprehen-
sive local history exists. Historians have chosen to focus much of their research effort on Co-lumbia, while the rural parts of the county have been included almost as an afterthought. The most definitive work, that of Moore (1993), is illustrative. Even his title — Columbia and Richland County: A South Carolina Community, 1740-1990 — conflates county and city by its use of the word community. Greater Richland County, while certainly sensitive to the goings on in the state capitol it encompassed, cannot be subsumed into a discussion of Columbia. In-stead, because it was a rural area housing a rural population, it is deserving of a history beyond that of its principal city. Unfortunately, the data for such a history have not been developed. Indeed, such data may not exist. According to Trinkley (2006), agricultural liens for Richland County are only available for the period 1870-1876; all agricultural schedules after 1870 have been lost or destroyed,1 leaving only compendiums; and compendiums themselves, consisting as they do of county-wide data, are of limited use given the great deal of physiographic (and thus agricultural) variation seen in Richland County and summarized in the preceding chapter. Given these limitations, the following historical sketch relies heavily on secondary sources who’s primary focus was on things or places other than rural Richland County. Moore (1993), discussed above, is a good example.
From Slavery to Free Labor
In 1860, before the Civil War, Richland County contained 203 farms or plantations cov-ering a total acreage of 269,075 acres. More than 77,000 of those acres were improved, and produced (among other things) 9,946 bales of cotton each weighing 400lbs, and 223,401 bush-els of corn. Value of livestock in the county was $298,332. The median farm size was 100-<500 acres (n=85), followed by 50-<100 acres (n=38), and 20-<50 acres (n=36). Twenty-five farms were 1,000 acres and up, however, while another 16 contained 500-<1,000 acres. Only three farms occupied less than 20 acres of land, and none were smaller than 10 acres. These figures are summarized in Table 1.
The Civil War and its immediate aftermath wrought significant changes to Richland County. Foremost among these from an agricultural perspective was the change in the organi-zation of labor from enslaved to free. This in turn had a radical impact on land tenure, as evi-denced by the 1870 figures also included in Table 1. Not only did the total number of farms in Richland County jump more than 450% to 1138, but farm size was also impacted. By 1870 the median farm size was reduced to 20-<50 acres (n=353), followed by 10-<20 (n=286) acres and 3-<10 acres (n=260) respectively. Less than 10% of farms fell into the previously dominant
1 It is worth noting, however, that despite Trinkley’s claim, the 1880 agricultural schedules for individual enumera-tion districts are available at the South Carolina Department of Archives and History.

15
Historical Sketch
2 The O’Hanlon plantation is identified by Mills (1826) as being just south of Hopkins near the junction of mod-ern Bluff Road and Old Bluff Road.
Table 1. Farm size in Richland County for the years 1860 and 1870
Farm size in Richland County
Acreage <3 3-<10 10-<20 20-<50 50-
<100 100-<500
500-<1,000
1,000 and up TOTAL
1860 Number 0 0 3 36 38 85 16 25 203
Percentage 0.00% 0.00% 1.48%
17.73%
18.72%
41.87% 7.88% 12.32%
100.00%
1870 Number 2 260 286 353 117 110 7 3 1138
Percentage 0.18%
22.85%
25.13%
31.02%
10.28% 9.67% 0.62% 0.26%
100.00%
100-<500 acre range, while larger farms actually became even more uncommon despite the overall increase in farm numbers. Production, on the other hand, decreased: only 121,495 bushels of corn and 5,453 bales of cotton were produced. This parallels a decrease in the amount of improved farmland in the county of 35% to 56,797 acres. Unimproved woodland totaled 127,579 acres while ruinate land totaled 51,345 acres.
The rapid rise in the number of farms, not only in Richland County but throughout South Carolina, reflects a strong desire on the part of ex slaves to own land and be self-sufficient. This they equated with freedom, a concept that was embodied in the promise of “forty acres and a mule”. Within particularly lower Richland County, the shift from plantations to small farms was even more pronounced than it was in most areas of the state. In 1866 the Freedmen’s Bureau estimated that more than 10,000 individuals within Richland County were destitute, constituting maybe half the county population. The bulk of these individuals were in Lower Richland, particularly near Hopkins where “hundreds of helpless freemen and their fami-lies had gathered on what were known as ‘government’ plantations” (Moore 1993:217). Par-tially in response, state government set up the South Carolina Land Commission in 1869. The purpose of the commission was to redistribute land to benefit newly freed slaves (Bleser 1969), and South Carolina was the only state to attempt such an effort. Although in general the experi-ment was a failure, significant acreage was redistributed in certain parts of the state. This oc-curred mostly on the coast, but Richland County was an exception: nearly 10,000 acres were successfully transferred to small-holders by the early 1870s, making it number 3 on the list of redistributed acreage after Charleston County and Colleton County (Figure 7). All of this land was in Lower Richland County. Bleser (1969:162) indicates that 108 individuals held deeds or Certificates of Purchase from the Land Commission in 1872, including 37 for parcels in the “Hopkins” tract and 71 for parcels in the “O’Hanlon” tract.2 Sixty four of these individuals were still in residence as late as 1880, including 54 identified in the 1880 census as black, 7 as mulatto, and 3 as white. Four additional tracts were identified by Nancy Fox in her “Historical Summary of Richland County” (1984). The Hunt section and the Backswamp section totaling about 1,000 acres adjacent to the Congaree Swamp, were never apportioned. The Hickory Hill

16
Historical Sketch
Beaufort
Charleston
Horry
Colleton
Barnwell
Edgefield
York
Sumter
Pickens
Lexington
MarionAbbeville
Williamsburg
Orangeburg
Union
Laurens
Richland
Spartanburg
KershawFairfield
Anderson
Chester
Greenville
Darlington
Clarendon
Georgetown
Chesterfield
Newberry
LancasterMarlboro
100 0 10050 Kilometers
.
South Carolina Land Commission Sales
1870s
CountyLand Commission
Acres
Abbeville 2,742Anderson 645Barnwell 842Beaufort 3,276Charleston 25,502Chester 1,251Chesterfield 6,918Clarendon 615Colleton 12,895Darlington 1,498Edgefield 2,778Fairfield 4,124Georgetown 6,023Greenville 1,766Horry 0Kershaw 6,360Lancaster 1,204Laurens 0Lexington 3,273Marion 6,661Marlboro 800Newberry 1,874Oconee 2,010Orangeburg 1,724Pickens 1,502Richland 9,398Spartanburg 1,972Sumter 454Union 0Williamsburg 2,138York 2,362TOTAL 112,605 More than 15,000
5,000 to 15,000
less than 5,000
Land Commission Acres
Figure 7. South Carolina Land Commission sales by County (After Bleser 1969:167).
tract southeast of Eastover and containing 41 parcels, and the Adams tract containing 8 parcels apparently were, however. The latter is located north of Cedar Creek on the railroad tracks be-tween Hopkins and Gadsden (see below) while Hickory Hill Road is located on the east side of Griffins Creek between Eastover and Wateree (Figure 8).
One of the landholders in the Hopkins area was Samuel Barber, a farmer and preacher
according to family lore who was responsible for founding St. Johns Baptist Church near Hop-kins. He and his wife Harriet bought 42.5 acres from the South Carolina Land Commission in Hopkins in 1872, and had paid off their mortgage by 1879. Their original house was a log cabin, which was expanded into a two-room house with a fireplace in the 1880s. Although this structure subsequently burned down, it was replaced and the family remained in residence. Samuel died in 1891 while Harriet outlived him by eight years (in Randle 1999:70).
In contrast, the shift to small scale farming may have been significantly less pronounced in the central part of Richland County, because the area had never supported large-scale farm-ing in the past. The sandhills were never very productive agriculturally, and this would have

17
Historical Sketch
discouraged settlement there, particularly the large-scale plantation agricultural settlement that characterized the lower county. In consequence, there were no large slaveholders either, and thus the post-Civil War African American presence in the sandhills was low. The 1870 census enumerates a total of 1,124 people in the central township, of which just less than half (n=560) were black. In contrast, lower Richland had a total population of 7,994, of which 6,755 were of African descent. These figures do not clearly define the boundaries of the lower or central township, however. The 1880 returns for individual enumeration districts were examined for this project, and they present a somewhat different picture, at least in terms of total population. At first glance, there may have been more parity than the figures offered by the 1870 census imply. Enumeration district 158 was the southern of two such districts within the center town-ship. It was bounded by Camden Road to the north, the Wateree River to the east, Garners Ferry Road (“Road to Statesboro” on Figure 8) to the south, and Columbia to the west. This
Figure 8. Richland County in 1873 (South Carolininanna Library).

18
Historical Sketch
represents the southern portion of modern Fort Jackson. Enumeration district 158 had a total population of 2,286 in 1880. In the lower township, enumeration district 169 represents the center of three such districts that together formed the township. It was bounded to the north by Garners Ferry Road, to the east by Tom’s Creek, to the south by the Congaree River, and to the west by Cedar Creek. This encompasses the area that would later become McEntire Air Base. A total population of 2,214 is enumerated for 1880. Perhaps the apparent total population par-ity between these two districts can be accounted for by reference to area, with the center town-ship enumeration district covering a larger area, but more likely many of those enumerated in district 158 of the center township lived along the Garners Ferry Road corridor where the differ-ences between the two townships would have blurred. It is probable that the population of the center township was significantly lower than that of the lower township, as indicated by the 1870 population figures cited previously. This is an important point to keep in mind when con-sidering the discussion below, as it is very likely that the dichotomy between the two townships would be even more apparent if the northern part of the center township, that part which was not contiguous with the lower township, was included in the discussion.
Very clear differences between the lower and center townships can be seen in the census
data when ethnic background and employment are considered. Within enumeration district 158 in the center township, of the 2,286 persons enumerated, 1,024 were white while 1,262 were of African descent. Within enumeration district 169, however, only 155 whites were enumerated as compared to 2,059 African Americans. In terms of percentages, the center township was about 45% white while the lower township was only about 7% white. It is this fact that pro-vides the most clear initial indication that very different economies were being practiced in the two areas of the county, with that of the center township being more diversified. In the lower township all but 34 persons who had their occupations listed within enumeration district 169 were farmers or otherwise employed in agriculture. In stark contrast, more than double that number of non-farmers (n=72) lived in the center township’s enumeration district 158. The bulk of these appear to have been involved in the naval stores trade. In addition to 43 persons listed as turpentine or still hands, makers, distillers, or overseers, there were 12 people listed as either coopers or stave makers and eight listed as carters or teamsters. All of these individuals tend to appear in groups in the enumeration lists, which indicates the specialized production of naval stores in the center township. It is not too great a leap to think that many, if not most, of the 17 turpentine stills listed in Richland County by the News and Courier in 1885 (Trinkley 2006), were located in the center township. Also listed as occupations for the center township were woodcutters (n=3), sawmill laborers (n=2), and grist millers (n=2). These individuals were no doubt employed at one of Richland County’s 21 grist mills or 12 lumber mills (News and Coureir 1885, in Trinkley 2006). All but one of the former were small, rural operations, while only four of the latter were beyond the Columbia city limits, including one at Killian’s, a rural post office on the border between the center and upper townships. Finally, one each car-penter, railroad hand, wheelwright, blacksmith, and store clerk were enumerated in the southern part of the center township.
In contrast, there were no individuals involved in naval stores production in the lower
township. Instead there was a shift towards jobs in the retail business as well as transportation.

19
Historical Sketch
Five people were listed as store clerks and four as merchants, while 12 were listed as railroad hands, one as a railroad agent, and one as an “engineer”, presumably a railroad engineer. Addi-tonal employment in the lower township included ministers or preachers (n=5), blacksmith or farrier (n=3), and one each wheel wright, carpenter and physician.
In the decades following reconstruction more than 20,000 blacks left South Carolina in search of better economic opportunities. Prior to about 1900 much of this outmigration was westward in search of agricultural opportunities, but with the dawn of the 20th century prospects in northern cities began to take a front seat, particularly during peri-ods of war time. World War I, for exam-ple saw an increase in Pennsylvania’s black population of more than 90,000, and more than 73,000 in Illinois. Like-wise, Michigan counted about 17,000 black citizens prior to the war and more than 60,000 afterwards (Randle 1999:117). While certainly a great deal of this population shift was due to “pull” from outside areas, there was a great deal of “push” as well. Black South Carolinians were not migrating simply to access better opportunities, but to escape an oppressive and sometimes even dan-gerously fatal political regime at home. As Lisa Randle (1999:118) quotes The State newspaper, “If you thought you might be lynched by mistake would you remain in South Carolina?” Add to this the ever-worsening prospect of cotton, particularly with the coming of the boll weevil, and it is no wonder that so many black South Carolinians sought greener pas-tures. Table 2 presents population figures for rural Richland County from 1890 to 1930,3 while Figure 9 tracks the steady decline of African Americans as a proportion of the total population in the county for the same time period.
The problem faced by blacks in Richland County after reconstruction ended in 1877 was that, as described in the subsequent section, when whites returned to government following the ouster of the (black) Republican party with the election of Wade Hampton, they sought, if not a return to chattel slavery at least a move towards wage slavery that left labor nearly as disadvan-taged. Additionally, however, politics were increasingly used to disenfranchise black voters and segregate the races in the state. The Black Codes curtailed many rights and freedoms of
Table 2. Richland County population in 10 year increments (after Randle 1999:120).
Year Total population African American population
1890 21,465 16,095 1900 24,481 18,212 1910 28,824 17,987 1920 40,600 22,044 1930 36,066 18,608
Figure 9. Relative presence of African Americans in rural Richland County, 1890-1930 (after Randle 1999:120).
0%
10%
20%
30%
40%
50%
60%
70%
80%
1890 1900 1910 1920 1930
Year
Perc
enta
ge o
f tot
al p
opul
atio
n
3 Randle (1999) presents population figures for Richland County as a whole, and for the City of Columbia. The figures presented herein subtract one from the other to arrive at rural population figures.

20
Historical Sketch
South Carolina’s African American population, and the Constitutional Convention of 1895 es-sentially barred them from the political process altogether. Effectively disenfranchised and forced through circumstance if not through law into wage servitude, it is no wonder that African Americans increasingly elected to leave the state in droves.
It is difficult to track this outmigration within the lower and center townships of Rich-
land County, however. Although the 1880 and 1900 censuses cited earlier used more or less similar, and thus comparable, enumeration districts, the 1920 census is based on school dis-tricts. Richland County school districts are shown in Figures 10 and 11, and it is these districts that were enumerated. For the 1880 and 1900 censuses, I have presented figures for districts that were either north of or south of Garners Ferry Road as this is the traditional boundary be-tween the lower and center townships. For the 1920 census data are presented from Macedonia and Messers school districts as representative of the center township, and Horrell Hill and Bellewood school districts as representative of the lower township. The latter two straddle Gar-ners Ferry Road, but are in closest physical proximity to 38RD314, the site that triggered this context. Bellewood, in fact, encompasses the site. In contrast, Macedonia and Messers are more northerly than the enumeration districts discussed for 1880 and 1900, and thus offer a more representative view of the center township that we have previously seen. Perhaps the most telling statistic, one that has been alluded to but not illustrated with such clarity, relates to the population density in the two areas. A quick glance at Figures 10 and 11 suggests that Messers and Macedonia, combined, are quite a bit larger in area than Horrell Hill and Belle-wood combined, and yet the combined population of Messers and Macedonia in 1920 was only 279 people. In contrast, 908 people lived in the Horrell Hill district and a whopping 1,800 lived in Bellewood. These figures alone show the huge difference between the two townships and help support the 1870 census data presented earlier (see p. 13). More to the point, in 1920 about 17% of the Horrell Hill/Bellewood population was white, up about 10% over the 1880 figure and a good indicator of the African American outmigration from South Carolina. At the same time the Macedonia/Messers districts were 81% white, up from 45% in 1880.
Infrastructural Changes
A second radical shift arising from the transition from enslaved to free labor relates to the organization of the rural county infrastructure. Where before the Civil War social relation-ships occurred within the strict confines of plantation rule and the biological needs of food and shelter were also taken care of within the plantation system, afterwards the thousands of newly freed slaves had no such recourse. In response a series of small, diffuse villages sprang up throughout the county. Particularly in the sandhills of the center township, these conform somewhat to the dispersed, low order, central place or special purpose locations identified by Newton (1974) for the Upland South. The central part of Richland County, currently occupied primarily by Fort Jackson, was a pretty bleak landscape in the latter half of the 19th century. On the 1873 Geological and Agricultural Map of Richland County (Figure 8), everything from Gills Creek and Spears Creek southwards to the Sumter highway is classified as “Poor Land”. It is crossed by the road to Camden, but absolutely no settlement is indicated. Settlement had increased by 1897, but rather than any form of consolidated settlements the area is characterized by dispersed farms (Braswell 1897, Figure 12). Rural Post Offices are indicated at Enon, Mess-

21
Historical Sketch
Figu
re 1
0. P
ortio
n of
191
5 Sc
hool
Dis
trict
map
of R
ichl
and
Cou
nty
show
ing
the
area
of t
he c
ente
r tow
nshi
p.

22
Historical Sketch
Figu
re 1
1. P
ortio
n of
191
5 Sc
hool
Dis
trict
map
of R
ichl
and
Cou
nty
show
ing
the
area
of t
he lo
wer
tow
nshi
p.

23
Historical Sketch
ers, Lucius, and Spears, and while these may have attracted some increased settlement to their immediate environs, this is not indicated on the available maps.
In contrast, in Lower Richland County the primary driver of settlement was the railroad.
The first railroad to reach Richland County was the Louisville, Cincinnati, and Charleston Rail-road (later the South Carolina Railroad and currently the Norfolk Southern) in the early 1840s, which crossed the Congaree River just up from its confluence with the Wateree and then trav-ersed Lower Richland County to Columbia. Shortly thereafter a branch was constructed from Kingville across the Wateree to Camden. During the closing weeks of the Civil War much of these lines (and most others in the state) were destroyed. By the beginning 1866 the line to Co-lumbia was restored, however, though the branch to Camden took longer as rails were taken up from this section to use in the effort to re-establish the Columbia line. The Camden branch was re-opened by the middle of 1867. In 1871 a new line, running direct from Columbia to Sumter in neighboring Sumter County, was also built across Lower Richland. This was the Wilming-ton, Columbia, and Augusta Railroad, and is currently CSX (Ford 1986).
It is these lines that drove the establishment of rural settlement in Lower Richland County. By the 1870s rural population centers had sprung up at Simms, Grovewood, Woodard, and Acton along the Wilmington, Columbia, and Augusta Railroad, at Hopkins, Gadsden, Ad-ams, and Kingville along the main South Carolina Railroad line to Columbia, and at Clarkson’s and Wateree along the branch to Camden (Stoeber 1873). These typically initiated as turnouts along the rail line, and while some never made it beyond being rural “villages”, others were more officially recognized by virtue of the fact that they became rural Post Offices.4 Only one, Eastover, was ever incorporated (in 1880, and only the second incorporated town in Richland County after Columbia itself). Its incorporation is indicative of the number of small-scale free-holders in this portion of the county. All the rural villages played important roles, however, particularly economically. Not only were they the locations of gins for processing cotton, but of the merchants from which farmers bought their supplies. Moore (1993:477-479) reproduces a list of the principle businessmen and farmer for each of these villages from 1879 and 1880, omitting (but mentioning) Grovewood and Wateree as these were post offices rather than vil-lages, and not mentioning Simms or Woodward at all. By 1897 rural villages occurred at Hop-kins, Gadsden, Kingville, Clarkson’s Station, Grovewood, Eastover and Acton, all of which were on the rail lines, typically where they crossed a road (Braswell 1897, Figure 13). An addi-tional settlement, occupied primarily by African Americans and called Brooklyn, was purport-edly on the Wateree River, but its location is not shown on maps (Randle 1999:69).
In addition to rural population centers and villages, another mechanism by which self-
supporting communities were created was the church. Within a year of the end of the Civil War freed African Americans in Richland County were already abandoning the white churches with which they’d been affiliated during the Antebellum period, and founding churches of their own. Again, this was a predominant factor in Lower Richland County and significantly less so for the
4 Hopkins, Gadsden and Clarkson’s are all listed as PO’s on the 1873 Geological and Agricultural map of Rich-land County (Figure 8).

24
Historical Sketch
Figu
re 1
2. D
etai
l of 1
897
Map
of R
ichl
and
Cou
nty,
Sou
th C
arol
ina
show
ing
the
cent
er to
wns
hip.

25
Historical Sketch
Figu
re 1
3. D
etai
l of 1
897
Map
of R
ichl
and
Cou
nty,
Sou
th C
arol
ina
show
ing
the
low
er to
wns
hip.

26
Historical Sketch
center township where the African American population density was low. The fate of Beulah Baptist Church, founded near modern Horrell Hill in the first decade of the 19th century, is em-blematic of the genesis of many of the new black churches. Shiloh Baptist split from Beulah Baptist when 40 black members withdrew on May 14, 1866. In December 1867 an additional 565 African Americans split to form New Light Beulah Baptist Church, leaving just 11 mem-bers, all white, of the original Beulah congregation. That these splits were, at least initially, amicable is evidenced by the fact that the two congregations, black and white, shared the sanc-tuary, each worshipping on alternate Sundays. This arrangement continued until 1870 when the white congregation dispersed. Tensions quickly arose, however, over disputes about ownership of the sanctuary. As a result of this as well as the fact that many parishioners traveled quite a distance to worship, more than half of the New Light Beulah membership split off in 1871 to form the Zion Benevolent Baptist Church in Hopkins. In 1873 there was again a split and Zion Pilgrim was formed by yet other New Light Beulah members. And in 1881 St. James Baptist Church was also formed by former parishioners from New Light Beulah. By this time New Light Beulah could boast a membership of 424, and a Sunday School with 120 pupils, 120 books, and 4 teachers while the original church, Beulah Baptist, had spawned five new congre-gations (http://sciway3.net/clark/richland/newlightbeulah.html, 1 Nov 2007).
By the close of the 1880s there were 18 black churches in lower Richland County
(Moore 1993), while on the 1897 map of Richland County a total of 21 church buildings are identified in the same area (Figure 13). Contrast this with the center township (Figure 12), where only four church buildings are identified on the same map. In terms of density, in the center township there was one church for every 66.5 square miles while in the lower township there was one church every 11.4 square miles. It is important to keep in mind, however, that a single church building could serve more than one congregation, and that indeed this may not have been at all uncommon.
Churches performed multiple functions within the community. Margaret Sloan Court-
ney,5 writing of growing up in Horrell Hill along Garners Ferry Road in the first half of the 20th century, notes that
Through worship services, Sunday School classes, mission groups and training groups, we were provided wonderful opportunities for spiritual development. Through the churches, we also enjoyed social activities and gatherings which would not have been available otherwise (Courtney 2005:13)
Courtney was writing of her experience as a white, but similar sentiments were prevalent among the black population as well. As stated by historian George Brown Tindal (1952:282):
For great numbers of the race, especially in the rural areas, the center of social activity was the church, the most universal and highly organized of Negro institu-
5 It is worth noting that Margaret Sloan Courtney was a direct descendant of the likely owner of site 38RD314, John Alton Reese II.

27
Historical Sketch
tions…. Picnics, sponsored by churches and other organizations, attracted Ne-groes by the hundred during the summer months (in Randle 1999:148).
By 1916 a full 74% of Richland County residents over the age of 10 were church goers. By far the largest denomination in the county were the Baptists with 12,479 black members and 3,405 whites, followed by Methodism with 5,423 whites and 3,878 blacks. Other denominations paled in comparison, none having more than 1,600 members. These included in descending order Lutherans, Episcopalians, Presbyterians, and Catholics (Moore 1993:329-330). Given the isolation of rural South Carolinians in the late 19th and on into the early 20th century from the broader trends of the state and country, it is not surprising that churches per-formed multiple roles. Although the railroad made overland travel within South Carolina rapid and convenient, it was clearly limited by where the rail lines went. And though they went through Lower Richland County, this may actually have had a negative overall effect on local travel because it encouraged the local government to ignore road maintenance. Within Colum-bia, from the railway station one could access anywhere in town via buggy or streetcar, but resi-dents complained that it was impossible to cross the street on foot. The rural transportation sys-tem was in an equally deplorable condition. County residents were required to provide labor on an annual basis, but this practice was reminiscent of slavery to many and was resented as a re-sult. They balked, and maintenance projects accomplished little. During wet weather county roads were often impassable, and even during dry periods they were likely nearly intolerable. These conditions were not confined to Richland County. By the 1880s farmers across South Carolina were complaining of the impact these conditions had on their ability to get their crop to market. They were joined by a new class of urban resident, the bicyclist who wanted better roads for their recreational pursuit. Between these two user groups enough outcry was raised that in 1895 county officials disclosed plans to construct macadam roads throughout the county. However, the limited vision of these officials is apparent in that roads within 5 miles of Colum-bia would be 20 feet wide while those further from the capitol would be narrower. Thus, while they would promote travel to Columbia from within Richland County, they would be of lesser use for travels elsewhere either within or beyond the county borders. This myopic vision con-tinued through at least 1911. By then automobiles were just beginning to be seen on city streets and county roads, and plans were made to macadamize roads to a width of 30 feet within 10 miles of the city but only to a width of 26 feet elsewhere (Moore 1993). In 1907 Margaret Sloan Courtney’s family bought a car for shopping excursions into Columbia from Horrell Hill, but it was not until 1921-22 that their route along Garners Ferry Road was paved (Courtney 2005). At the 1923 opening of the bridge on Garners Ferry Road over the Wateree River, some 10,000 were in attendance, attesting the importance county residents attached to local transpor-tation.
Like churches, schools blossomed in the years following the Civil War. Next to land, an education was a clear path to the promised freedom offered by emancipation, and the African American population of South Carolina and Richland County embraced it. Additionally, like churches, schools also provided social outlets for otherwise isolated farming families. That schools were also located on the 1897 map of Richland county is testament to their importance

28
Historical Sketch
in society. Moore (1993) offers the example of the Horrell Hill school, which at the turn of the 20th century also housed the local Woodmen of the World camp and the Horrell Hill Literary Society. Rural schools “both black and white, became a prime focus of local life sand, since they touched virtually every household, were, in a sense, rivals of both church and Sunday School” (Moore 1993:354).
Prior to the Civil War most of the educational opportunities were provided by private
academies, and were of course prohibited to enslaved African Americans. While private acad-emies continued to play a significant role in the post-war years, particularly for prosperous whites, this was the time that public schooling came into its own. The importance attached to education is reflected in the activities of the Freedmen’s Bureau. Initially concerned primarily with providing welfare to destitute African Americans as they made the transition from en-slaved to free, from 1869 to 1872 the Freedmen’s Bureau concentrated its efforts on providing educational opportunities. Their efforts were supplemented by new state-run programs directed towards public education. Largely as a result of these efforts, between the end of the Civil War and 1883 approximately 56 schools were established in Richland County, only 30 of which were owned by the school districts.
In 1880 the municipal schools became a separate district from the rest of Richland
County. Prior to that, County disbursements and enrollments are inclusive of Columbia. In the academic year running from 1874-1875, Richland County spent nearly $17,000 on education, a figure that accounted for not quite half of all expended funds, with the rest being made up via poll taxes and local levies. This funding combination, unstable though it may have been, was fairly standard for the day. It allowed the operation of 43 schools in Richland County, and af-forded 2,228 pupils education, including 545 whites and 1,683 blacks. The county population of school-age youths at the time, however, was 6,550; only 34% took advantage of public edu-cational opportunities. By 1883 public school enrollment in the City and County combined had risen to 980 white students and 2,728 blacks. Keeping in mind the presence of many private academies, the prevalence of African American students in public schools may be misleading. Also of interest is the fact that, at least early on, schools were not necessarily segregated by race. In 1869-1870 fully 20% of the schools in Richland County were integrated. Specific to the lower part of the county, one of these was located in Gadsden. The school employed three teachers, and was owned by blacks.
Fifteen schools are identified on the 1897 map in center township (Figure 12): Cranan
and Dent just outside the Columbia city limits; Jackson Creek and Fairmont on Two Notch Road; Sassafrass along Sassafrass Branch; Macedonia, Portee and Spears Creek between Spears Creek and Wire Road; Mt. Pleasant between Wire Road and Ancrums Ferry Road; Hiawatha on Ancrums Ferry Road; Cool Springs and Toms Creek between the old Winsboro Road and Colo-nels Creek; and Germantown, Zion Hills and Shady Grove along McCord’s Ferry Road north of Colonels Creek. In the lower township an additional 29 schools are indicated (Figure 13): Mill Creek, Mill Creek (there are two schools of this name), St. James, Bellewood, 19 Mile, An-tioch, and Gum Spring along Garners Ferry Road; Beulah, Hook, Ray, Palmetto, Highlands, and Holly Hall north of the Atlantic Coast Railroad line; Grovewood, Red Hill, Gaffney, Stony

29
Historical Sketch
Hill, Pea Ridge, St. Phillips, Crossroads, Dry Branch, and Adams Cut between the Atlantic Coast line and the Southern line; two unnamed schools in Hopkins; and Reedy Point, Raleigh Chapel, Flat Lake and Pine Bluff between the rail lines and the Congaree River.
By 1915 a total of 82 schools are indicated in the 29 Richland County school districts
beyond the Columbia city limits on the County Board of Education map. Figure 10 and 11 show the center and lower townships respectively. In the center township there are 24 schools. These include Canan, Gills Creek, Buffalo, Veal Chapel, St. James, Cools Spring, Zion Hill, and Egypt Hill, all for blacks, and Holly Hill, Spears Creek, Macedonia, St. Mark, Clarkson, Messers, Shady Grove, Mt. Pleasant, Brown Chapel, Union, Leesburg, Germantown, Piney Grove, Gum Springs, Toms Creek and High Hill. Four of the latter are indicated with smaller symbols than the rest, but the significance of this is not made clear. Within the lower township a total of 33 schools are indicated. Black schools include Mill Creek, Brevard, Friendship, Beu-lah, Arthur, Rock Hill, Flat Lake, Pinewood, Reeves, Weston, Mt. Moriah, Crossroads, Conga-ree, and Montgomery. White schools include Lykesland, Horrel Hill, Bethel, two schools in Hopkins, another Weston, Bellewood, Gadsden, Ray, McCray, two schools in Eastover, St. Phillips, Wateree, Goodwill, Mt. Nebo, Red Hill, Mt. Holly, and Gallman, the last four named and one of the Eastover schools being indicated with smaller symbols. Summary This section of the report has presented certain classes of historic data as they pertain to Lower Richland County and the center township. The intent has not been to fully address broader trends in South Carolina or the US as a whole, as this sort of analysis is readily avail-able elsewhere in the literature. For a discussion of South Carolina, Walter Edgar’s South Carolina, A History (1998) offers an extraordinarily detailed look at the state; for discussion specific to Richland County Trinkley et al. (2006) provide the best available view of how the county was impacted by goings-on elsewhere in the state during the late 19th and early 20th century. Herein the focus has been on background information about the study area. While much of the data do not have direct application to questions of farming and farms, they do speak to the world that farmers and their families lived in and inform us of their day-to-day lives. In conjunction with the following section discussing agriculture and land tenure in the study area, the historic sketch provides one important facet of an overall historic context.

Agriculture and Land Tenure
AGRICULTURE AND LAND TENURE IN RICHLAND COUNTY
The preceding chapter provided a backdrop to life in Richland County in the late 19th and early 20th century. This life was fairly isolated due to poor transportation infrastructure, and centered largely on social opportunities offered by churches and schools. The business of Richland County, however, was agriculture, and particularly the production of cotton and to a somewhat lesser extent corn. This section discusses agriculture and land tenure in the county. If one measure of productivity is the amount of infrastructure supporting agriculture, then Rich-land County compared poorly with its neighbors. Citing the News and Courier (1885), Trinkley (2006) notes that there were only 31 cotton gins in Richland County in the mid-1880s. Contrast this with the 49 in Lexington County, the 300 in Fairfield County, and the 600 in Newberry County, and it seems that Richland County was way behind on the production curve. In 1890 the value of Richland County farm products was $1,080,740, placing it in the bottom quartile statewide. Although the stated value of Richland County farms rose from $2,099,715 to $2,187,220 between 1860 and 1890, when inflation is taken into account the value actually de-clined by about 6% (Trinkley 2006:21). Cotton provided very little profit. It cost about $40 to produce a 500lb bale, and with cotton priced at 9.8 cents per pound in 1880, that came to a net income of $9 per bale. That number continued to decline, and by 1885 cotton was down to 6 cents a pound (Moore 1993) with further declines in the offing. Land Tenure At the beginning of the previous section the radical change in the organization of farm labor was discussed. Prior to the civil war plantation labor was supplied by enslaved African Americans; afterwards the plantation owners sought ways to reify that labor organization through new means. Primary among these became the tenant system of farming. Tenant farms can be thought of as part of a larger plantation landholding, as Prunty did in his seminal work (1955). Here, though, they are looked at as individual holdings. By doing so it becomes possi-ble to examine land tenure in the post-Civil War south, and better understand the limitations and stumbling blocks faced by farmers, both black and white, in the late 19th and early 20th century. Tenancy took three general forms throughout the post-emancipation South, becoming prevalent by about 1880 and continuing as common arrangements into the 1930s. Each of these tenure arrangements implied a different economic position for the tenant family, based on what resources they brought to the relationship. Sharecroppers were lowest on the economic totem pole. A sharecropper would supply the labor, and one half of the fertilizer needed for the crop, while the landlord would supply all other needs. This included a house to live in, agricultural implements, the seed, the remainder of the fertilizer, traction animals and feed, and fuel wood. In exchange, the landlord would get half the crop produced. Problems arose because it was the

31
Agriculture and Land Tenure
landlord who divided the crop, not the tenant. Indeed, it was rare indeed that the tenant every really knew exactly how much had been produced. Share renting was a second common arrangement. Like sharecropping, the crop was divided in the same proportion as the amount of fertilizer used to produce it. A share renter would supply labor, traction animals and their feed, tools, seed, and an agreed upon amount of fertilizer, typically two thirds. The landlord would supply the land and housing as well as the remainder of the fertilizer. At the end of the harvest the crop would be sold and the gross earn-ings divided between the tenant and the landlord. Unlike in the sharecropping arrangement, however, it was the tenant who took the crop to market in the share renting arrangement, giving him far more control of the fruits of his labor. Finally, a cash renter supplied everything needed to produce the crop save the land and housing. Instead of providing part of the crop to the landlord, however, the cash renter paid in cash on a per acre basis, as the name implies. This system is akin to a modern arrangement, and the amount of rent owed to the landlord was set based on a variety of factors that impacted farm efficiency and quality of life. Things like the quality of the soil or the size and condition of the house and farm buildings could all be taken into account. Variations to all these basic systems were practiced on a regular basis, but all kept the land in production through creative arrangements between landowner and labor. Clearly some were of more benefit to one than the other. Under the sharecropping system the tenant had very little power at all. Even if they felt shorted by the landowner come settlement time they had little recourse. The vast majority of tenants were black, and while there was never any signifi-cant Ku Klux Klan activity in the Midlands (Moore 1993) the threat of violence or even lynch-ing was always there. Tenants could also leave the farm, but economic realities made this an unpalatable alternative. Moving up the economic ladder, someone who could afford to be a share renter was in far better shape financially than the sharecropper, and their ability to make a profit — or at least break even — was enhanced. In particular, the fact that share renters took their own crop to market and then settled up with the landlord gave them a tremendous advan-tage over the sharecropper. Finally, the cash renter was at the top of the heap, economically, of all the tenants. This person was just one step away from the ideal of becoming freeholding farmer, which was really the objective. The major obstacle facing a tenant’s dream of owning his own farm was debt. Beyond the risks associated with farming, a risk that at least to some extent was shared with the landlord under the sharecropping and share renting systems, tenants also went into debt through the pur-chasing of supplies on credit. Most purchasing was done at stores owned by the landlord. These stores carried pretty much anything a farming family could need, but as cash was always short most purchasing was done on credit through liens on the crop, to be settled up when the crop came in. Clark (1944) presents a detailed discussion of stores in the south, arguing that they played a crucial role in the development of the New South through their location at the nexus of the local and national economies. Virtually all farmers in the South Carolina midlands were caught up in the credit Catch 22 created by the post-emancipation agricultural system, fac-

32
Agriculture and Land Tenure
ing insurmountable liens and a credit limit that made breaking out of the tenant system nearly impossible. Even farmers who owned their own land were at risk when
[A]ccounts ran hopelessly behind for two or three years with unsettled balances piling up into such considerable sums that lien notes were no longer adequate cov-erage, then a mortgage was placed upon the land and the annual deficit continued piling up until it consumed the full value of the unfortunate debtor’s possessions. The customer ‘assigned’ his land to the merchant, went through the fiction of mak-ing an independent settlement of his account, and then moved away to begin anew as a tenant farmer (Clark 1944:279).
Losing farms to debt may not have been as prevalent in Richland County as in some areas. In 1880 33% of Richland County farms were owner-operated, compared to 35% 40 years later, although average farm size decreased by more than 30 acres during that time frame. It is worth noting that in 1880 Richland County had the lowest percentage of owner operated farms in the state, but that by 1920 it was ranked number 29 in this regard. Production Strategies Although censuses were taken every decade by law, it is the 1880 census that gives the most clear view of the Richland County agricultural system. This is the only census year for which agricultural data from individual enumeration districts were available for this project, so it is the only year that the differences between the lower and center townships can be teased out and highlighted. Some of these differences were indicated in the previous chapter during dis-cussion of ethnic background and employment. Additionally, regional agricultural statistics for South Carolina were summarized by the State Board of Agriculture in 1883 and (as the State Department of Agriculture, Commerce and Immigration) in 1907. These can be compared to the census returns from individual enumeration districts in Richland County, #158 in the center township characterized by the sandhills, and #169 in the lower township with strong similarities to more coastwise areas of the state, as before.
Based on the 1880 census, which used agricultural production statistics from 1879, the 1883 summary indicates that the average sandhills farm contained about 35 tilled acres, 5 acres less than the state average and comparable to the average in enumeration district #158. These numbers are deceiving, however, in that they don’t take into account whether a given farm was owned, rented, or sharecropped. Owned farms in district #158 numbered 99, or 52% of all farms in the district. This is a slightly lower percentage than suggested by the 1883 summary, which lists 60% ownership of sandhills farms in Kershaw and Chesterfield counties, but signifi-cantly higher than enumeration district #169 where only 15% (n=49) of farms were owned by the farmers who worked them. Clearly there were significant differences between the center and lower townships that are not captured by the county-wide statistics. The lower township, with its historically far higher percentage of African American residents, started far behind the center township in terms of farm ownership simply because slaves were not allowed own prop-erty. When emancipation occurred these newly freed families had minimal economic re-sources, and were kept subservient by the agricultural system adopted in the wake of the Civil

33
Agriculture and Land Tenure
War. In contrast, the per-centage of whites in the cen-ter township was far higher at near 45%. These people were in a far better position to own land, and this is re-flected in the census returns.
There were 520 farms
total in the two enumeration districts examined. Most of these were in Lower Rich-land, reflecting both the emancipation of bondsmen, the influx of other freedmen from other parts of the state, and the break up of planta-tions in the immediate post-war years. The average size of a farm at this time was just under 140 acres. Again, however, there is a clear di-chotomy between the center and lower township. Within the latter the average farm size was just 97 acres in the 1880 census, an average that reflects a very high number of small farms. For example, the smallest 10% of the farms in the lower Richland district aver-aged just 10.4 acres apiece. It was also pulled down by the largest farms as well, however, with the largest 10% averaging around 575 acres apiece, a figure that would be even lower if the largest farm in the district, containing nearly 5,000 acres, was omitted. The next largest farm contained only 1,500 acres. In contrast, the 190 farms in the center township averaged approxi-mately 215 acres in size, more than double that of the lower township. Likewise, the smallest 10% of center township farms averaged 18 acres apiece, again significantly larger than their lower township counterparts. Finally, the largest 10% of center township farms were also nearly double that of the same class in the lower township, with an average size of just over 1,000 acres and four farms of over 1,500 acres. Figure 14 presents this information graphically, showing both the very large number of very small farms in the lower township as compared to the center, and the smaller size of the largest farms as well.
The explanation for the dichotomy in land ownership between the two parts of Richland
County is not quite this simple, however. Rented farms in district #169 numbered 271 (85%) while in district #158 they numbered 72 (38%). Sharecropping occurred only in the center
Figure 14. Comparison of farm size in the lower and center townships, 1880.
Farm size in center township, 1880
0
1,000
2,000
3,000
4,000
5,000
Acr
es
Farm size in Lower Richland, 1880
0
1000
2000
3000
4000
5000
Acr
es
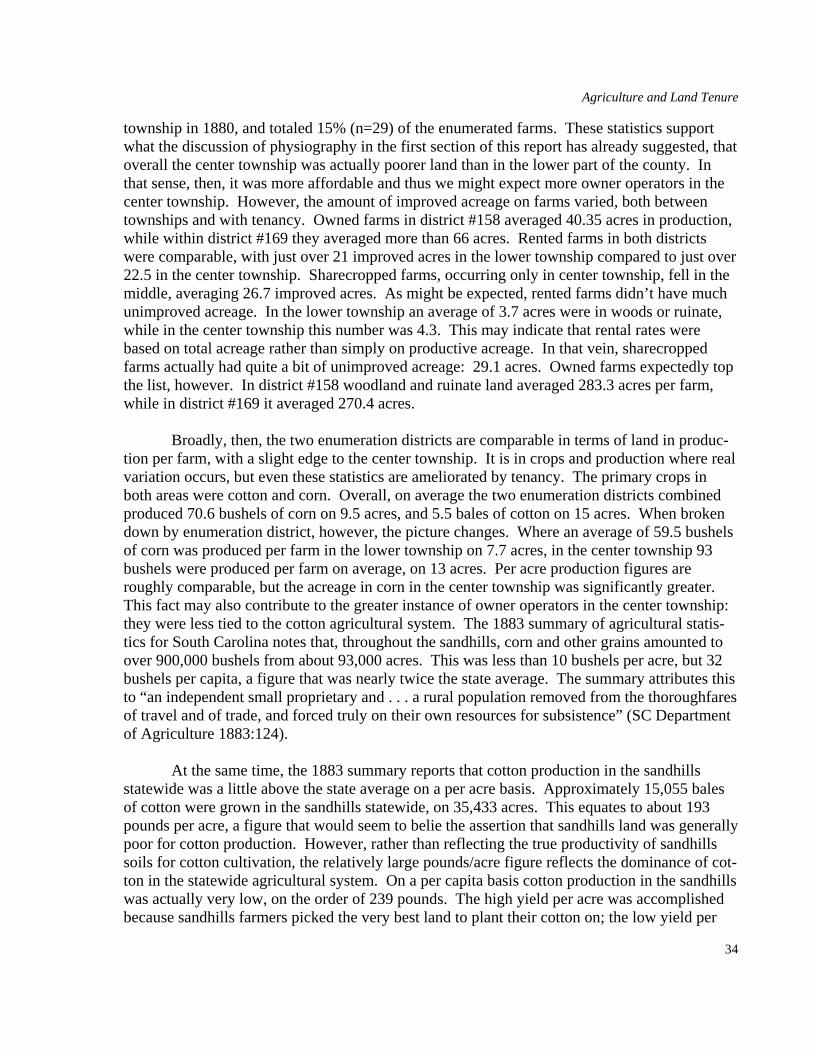
34
Agriculture and Land Tenure
township in 1880, and totaled 15% (n=29) of the enumerated farms. These statistics support what the discussion of physiography in the first section of this report has already suggested, that overall the center township was actually poorer land than in the lower part of the county. In that sense, then, it was more affordable and thus we might expect more owner operators in the center township. However, the amount of improved acreage on farms varied, both between townships and with tenancy. Owned farms in district #158 averaged 40.35 acres in production, while within district #169 they averaged more than 66 acres. Rented farms in both districts were comparable, with just over 21 improved acres in the lower township compared to just over 22.5 in the center township. Sharecropped farms, occurring only in center township, fell in the middle, averaging 26.7 improved acres. As might be expected, rented farms didn’t have much unimproved acreage. In the lower township an average of 3.7 acres were in woods or ruinate, while in the center township this number was 4.3. This may indicate that rental rates were based on total acreage rather than simply on productive acreage. In that vein, sharecropped farms actually had quite a bit of unimproved acreage: 29.1 acres. Owned farms expectedly top the list, however. In district #158 woodland and ruinate land averaged 283.3 acres per farm, while in district #169 it averaged 270.4 acres.
Broadly, then, the two enumeration districts are comparable in terms of land in produc-
tion per farm, with a slight edge to the center township. It is in crops and production where real variation occurs, but even these statistics are ameliorated by tenancy. The primary crops in both areas were cotton and corn. Overall, on average the two enumeration districts combined produced 70.6 bushels of corn on 9.5 acres, and 5.5 bales of cotton on 15 acres. When broken down by enumeration district, however, the picture changes. Where an average of 59.5 bushels of corn was produced per farm in the lower township on 7.7 acres, in the center township 93 bushels were produced per farm on average, on 13 acres. Per acre production figures are roughly comparable, but the acreage in corn in the center township was significantly greater. This fact may also contribute to the greater instance of owner operators in the center township: they were less tied to the cotton agricultural system. The 1883 summary of agricultural statis-tics for South Carolina notes that, throughout the sandhills, corn and other grains amounted to over 900,000 bushels from about 93,000 acres. This was less than 10 bushels per acre, but 32 bushels per capita, a figure that was nearly twice the state average. The summary attributes this to “an independent small proprietary and . . . a rural population removed from the thoroughfares of travel and of trade, and forced truly on their own resources for subsistence” (SC Department of Agriculture 1883:124).
At the same time, the 1883 summary reports that cotton production in the sandhills
statewide was a little above the state average on a per acre basis. Approximately 15,055 bales of cotton were grown in the sandhills statewide, on 35,433 acres. This equates to about 193 pounds per acre, a figure that would seem to belie the assertion that sandhills land was generally poor for cotton production. However, rather than reflecting the true productivity of sandhills soils for cotton cultivation, the relatively large pounds/acre figure reflects the dominance of cot-ton in the statewide agricultural system. On a per capita basis cotton production in the sandhills was actually very low, on the order of 239 pounds. The high yield per acre was accomplished because sandhills farmers picked the very best land to plant their cotton on; the low yield per

35
Agriculture and Land Tenure
capita suggests that this land was very limited in extent (SC Department of Agriculture 1883). In both the center and lower town-ships of Richland county, cotton production amounted to approximately 2.7 bales per acre, with lower town-ship farms averaging about 16.7 acres in production and center township farms aver-aging about 13 acres in pro-duction. However, nearly 60% of the improved land in the lower township that was in production was planted in cotton; in the center township this same statistic is less than 40%.
The relative percent-
ages of land given over to cotton, corn and other crops give some idea of agricul-tural strategies (Figures 15 and 16). In the lower town-ship, although nearly 60% of the improved land was in cotton, there was significant variation between owner operated farms and those of tenants. Where the former had about 44.5% of their land in cotton, renters had a whopping 67.8% in cotton. Clearly this was their cash crop. Whether they viewed the production of cotton as the path to economic independence or were simply doing their best to make the rent is impossible to determine, but some combina-tion thereof seems likely. Renters also had 29.2% of their productive land in corn, leaving only 3% of their land for other crops. Diversity was either not valued or not an option. In contrast, owner operators had about 23.9% of their productive land in corn, leaving 31.6% for other crops. Crop diversity provided them with a buffer in the event the cotton crop failed to produce a profit.
In the center township, the highest percentage of productive land in cotton was likewise
maintained by renters, but the percentage was significantly lower than that for renters in the lower township. Center township renters used about 49.4% of their productive acreage for cot-ton, vs. 41.5% for sharecroppers and only 33.9% for owners. Owner operators also devoted an
Renter production strategies in Lower Richland
Corn
Cotton
Other
Figure 15. Relative percentage of productive acreage devoted to corn, cotton and other crops in the lower township.
Owner operator production strategies in Lower Richland
Corn
Cotton
Other
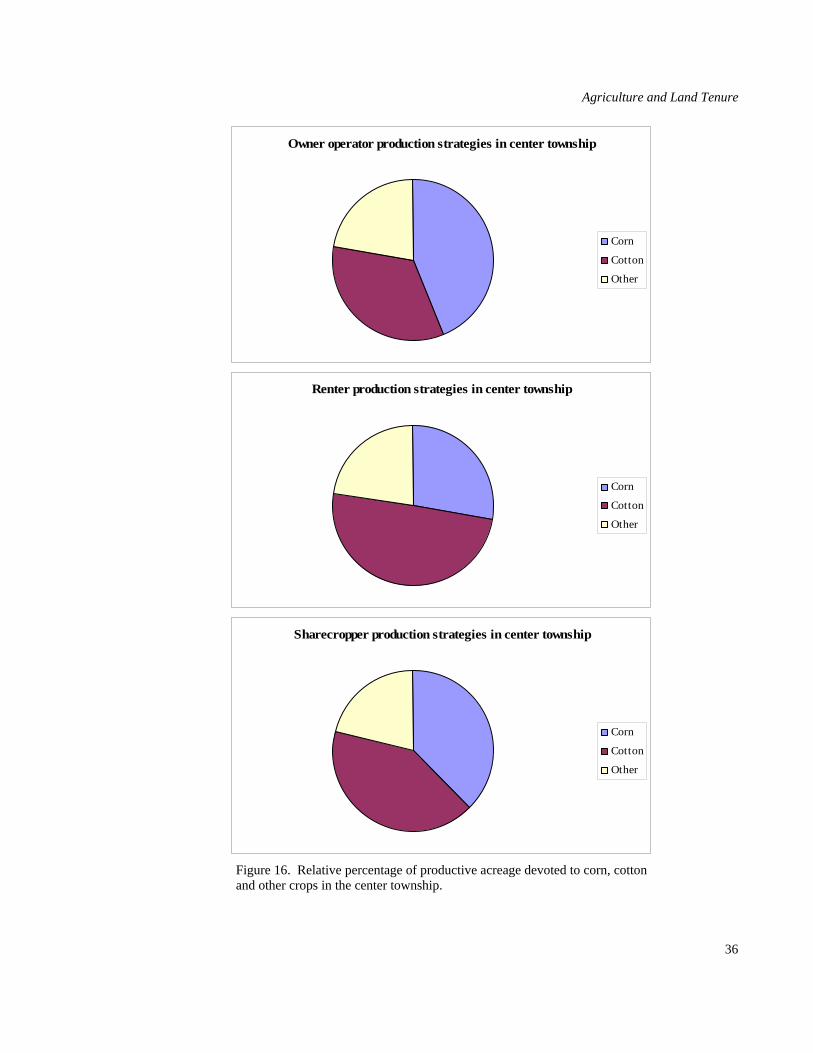
36
Agriculture and Land Tenure
Renter production strategies in center township
Corn
Cotton
Other
Sharecropper production strategies in center township
Corn
Cotton
Other
Owner operator production strategies in center township
Corn
Cotton
Other
Figure 16. Relative percentage of productive acreage devoted to corn, cotton and other crops in the center township.

37
Agriculture and Land Tenure
additional 43.6% of their productive acreage to corn, leaving 22.5% f or other crops. Interest-ingly, this distribution virtually mirrors that of owner operators in the lower township, with the emphasis on different crops effectively reversed. Further, owner operators in the center town-ship placed the lowest emphasis on cotton of any group in the two areas. Of equal interest, the center township owner operator production strategy is nearly duplicated by sharecroppers, who devoted 37.5% of their productive land to corn leaving 21% for other crops. Renters again de-voted the greatest percentage of their acreage to cotton, lending additional credence to the idea that their objective was ensuring the rent was paid. Corn was planted on about 27.7% of pro-ductive renter land, leaving 23.4% for other crops.
Although enumeration data for individual farms is not available after 1880, it is likely
that the patterns already discussed continued well into the 20th century. Figure 17 shows that owner operation was somewhat higher along the fall line than in adjacent areas, possibly a di-rect reflection of the continuing influence of the Upland South economic and social adaptation to the sandhills. It suggests that farm loss may have been ameliorated by the more diversified production of sandhills farms. Enumeration data for populations suggests that the sandhills and the lower township remained very different in terms of their social makeup, and by extension their economic make up as well. For example, slightly greater than 50% of the farms in the center township were owner operated at the beginning of the 20th century, as compared to only about 20% in the lower township. Likewise, the center township was split roughly 50/50 along racial lines while the lower township was about 85% black. Given these figures, it is clear that the two areas of Richland County continued on their separate courses, and that life in the two areas was not directly comparable. Still, the overarching situation was one of poor economic circumstances, if not out and out poverty, for most rural residents of Richland County for an extended time period beginning with the end of the Civil War and extending right through the Great Depression.
Trinkley (2006:24) presents a table summarizing agricultural statistics for Richland
County in the post-bellum years through the beginning of the great depression. Between 1880 and 1930 the number of farms in Richland County increased by about 30%, with the highest number occurring in 1920 when 3,889 farms were enumerated. Sixty-four percent of these were operated by tenants, a number which had held fairly steady but which dropped a decade later to 55%. At the same time, farm values rose precipitously, from an average of $25,720,800 in 1880 to $137,068,550 in 1930. Again the high was in 1920 ($195,323,700). Finally, farm production also rose. For example, 171,040 bushels of corn and 10,973 bales of cotton were produced by Richland County farmers in 1880, while in 1920 those figures were 549,791 bush-els and 26,690 bales respectively. Counter-intuitively, while farm values and farm production were both steadily increasing in the late 19th and on into the early 20th century, farm sizes were falling from a high of 127 acres on average in 1890 to a low of 69 in 1930, a whopping ca. 54% decrease. Edgar (1998) accounts for this seeming contradiction with reference to increasing agricultural intensity, which in turn wore out the land and lead to even greater use of fertilizers. Fertilizer, of course, cost the farmer money, and created yet more debt and increasingly locked tenant farmers into tenancy.

38
Agriculture and Land Tenure
Summary This section has focused primarily on tenancy vs. farm ownership in the two parts of the project area, and on the proportional representation of the crops produced. As has been illustrated throughout this report there are very clear differences between what kinds of farmers lived in the center and lower townships, and what they were producing. Whether there is a link between these two, that is, whether a more equally balanced cropping system results from increased farm ownership or vice versa has not been established, but certainly the center township had more owner-operators than did the lower township, while also having more balance in its production figures. It would be very useful to have agricultural returns from individual enumeration dis-tricts for other years to compare with the 1880 figures present in much the same way the popu-lation returns were addressed earlier in this report, but such is not the case. It seems likely that the owner-operator model remained more common in the sandhills than elsewhere, however, if for no other reason than the land was cheaper and easier to both buy and retain.
Figure 17. Percentage of owner-operated farms in South Carolina by county, 1920.

Archaeological Approaches
ARCHAEOLOGICAL APPROACHES TO LATE 19TH-EARLY 20TH CENTURY AGRCULTURAL SITES
Archaeologists looking at late 19th-early 20th century agricultural sites have taken a va-riety of approaches. The obstacles they face are that these classes of resource is ubiquitous on the landscape, relatively modern, and apparently well documented. Given those obstacles, studying late 19th-early 20th century agricultural sites archaeologically seems rather pointless. What new data can be added that will help us to better understand this class of resource? Fortu-nately, there is quite a bit. Most archaeological projects directed at late historic farmsteads, plantations, and tenant sites have taken a variety of approaches, including settlement patterning, artifacts and artifact patterning, and disposal patterning, all of which have provided not just new, but explanatory data to the body of knowledge . Property Types and Locational Patterns The notion of a farmstead is an important one. As implied above, farmsteads can be conceptualized as separate from tenant sites. They may also be differentiated from plantation sites on a theoretical level, though this distinction becomes blurry on the ground in the postbel-lum era. Before discussing archaeological approaches to agricultural sites, an effort is made here to summarize these property types and their associated locational patterns, in part follow-ing Benson (2006) and Joseph et al. (2004). • Farmstead: Farmsteads consist of the buildings and associated yard areas of a farm. The
principal defining characteristic of a farm is that the labor and management of the farm were conjoined. Farms and farmsteads were family affairs. Farms produced subsistence crops in addition to cash crops, with the former typically taking primacy. The farmstead would be smaller than the core area of a plantation, but larger and more complex than that of a tenant site. Present at a farmstead would be the family home and various outbuildings associated with domestic life and agricultural production. Barns, animal and equipment shelters, wells and privies would all be present.
• Plantation: Plantations and tenant sites are closely related. A traditional definition of plan-
tation has already been presented. It focused on large-scale production for a non-local mar-ket, and also on production by a coerced labor force. Within a plantation the cognate of a farmstead is the plantation core area, containing the main house of the plantation owner as well various support structures. Unlike those of a farmstead, however, the support struc-tures within the plantation core may be on a scale large enough to support the planter fam-ily, the labor force, and an agricultural productive capacity far larger than could be achieved on a typical farm. Thus, not only will the core area of a plantation generally be larger than that of a farmstead, but the structures themselves may also be larger. After emancipation, it is likely that many plantation core areas were gradually transformed into properties more

40
Archaeological Approaches
closely resembling farmsteads as agricultural production changed in the face of a more inde-pendent labor force.
• Tenant site: The tenant site can be viewed as one class of resource within a larger planta-
tion. Unlike the plantation core area or the farmstead, however, tenant sites typically do not contain the full gamut of agricultural support structures. Instead they are more domestically based, depending on the kind of tenancy involved. While wells, privies and domestic struc-tures would be characteristic of tenant sites, barns, equipment storage areas, or shelter for animals may not be present.
The locational patterns associated with plantation core areas and farmsteads are very different from that of a tenant site. Tenant site locations are selected by the landowner, who would not actually live in the house. His primary concern would be making sure that the tenant had access to the fields rather than any more esoteric concerns. Consequently, tenant houses were often located in the midst of agricultural fields, and their locations may have been reincor-portated into the active agricultural fields after abandonment. This was especially true because tenant houses were less well-constructed than would be an owner-occupied house, and thus were more transient on the landscape. They were, in a word, disposable. In contrast, both farmsteads and the core area of plantations were built with an eye that went beyond basic function. Both were more substantial, and are more likely to survive as sig-nificant resources in the archaeological record. The representation of plantation core areas and farmsteads archaeologically, compared to tenant sites, is likely far higher than it would have been when the sites were actively occupied. Both the core area of a plantation and a farmstead also reflected the status of the owner. Their siting, insofar as it created a presence on the land-scape, was also a concern then. This was particularly the case with a plantation, but also to a lesser extent with farmsteads. Further, plantation owners and farmers were also concerned with maximizing production, and were thus less likely to usurp agricultural fields for domestic pur-poses. Instead, access to both fields and the market became important considerations. These three basic property types, the farmstead, the cognate plantation core area, and the tenant house, subsume the vast majority of agricultural sites in the late 19th to early 20th century where a domestic component is present. Iso-lated outbuildings that had no associated domestic occupa-tion may also occur, though with less frequency. Table 3 lists non-domestic structures that may be encountered, either as isolated sites distant from domestic areas, or within farm-steads and/or plantation core areas. The list is derived from Messick et al (2001), who provide a detailed discussion of each structure type. Additionally, there are a number of ar-chaeological features that may also be encountered on agri-cultural sites. Beyond evidence for the actual structures
Table 3. List of non-domestic struc-tures associated with agricultural sites (after Messick et al 2001).
Associated Structures on Agricultural Sites
Barn Smithie
Cane or sorghum mill Cane or sorghum boiler
Carriage house/Garage Chicken coop
Wellhouse Corncrib
Cotton gin Dairy
Dovecote Granary
Greenouse Ice house
Grist/flour mill Sawmill
Outhouse Springhouse
Smokehouse Turpentine still

41
Archaeological Approaches
listed in Table 3, features such as wells, privies, root cellars, hearths associated with a variety of activities such as laundry, rendering or butchering, and various refuse deposits including sheet middens, trash pits, and secondary disposal areas may also be found in and near agricultural sites. The remainder of this section summarizes how archaeologists have looked at late 19th-early 20th century farmsteads, plantation core areas, and tenant sites. Settlement Patterning Early efforts to understand late historic farmsteads and tenant sites built on the previous work by geographer Merle Prunty cited earlier in this report. Prunty (1955) envisioned the post-emancipation plantation as a direct extension of the antebellum plantation. As a result, he did not look at individual domestic structures within a given plantation so much as the planta-tion as a whole, each of which contained a variety of domestic structures including that of the landowner and those of tenants. Additionally, he was able to differentiate “ideal” settlement patterns associated with both sharecroppers and renters, the former indicated by isolated domes-tic structures and the latter by domestic structures in co-occurrence with certain classes of agri-cultural outbuildings. Because sharecroppers provided nothing but labor they did not require easily accessible equipment/tool storage. Instead, farm implements and machinery were stored in outbuildings associated with the landowner’s farmstead. In contrast, renters would provide some or all of the necessary farming equipment depending on their rental arrangement, and thus their farmsteads would include storage facilities. Prunty’s ground-breaking work was taken up enthusiastically by archaeologists, and set-tlement patterning has been a steady feature of tenant archaeology every since. Where Prunty saw two basic patterns of settlement on post-emancipation plantations, Adams and his col-leagues (Adams 1980) ,working at Waverly Plantation in Mississippi, identified five possible patterns, differentiated based on the kind of rental agreement tenants had with landowners. At Bay Springs, Mississippi Smith et al. (1982) applied the upland south concept to a series of farmsteads that were slated for impact by the construction of a dam and reservoir. They found that home site selection generally followed selection factors identified by Keber (1979:198) for western North Carolina. Foremost among them were accessible gravity-flow water, aspect, pro-tection from prevailing winds, road proximity and accessibility, gently sloping ground necessi-tating little preparation for building, and nearby tillable land. Joseph et al. (1991) worked at farmsteads in upstate South Carolina, and noted many similarities to the settlement patterning observed in Mississippi by Smith et al. (1982). At the Finch Farm in Spartanburg County, the main road would have passed right by the house and tillable land was immediately adjacent and reached by a series of farm roads. None of the roads went physically through the domestic yard however, instead providing access to areas more di-rectly associated with farm operation. Unlike the Mississippi and North Carolina examples, however, at Finch Farm the house was located on a slight rise rather than in the lee of a hill or landform for wind protection. This situation provided greater visibility, both of and from the house. The house itself was surrounded by large trees, and it may have been these that provided
42
Archaeological Approaches
some protection from prevailing winds. They served a further purpose in that they, along with other landscaping features, visually and physically separated the domestic yard area from the yard areas associated with agricultural production. These observations generally conform to those made by Linda Worthy (1983) in her report on standing structures encountered during construction of the Richard B. Russell Reservior on the upper Savannah River, and also to ob-servations by Linda France Stine (1989) in her study of early 20th century upland farmsteads in the Piedmont. At Millwood plantation in Abbeville County, South Carolina Orser and Nekola (1985) found that tenant sites there occupied moderately productive soils with a slight slope and a southern aspect. They were within half a kilometer of intermittent water and 0.8-2.4 km from the nearest road or railroad. Their nearest neighbor occurred at about 0.5 km distance as well. These data are based on the 53 tenant sites identified on Millwood plantation in 1932, and were developed by Joseph et al. (2004) in their historic context statement on historical archaeology in Georgia. Joseph et al. (2004, citing Crass and Brooks 1995) also suggest that, although tenant sites tend to be dispersed, there may also have been a tendency towards clustering or organiza-tion along kin lines. A similar tendency is apparent in the Upland South pattern. The Finch Farm research also provides some data on tenancy. Although the Finches were owners, there were two tenant sites on the property studied by the project. One of these was a domestic structure occupied by Will Lynch, who helped operate the Finch Farm as a hired hand. His house was in close proximity to that of the Finches, actually within the agricul-tural yard area, reflecting the fact that he worked closely with the farm owner rather than as a more typical farming renter. Joseph et al. (1991) posit that this proximity may imply some sort of “social supervision” on the part of the Finches, but that it is also possible that Mr. Lynch was more of an unofficial member of the family. A second, more traditional tenant arrangement, the Webb Farm, was also on the property. This was out of sight of the Finch house behind a knoll, at a distance of about 600 feet. Rather than being adjacent to the Webb fields though, this loca-tion may have been selected to give access to farm facilities that were shared between the Webbs and the Finches. Specifically, both a hay barn and blacksmith shop were located nearly equidistantly between the focal areas of the two farmsteads. As each farmstead had its own barns that may have housed livestock, Joseph et al. (1991:162) postulate that there was individ-ual control of production within each farm, but shared use of/responsibility for some of the supporting tasks and structures. At the Bay Springs farmsteads a further settlement consideration was kinship and church affiliation (Smith et al. 1982:213-214). Oral informants on the project indicated that the landscape was generally divided up into “settlements”, but that settlement boundaries did not necessarily conform to natural boundaries, though there was a tendency to do so. Within the Bay Springs project area were two primary ridge lines with a stream separating the two. Settle-ments tended to be linear along the ridgelines though outliers, even on the other side of the creek, were certainly present. Rather than geographical location, individual farmsteads would be included as members of specific settlements based loosely on kinship and church member-ship, the latter suggesting that settlement membership may be identifiable through examination of cemeteries and then cross referenced to land owners. Additionally, schools also tended to be associated with settlements, perhaps due to the fact that education was more a grassroots sort of

43
Archaeological Approaches
effort than we perceive it as today. Regardless, each settlement was represented by a dominant family, which may have had better access to economic resources than their neighbors. Houses were built on relatively high ground adjacent to major transportation corridors, themselves fol-lowing the ridgelines. These provided enhanced access to agricultural support mechanisms such as country stores or cotton gins. In the South Carolina Piedmont, this tendency towards higher ground has a temporal component, with inter-riverine oriented sites becoming more prevalent in the early 20th century than earlier. This may be attributed to increasing population in conjunction with the fact that most of the lower lying ground was already occupied. Further, however, as erosion in the Piedmont increased, sedimentation in lowlands became more prob-lematical, leading to flooding. As Benson (2006:219) notes “Periodic floods are desirable for renewed soil fertility, but frequent and unpredictable floods are more destructive than produc-tive.” Parallel work on more traditional plantations has been less frequent. Orser’s (1982. 1988; Orser and Nekola 1988) work at Millwood plantation provides one example however. On plantations a labor organization intermediate to slavery and tenancy was the squad system. In essence, planters attempted to reinstitute the labor organization they’d utilized during the an-tebellum period by requiring that freedmen sign labor agreements to become share or wage la-borers, typically the former. These laborers worked in groups in the same fields they would have worked under slavery, with supervision provided by the planter or an overseer. Initially the extant slave villages from prior to emancipation would have housed these laborers. As pro-ductivity of the immediately surrounding acreage waned groupings of domestic structures in outlying areas of the plantation property would have been constructed and occupied to access land that was not yet worked out. This process of dispersal likely began within about 10 years (Joseph et al. 2004). Each grouping of domestic structures would house the families who made up an individual squad, and would be located close to the land being worked by the squad. The freedmen quite naturally rebelled against this system, complaining that it was very like the slav-ery they’d just been freed from. They wanted more independence, and the more traditional ten-ant arrangement was the result. Within the tenant system individual domestic sites would be scattered about the plantation landscape, each housing a family that worked the surrounding land either for shares or through rental. Share cropper and renter housing would vary as well, as Prunty (1955) pointed out. Where sharecroppers brought virtually nothing to the agricultural table but their labor, share renters brought labor and some of the necessary farm equipment while cash renters typically provided everything required to plant, tend and bring in the crop. In each case the associated archaeological site would look different, spanning the gamut from a domestic structure with associated domestic outbuildings and activity areas in the case of the sharecropper where all agricultural equipment and supplies were maintained by the landlord, to a full-fledged working farmstead in the case of the cash renter, the latter being possibly difficult to differentiate from the farmstead occupied by its owner. In the middle the share renter would have outbuildings for some, but by no means all, farm equipment.
44
Archaeological Approaches
Regardless of tenancy, farm sizes tended towards certain parameters. Joseph et al. (2004) suggest that a typical settlement pattern in the tenant system would have houses distrib-uted at about 40 acre intervals, 40 acres being considered about the amount of land that could be worked by a single farmer with a mule. Larger tracts would have required additional labor and additional stock to work, but would tend to conform to multipliers of 40 acres. Thus, cash renters with the resources to supply additional working stock would tend to work farms in the 80, 120, or 160 acre range for example. Of course, these farm sizes are idealized, and reflect productive land rather than farm size as a whole, and thus may not be clearly identifiable in the historic record or on the ground. In the Piedmont, the first tenant houses built post-emancipation were likely of logs, much like the pre-emancipation slave housing. As tenancy became more prevalent, however, and more and more of the landscape was devoted to agriculture, there was likely a shift to earth-fast framed housing. Floor plans remained more or less unchanged, however, and the typical structure was a saddle-bag type house consisting of two rooms with a central chimney (Benson 2006). At the Bay Springs farmsteads what were initially square or rectangular, log or frame houses with a central hall or open passageway often evolved into double-pen structures with centered doorways, gable ends and exterior chimneys. Shed or ell additions to the back were common, and the primary floor plan featured four rooms. Functionally there was a lot of over-lap, with the addition serving as either a kitchen and dining area, or as a bedroom while the main house rooms were bedrooms, storage, or living rooms — and possibly all three (Smith et al. 1982). At Bay Springs, houses built for family use by the farm owner would be significantly better constructed than those built for tenant use, though the size and general layout were roughly identical. The Bay Springs houses described by Smith et al. (1982) conform well to the house found at Finch farm by Joseph et al. (1991), which was a 1.5-story wood frame house with a central hallway flanked by two rooms on either side and a one-story ell addition on the back. The primary living area was in the back of the house within the addition and attached porches, and the primary entrance to the house was also here. Ryan Alender Page, who lived on a series of more than 15 tenant farms during his childhood in Spartanburg County, provides the following in his autobiography (Page 1982, quoted in Joseph et al. 1991:157):
The houses we lived in, as with those of other renters, were built to provide rea-sonable comfort rather than luxury…. Nearly all of our two story homes were of one basic pattern. The main portion had two rooms downstairs and two upstairs. Back o f this there was a one-story ell containing kitchen, dining room and pantry; or these rooms were covered by a shed-like roof across the back of the two-story portion….
Beyond the houses were yard areas and support structures, and these, too, conformed to a general pattern. At the Webb farm near Spartanburg, interviews with former occupants as well as archaeology indicated that the layout was similar to that described by Page in his 1982 autobiography. At the Webb farm a house garden was maintained some 20 feet from the house within a chicken wire enclosure. A barn was located some 60 feet from the house, and the out-house was an additional 100 feet beyond the barn. A chicken coop and an okra patch were be-
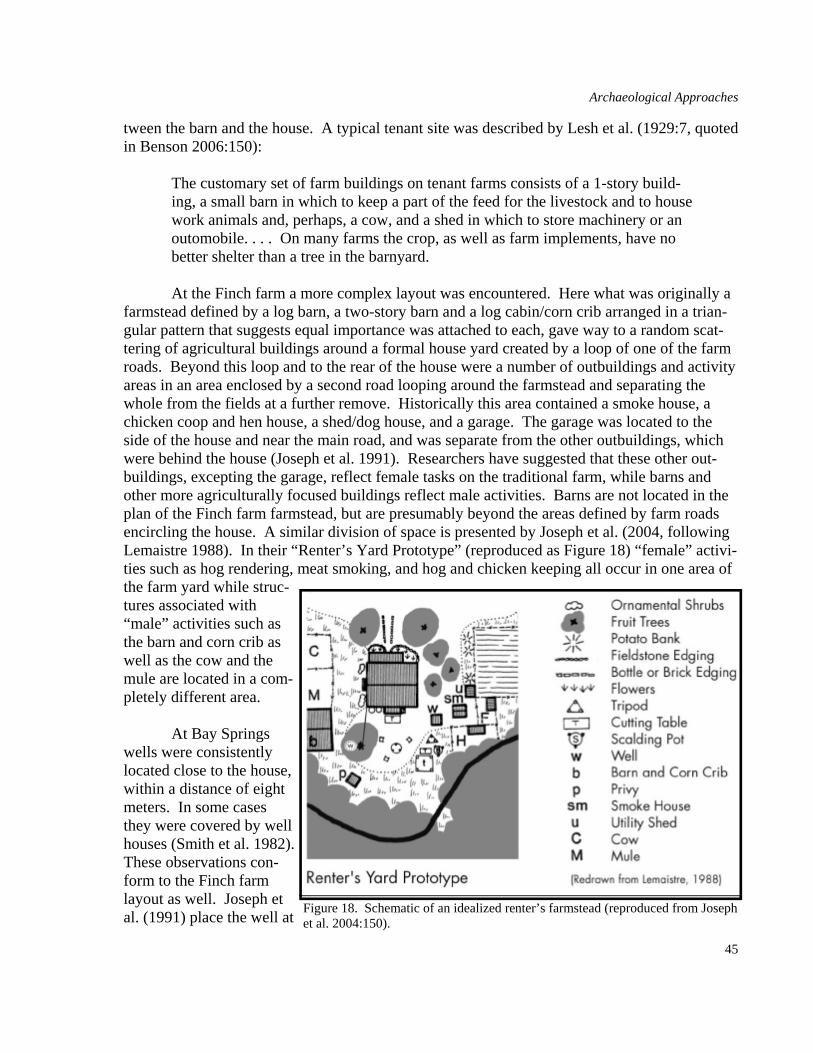
45
Archaeological Approaches
tween the barn and the house. A typical tenant site was described by Lesh et al. (1929:7, quoted in Benson 2006:150):
The customary set of farm buildings on tenant farms consists of a 1-story build-ing, a small barn in which to keep a part of the feed for the livestock and to house work animals and, perhaps, a cow, and a shed in which to store machinery or an outomobile. . . . On many farms the crop, as well as farm implements, have no better shelter than a tree in the barnyard.
At the Finch farm a more complex layout was encountered. Here what was originally a farmstead defined by a log barn, a two-story barn and a log cabin/corn crib arranged in a trian-gular pattern that suggests equal importance was attached to each, gave way to a random scat-tering of agricultural buildings around a formal house yard created by a loop of one of the farm roads. Beyond this loop and to the rear of the house were a number of outbuildings and activity areas in an area enclosed by a second road looping around the farmstead and separating the whole from the fields at a further remove. Historically this area contained a smoke house, a chicken coop and hen house, a shed/dog house, and a garage. The garage was located to the side of the house and near the main road, and was separate from the other outbuildings, which were behind the house (Joseph et al. 1991). Researchers have suggested that these other out-buildings, excepting the garage, reflect female tasks on the traditional farm, while barns and other more agriculturally focused buildings reflect male activities. Barns are not located in the plan of the Finch farm farmstead, but are presumably beyond the areas defined by farm roads encircling the house. A similar division of space is presented by Joseph et al. (2004, following Lemaistre 1988). In their “Renter’s Yard Prototype” (reproduced as Figure 18) “female” activi-ties such as hog rendering, meat smoking, and hog and chicken keeping all occur in one area of the farm yard while struc-tures associated with “male” activities such as the barn and corn crib as well as the cow and the mule are located in a com-pletely different area. At Bay Springs wells were consistently located close to the house, within a distance of eight meters. In some cases they were covered by well houses (Smith et al. 1982). These observations con-form to the Finch farm layout as well. Joseph et al. (1991) place the well at Figure 18. Schematic of an idealized renter’s farmstead (reproduced from Joseph
et al. 2004:150).

46
Archaeological Approaches
the Finch farm within the formal house yard area and immediately adjacent to the kitchen. It was accessible by a covered porch, and capped. Well proximity to the house is also a feature of the Joseph et al. (2004) idealized farmstead (Figure 18). Springs on the other hand were more distant. The main spring at the Web farm was well away from the house, but could be reached by a path, while steps led down to a landing at the spring itself. Downstream was a “milk box” used for keeping perishables cool (Joseph et al. 1991). At Bay Springs identified springs were 12 and 21 meters from the house, while at one of the sites examined seven springs were re-ported by informants, all beyond the barns (Smith et al. 1982). From reading the preceding discussion it is apparent that two scales need to be consid-ered when looking at post-emancipation agricultural settlement. On the one hand, researchers can examine the plantation as a whole, including both the owner’s residence as well as those of the tenants. This is the approach conceptualized by Prunty (1955). At this scale the equivalent in a farmstead would be one that was relatively large and prosperous. Comparing a flourishing farmstead to an individual tenant site, however, would be an apples-to-oranges comparison. Instead, the appropriate comparison would be with an impoverished independent farmstead. Beyond straight comparisons, however, it is also important to keep in mind that any tenant site is part of a larger operation and did not operate in a vacuum. While they can be examined as stand-alone resources, looking at other tenant sites that are part of the same plantation would likely yield a more nuanced picture of the past. Likewise farmsteads and plantations alike were part of larger, often diffuse, rural communities. These may be anchored on rural Post Offices, themselves dependent on transportation networks, or they may be conglomerations of related families within a particular geographic area. Examining agricultural communities is difficult within the standard CRM paradigm given its focus on sites rather than geography, but it still needs to be a consideration. A second consideration in settlement pattern studies is temporal. Gray (1983) proposed that there were four models of settlement that could be applied to agricultural settings. Nucle-ated settlement occurs initially, and would be characterized by a single concentration of agricul-tural and domestic buildings surrounded by crop land. As the farm or plantation matured, how-ever, nucleated settlement would be replaced by a looser, semi-nucleated grouping of agricul-tural and domestic buildings. These could be found within a relatively small area such as on the same landform, but would not be tightly clustered. The pattern would arise as certain activities, and thus their associated structures, were moved beyond the immediate domestic area. This expansion would then continue as more and more activity clusters were moved further afield, resulting in a conglomerate pattern. Finally, a dispersed pattern was characterized by agricul-tural and domestic structures scattered randomly about the landscape. Joseph (Anderson and Joseph 1988) argued that the apparently temporal patterns noted by Gray may in fact relate to geography. He pointed out that coastal plantations may have been more stable in their layout as the crops they produced — long staple cotton or rice were the pri-mary crops — were less debilitating of the soils and thus conducive to settlement stability. In contrast, planters in the Piedmont grew primarily short staple cotton using methods that were notoriously destructive of the land’s productive capacity. As a result, as land close to the plan-

47
Archaeological Approaches
tation core area was used up, more distant land was put into production and the production in-frastructure was moved to maximize efficiency. This process, continued to its logical conclu-sion, would lead to the four patterns identified by Gray: an initial core area with productive land immediately surrounding it; a slightly more dispersed core area as crop land and infrastruc-ture moved outwards, a conglomerate pattern as productive land becomes even more dispersed, and finally a dispersed pattern as production moves to the land least accessible from the original core. Joseph initially conceptualized this as a sequential model beginning with the foundation of an upland farm or plantation and continuing through the various stages outlined above. Later, he pointed out that such an evolutionary progression is unrealistic (Joseph et al 1991). Instead, he posited that settlement pattern transformations were likely responses to periods of prosperity or decline as economic resources were pumped into or drawn out of a given farm or plantation. Nevertheless, the short-lived nature of individual fields under the twin onslaught of poor farming practices and a nutrient-intensive crop continued to be a primary impediment to Piedmont farmers. Refuse Disposal Patterns Also working in the early 1980s, Lesley Drucker and colleagues noted basic similarities between refuse disposal patterns at two different late 19th-early 20th century farm sites in Abbeville County, which they dubbed the “Piedmont Refuse Disposal Pattern”. The pattern is as follows (Drucker et al. 1982:106):
A—The immediate environs of the main dwelling will be regularly clean-swept so as to effectively prevent the accumulation of household debris, food refuse and vari-ous structural and equipment paraphernalia; manor food scraps were probably thrown into the adjacent yard areas for consumption by dogs and hogs. Base on current observation and oral tradition, mainly the front and sides of the dwelling are will be regularly cleaned. Larger items of equipment, machinery and struc-tural member will be removed at significantly longer time intervals, often on the order of months or years.
B—Refuse will be gathered in heaps rather than buried in large excavated pits, for the
purpose o loading the refuse into a wagon and transporting it to a location at some distance from the domestic complex for disposal; likely areas to attract such dis-posal will be gullies, ravines, creeks or borrow pits;
or Refuse will be transported to the outermost edges of the domestic complex and discarded down the hillside(s).
Drucker et al. hypothesize that this model will hold for areas characterized by pronounced to-pography occupied by rural farmers in the 19th and 20th century who share certain behavioral traits. Where farms are located adjacent to abrupt topographic depressions the refuse will be

48
Archaeological Approaches
pitched “overboard” on a regular basis, while on broader landforms without immediately con-venient disposal sites it will be periodically transported for disposal. The archaeological impli-cations of this behavior as itemized by Drucker et al. (1982:107) are:
1. Total artifact assemblages from Piedmont historic sites in geographic areas char-acterized by pronounced relief will be numerically sparse;
2. Artifact assemblages from these contexts will reflect truncated material classes; for instance, a general absence will exist of the full range of domestic classes; also, the assemblages will be largely characterized by the occurrence of architec-turally associated classes, such as nails and window glass;
3. Refuse areas associated with domestic sites will be located peripheral to the main occupation complex, defined by structures and features, and will also be at lower elevations than the main occupation complex;
4. Secondary refuse accumulations will occur at the bottom of slopes and ravines through colluviation from the upper slopes, and will reflect mostly short term re-fuse disposal, that is, single-episode to perhaps several months worth;
5. Secondary refuse accumulations at the bottom of slopes and ravines will not bear any necessary relation to the closest domestic unit, since one stated purpose of the distant transport of refuse is to “get it away from our property;” thus, dumping debris on someone else’s property may be an acceptable alternative if the location is otherwise convenient and suitable.
Linda France Stine documented two additional refuse disposal patterns in her disserta-tion research, focused on two late 19th-early 20th century farmsteads in the North Carolina Piedmont (Stine 1989). At the Nichols site trash was apparently burned some 60ft from the main house, while additional trash was dumped in a gulley next to the farmstead. At the Stine site no burning was documented but trash was disposed of in an orchard about 70ft from the house while additional trash was dumped in a ravine 140ft from the house. Stine also docu-mented the presence of an “inner” yard and “outer” yard area, these terms derived from Jurney and Moir’s work in the Richland Creek and Mountain Creek areas of Texas. Jurney and Moir (Moir 1987, 1988) established that artifact distributions at late 19th-early 20th century farm-steads described two major zones, which the called the active and outer yards areas. The active yard itself was divided into an inner and outer yard, with the former containing few artifacts as it was formed by the practice of sweeping the yard area close to the house. The inner part of the active yard extended between 19 and 30 ft from the house while the outer part of the active yard extended an additional 19 to 72 feet with most in the 30 to 50 foot range. Within the inner ac-tive yard Moir and his colleagues recovered about 40-160 artifacts per test unit, while within the outer active yard has sufficient artifacts to be called a sheet midden. The outer yard area — the area beyond the active yard — evidenced significantly lower artifact densities. Stine also includes a thoughtful discussion of the effects of ethnicity on Piedmont farm-steads (Stine 1989:354-360). Of the two sites she examined, the Stines’ were Euro-Americans while the Nichols’ were African American. Stine hypothesized that “It was thought that if Afro-American ethnicity significantly affected material culture acquisition, use and disposal,

49
Archaeological Approaches
then artifact distributions at an Afro-American site would differ significantly from a Euro-American farmstead” (Stine 1989:358). She went on to suggest that, as a logical follower, the artifact patterning from the Stine site would display a strong similarity to South’s (1977) Caro-lina Artifact Pattern and strong similarities to other Euro-American occupied sites in the Pied-mont. None of these hypotheses were supported by her data however, and she concluded that “artifacts at both sites seem to reflect, instead, the shared general farm lifestyle of site inhabi-tants” (Stine 1989:359). She concludes:
Members of both families were apparently acquiring goods from the same sources (local stores, mail-order, locally crafted, home produced) using the same means (cash from lumber/carpentry, cash from cotton/farm produce, barter, perhaps some credit). They also seem to have purchased or made similar items, sometimes for one another’s families. These goods were also used in comparable ways. The dis-posal of goods may also be analogous, in that both families threw trash into piles. However, the Nicholses seem to have created their rubbish heaps a bit closer to the house than those at the Stine farmstead. Topographic difference may help explain some of this disparity, as the Stines had an obvious ravine to use for trash disposal. Topographic differences at the Nichols site are less extreme, with no obvious ra-vines present (Stine 1989:359).
Joseph et al. (1991) also examined refuse disposal patterning at the two sites they exca-vated in Spartanburg County, where they found that all four systems of refuse disposal had been practiced. Additionally, they hypothesize that the refuse disposal systems had been practiced sequentially, and in response to the sanitation movement, which came to the south in the late 19th century. During the 18th century trash was tossed from doors and windows into the adja-cent yard areas. This became known as the Brunswick pattern of refuse disposal, and was ini-tially documented by Stan South (1977) at house sites in Brunswick, NC. Joseph et al. (1991:170) tentatively state that this pattern may have been replaced in the first half of the 19th century with refuse disposal in sheet middens in rear yards, then by trash burning in the second half of the 19th century and into the beginning of the 20th century, and finally by off-site dis-posal in ravines and other depressions (the Piedmont pattern) in the second half of the 19th cen-tury and on into the 20th century, all in the pursuit of creating a more sanitary environment for site occupants. They further argue that the shift from trash burning to the Piedmont pattern may reflect technological changes as they relate to containers and container availability. The sug-gest that when bottle glass replaced more traditional stoneware as the utilitarian container mate-rial of choice, it was in large part because of was more economical to manufacture. It thus be-came far more commonly available, and reuse was not an economic necessity. As a result, bot-tle glass containers became increasingly common in household trash. Because they could not be disposed of through the traditional means of burning, they were tossed into the “bottle dumps” that are such a common occurrence in Piedmont gullies and ravines. Artifacts and Artifact Patterning The Waverly Plantation work in Mississippi brought the idea that tenant sites were oc-cupied within a social and economic landscape that extended beyond the local to a regional, na-

50
Archaeological Approaches
tional, and international scope (Adams 1980). This initial effort at artifact patterning did not, however, take into account the actual artifacts. Instead, Adams and his colleagues argued that tenant sites reflect the national market and their differential access to goods within it, and that this access changed with time. In effect, they suggested that the social system of individual ten-ant families within the system was neither uniform synchronically nor static diachronically. They did not, however, examine the artifacts recovered with this in mind, though they did pro-vide an exhaustive and still applicable discussion of the materials recovered (Trinkley et al. 2006). The focus that material culture can bring to bear on social relations within the post-emancipation southern agricultural system would not be developed until two years later by Orser in his work at Millwood plantation (Orser et al. 1982; Orser 1988). Orser argued that artifacts are the logical starting place for archaeologists to begin con-tributing unique insight into the issues of “power, racism, exploitation, and accommoda-tion” (Orser 1988:247). Artifact patterns are the relative percentages in which various classes of artifacts occur in a collection. Loosely following South’s (1977) efforts to discover artifact patterning and relate it to sociocultural variables, Orser created a functionally typology of arti-facts that included the major classes of foodways, clothing, household/structural, personal and labor (1988:233). Each of these classes contained specific sub-classes of artifacts. The food-ways class consisted of procurement items such as ammunition, fishhooks and fishing weights, preparation items like baking pans, cooking vessels and large knives, service items such as fine earthenware, flatware and tableware, and storage items such as coarse earthenware, stoneware, glass bottles, canning jars, and bottle stoppers. Floral and faunal remains completed the food-ways class. For clothing, fasteners include buttons, eyelets, snaps, and hook and eyes, manu-facture included needles, pins, scissors and thimbles, and other clothing items include shoe leather, metal shoe shanks and clothes hangers. The household/structural class included archi-tectural and construction items like nails, flat glass, spikes, mortar, bricks and slate; hardware such as hinges, tacks, nuts, bolts, staples, hooks and brackets; and furnishings/accessories such as stove parts, furniture pieces, lamp parts and decorative fasteners. The personal class con-sisted of medicinal items like medicine bottles and droppers, cosmetic items such as hair-brushes, hair combs and jars, recreational artifacts including smoking pipes, toys, musical in-struments and souvenirs, monetary items (coins), decorative items like jewelry, hairpins, hat-pins and spectacles, and other personal items including pocketknives, fountain pens, pencils and inkwells. Finally the labor class contained agricultural items like barbed wire, horse and mule shoes, harness buckles and other tack, hoes, plow blades and scythe blades Industrial items like tools were also included in the labor class. Using these functional classes Orser compared the percentage of artifacts from each class (the artifact pattern) recovered from six contexts on Millwood Plantation — standard prac-tice for artifact patterning studies such as his. He notes that there is broad similarity in artifact patterning between the owner’s home and the tenant home in the sample, and some similarity between the resident manager home and the home of a millwright who lived on the plantation. Unique artifact patterns were associated with the home of the owner’s female companion and the home of a wage hand on the plantation. Further details are provided by looking at the distri-butions of sub-classes between site components. For example, Orser also looks at the foodways

51
Archaeological Approaches
class with more depth by looking at the ratios of procurement, preparation, service, and storage represented at each component. His results, however, show little continuity with the overall patterning: collections from the manager and the tenant residences show the greatest similarity while the greatest dissimilarity is between the wage hand residence and the millwright resi-dence. In 1983 Trinkley and Caballero also addressed artifact patterning at tenant sites. Unlike Orser, however, they used the traditional classes of artifacts initially proposed by South (1977) in his presentation of the Carolina and Frontier artifact patterns, and proposed a “Tenant Arti-fact Pattern” that could be contrasted with South’s Carolina and Frontier patterns, and with Sin-gleton’s subsequent (1980) Slave pattern. The tenant pattern identified by Trinkley and Cabal-lero contains a higher percentage of kitchen-related artifacts than do any of the other patterns identified at the time. Additionally, there is a low ratio of architectural items while the cloth-ing-, personal- and activity-related artifacts fall within the range created by the Carolina, Fron-tier and Slave patterns. Trinkley and Caballero (1983:64) state that:
This Tenant Pattern appears to reflect what is known historically about tenant farming. The dilapidated houses contribute few durable artifacts to the overall pattern, clothing a personal effects are sparse, and activity related artifacts (particularly those related to farming) are relatively abundant.
Stine also addressed the issue of artifact pattering in her dissertation (Stine 1989). She points out with a great deal of validity that artifact patterning should first be examined to more fully understand intra-site artifact distributions, and that only once this sort of distribution is clarified should the overall artifact pattern from a site as a whole be considered (Stine 1989:343). Like Drucker and her colleagues, Stine also assigned artifacts to the functional groups espoused by South (1977). She then prepared distribution maps of each group. These maps are not presented in her dissertation, but she notes that kitchen artifacts at the Nichols site tend to occur with greatest frequency in the vicinity of the privy, smokehouse, the main house, and in two trash disposal areas. In contrast, at the Stine site kitchen artifact distribution differs in two primary ways: kitchen artifacts occur in relative frequency near the barn, but not near the house. A similar distribution was noted when architectural group items from the two sites were plotted. In the furniture group, the two sites tended towards similarity. Though few arti-facts fell into this category, they tended to occur in the trash dump areas rather than in other parts of the sites. Remaining groups differed markedly between the sites, with artifacts cluster-ing in the yard areas of the Nichols house but further away from the Stine house. In terms of overall patterning, Stine (1989) notes that the Nichols house compares well with several other Piedmont sites in the Carolinas while the Stine artifacts compare well with Trinkley and Caballero’s Tenant pattern. However, much of the overall difference between the Stine and Nichols sites results from the inclusion of a single feature in the Nichols data that contained a lot of construction hardware, left over from burning lumber. When this feature was not considered the Stine and Nichols patterns were similar, and both compared well with that observed by Trinkley and Caballero (1983).

52
Archaeological Approaches
At Finch Farm (Joseph et al. 1991), the artifact pattern is dominated by the Kitchen group, as is the artifact pattern at the associated tenant site, the Webb farm. In both cases the architecture group made up a still-notable percentage of the collection, while the activities group was also relatively well represented when compared to Trinkley and Caballero’s Tenant pattern. This suggests to Joseph et al. (1991:175) that the critical factor in patterning, at least as it applies to these sites, is not whether the farm is occupied by an owner or a tenant, but the sta-bility of that occupation. In the case of the Webb farm, although it was occupied by a tenant, he was a stable tenant, occupying the farmstead for a long time. The architectural class appears to be the critical factor in this estimate, and Joseph et al. (1991:175) note that one difference be-tween the Webb farm and a perhaps more typical tenant farm can been seen in the durability of the architecture. At the third farm examined by Joseph et al., the Lynch farm, artifact pattern-ing had a higher representation of the architectural class more closely corresponding to the Ten-ant pattern. This may reflect the impermanence or relative cheapness of typical tenant architec-ture. As noted by an informant to Smith et al in their study of the Bay Springs sites, tenant houses “were a little cheaper built; just throwed up cheaper. Wasn’t many renter houses that was as good as the one that the landlord lived in” (Sid Wilson, in Smith et al. 1982:217). A final look at artifact patterning is provided by Trinkley et al. (2006). They summarize data from many of the sites discussed herein, and add data from several tenant farms in Aiken County (Cabak and Inkrot 1997), a tenant site in Berkeley County (Brockington et al. 1985), one in Horry County (Trinkley and Caballero 1983) and several sites in Sumter County (Trinkley et al. 1985). They note that, in general, there appear to be two different patterns that can be ascribed to late 19th to early 20th century farmsteads. These correspond closely to the patterns identified by Joseph et al. above (1991), and consist of 1) sites that have a high propor-tion of foodways-related artifacts due to a general scarcity of the architectural group; and 2) sites with a greater frequency of architectural artifacts and thus a relative decline in kitchen arti-facts. Pitfalls in Pattern Analysis This chapter has discussed various ways archaeologists have approached late 19th-early 20th century agricultural sites, with the last two sections of the chapter looking at pattern analy-sis including both refuse disposal patterning and artifact patterning. Although these approaches have proved viable, there are pitfalls that should be avoided in their application. These relate primarily to sampling strategies and how the patterning concept is operationalized. Sampling strategies are a particularly important consideration in any archaeological study, but particularly so when considering refuse disposal patterns and artifact patterns. In both instances a truly representative sample is a requirement before meaningful conclusions can be drawn or comparisons made. In the case of refuse disposal patterns, sampling designs that focus on particular areas of a site, such as the yard or a structure, will completely miss artifact deposits in other site areas and thus the patterned behavior that refuse disposal pattern studies track will also be omitted from findings. Likewise, valid artifact patterning requires that all ar-eas of a site be explored equally because the patterning is identified by differential representa-

53
Archaeological Approaches
tion of various artifact classes as a proportion of all artifacts from a site. To not sample uni-formly creates the probability that special purpose areas of the site will be over (or under) repre-sented in the data set, thereby skewing the proportional representation of this or that artifact class. In such a case the data would not be comparable to other sites unless the sampling strat-egy employed at those other sites mirrored the over or under representation of the same type of special purpose area. At the same time, individual activity areas may also be identifiable in the data set, and a sampling design that allows inter-site comparison of like areas is also an impor-tant consideration. More robust critiques center around the concept of artifact patterning and the theory be-hind it. As initially conceived by South, artifact patterns are projected against known variables of historic archaeological sites, in particular site type or function (South 1977:83). Addition-ally, South further nuanced his initial formulation by examining patterns that occurred within specific classes of artifact. Thus, South initially conceived of artifact patterning as a way to tease out differences between seemingly similar types of sites. He has been criticized by Orser (1989) who argues that South draws on disparate bodies of theory in supporting his artifact pat-terning concept. In Orser’s view South’s artifact patterning is grounded in eclecticism, and fol-lowing Price (1980) he rejects it because it “fails to offer unified interpretations” (Orser 1989:32). Orser also criticizes artifact pattern analysis as being synchronic, a critique which comes about because South’s interpretations of pattern variation are largely functional despite the method’s overarching theoretical roots in cultural evolution. This is a somewhat less robust cri-tique, however, because ultimately, South’s goal was to understand the cultural dynamics that led to those variations. In his view patterning is not descriptive so much as it offers explanatory clues to past human behavior. Unfortunately this is not how patterning came to be used in much of the literature. In practice, patterning came to be used to identify site types rather than to recognize and explain variation within or between them. Nevertheless, in its original formu-lation the concept of artifact pattering remains viable. Joseph, for example, has shown that it can be applied to issues that are diachronic by demonstrating that differences in patterning ob-served in a sample of South Carolina slave sites vs. Georgia slave sites can be attributed to their temporal variation rather than any real functional differences (1989). Thus, artifact patterning can be applied to questions of cultural process even though such an effort is not always made. Summary This section has examined how archaeologists have approached late 19th-early 20th century farmstead sites in the past. Though not technically “context”, this section is included because the historic record for rural Richland County is so fragmented that in many instances archaeology is our best, or even only, bet for understanding the past. Archaeologists have de-veloped several theoretical approaches and methodological tools that help to highlight pattern-ing in the archaeological record as it relates to late 19th to early 20th century farmsteads. Pat-terning has been observed in settlement systems, artifact discard and the use of space within individual sites, and in the kinds of artifacts associated with these site types. The latter research is perhaps the most problematic, but this stems from application rather than any inherent weak-

54
Archaeological Approaches
ness in the theoretical or methodological underpinnings of the pattern recognition process. It is through the recognition of patterns, and as importantly the recognition of variation from ex-pected patterns, that archaeological research can most effectively shed light on the important questions revolving around late 19th to early 20th century farms. The next, and last, section of this report reiterates those questions as they have been developed herein.

Conclusion
55
CONCLUSION This document has presented a historic context for plantation and farm sites dating from the late 19th to early 20th century in portions of Richland County, South Carolina. These in-clude the central part of the county, known historically as the center township and today occu-pied primarily by Fort Jackson, and the lower part of the county, which is still called Lower Richland and historically was the lower township. The discussion has been constrained by a lack of historic documentation relating to the study area, however. While very useful data was derived from the 1880 census regarding agricultural schedules, there was no longitudinal com-ponent because the data just aren’t there. Herein only portions of the center and lower township enumeration districts were examined in an effort to provide a general view of what was going on in the two areas of the county; a more intensive examination may provide data on specific sites, assuming their owners or operators in 1880 can be identified. Population schedules provide a somewhat more longitudinal vantage point, and here data from 1880, 1900 and 1920 were examined. As alluded to by Trinkley in his very informa-tive report on tenancy in Richland County (2006), however, the boundaries of the enumeration districts within the county changed as time passed and the population grew. Thus, directly comparing the population of one township with the other, or looking for specific longitudinal change within a township, proved difficult. Instead this report presents general population trends in and between the two townships as ratios and percentages, recognizing that more com-plete data may be derived from the archival record, and that this may alter the results of analy-sis. Despite their limitations, the census data presented herein do point to some very real dif-ferences between the center and lower townships, differences which should be at the core of any research design examining late 19th to early 20th century farmsteads in the study area. At the root of these differences is the physiography of Richland County, a physiography that was well suited to large-scale, plantation-based agriculture in the lower township and smaller scale agricultural enterprises in the center township. Because the agricultural systems in the two parts of the county differed, so too did the social systems. While these differences were par-ticularly notable during the antebellum period (which is not considered in this document), they remained after the abolition of slavery. Examination of the social trajectories in the two areas would be fruitful. Further, these trajectories were converging in many respects, but whether convergence actually occurred, and when, are also research questions that archaeology on late 19th to early 20th century plantations and farms in the center and lower townships could and should address. In particular, the project area seems particularly well suited to an assessment of the validity of the concept of cultural “relics” proposed by Newton (1974) as explanatory for the continued existence of Upland South social and economic systems in varying areas. From an anthropological perspective this is a particularly relevant question given the impact of the

Conclusion
56
modern world economic system on traditional cultures, and thus one very appropriate for ar-chaeologists to address. Physiographic differences, and the agricultural differences they engendered, suggest that while an Upland South model can be applied in the center township, in the lower township a more traditional southern plantation model is a useful construct. Where the center township is characterized by a relatively balanced agricultural strategy, the plantation economy of the lower township focuses the agricultural effort on one crop, in this case cotton, more than others. To what extent these production strategies ameliorated the effects of tenancy is also an area of re-search that could lead to significant conclusions. Clearly center township farmers enjoyed farm ownership more often than their lower township counterparts. Was this a product of relatively lower land prices resulting from poorer productivity? In this regard, farm size in the two areas in the 1880 census is significant. Although planted acreage was roughly on a par between the two areas, center township farms tended to occupy a greater total acreage due to lower produc-tivity of the soils in general. The center township also had significantly lower population density than the lower township, again likely a result of physiography and lower soil productivity. This was not read-ily apparent in the 1880 and 1900 census data used in this report, because the enumeration dis-tricts examined for those census years were adjacent to one another. In contrast, the 1920 enu-meration districts examined did not share a common boundary and very clearly indicate the density dichotomy between the two areas. While there was likely a population density contin-uum between the center and lower townships, the two extremes were very dissimilar, with im-plications for archaeology. To the extent that local and state government provided services to rural residents of Richland County, it is probable that the bulk went to the lower township. This can be seen, perhaps, in the fact that Garners Ferry road was one of the first in the county out-side of Columbia to be paved. Regardless, the transportation infrastructure in the lower town-ship was always better than that enjoyed by center township residents, due if nothing else to the railroad. This, too, may have been an important factor in the agricultural differences between the two areas of the county, as getting the cotton crop to market would have been significantly easier from lower township farms than from center township farms. This may have prompted the greater crop equity in center township production strategies. Although not examined in this document due to a lack of historical data, there is a relatively good possibility that the center township enjoyed a “truck farming” relationship with the city of Columbia. The emphasis on a broader array of crops in the center township certainly makes this something worth considera-tion. Beyond agriculture, greater population density in the lower township would also have created more social opportunities for residents. These were typically organized through churches, and historic maps indicate that churches occurred far more frequently in the lower township than the center township. What implications this may have for the archaeological re-cord are unclear. Likewise, schools also played an important role in the community, one that may have been enhanced within the African American community where education was viewed

Conclusion
57
as an opportunity for advancement. Whether this view changed through time as the realities of Jim Crow era segregation set in and negative attitudes towards African Americans were solidi-fied could not be addressed with available data. Geographical Limits of this Context This context has dealt with very specific property types — late 19th-early 20th century-farms and plantations — within a very limited area — the lower and center townships of Rich-land County, South Carolina. In one sense, the context can not be applied much beyond this geographic area, while in another it not only can be applied to a broader area, but should be. From a historical perspective the context is relatively specific. The differences in farming prac-tices and social relations between the center township and lower Richland County have their roots in their differing physiography. More accurately, the sandhills physiographic province with its poor soil fertility limited the agricultural opportunities of its residents, and thus the ways those opportunities could be exploited. Large-scale plantation agriculture simply could not be practiced in the sandhills because the extent of productive soils was insufficient to sup-port it. At the same time, plantation agriculture was characteristic of a much larger geographic area. Its roots within South Carolina and the southeast in general were in the lowcountry where rice and long staple cotton were principal crops, but the characteristic attributes of plantation agriculture — a main crop for export and an enslaved labor force — spread rapidly inland into the Piedmont and beyond with the advent of the cotton gin. During the course of that rapid ex-pansion, powered by technological innovation, plantation agriculture displaced the prior Upland South agricultural and social system that had been characteristic of the Piedmont previously, and that was very similar to, if not characteristic of, that found in the sandhills. Plantations and tenant farms very much like those that might be encountered in Lower Richland County can thus be expected to occur over a vast area of the southeast, wherever cotton was the principal crop. It is their juxtaposition with the poorer agricultural land of the sandhills and the people who lived there that makes the situation in Richland County unique and limits the geographical scope of this context. On the other hand, it is the very fact that plantation agriculture did not supplant earlier, previously established agricultural systems in the sandhills, while simultaneously replacing similar systems virtually everywhere else within the state, that makes the Richland County data more interesting and useful in a broader geographic arena. The sandhills are not the only place where traditional agricultural and social systems proved resilient. As alluded to earlier, Smith (2008) has noted similar instances in both Missouri and Louisiana where older cultural tradi-tions persisted within an insular area. Although Smith is not specific about the mechanisms within his study areas, in the current study area rather than being isolated by water or by im-passable or inhospitable terrain as in a more traditional geographic view of insularity, here cul-tural groups in the center township were isolated by a technology that was not adaptive within their specific environment and thus passed them by. The commonality appears to be low soil fertility, as this was also a characteristic of the areas Smith examined. To refer to phenomenon simply as “cultural relics” following Newton (1974) is no doubt overly simplistic, but more so-phisticated theoretical constructs within the discipline of anthropology that relate to cultural contact, cultural change, and segmentation, such as creolization, cultural identity, and syncre-

Conclusion
58
tism among others, may present foils to better understand situations in which culture change does not appear to occur. Archaeology’s unique, diachronic perspective on cultural change de-mands also that we examine instances of cultural stasis as well. It is in this realm that the con-text presented here has utility far beyond Richland County.

References Cited
59
REFERENCES CITED Adams, William H., editor
1980 Waverly Plantation: Ethnoachaeology of a Tenant Farming Community. Resource Analysts, Bloomington, IN.
Benson, Robert W.
2006 Cultural Resources Overview of TheSumter national Forest. Francis Marion and Sumter National Forests CRM Report 06-07. Southeastern Archaeological Services, Athens, GA.
Bleser, Carol K. Rothrock
1969 The Promised Land: The History of the South Carolina Land Commission, 1869-1890. The University of South Carolina Press, Columbia.
Brasswell, M.L. (Surveyor)
1897 Map of Richland County. Map on file, South Caroliniana Library, University of South Carolina, Columbia.
Brockington, Paul, Michael Scardaville, Patrick H. Garrow, David Singer, Linda France, and Cheryl Holt
1985 Rural Settlment in the Charleston Bay Area: Eighteenth and Nineteenth Cetury Sites in the Mark Clark Expressway Corridor. Garrow and Associates, Inc., Atlanta.
Cabak, Melanie A., and Mary M. Inkrot
1997 Old Farm, New Farm: An Archaeology of Rural Modernization in the Aiken Plateau, 1875-1950. Savannah River Archaeological Reseach Papers 9, Savannah River Ar-chaeological Research Program, South Carolina Institute of Archaeoloyg and Anthro-pology, Columbia.
Carolyn Hanna Murphy
1995 Carolina Rocks! The Geology of South Carolina. Sandlapper Publishing Co., Inc., Orangeburg, SC.
Chesnut, Mary
1949 A Diary from Dixie. Houghton Mifflin, Co., Boston. Clark, Thomas D.
1944 Pills, Petticoats, and Plows: The Southern Country Store. University of Oklahoma Press, Norman.

References Cited
60
Courtney, Margaret Sloan (compiler)
2005 Life on “The Hill”: Horrell Hill, the Place and its People. A Brief History with Memories from the 1930s -1940s. Privately published.
Crass, David Colin, and Mark J. Brooks (editors)
1995 Cotton and Black Draught: Consumer Behavior on a Postbellum Farm. Savannah River Archaeological Research Papers 5, South Carolina Institute of Archaeology and Anthropology, University of South Carolina, Columbia.
Drucker, Leslie M., Woody C. Meiszner and James B. Legg
1982 The Banister Allen Plantation (38AB102) and Thomas B. Clinkscales Farm (38AB221): Data Recovery in the Richard B. Russell Multiple Resource Area, Abbe-ville County, South Carolina. Resource Studies Series No. 55, Carolina Archaeological Services, Columbia.
Ford, Ralph Watson
1986 The Changing Geographic Pattern of South Carolina's Railroad System: 1860-1902. M.A. Thesis, Department of Geography, University of South Carolina, Columbia.
Fox, Nancy
1984 Historical Summary of Richland County, South Carolina. Central Midlands Regional Planning Council, Columbia, SC.
Hammond, Harry
1884 Report on the Cotton Production of the State of South Carolina. In Report on Cotton Production in the United States, Part II, edited by Eugene W. Hilgard, pp. 451-526. Department of the Interior, Census Office, Washington, DC.
Joseph, J.W., Theresa M. Hamby, and Catherine S. Long
2004 Historical Archaeology in Georgia. Georgia Archaeological Research Design Paper No. 14. University of Georgia Laboratory of Archaeology Series Report No. 39, Ath-ens.
Joseph, J. W., Mary Beth Reed, and Charles E. Cantley
1991 Agrarian Life, Romantic Death: Archaeological and Historical Testing and Data Re-covery for the I-85 Northern Alternative, Spartanburg, South Carolina. New South As-sociates Technical Report 39, Stone Mountain, GA.
Keber, Robert
1979 Site selection in the Blue Ridge Mountains. Ms. On file, North Carolina State Uni-versity, Raleigh.
Kovacik, Charles F., and John J. Winberry
References Cited
61
1987 South Carolina: A Geography. Westview Press, Boulder, Colorado. Laurence, Carl B.
1978 Soil Survey of Richland County, South Carolina. United State Department of Agri-culture, Soil Conservation Service.
Lesh, F.R., B. H. Hendrickson, A. H. Hasty, W. J. Latimer, and S. R. Bacon
1929 Soil Survey of Greenwood County, South Carolina. USDA Bureau of Chemistry and Soils Series 1929, No. 26.
Moir, Randall W.
1987 Farmstead Proxemics and Intrasite Patterning. In Historic Buildings, Material Cul-ture, and People of the Prairie Margin: Architecture, Artifacts, and Synthesis of Historic Archaeology, edited by David H. Jurney and Randall W. Moir, pp. 229-237. Richland Creek Technical Series, Volume V. Archaeology Research Program, Institute for the Study of Earth and Man, Southern Methodist University, Dallas.
1988 Farmstead Proxemics and Intrasite Use of Space. In Historic Farming on the Hog-
wallow Prairies: Ethnoarchaeological Investigatoins of the Mountain Creek Area, North Central Texas, compiled by David H. Jurney, Susan A Lebo, and Melissa M. Green, pp. 215-223. Joe Pool Lake Archaeological Project, Volume II. Archaeology Research Program, Institute for the Study of Earth and Man, Southern Methodist University, Dal-las.
Moore, John Hammond
1993 Columbia and Richland County : a South Carolina Community, 1740-1990. Univer-sity of South Carolina Press, Columbia.
Newton, Milton
1974 Cultural Preadaptation and the Upland South. In Man and Cultural Heritage, Papers in honor of Fred B. Knifffen edited by H.J.Walker and W.G. Haag. GeoScience and Man Volume V., pp. 143-154, Baton Rouge, LA.
Orser, Charles E., Jr.
1988 The Material Basis of the Postbellum Tenant Plantation: Historical Archaeology in the South Carolina Piedmont. The University of Georgia Press, Athens.
1989 On Plantations and Patterns. Historical Archaeology 23(2):28-40.
Orser, Charles E., and Annette M. Nekola
1985 Plantation Settlment from Slavery to Tenancy: An Example from a Piedmont Planta-tion in South Carolina. In The Archaeology of Slavery and Plantation Life, edited by Theresa Singleton, pp. 67-94. Academic Press, Orlando, FL.
References Cited
62
Orser, Charles E., Jr., Annette M. Nekola, and James L. Roark 1982 Exploring the Rustic Life: Multidiscoplinary Research at Millwood Plantation, a
Large Piedmont Plantation in Abbevillle County, South Carolina and Elbert County, Georgia. Mid-American Research Center, Loyola University of Chicora, Chicago.
Page, Ryon Alender
1982 Our Way of Life: The Odyssey of a Farm Family. Published by the author, Silver Springs, MD.
Prunty, Merle C.
1955 The Renaissance of the Southern Plantation. The Geographical Review 45:459-491. Randle, Lisa Briggitte Gore
1999 The History of African Americans in Richland County. M.A. Thesis, Department of History, University of South Carolina, Columbia.
Singleton, Theresa A.
1980 The Arcaheology of Afro-American Slavery in Coastal Georgia: A Reginoal Percep-tion of Slave Household and Community Patterns. Ph.D. dissertation, Department of Anthropology, University of Florida, Gainesville.
Smith, Steven D., David F. Barton, and Timothy B. Riordan
1982 Ethnoarchaeology of the Bay Springs Farmsteads: A Study of Rural American Settle-ment. Resource Anaylsts, Inc., Bloomington, IN.
Soller, David R., and Hugh H. Mills
1991 Surficial Geology and Geomorphology. In The Geology of the Carolinas: Carolina Geological Society Fiftieth Anniversary Volume, edited y J. Wright Horton, Jr., and Vic-tor A. Zullo, pp. 290-308. The University of Tennessee Press, Knoxville.
South, Stanley
1977 Method and Theory in Historical Archaeology. Academic Press, New York. South Carolina Department of Agriculture
1883 South Carolina: Resources and Population, Institutions and Industries. The Reprint Company, Spartanburg, SC.
1907 Handbook of South Carolina: Resources, Institions and Industries of the State. The
State Company, Columbia, SC. Stine, Linda France
1989 Raised up in Hard Times: Factors Affecting Material Culture on Upland Piedmont Farmsteads Circa 1900-1940. PhD. Dissertation, Department of Anthropology, Univer-sity of North Carolina, Chapel Hill.

References Cited
63
Stoeber, E.M.
1873 Richland County Geological and Agricultural Map, Map on file, South Caroliniana Library, University of South Carolina, Columbia.
Thompson, Edgar T.
1986 The Plantation – A World-Wide Institution. In Plantations Around the World, Pro-ceedings of the First World Plantation Conference, edited by Sue Eakin and John Tarver, pp. 1-8. Louisiana State University Agricultural Center, Baton Rouge.
Trinkley, Michael, and Olga M. Caballero
1983 U.S. 521 Relocation, Sumter County, South Carolina: An Archaeological Survey of an Inter-Riverine Upper Coastal Plain Locality. South Carolina Department of High-ways and Public Transportation, Columbia.
Trinkley, Michael, Jeanne Calhoun, and Debi Hacker-Norton
1985 Archaeological and Historical Investigation of 38SU81, 38SU82, 38SU83, and 38SU86. South Carolina Department of Highways and Public Transportation, Colum-bia.
Trinkley, Michael, Debi Hacker, Nicole Southerland, and Julie Poppell
2006 Data Recovery at 38RD1249, 38RD1260, and 38RD1262: Tenancy in Richland County, South Carolina. Research Series 68, The Chicora Foundation, Inc., Columbia, SC.
Worthy, Linda, editor
1983 “All that Remains”: The Traditional Architecture and Historic Engineering Struc-tures of the Richard B. Russell Multiple Resource Area, Georgia and South Carolina. Russell Papers, National Park Service, Interagency Archaeological Services Division, Atlanta.