hist209 industrial metropolis october 5 th, 2010 prof. johnson mark pan us lumber industry
TRANSCRIPT

HIST209Industr ia l Metropol is
October 5 t h , 2010Prof. Johnson
Mark Pan
US LUMBER INDUSTRY
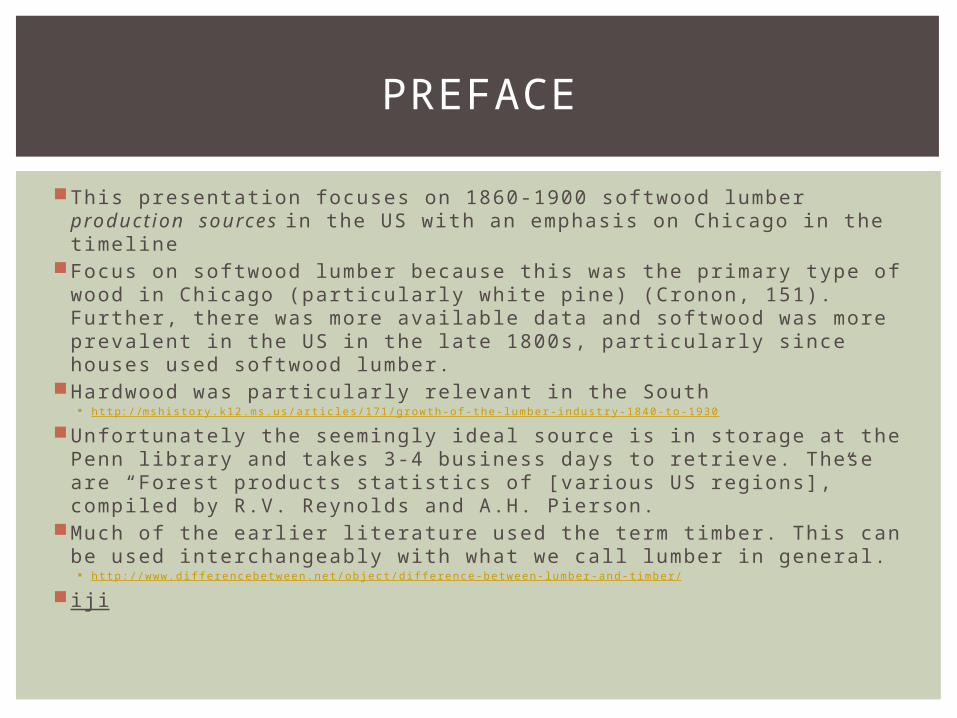
This presentation focuses on 1860-1900 softwood lumber production sources in the US with an emphasis on Chicago in the timeline
Focus on softwood lumber because this was the primary type of wood in Chicago (particularly white pine) (Cronon, 151). Further, there was more available data and softwood was more prevalent in the US in the late 1800s, particularly since houses used softwood lumber.
Hardwood was particularly relevant in the South http: / /mshistory.k12.ms.us/art icles/171/growth-of-the-lumber-industry-1840-to-1930
Unfortunately the seemingly ideal source is in storage at the Penn library and takes 3-4 business days to retrieve. These are “Forest products statistics of [various US regions],” compiled by R.V. Reynolds and A.H. Pierson.
Much of the earlier l iterature used the term timber. This can be used interchangeably with what we call lumber in general. http: / /www.diff erencebetween.net/object/diff erence-between-lumber-and-t imber /
i j i
PREFACE
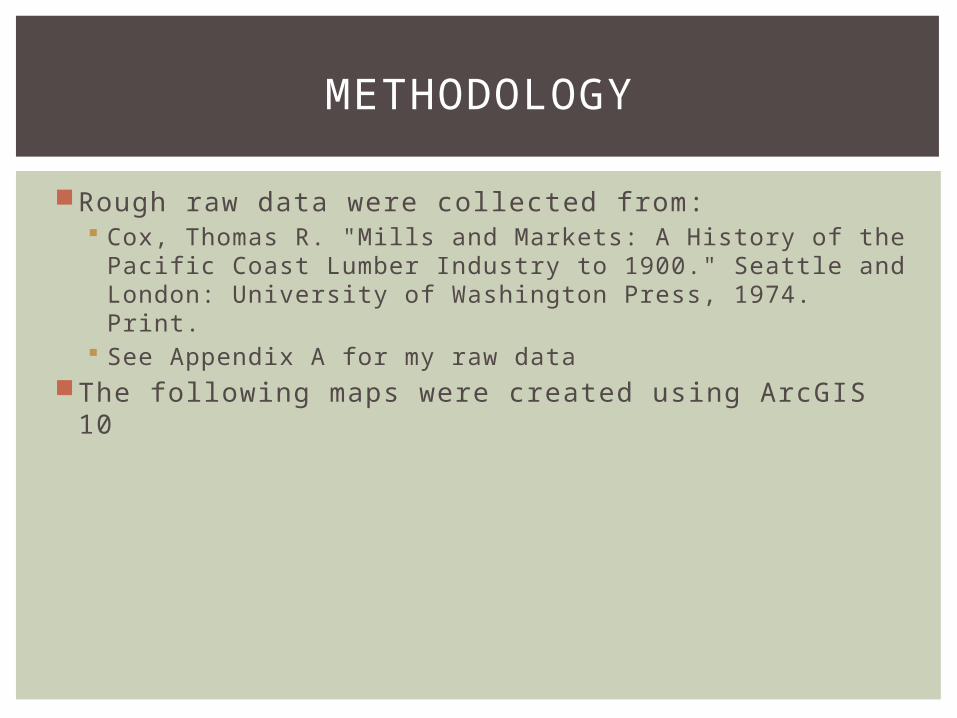
Rough raw data were collected from: Cox, Thomas R. "Mills and Markets: A History of the Pacific
Coast Lumber Industry to 1900." Seattle and London: University of Washington Press, 1974. Print.
See Appendix A for my raw dataThe following maps were created using ArcGIS 10
METHODOLOGY

The following are graduated color maps I created.
GRADUATED COLOR MAPS, 1 YEAR/SLIDE
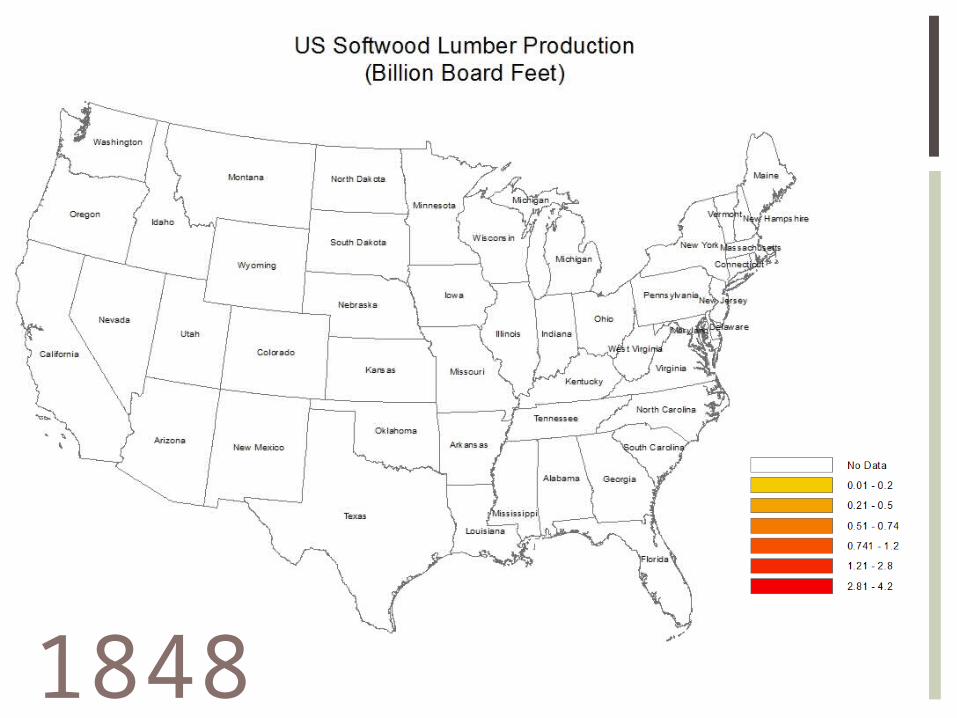
1848
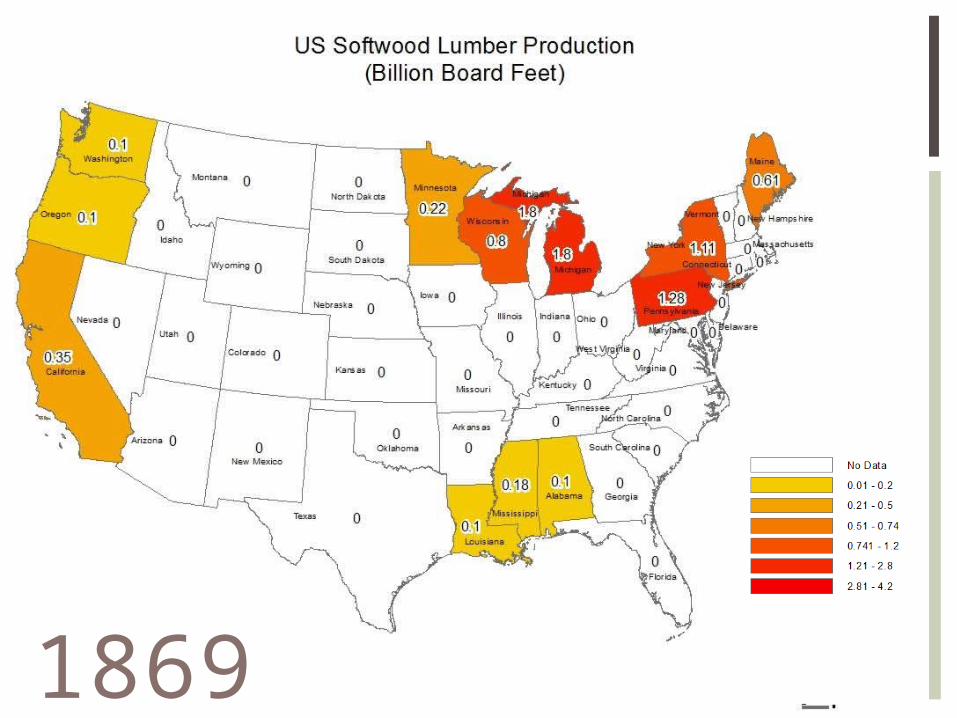
1869

1879
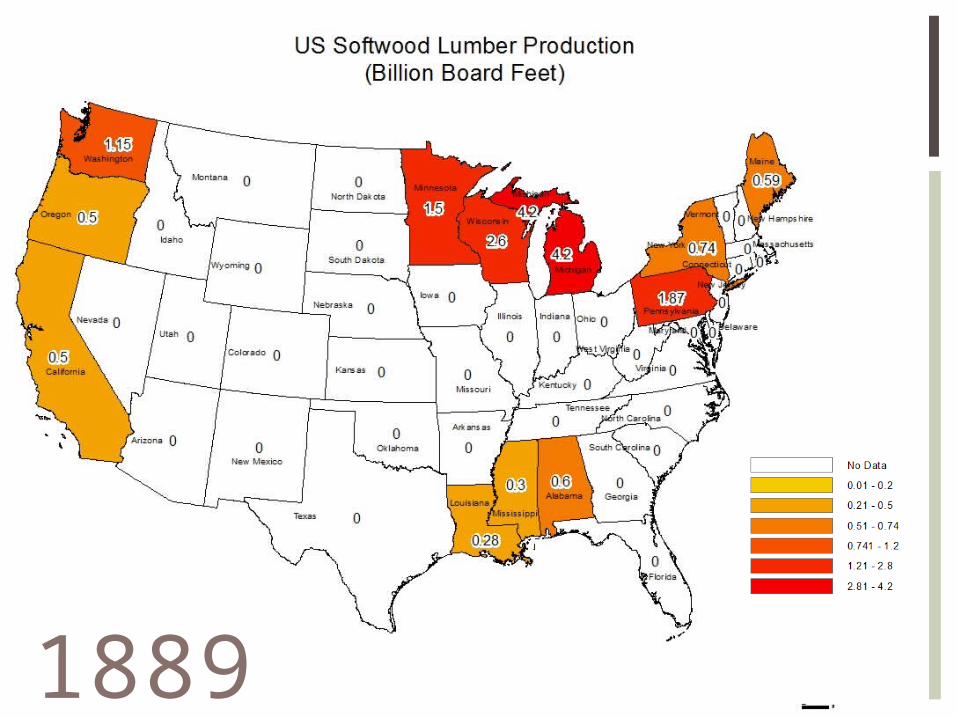
1889
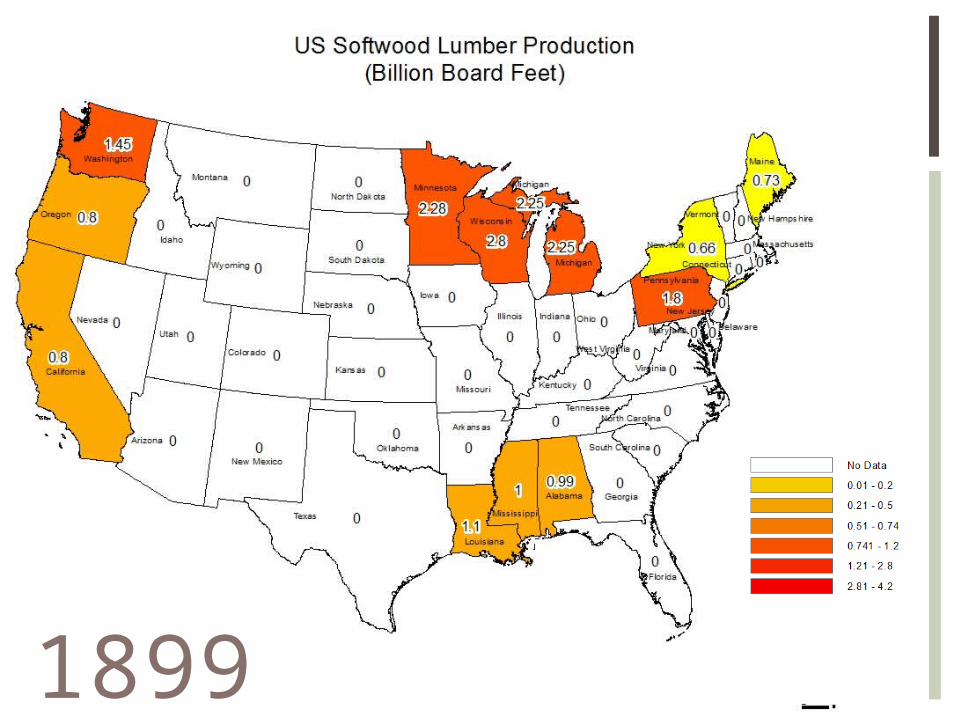
1899

The following are density dot maps, representing the same information in a diff erent way
DENSITY DOT MAPS, 1 YEAR/SLIDE
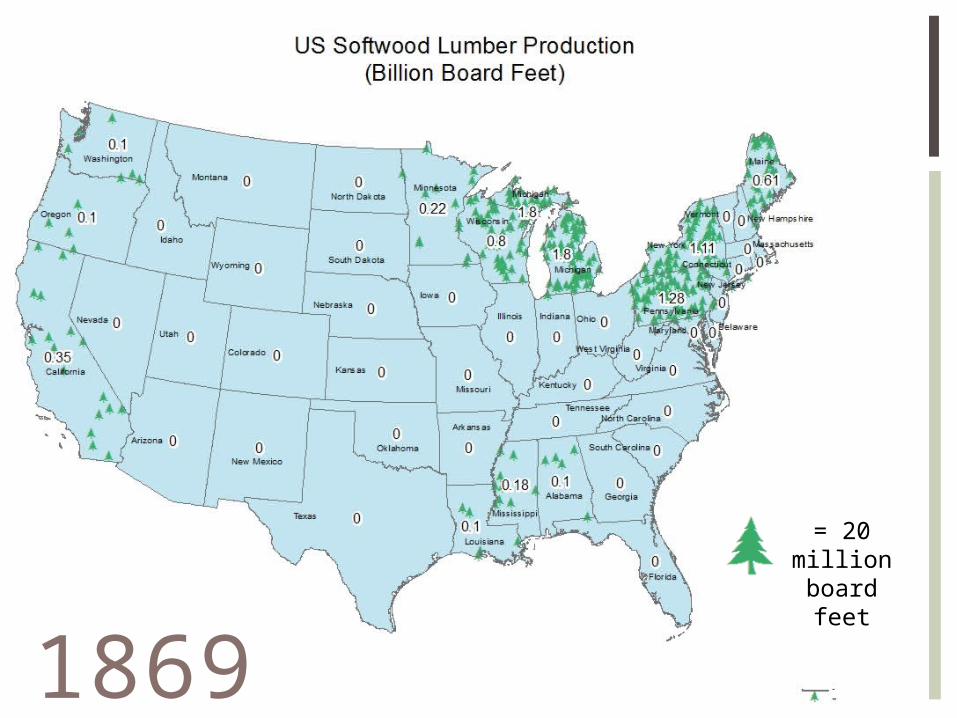
= 20 million
board feet1869

= 20 million
board feet1879
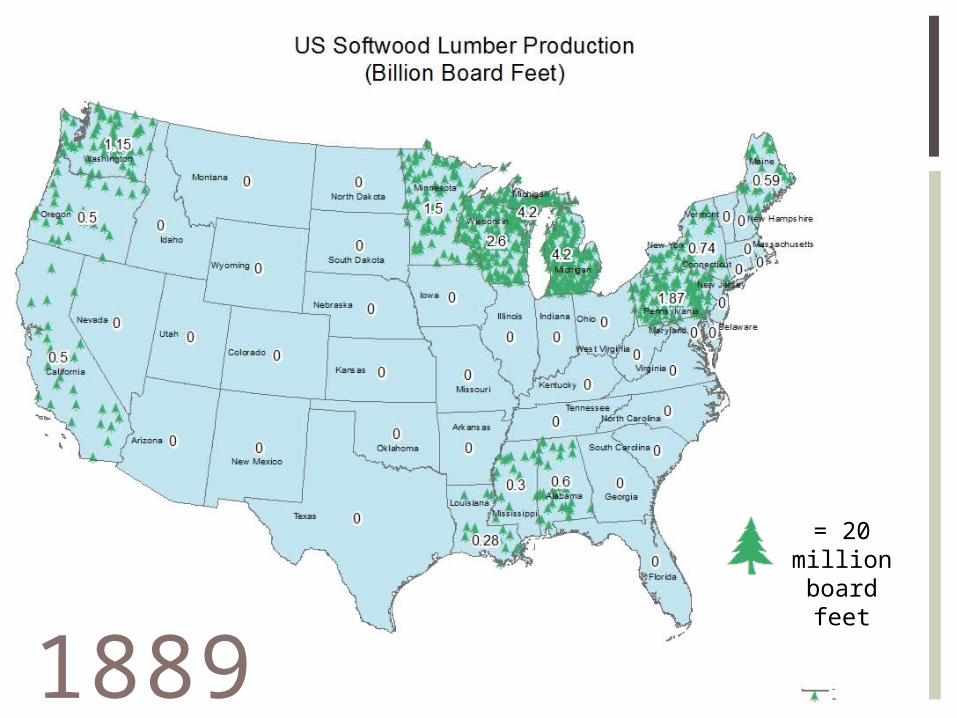
= 20 million
board feet1889

= 20 million
board feet1899
Timeline events regarding Chicago are drawn from Cronon
Other timeline events are drawn from Cox
DENSITY DOT MAPS, WITH TIMELINE

1850
1848: Chicago area dominates neighbors in softwood lumber production
1850
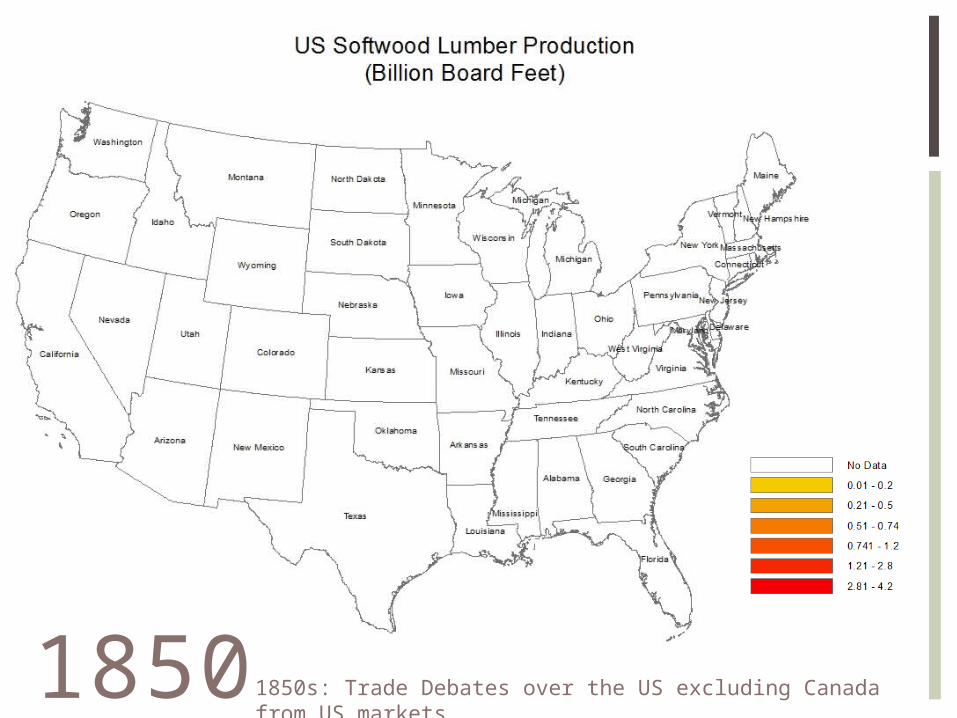
1850s: Trade Debates over the US excluding Canada from US markets

1850
1850s: Chicago lumber capital of the world (Cronon, 170). Average Chicago logging crew 15 men.
1850
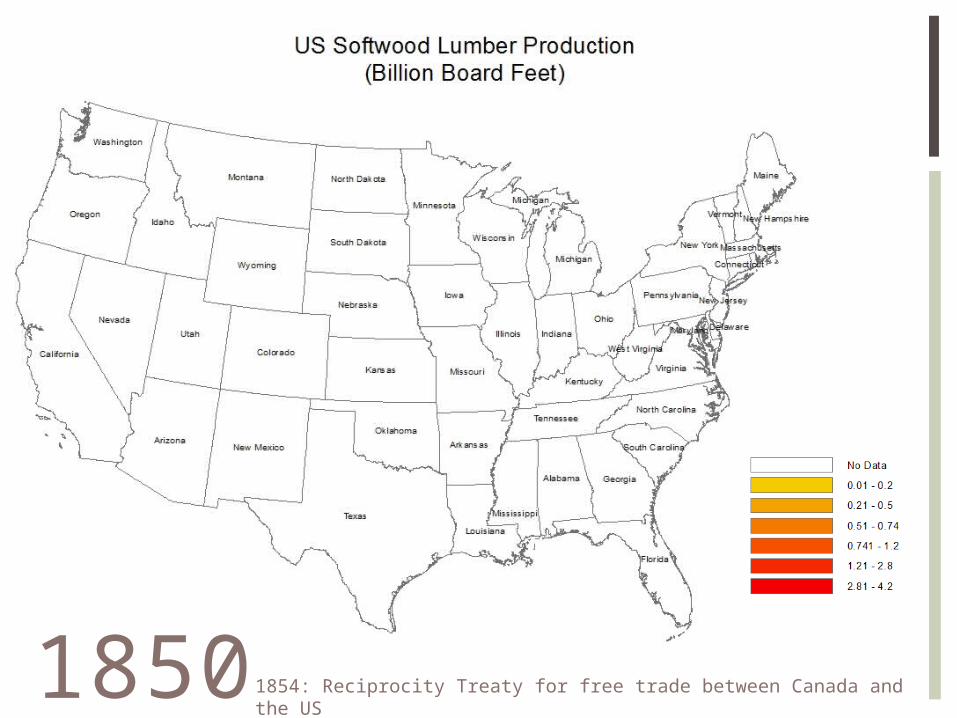
1854: Reciprocity Treaty for free trade between Canada and the US
1850
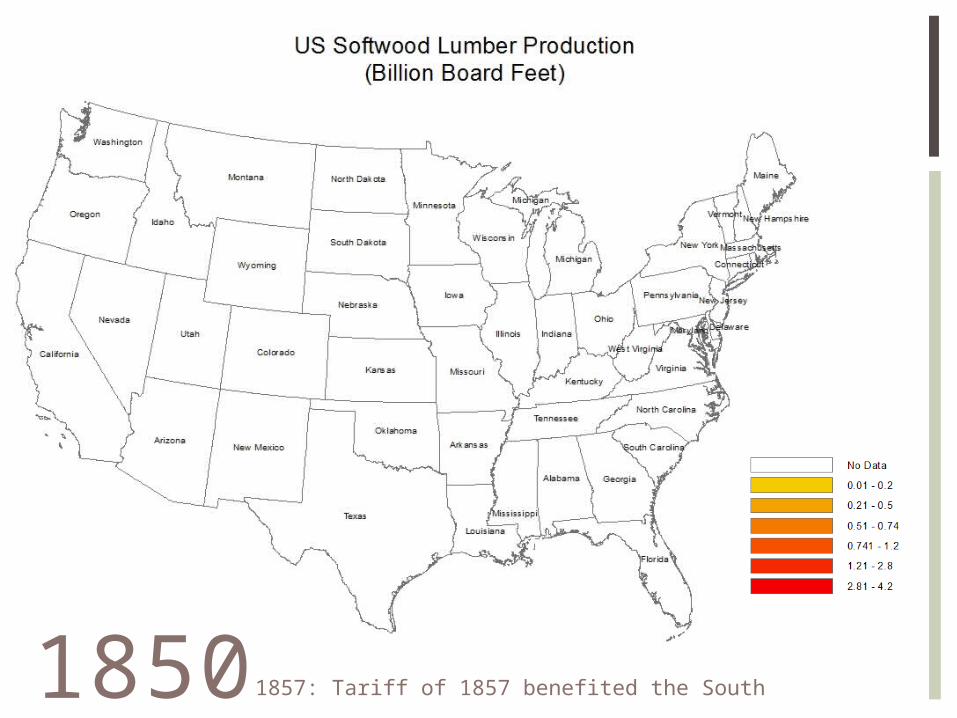
1857: Tariff of 1857 benefited the South

1850
1857: Poor Chicago economy, including lumber industry (Cronon 165)

1850
1857: Tariff of 1857 benefited the South
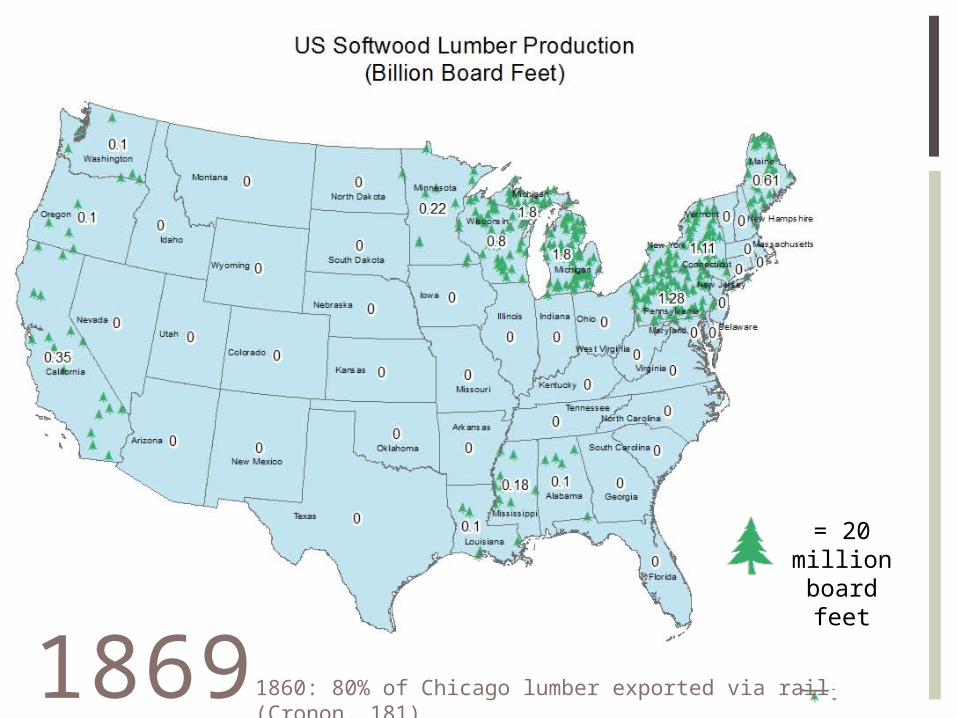
= 20 million
board feet1869
1860: 80% of Chicago lumber exported via rail (Cronon, 181)
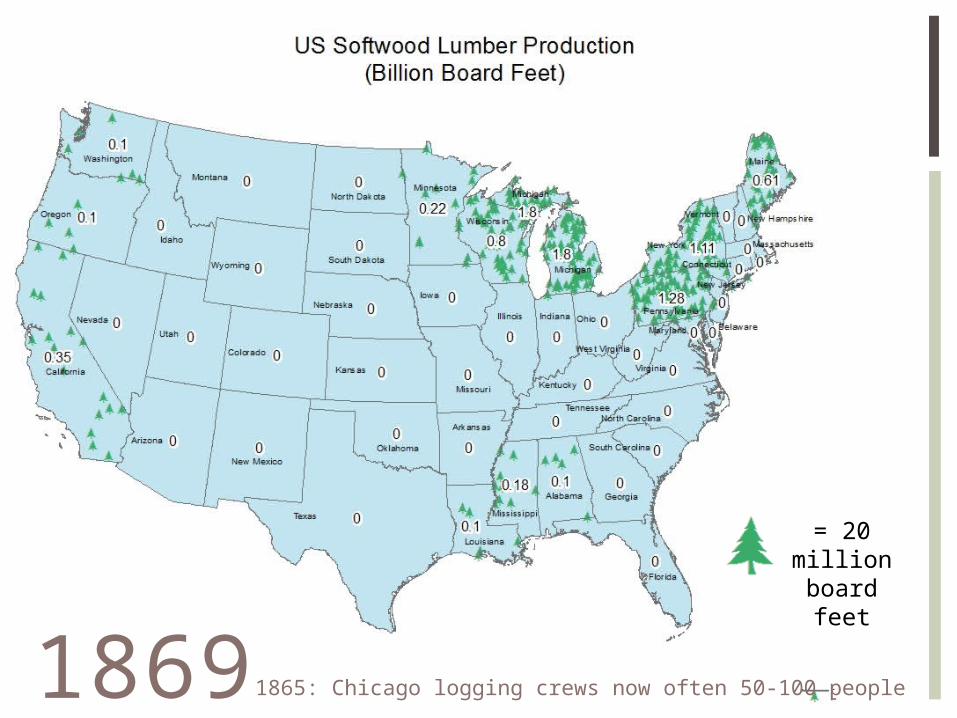
= 20 million
board feet1869
1865: Chicago logging crews now often 50-100 people
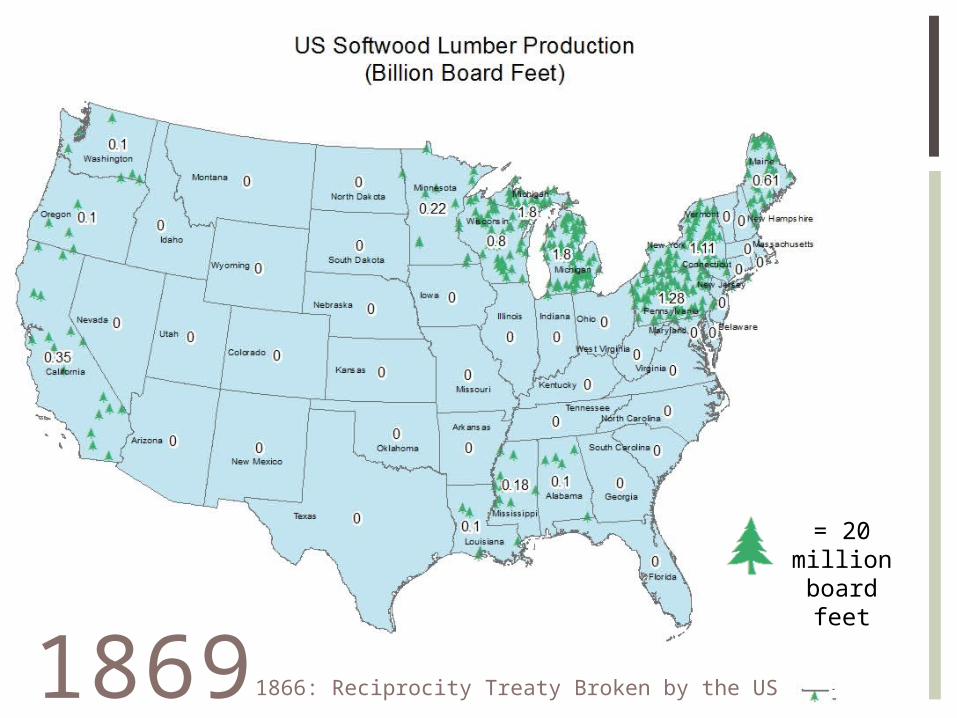
= 20 million
board feet1869
1866: Reciprocity Treaty Broken by the US

= 20 million
board feet1879
1870: Yellow pine competitor from the south makes its way to Chicago. Railroad extensively built in the South (Cronon, 196).

= 20 million
board feet1879
1870: Tariff Act: Sawlog imports placed on the free list

= 20 million
board feet1879
1870s: Chicago lumber no longer being shipped primarily by water. Industry stagnates until 1882 (Cronon, 184).
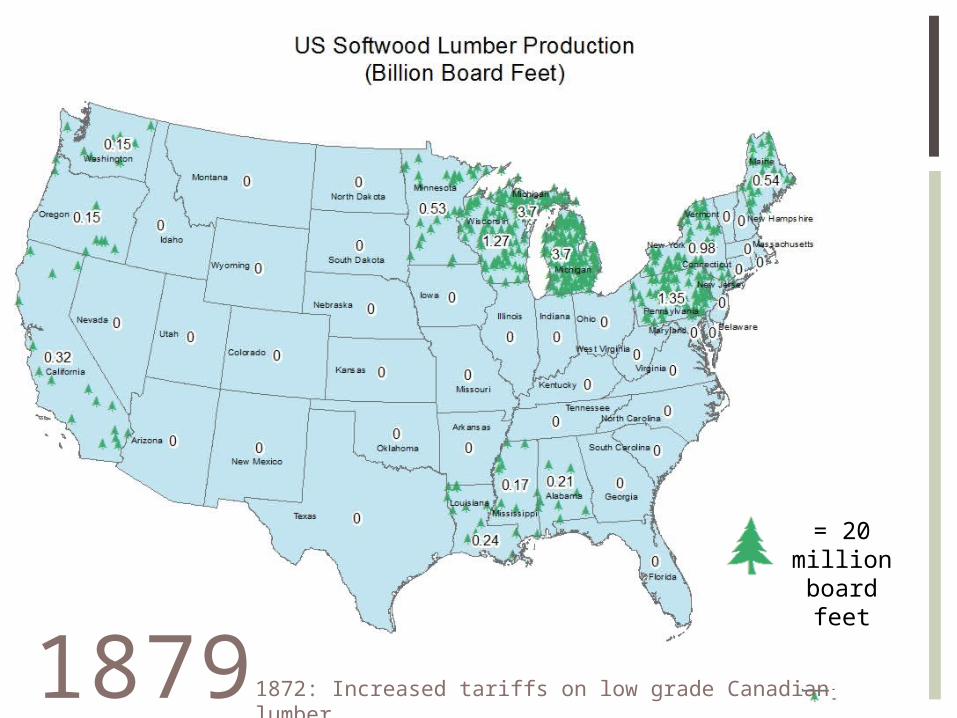
= 20 million
board feet1879
1872: Increased tariffs on low grade Canadian lumber

= 20 million
board feet1879
1873: Poor Chicago economy, including lumber industry (Cronon, 168)

= 20 million
board feet1879
1879: Chicago “holding over 400 million board feet of lumber” (Cronon, 173)
= 20 million
board feet1889
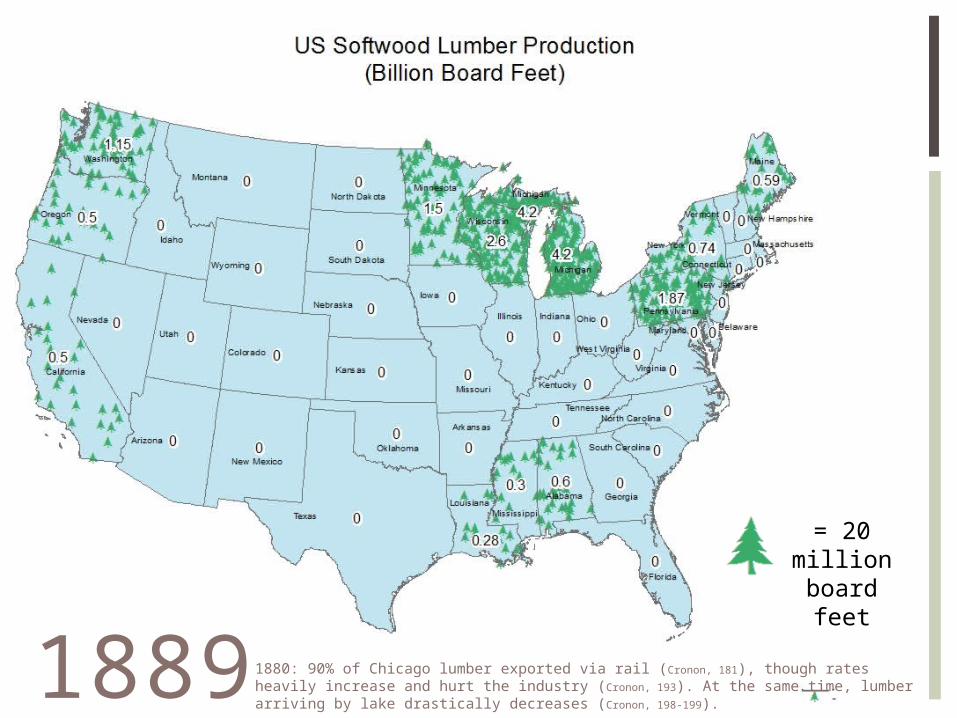
1880: 90% of Chicago lumber exported via rail (Cronon, 181), though rates heavily increase and hurt the industry (Cronon, 193). At the same time, lumber arriving by lake drastically decreases (Cronon, 198-199).

= 20 million
board feet1889
1882: Chicago lumber industry declines

= 20 million
board feet1889
1883: Morrill Tariff raised it further
= 20 million
board feet1899
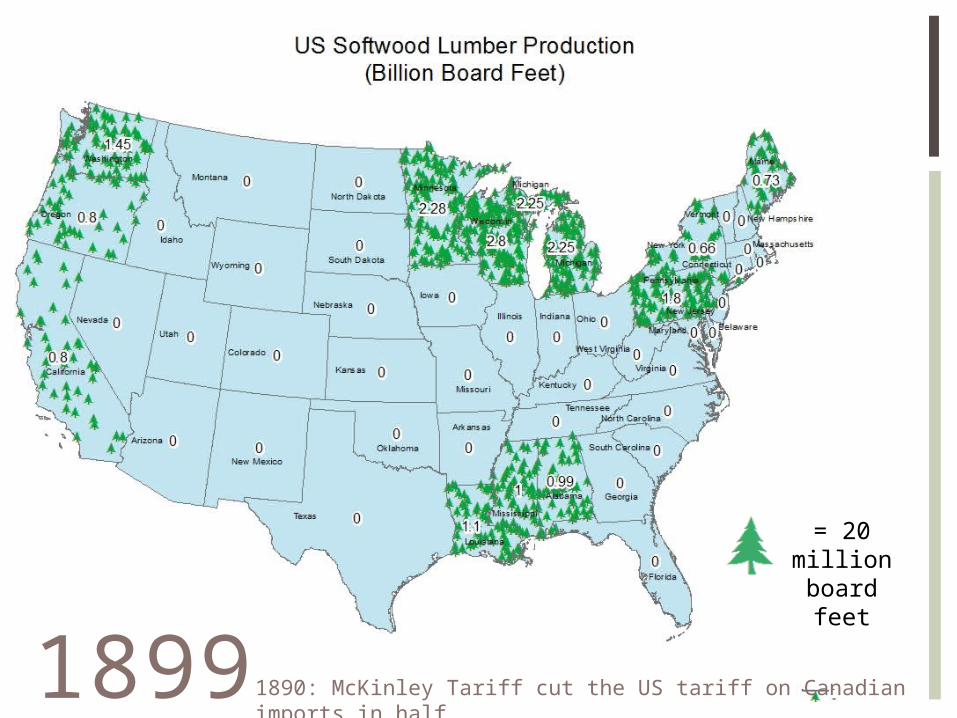
1890: McKinley Tariff cut the US tariff on Canadian imports in half

= 20 million
board feet1899
1894: Wilson Tariff restored free trade
= 20 million
board feet1899
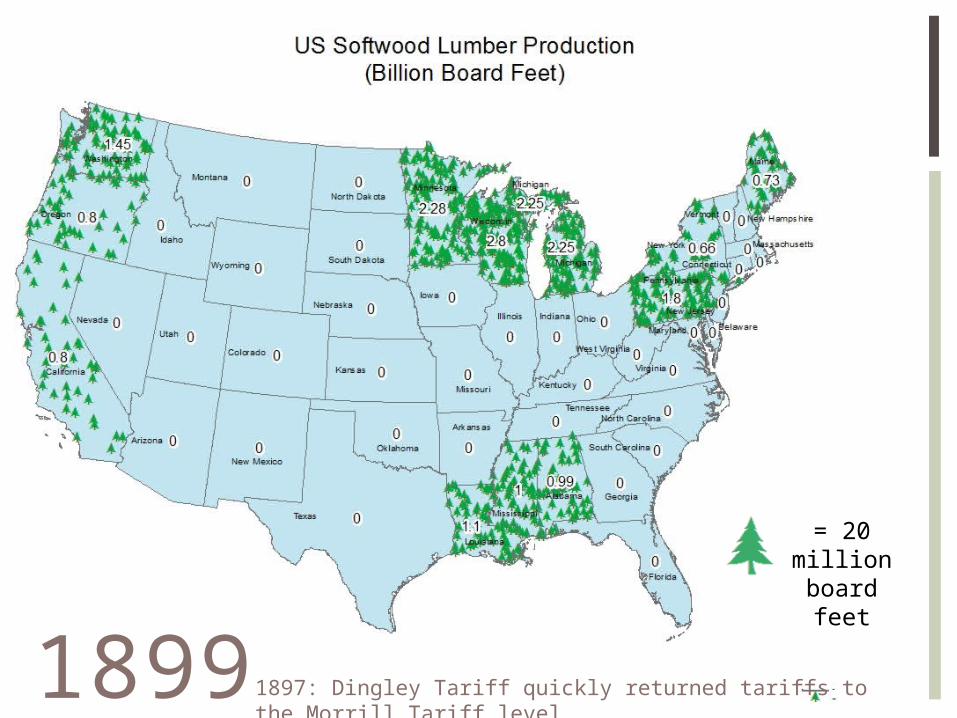
1897: Dingley Tariff quickly returned tariffs to the Morrill Tariff level
= 20 million
board feet1899
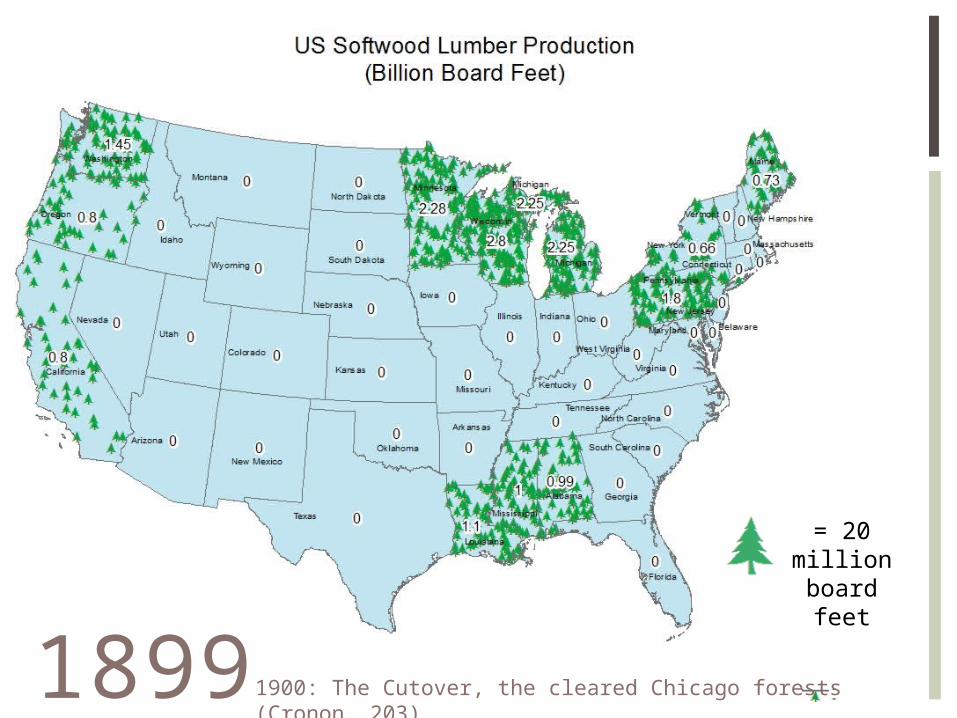
1900: The Cutover, the cleared Chicago forests (Cronon, 203).

APPENDIX A
Northeast Great Lakes South Pacific
Year MaineNew York Penn. Michigan Wiscon
Minneso
Louisian Mississ Alabam
Washing Oregon Californ
1869 0.61 1.11 1.28 1.8 0.8 0.22 0.1 0.18 0.1 0.1 0.1 0.351879 0.54 0.98 1.35 3.7 1.27 0.53 0.24 0.17 0.21 0.15 0.15 0.321889 0.59 0.74 1.87 4.2 2.6 1.5 0.28 0.3 0.6 1.15 0.5 0.51899 0.73 0.66 1.8 2.25 2.8 2.28 1.1 1 0.99 1.45 0.8 0.8
Rough raw data were collected from non-numerical graphs from: Cox, Thomas R. "Mills and Markets: A History of the Pacific
Coast Lumber Industry to 1900." Seattle and London: University of Washington Press, 1974. Print.
I estimated charts and compiled the following data:
Cox, Thomas R. "Mills and Markets: A History of the Pacific Coast Lumber Industry to 1900." Seattle and London: University of Washington Press, 1974. Print.
Cronon, William. “Nature’s Metropolis: Chicago and the Great West.” New York and London: WW Norton & Company, 1991.
Howe, Tony. “Growth of the Lumber Industry, 1840 to 1930.” Mississippi History Now, October 2nd, 2010. <http: / /mshistory.k12.ms.us/art ic les/171/growth-of- the- lumber- industry-1840-to -1930
>
WORKS CITED

http: / /www.frankl in . l ibrary.upenn.edu/cgi -b in/Pwebrecon.cgi?Search_Arg=forest%20AND%20products%20AND%20stat ist ics%20AND%20reynolds&SL=None&Search_Code=CMD&PID=orKN1DhiYK_q9j3L1WLp5VoC5_0B&SEQ=20101005020814&HIST=1&CNT=50+records+per+page&DB=local
http: / /www.diff erencebetween.net /object /d iff erence-between- lumber-and-t imber/ http: / /sofew.cfr.msstate.edu/papers/0704luppold.pdf http: / /www.mnsu.edu/emuseum/history/mnstatehistory/ t imel ine.html http: / /www.archive.org/stream/monthlycatalogof451939unit /monthlycatalogof45193
9uni t_djvu. txt http: / /en.wik ipedia.org/wik i /Morr i l l _Tar iff http: / /en.wik ipedia.org/wik i /Tar iff _of_1857 http: / /www. l ibrary. for.gov.bc.ca/ ipac20/ ipac. jsp?sess ion=T2862472O7693.2331789
&profi le=mof&source=~!forest&view=subscr ipt ionsummary&ur i=ful l=3100001~!6488~!6&ri=1&aspect=basic_search&menu=search&ipp=20&spp=20&staff only=&term=USDA+Stat ist ica l+Bul let in&index=&uindex=&aspect=basic_search&menu=search&ri=1
http: / /www.ehow.com/how_5174262_calculate-mbf- lumber.html
OTHER WORKS CONSULTED