hiroshima j. med. sci. · 2015. 10. 8. · hiroshima j. med. sci. vol. 57, no. 3·4, 85-92,...
TRANSCRIPT
Hiroshima J. Med. Sci. Vol. 57, No. 3·4, 85-92, December, 2008 HIJM57-12
How Valid Is the Self-Administered Visual Analogue Scale for Assessing the Health Status of Elderly People?
Tomoaki KIMURA1,*), Kenshi HAYASHIDA2), Yoshimitsu ARAKI1),
Takako MORITA1), Noboru YAMAGUCHP) and Akira EBOSHIDA1) 1) Department of Public Health and Health Policies, Graduate School of Biomedical Sciences, Hiroshima
University, 1-2-3 Kasumi, Minami-ku, Hiroshima 734-8551, Japan 2) Department of Healthcare Economics and Quality Management, School of Public Health, Kyoto
University, Konoe-cho, Yoshida, Sakyo-ku, Kyoto 606-8501, Japan 3) Mitsugi General Hospital, 124 Ichi, Mitsugi, Onomichi, Hiroshima 722-0393, Japan
ABSTRACT The population of Japan is aging rapidly, and maintaining the quality of life of elderly people
has become an important issue in contemporary Japan. This study was conducted to verify the validity of the self-administered visual analogue scale (VAS) for assessing the health status of elderly people. A survey was conducted in two villages in western Japan in 2003. A total of 2040 participants, aged between 60 and 75 years, completed questionnaires comprising the VAS and six Likert-type items for health status, physical strength, life enjoyment, appetite, sleep, and life satisfaction. Data of the valid participants who properly completed both the VAS and the Likert-type item on health status were analyzed (n=1579, 77.4%). Among the Likert-type items, the VAS score was the most associated with health status (r = 0.532), followed by physical strength (r = 0.509). The VAS score showed a weak negative correlation with age (r = -0.130), but no association with socioeconomic factors such as the number of family members or annual income. The correlations between the VAS and the Likert-type item on health status varied between categories in some attributes. Since the VAS score was moderately correlated with similar questions about health status in the Likert-type health questionnaire, it was considered that the VAS is a valid self-administered instrument for collecting data on the health status of elderly people. However, further investigations need to be conducted to improve the VAS and to establish better explanations for aged respondents.
Key words: Health for the elderly, Quality of life, Questionnaire, Visual analogue scale
85
The population of Japan is rapidly aging, and elderly single people, as well as families consisting solely of elderly couples, are increasing. Health promotion for the elderly should be conducted with consideration for the quality of life9).
Maintaining the quality of life is essential for the self-reliance of elderly people. In the broad sense of the term, quality of life includes all areas of life such as environment, finance, personal relations and health. Health-related quality of life, with its focus on public health and medical outcome research, is considered to be a sub-category of quality of life13).
Quality of life is usually measured using questionnaires with Likert-type response formats and verbal categories. Examples of such scales are the WHO-QOL15) and the 36-Item Short Form Health
Survey (SF-36)16l. In addition to these instruments, visual analogue scales (VAS), originally developed in the Scott Co. Laboratory in 19204,5),
are occasionally used for the assessment of health status. Traditionally, the VAS, which is known as a graphic rating scale, has been used for measuring feelings such as mood and pain. The original scale combined a sentence and a straight line. Using this scale, the respondents, or raters, could make very fine discriminations. Hayes et al5) have demonstrated the test-retest reliability of the scale. It is also considered to have statistical advantages over Likert-type questionnaires with a 4-point scale6). Since VAS scores have an interval scale, parametric statistical techniques such as analysis of variance and linear regression analysis can be used for the analysis of data. Moreover, if the fre-
*Corresponding author: Department of Public Health and Health Policy, Graduate School of Biomedical Sciences, Hiroshima University, 1-2-3 Kasumi, Minami-ku, Hiroshima 734-8551, Japan. Tel: +81-82-257-5166, Fax: +81-82-257-5169 E-mail: [email protected]
86 T. Kimura et al
quency distribution of VAS scores is skewed, it can be improved toward normality by arcsin transformation2). VAS has also been integrated into the EuroQol, a health utility measure14).
If specialists use VAS as raters, the scores can be accurate and reliable, as has been demonstrated for parent behavior3) and behavior of the elderly11). However, the elderly are unfamiliar with the VAS and its validity has not been established with them. Some elderly persons may misunderstand the meaning of the questions, and how to respond to them. The validity of VAS can vary between genders and age groups, but despite its importance, very few investigations have been conducted on this issue. The objective of this study is to verify the validity of self-administered VAS for assessing the health status of elderly people in Japan.
METHODS
We reevaluated the results of a health survey of an aging community conducted from July to November 2003 at two rural villages located in Yamaguchi (Y) and Hiroshima (H) Prefectures in western Japan8). The average age of residents in these villages has been increasing, because the major industry is agriculture and few large companies or factories are located nearby, which has resulted in the movement of younger people to urban or industrial areas. The survey was conducted to identify health status and physical strength for longevity, health practices, and the need for health policies for elderly people. We used and analyzed a part of the survey to verify the validity of self-administered VAS.
Subjects Participants of this survey were insured under
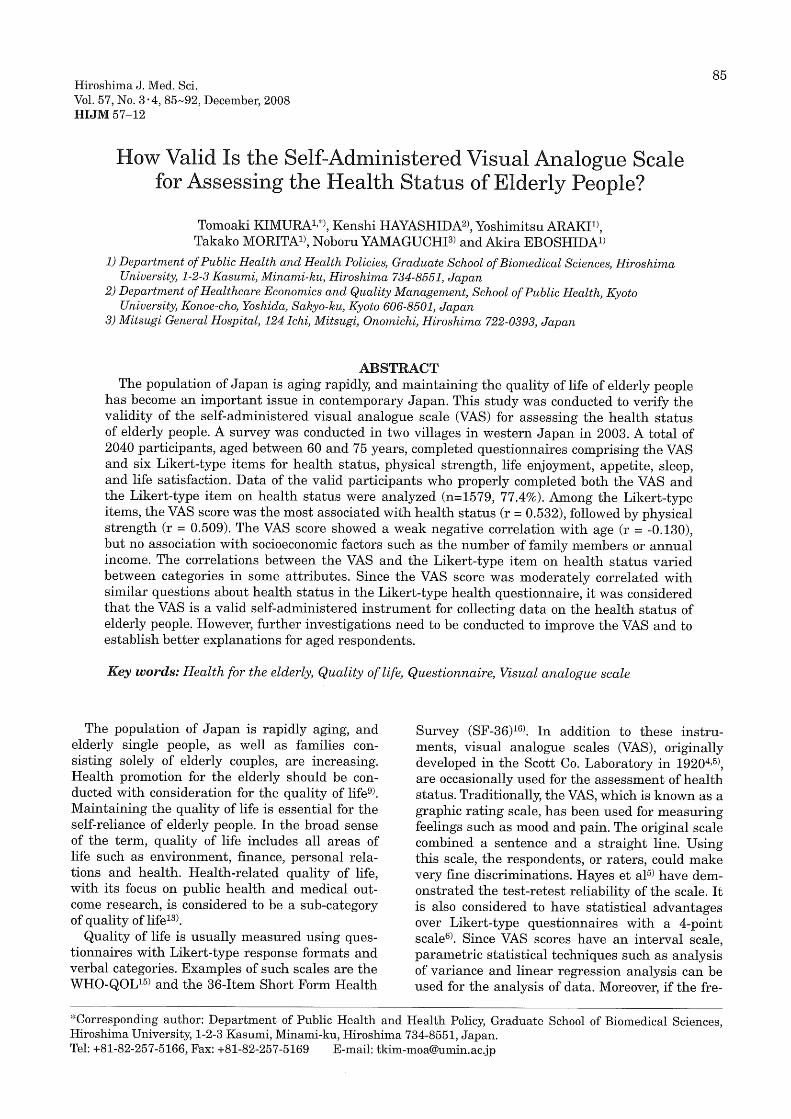
the national health insurance and aged from 60 to 75 years. At Y-area, questionnaires were handed to all subjects and returned, whereas, at H-area, they were handed to half of subjects, selected at random. The number of initial subjects was 2571, and the number of questionnaires returned was 2328. After excluding invalid questionnaires (blank, lack of gender or age data), the number of valid participants was 2040, which was 79.3% of the initial subjects (see Fig. 1).
Questionnaires The participants completed questionnaires com
prising both the VAS for the assessment of health status and six Likert-type items for health status, physical strength, life enjoyment, appetite, sleep, and life satisfaction. Since elderly people were considered to be familiar with the traditional Likert-type questionnaire, the VAS was compared with this reliable measure. When the VAS is valid, the correlation between the VAS and the Likert-
type questionnaire, measuring the same concept of health status, is predicted to be stronger than that between the VAS and other associated items. If not, a negative result would imply that a valid assessment of health status could not be performed by the VAS.
The direction for the VAS was "please make an X mark on the line below for your health status at present." The length of the VAS was 10 cm, and it was divided at 1 cm intervals into an 11-point scale. The range of the scores was from 0 to 10. The left end of the line indicated the poorest health; the right end the best health; with the mid-point also indicated (see Appendix 1). Respondents could mark the level of their health status either on the scale divisions or between them. The score was measured by the distance from the left end of the scale to one decimal place.
The Likert-type items related to the self-assessments of the participants were: (1) health status; (2) physical strength; (3) life enjoyment; (4) appetite; (5) sleep; (6) life satisfaction (see Appendix 2). Each of these items offered four choices, and the participants had to choose one only. The correlation between the VAS and the Likert-type item on health status was examined to verify the construct validity of the VAS. The other five Likert-
Initial subjects n = 2571 (Y: 1573, H: 818)
~ Uncollected questionnaires (n = 243)
Collected questionnaires n = 2328 (Y: 1568, H: 760)
~ Invalid questionnaires (n = 288)
Valid participants n = 2040 (Y: 1384, H: 656)
~ Invalid VAS (n = 445)
~ Invalid only Likert-type item (n = 16)
Dataset for analysis n = 1579 (Y: 1043, H: 536)
Fig. 1. Diagram indicating the formation of the dataset for analysis from the initial subjects. (Y: Yamaguchi Prefecture, H: Hiroshima Prefecture)

VAS for Assessing Health Status of Elderly 87
Please make an X mark on the line below for your health status at present. (The line is an 11-point scale.)
Poor health Medium Good health
Appendix 1. Visual analogue scale for health status used in this study
1. health status
How do you feel about your health status?
2. physical strength
How do you feel about your physical strength?
3. life enjoyment
Are you enjoying your life?
4. appetite
Do you enjoy your meals?
5. sleep
Do you get enough sleep every day?
6. life satisfaction
Are you satisfied with your daily life?
Appendix 2. Likert-type items of health-related questionnairet t All items have four choices. The original questionnaire was written in Ja panes e. This English version was prepared for this manuscript and the accuracy of the translation has not been validated.
type items related to health status were assumed to correlate with the VAS for health status. Socioeconomic data including family members, occupation, education and annual income were also collected for this study, as potential confounding factors.
Statistical analysis Data of the participants who properly com
pleted both the VAS and the Likert-type item on health status were analyzed (n=1579, 77.4% of the valid participants; see Fig. 1). Among the valid participants, 445 people did not respond to the VAS. The dataset consisted of 701 men and 878 women. Mean age of all subjects was 67.5 (standard deviation: 4.2). Frequencies of the VAS scores and other items were examined. The VAS scores were also arcsin transformed to confirm the previous study2), mentioned in the introduction. In the present study, however, raw scores of the VAS were used for the subsequent non-parametric analysis, because the VAS data were compared with ordinal data. We examined the associations
between the VAS score and responses to each Likert-type question related to health status. The associations between the VAS score and socioeconomic factors were also analyzed. Spearman's correlation coefficients were used for the analysis of these associations. The coefficients were compared between genders, between age groups, and between categories in other attributes. Statistical significance was set at p < 0.05. The strength of correlation was defined as follows: (1) coefficient~ 0.6 is strong; (2) ~ 0.4 is moderate; (3) ~ 0.2 is weak; (4) < 0.2 is very weak or none. These analyses were conducted using SPSS for Windows, version 13.0.
RESULTS
Basic attributes. of the participants for analysis are shown in Table 1. There was no statistically significant difference between the two villages in gender or age, but in the socioeconom:ic data, including family members, occupation, education and annual income, significant differences were found. This study was not aimed to compare the two villages. A larger sample size provides a more reliable result for statistical analysis. Therefore, the subsequent analyses were conducted as a single sample. Single elderly people constituted 8.8% and people living only with their spouses 50.6%. Almost half of the participants (48.1 %) were unemployed, and the majority of people with an occupation were employed in agriculture and forestry (n=522, 36.0%). People with a 9-year education constituted 40.8%, and those with a 12-year education 49.1%. Of the participants, 84.2% earned an annual income below 3 million yen (about $25,000).
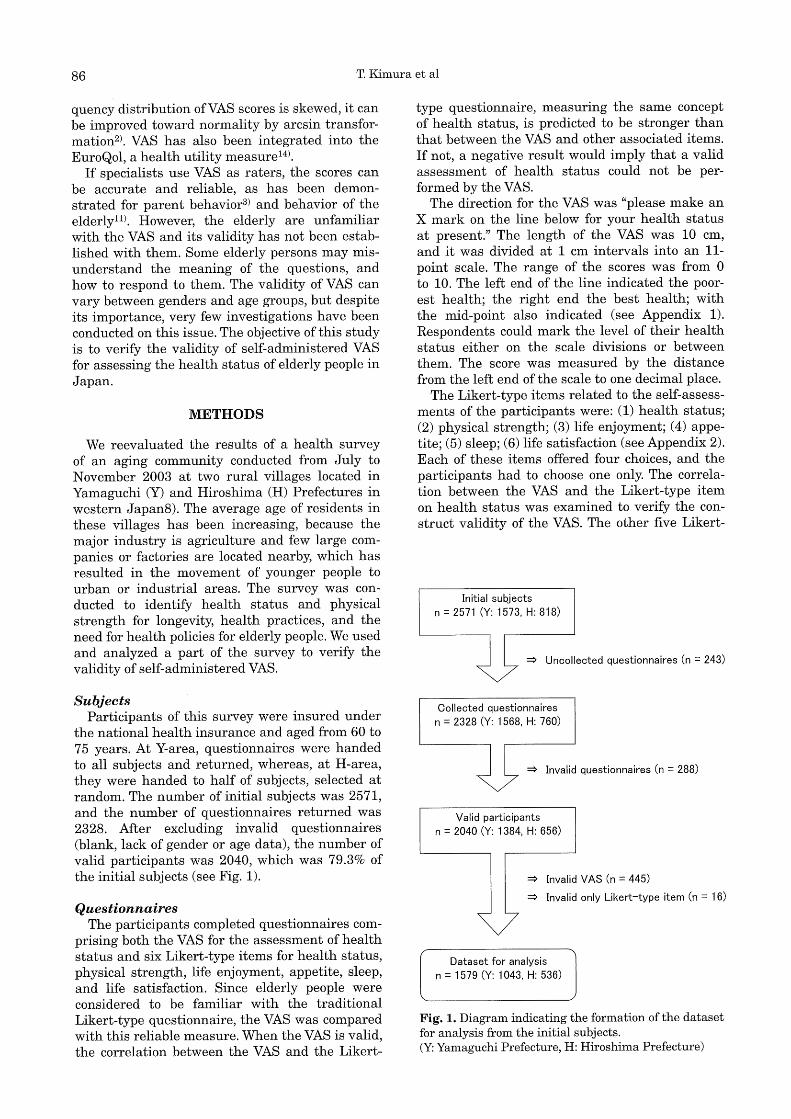
The distribution of the VAS scores is shown in Fig. 2. The mean VAS score was 6.4 (standard deviation: 2.4). The mode was 5.0, and 90.9% of the data were integers. The frequency distribution of the scores was skewed and they were improved toward an almost normal distribution by using arcsin transformation. There was a very weak negative correlation between the VAS score and age (r = -0.130), but no significant differences in the VAS score were found between the two villages.
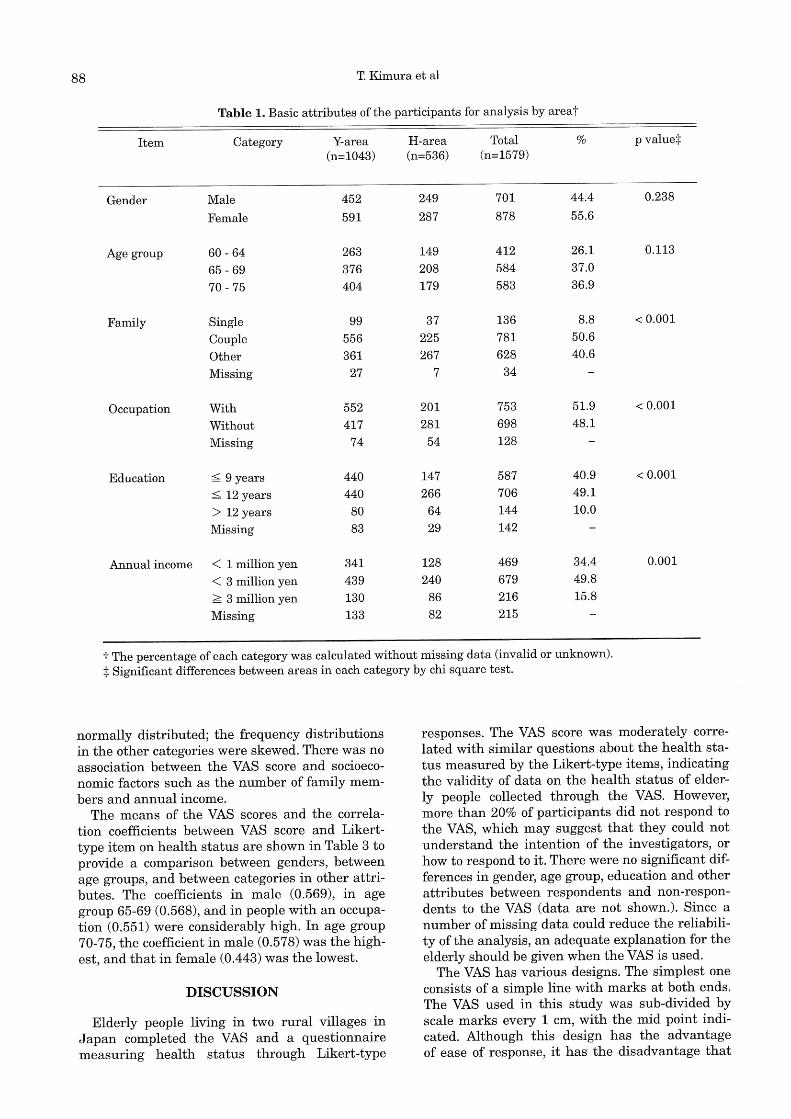
Correlations between the VAS score and Likerttype questionnaire items are shown in Table 2. This table includes the correlations between the Likert-type item on health status and other items. It can be seen that the VAS score was the most closely associated with health status (r = 0.532), followed by physical strength (r = 0.509) among the Likert-type items. Fig. 3 shows the distribution histograms of VAS scores by response to the Likert-type item on health status. The VAS scores in the third category 'poor for health status' as the response to the Likert-type item were almost
88 T. Kimura et al
Table 1. Basic attributes of the participants for analysis by areat
Item Category Y-area H-area Total % p value:j:
(n=l043) (n=536) (n=1579)
Gender Male 452 249 701 44.4 0.238
Female 591 287 878 55.6
Age group 60 - 64 263 149 412 26.1 0.113
65 - 69 376 208 584 37.0
70 - 75 404 179 583 36.9
Family Single 99 37 136 8.8 < 0.001
Couple 556 225 781 50.6
Other 361 267 628 40.6
Missing 27 7 34
Occupation With 552 201 753 51.9 < 0.001
Without 417 281 698 48.1
Missing 74 54 128
Education ~ 9 years 440 147 587 40.9 < 0.001
~ 12 years 440 266 706 49.1
> 12 years 80 64 144 10.0
Missing 83 29 142
Annual income < 1 million yen 341 128 469 34.4 0.001
< 3 million yen 439 240 679 49.8
~ 3 million yen 130 86 216 15.8
Missing 133 82 215
t The percentage of each category was calculated without missing data (invalid or unknown).
:j: Significant differences between areas in each category by chi square test.
normally distributed; the frequency distributions in the other categories were skewed. There was no association between the VAS score and socioeconomic factors such as the number of family members and annual income.
The means of the VAS scores and the correlation coefficients between VAS score and Likerttype item on health status are shown in Table 3 to provide a comparison between genders, between age groups, and between categories in other attributes. The coefficients in male (0.569), in age group 65-69 (0.568), and in people with an occupation (0.551) were considerably high. In age group 70-75, the coefficient in male (0.578) was the highest, and that in female (0.443) was the lowest.
DISCUSSION
Elderly people living in two rural villages in Japan completed the VAS and a questionnaire measuring health status through Likert-type
responses. The VAS score was moderately correlated with similar questions about the health status measured by the Likert-type items, indicating the validity of data on the health status of elderly people collected through the VAS. However, more than 20% of participants did not respond to the VAS, which may suggest that they could not understand the intention of the investigators, or how to respond to it. There were no significant differences in gender, age group, education and other attributes between respondents and non-respondents to the VAS (data are not shown.). Since a number of missing data could reduce the reliability of the analysis, an adequate explanation for the elderly should be given when the VAS is used.
The VAS has various designs. The simplest one consists of a simple line with marks at both ends. The VAS used in this study was sub-divided by scale marks every 1 cm, with the mid point indicated. Although this design has the advantage of ease of response, it has the disadvantage that

VAS for Assessing Health Status of Elderly 89
i:)' c: Q) :::l
400
300
g 2[1[1
Li:
'JOO
Mean: 6.4 Median: 7.0 Skewness: -0.53 Kurtosis: -0.11
2 3 5
VAS scores for health status
400
300
'100
0
Mean: 0.76 Median: 0.78 Skewness: 0.46 Kurtosis: 0.02
Cl.Cl 0.2 0.4 0.6 0.8 ·1.0 ·1.2 '1.4 ·1.6
VAS scores by arcsin transformation
Fig. 2. Distribution histograms of visual analogue scale (VAS) scores for health status (left)t and VAS scores by arcsin transformation (right)+ t The range of VAS scores is from 0 to 10. + Arcsin transformation improved the distribution of VAS toward almost normal distribution. This histogram shows that the median was close to the mean, the kurtosis was close to 0, but the skewness was relatively high. (In the standard normal distribution, the median should be equal to the mean; the skewness and the kurtosis should be 0.)
responses tend to get centered around the mid point and at scale marks, which is not an optimal condition for parametric statistical analysis. However, by using arcsin transformation, the distribution can be brought close to a normal distribution curve, when parametric statistical analysis needs to be conducted.
The VAS was most similar to the health status item in the Likert-type questions, and the two had the strongest correlation. The VAS was also associated with physical strength and other items. This study demonstrated the construct validity of the VAS for assessing health status. Kuroda et aF> have clarified a close correlation between the VAS score and utility score in the EuroQol. Our results corroborated this finding.
The correlation between the VAS and the Likert-type item in males was higher than that in females, especially in the age group 70-75. This result suggested that aged men maintain the ability to answer correctly. In the youngest age group 60-64, however, there was the lowest correlation, which needs to be interpreted from the viewpoint of generation rather than age. Since there was no difference in the correlations between education levels, individual differences may be larger than differences by factors. A previous study12> demonstrated that the anxiety and depression scale was associated with VAS in 61 % of the subjects. Although our study cannot be compared with this previous study, our results indicate the importance of more detailed and well-designed research
Table 2. Correlations between visual analogue scale (VAS) score and Likert-type itemst
VAS of Likert-type Likert-type item health status health status
Health status 0.532 Physical strength 0.509 0.648 Life enjoyment 0.387 0.403 Appetite 0.354 0.295 Sleep 0.272 0.260 Life satisfaction 0.300 0.263
t Spearman's correlation coefficients are shown. All coefficients were significant. (p < 0.001)
on the validity ofVAS. There are some limitations to this study. First,
the sample used was not representative of elderly people in Japan. Second, both the VAS and the Likert-type questions were original, and were not compared with a more valid and frequently-used questionnaire or other forms of the VAS. Third, the leading question occasioned by repeating similar items for health status and the order of the questions may have offered the results of this study. Despite these limitations, the results of this study suggest that the VAS could be a promising self-administered instrument for assessing the subjective health status of the elderly.
90 T. Kimura et al
70
60
50
~ @ 40 :::l C" IJj
U:: 30
~ c: Q.) ::J
20
'100
80
C" 60 e l.l..
40
20
Mean: 8.4 Median: 9.0 Skewness: -2.29 Kurtosis: 6.08
2 3
Mean: 5.1 Median: 5.0 Skewness: -0.09 Kurtosis: 0.35
2
5 7 10
j b) Good for health status
250
200
>. g '150 IJj :::l C" IJj
U:: 100
50
Mean: 7.0 Median: 7.0 Skewness: -0.67 Kurtosis: 0.56
j d) Very poor for health status
25
20
>. g ·15 IJj :::l C" e
w.. ·to
5 6 7
Mean: 2.6 Median: 3.0 Skewness: 0.32 Kurtosis: -0.22
10
7 9 10
Fig. 3. Distribution histograms of visual analogue scale (VAS) scores for health status by response to Likerttype item on health statust t The range ofVAS scores is from 0 to 10. t In this category, data were almost normally distributed among the four categorie~. This histo.gram s.hows that the median was close to the mean, the skewness was close to 0, but the kurtosis was relatively high. (In the standard normal distribution, the median should be equal to the mean; the skewness and the kurtosis should be 0.)
This study was not the first attempt to use the VAS with the elderly. Other studies using the VAS to determine the health status of elderly people have been conducted in clinical settings1) and in community-based settings10). However, in these studies, the VAS was not completely self-administered. Future tasks include comparing various designs of the VAS, improving the VAS to make it more acceptable as an instrument for the assessment of elderly people's health, and combining VAS with other scales. Moreover, better explanations of the use of the VAS for aged respondents and caregivers need to be established.
ACKNOWLEDGMENTS
We are grateful to the participants and local officials of the two villages who cooperated with this study. We also wish to express our sincere thanks to the people who helped to conduct this survey and to Professor Masayuki Kakehashi of Hiroshima University for his helpful suggestions.
This study was supported by a scientific research grant of the Ministry of Education, Culture, Sports, Science and Technology in Japan.
(Received March 3, 2008) (Accepted June 25, 2008)

VAS for Assessing Health Status of Elderly 91
Table 3. Means of visual analogue scale (VAS) scores and correlations between VAS score and Likert-type item on health status in each categoryt
Item Category Mean (SD) Coefficient
Whole sample 6.4 (2.4) 0.532
Area Yamaguchi (Y) 6.4 (2.3) 0.543 Hiroshima (H) 6.5 (2.5) 0.513
Gender Male 6.3 (2.4) 0.569 Female 6.5 (2.3) 0.499
Age group* 60- 64 6.9 (2.2) 0.484 Male 6.9 (2.4) 0.514
Female 6.8 (2.1) 0.461 65 - 69 6.5 (2.4) 0.568
Male 6.4 (2.5) 0.567 Female 6.5 (2.4) 0.569
70 - 75 6.0 (2.4) 0.515 Male 5.9 (2.4) 0.578
Female 6.1 (2.4) 0.443
Occupation** With 6.6 (2.3) 0.551 Without 6.2 (2.4) 0.506
Education* ~ 9 years 6.1 (2.5) 0.510 ~ 12 years 6.6 (2.3) 0.533 > 12 years 6.8 (2.2) 0.520
t Spearman's correlation coefficients are shown. All coefficients were significant. (p < 0.001) *The VAS scores were significantly different between categories. (p < 0.001; Kruskal-Wallis test) **The VAS scores were significantly different between categories. (p < 0.001; Mann-Whitney test)
REFERENCES
1. Ahlsio, B., Britton, M., Murray, V. and Theorell, T. 1984. Disablement and quality of life after stroke. Stroke 15: 886-890.
2. Aitken, R.C.B. 1969. Measurement of Feelings Using Visual Analogue Scale. Proc. R. Soc. Med. 62: 989-993.
3. Champney, H. 1941. The measurement of parent behavior. Child Development 12: 131-166.
4. Freyd, M. 1923. The Graphic Rating Scale. J. Educ. Psycol. 14: 83-102.
5. Hayes, S. and Patterson, D.G. 1921. Experimental Development of the Graphic Rating Method. Psychol. Bull. 18: 98-99.
6. Joyce, C.R.B., Zutshi, D.W., Hrubes, V. and Mason, R.M. 1975. Comparison of Fixed Interval and Visual Analogue Scales for Rating Chronic Pain. Eur. J. Clin. Pharmacol. 8: 415-420.
7. Kuroda, A. and Kanda, T. 2007. Correlation
between QOL utility score and VAS score ofEuroQol in stroke patients. Jpn. J. Geriat. 44: 264-266. (in Japanese)
8. Kuroiwa, S., Moriwaki, M., Hayashida, K., Kakehashi, M., Yamaguchi, N. and Eboshida, A. 2007. The relationship of wishing for a long and healthy life on the life-style and health activities of elderly. J. Health Sci. Hiroshima Univ. 6: 135-145. (in Japanese)
9. Matsubayashi, K., Okumiya, K., Osaki, Y., Fujisawa, M. and Doi, Y. 1997. Quality oflife of old people living in the community. Lancet 350: 1521-1522.
10. Matsubayashi, K., Wada, T., Okumiya, K., Fujisawa, M., Taoka, H., Kimura, S. and Doi, Y. 1994. Comparative study of quality of life in the elderly between in Kahoku and in Yaku. Jpn. J. Geriat. 31: 790-799. (in Japanese)
11. Morrison, DP. 1983. The Crichton Visual Analogue Scale for the assessment of behaviour in the elderly. Acta Psychiatr. Scand. 68: 408-413.
92 T. Kimura et al
12. Morrison, D.P. and Peck, D.F. 1990. Do self-report measures of affect agree? A longitudinal study. Er. J.
Clin. Psychol. 29: 395-400. 13. Spilker, B. and Revicki, D.A. 1996. Taxonomy of
Quality of Life, p.25-31. In B. Spilker (ed.), Quality of Life and Pharmacoeconomics in Clinical Trials, 2nd ed. Lippincott-Raven Publishers, Philadelphia.
14. The EuroQol Group. 1990. EuroQol- a new facility for the measurement of health-related quality of
life. Health Policy 16: 199-208. 15. The WHOQOL Group. 1998. The World Health
Organization Quality of Life Assessment (WHOQOL): development and general psychometric properties. Soc. Sci. Med. 46: 1569-1585.
16. Ware, J.E. and Sherbourne, C.D. 1992. The MOS 36-Item Short-Form Health Survey (SF-36): I. Conceptual Framework and Item Selection. Med. Care 30: 4 73-483.