hindustan lever limited · 1 hindustan lever limited investor presentation namaste india conference...
TRANSCRIPT
1
Hindustan Lever LimitedInvestor Presentation
Namaste India ConferenceDeutsche Bank
SP Mustafa, VP Investor Relations, Treasury & Mergers & Acquisitions7th March 2007
2006 Highlights
Agenda
Overview
India Opportunity
HLL - Uniquely Placed
Growth Agenda

2
16,000+ employees
1,200+ managers
2,000+ suppliers &
associates
80 company factories
45 C&FAs, 4,000 Stockists
Direct Coverage - 1 Mn outlets
Total coverage - 6.3 Mn outletsMarket reach - 166 Mn households (8 out of 10 in India)
India
Population 1027 Mln5,545 Towns
2.5 Mln outlets6,38,000 Villages
5.0 Mln outlets
* Source: (1) Statistics on India, Total Coverage : AC Nielsen, Census of India 2001 (2) Statistics on Market reach : MRUC, Hansa Research - Guide to Indian Markets 2006
HLL - India’s largest FMCG company
Turnover 2672
PBIT 377
Net Profit (bei) 340
EPS 19c
Market Capitalisation 9326
Mn $
PBIT % 14.1%
Surplus Cash Generated 410
* Figures based on FY2006 Audited Results++ Market Capitalization as on 23rd Feb 2007
Financial Overview 2006
Soaps and Detergents
47%
Personal Products
27%
Exports10%
Others1%
Beverages11%
Processed Foods
3%
Icecreams1%
3
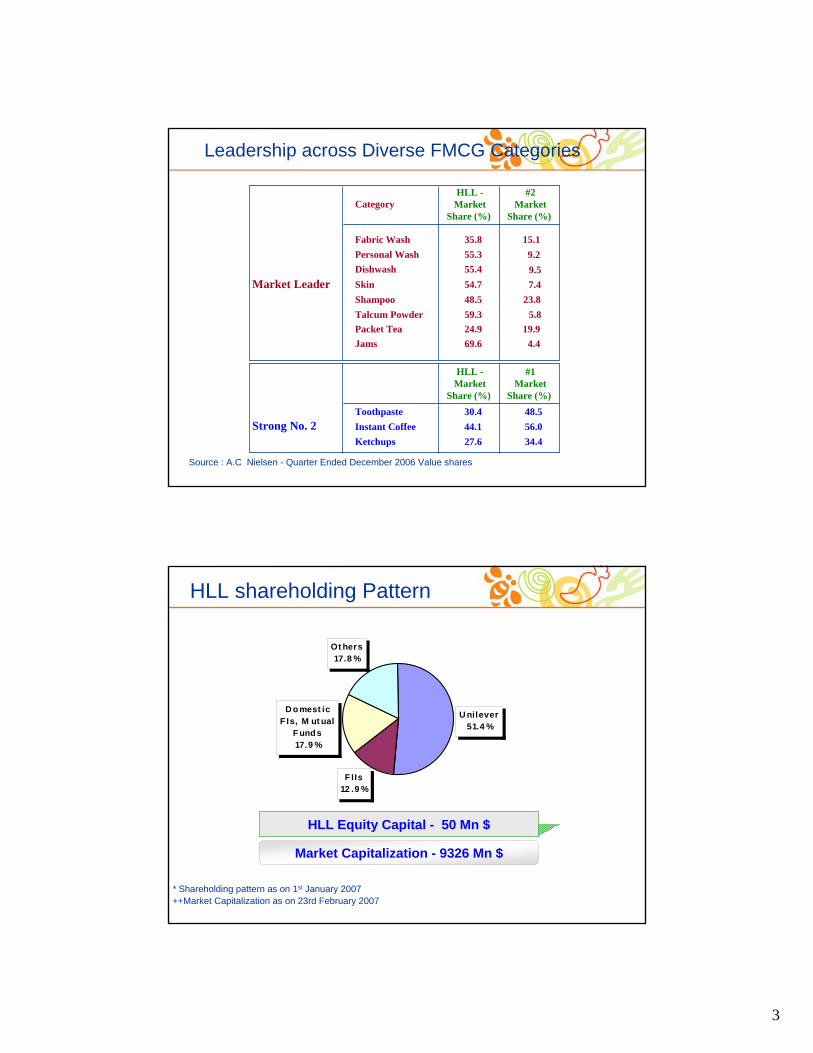
CategoryHLL -
MarketShare (%)
Fabric Wash 35.8Personal Wash 55.3
Packet Tea 24.9
Skin 54.7Shampoo 48.5Talcum Powder 59.3
Dishwash 55.4
Jams 69.6
Market Leader
#2Market
Share (%)
15.19.2
19.9
7.423.8
5.8
9.5
4.4
Source : A.C Nielsen - Quarter Ended December 2006 Value shares
Toothpaste 30.4Instant Coffee 44.1Ketchups 27.6
Strong No. 248.556.034.4
HLL -Market
Share (%)
#1Market
Share (%)
Leadership across Diverse FMCG Categories
HLL Equity Capital - 50 Mn $
++Market Capitalization as on 23rd February 2007
Market Capitalization - 9326 Mn $
* Shareholding pattern as on 1st January 2007
U nilever51.4 %
FIIs12 .9 %
D omest ic F Is, M ut ual
Funds17.9 %
Ot hers17.8 %
HLL shareholding Pattern
4
2006 Highlights
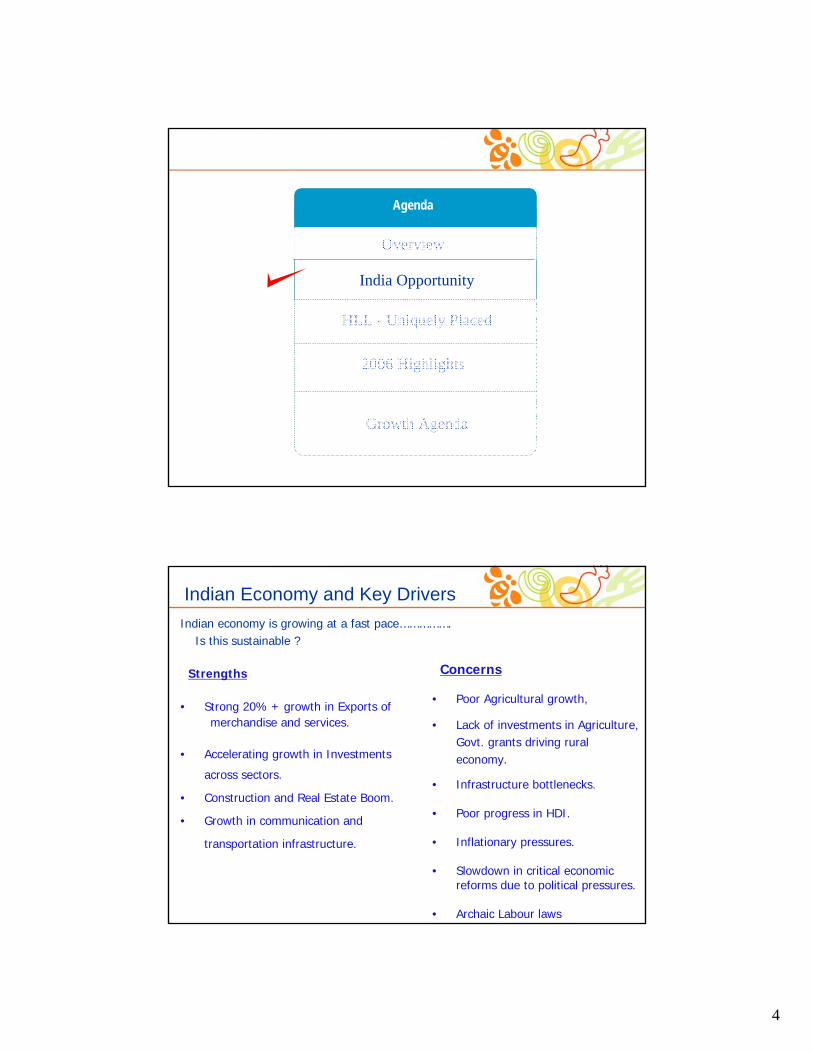
Agenda
Overview
India Opportunity
HLL - Uniquely Placed
Growth Agenda
Indian Economy and Key DriversIndian economy is growing at a fast pace…………….
Is this sustainable ?
Strengths
• Strong 20% + growth in Exports ofmerchandise and services.
• Accelerating growth in Investments
across sectors.
• Construction and Real Estate Boom.
• Growth in communication and
transportation infrastructure.
Concerns
• Poor Agricultural growth,
• Lack of investments in Agriculture, Govt. grants driving rural economy.
• Infrastructure bottlenecks.
• Poor progress in HDI.
• Inflationary pressures.
• Slowdown in critical economic reforms due to political pressures.
• Archaic Labour laws
5
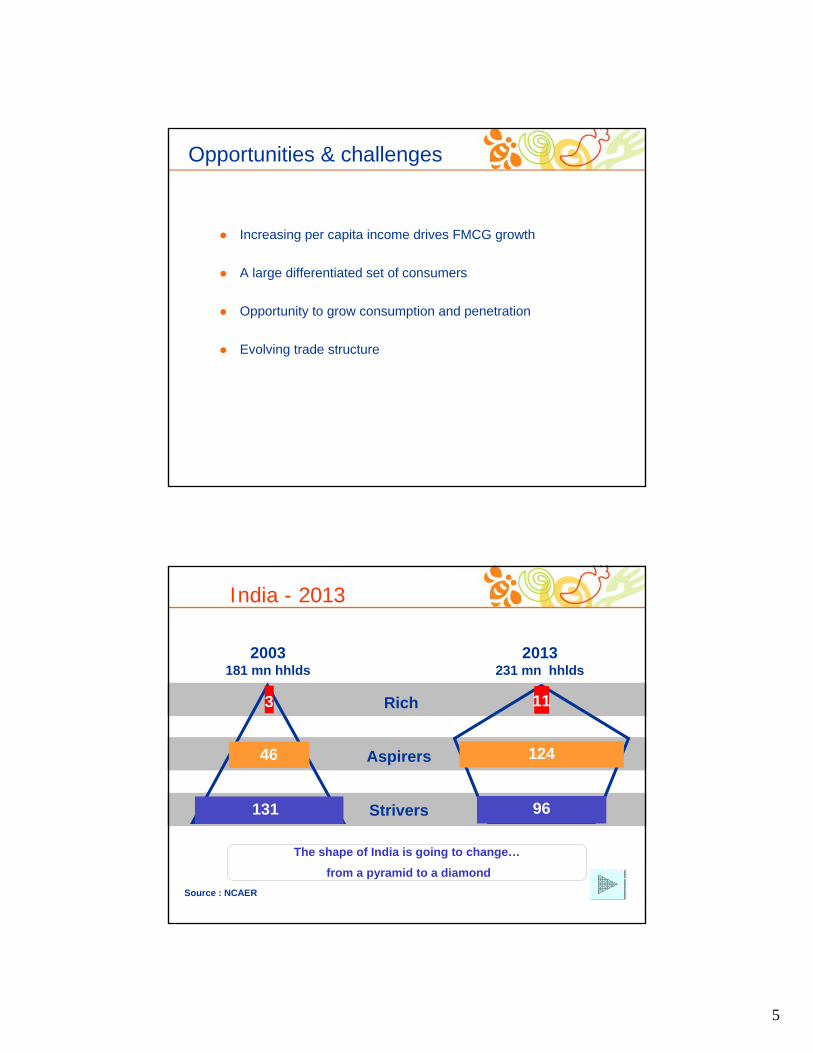
Opportunities & challenges
Increasing per capita income drives FMCG growth
A large differentiated set of consumers
Opportunity to grow consumption and penetration
Evolving trade structure
India - 2013
2003181 mn hhlds
131
46
3
2013231 mn hhlds
124
11
96
Rich
Aspirers
Strivers
Source : NCAER
The shape of India is going to change…
from a pyramid to a diamond

6
Consumer Confidence
0
20
40
60
80
100
120
Kor
Jap
TW PH
IND
O TH SG
MA
L
HK
AU
S NZ
IND AP
Excellent Good Not So Good Bad
Source : AC Nielsen Jan 2006 Global Consumer Confidence Report
… Consumer Confidence highest in the Asia Pacific region
… With Consumers feeling it is the best time to buy things
they want
5867
83
9498 99
103 106 106 109
119127
98
62
7680
93 96103 104 106
114 117123
132
101
020406080
100120140
Kor
Jap
TW PH
IND
O TH SG MA
L
HK
AU
S NZ
IND AP
1H 2005 2H 2005
Source : MRUC, Hansa Research - Guide to Indian Markets 2006; Euromonitor
Category All India % Urban % Rural %Deodorants 2.1 5.5 0.6
Toothpaste 48.6 74.9 37.6
Skin Cream 22.0 31.5 17.8
Shampoo 38.0 52.1 31.9
Utensil Cleaner 28.0 59.9 14.6
Instant Coffee 6.6 15.5 2.8
Washing Powder 86.1 90.7 84.1
Detergent Bar 88.6 91.4 87.4
Toilet Soap 91.5 97.4 88.9
• Per capita Consumption in Skin care 1/25th of Thailand• Per capita consumption in Laundry 1/10th of South Africa
Huge Opportunity to drive penetration & consumption
Opportunity to grow consumption and penetrationPenetration %

7
Modern Trade Customers
Local RetailersLocal Retailers
MNC RetailersMNC Retailers
Prospective EntrantsProspective Entrants
Holding in FW / H & GHolding in FW / H & G
Spencer Super / Spencer Super / HyperHyper
Development of ‘Modern Trade’
726 797913
10571229
1507
1765
2116
24012511
2872
0
500
1000
1500
2000
2500
3000
3500
1995 1996 1997 1998 1999 2000 2001 2002 2003 2004 2005
Stores
60
85
40
15
0%
10%
20%
30%
40%
50%
60%
70%
80%
90%
100%
MT number% MT Contribution
Chain Stores Independent stores
• Modern Trade stores (no) growing at 15% CAGR
• Chains growing faster than ‘Independents’
8
2006 Highlights
Agenda
Overview
India Opportunity
HLL - Uniquely Placed
Growth Agenda
HLL – Uniquely Positioned to Create Value
Unmatched Brand Portfolio
Innovation and R&D capabilities to straddle the pyramid
Track record of building profitable mass market brands
Versatile distribution network with multi channel capabilities
Combining corporate responsibility and business strategies to aid the development of rural India
Strong Local talent base

9
0
2000
4000
6000
8000
10000
12000
14000
HLL Nestle Britannia Dabur Marico GSK Colgate Godrej CP PGHH
Turn
over
HLL – 2006 Turnover
2006 TTM Turnover – Rs Crores
Source: Audited Reports and Company Press release
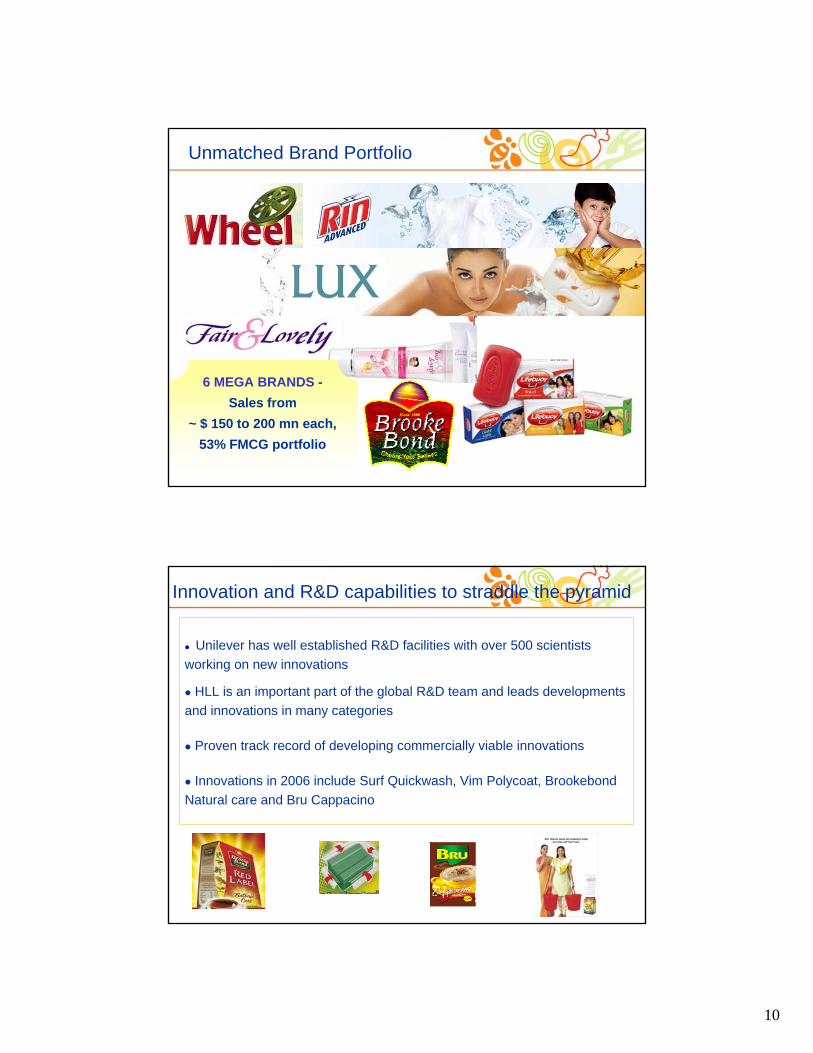
An unmatched brand portfolio
Unmatched Brand Portfolio
10
An unmatched brand portfolio
6 MEGA BRANDS -Sales from
~ $ 150 to 200 mn each, 53% FMCG portfolio
Unmatched Brand Portfolio
Unilever has well established R&D facilities with over 500 scientists working on new innovations
HLL is an important part of the global R&D team and leads developments and innovations in many categories
Proven track record of developing commercially viable innovations
Innovations in 2006 include Surf Quickwash, Vim Polycoat, BrookebondNatural care and Bru Cappacino
Innovation and R&D capabilities to straddle the pyramid

11
COSTCOST20 paise per liter
or220 liters of pure water for $ 1
Proposition : Proposition : ‘‘as safe as boiled wateras safe as boiled water’’ without hassles of boilingwithout hassles of boilingAssured safety: no harmful virus, bacteria, parasites, pesticides Works without electricity & piped waterGreat taste, clear & odour-free waterAspirational stylingAffordable price: Rs 1600
Business model based on consumable sale after consumer lockBusiness model based on consumable sale after consumer lock--inin
Launched in Chennai, now present in most cities of Launched in Chennai, now present in most cities of Tamilnadu. Currently extended to Bangalore and otherTamilnadu. Currently extended to Bangalore and othercities in Karnatakacities in Karnataka
Plans in place for business rampPlans in place for business ramp--upup
Water business - ‘Pure-it’
Innovation and R&D Capabilities
Direct coverage of 1 million outlets; brands available in 6.3 million outlets
Rollout of IT solution allowing real time tracking of secondary sales and
distributor stocks
Separate channels identified on the basis of consumer behavior and buying
pattern
Tailor made schemes rolled out to cater to each segment of the market
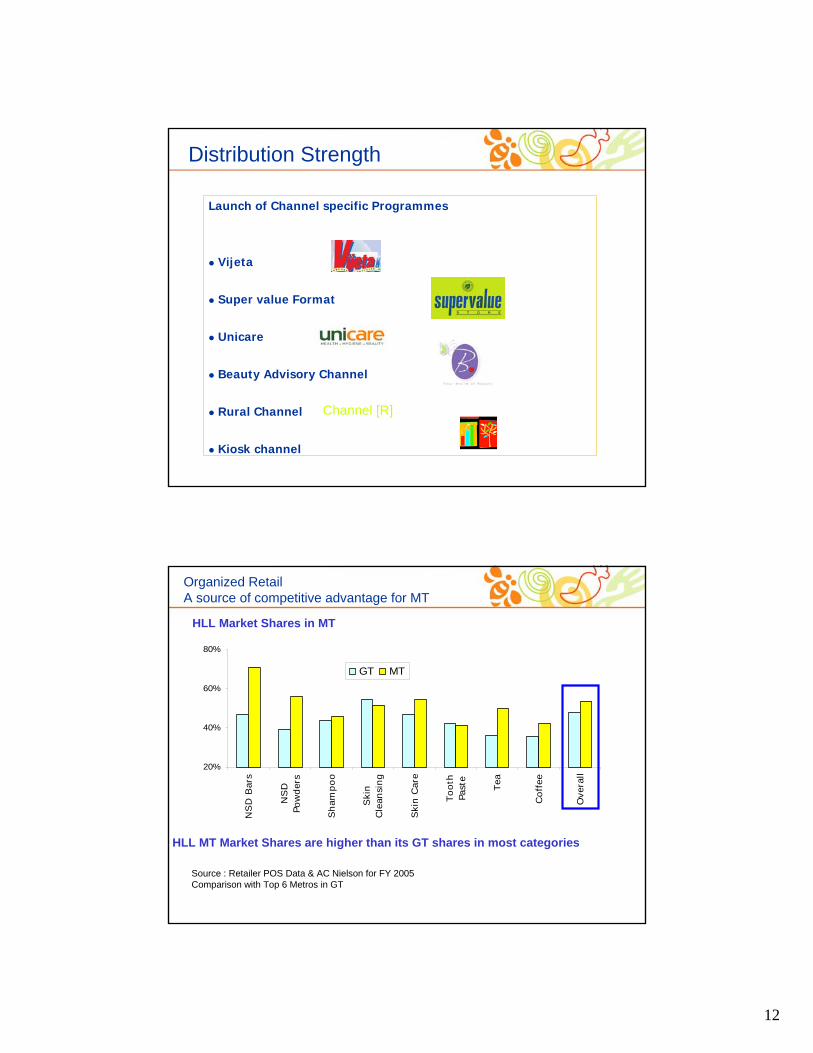
Distribution Strength
12
Launch of Channel specific Programmes
Vijeta
Super value Format
Unicare
Beauty Advisory Channel
Rural Channel
Kiosk channel
Channel [R]
Distribution Strength
20%
40%
60%
80%
NSD
Bar
s
NSD
Pow
der
s
Sham
poo
Ski
nCle
ansi
ng
Ski
n C
are
Tooth
Past
e
Tea
Coffee
Ove
rall
GT MT
Organized RetailA source of competitive advantage for MT
Source : Retailer POS Data & AC Nielson for FY 2005Comparison with Top 6 Metros in GT
HLL Market Shares in MT
HLL MT Market Shares are higher than its GT shares in most categories
13
Shares In MT
0%
20%
40%
60%
80%
100%FW
Po
wde
rs
F W
Bar
s
Sham
poo
Ora
l C
are
Skin
Car
e
TEA
Inst
ant
Cof
fee
Jam
Ketc
hup
HLL Others
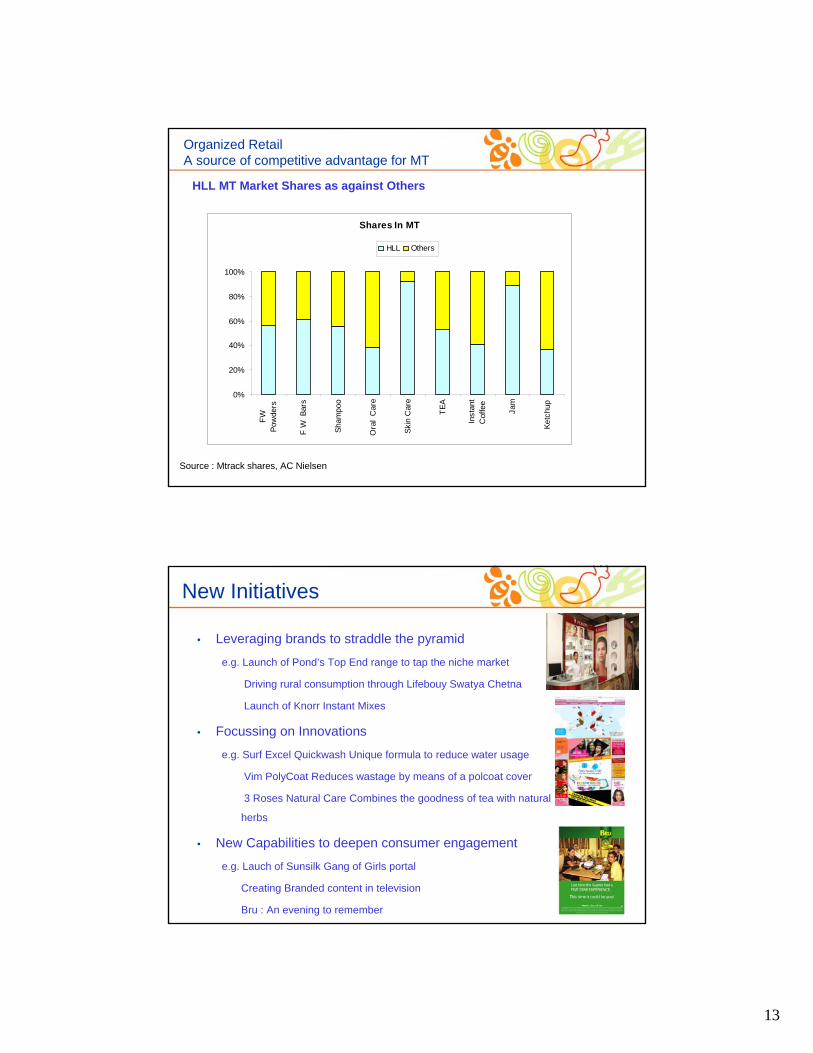
Organized RetailA source of competitive advantage for MT
HLL MT Market Shares as against Others
Source : Mtrack shares, AC Nielsen
• Leveraging brands to straddle the pyramid
e.g. Launch of Pond’s Top End range to tap the niche market
Driving rural consumption through Lifebouy Swatya Chetna
Launch of Knorr Instant Mixes
• Focussing on Innovations
e.g. Surf Excel Quickwash Unique formula to reduce water usage
Vim PolyCoat Reduces wastage by means of a polcoat cover
3 Roses Natural Care Combines the goodness of tea with natural
herbs
• New Capabilities to deepen consumer engagement
e.g. Lauch of Sunsilk Gang of Girls portal
Creating Branded content in television
Bru : An evening to remember
New Initiatives
14
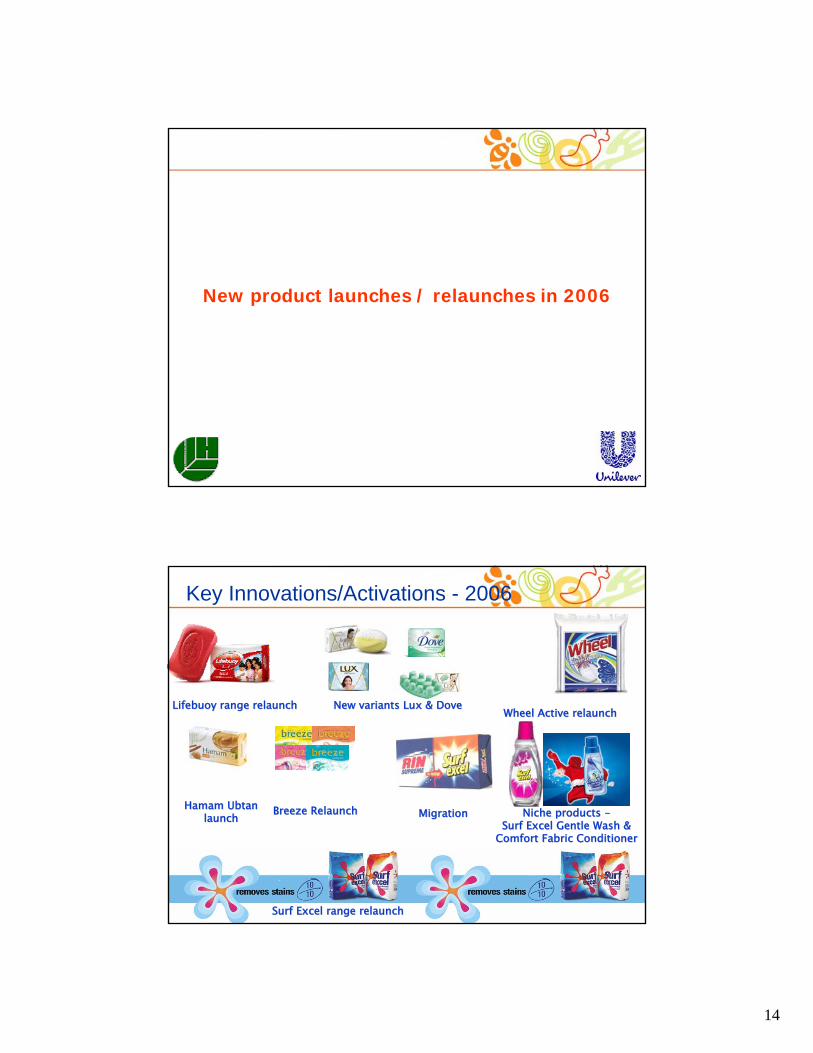
New product launches / relaunches in 2006
Key Innovations/Activations - 2006
Lifebuoy range relaunchLifebuoy range relaunch New variants New variants LuxLux & Dove& Dove
MigrationMigration Niche products Niche products --Surf Excel Gentle Wash & Surf Excel Gentle Wash &
Comfort Fabric Conditioner Comfort Fabric Conditioner
Surf Excel range relaunchSurf Excel range relaunch
Wheel Active relaunchWheel Active relaunch
HamamHamam Ubtan Ubtan launchlaunch Breeze Breeze RelaunchRelaunch

15
Key Innovations/Activations - 2006
VaselineVaseline-- Aloefresh Aloefresh and reand re--launched launched
Body LotionBody Lotion Elle 18 Nail & Lip Elle 18 Nail & Lip range relaunchrange relaunch
FAL FAL –– Skin Clarity, Skin Clarity, MenzMenz Active, Active, AyurvedicAyurvedic and and SunblockSunblock
Ponds Ponds --Face Wash & Top Face Wash & Top End RangeEnd Range
Lakme Lakme ––Fundamentals, Free Fundamentals, Free Spirit range, Happy Spirit range, Happy
Hour CollectionHour Collection
Key Innovations/Activations - 2006
Clinic All Clear RangeClinic All Clear Range
Pepsodent CompletePepsodent Complete
CloseUp Milk Calcium CloseUp Milk Calcium launchlaunch
New New RexonaRexonaDeosDeos
Clinic Plus Clinic Plus relaunchrelaunch
SunsilkSunsilk Top End rangeTop End range
Axe Click Axe Click RangeRange SunsilkSunsilk RelaunchRelaunch rangerange
16
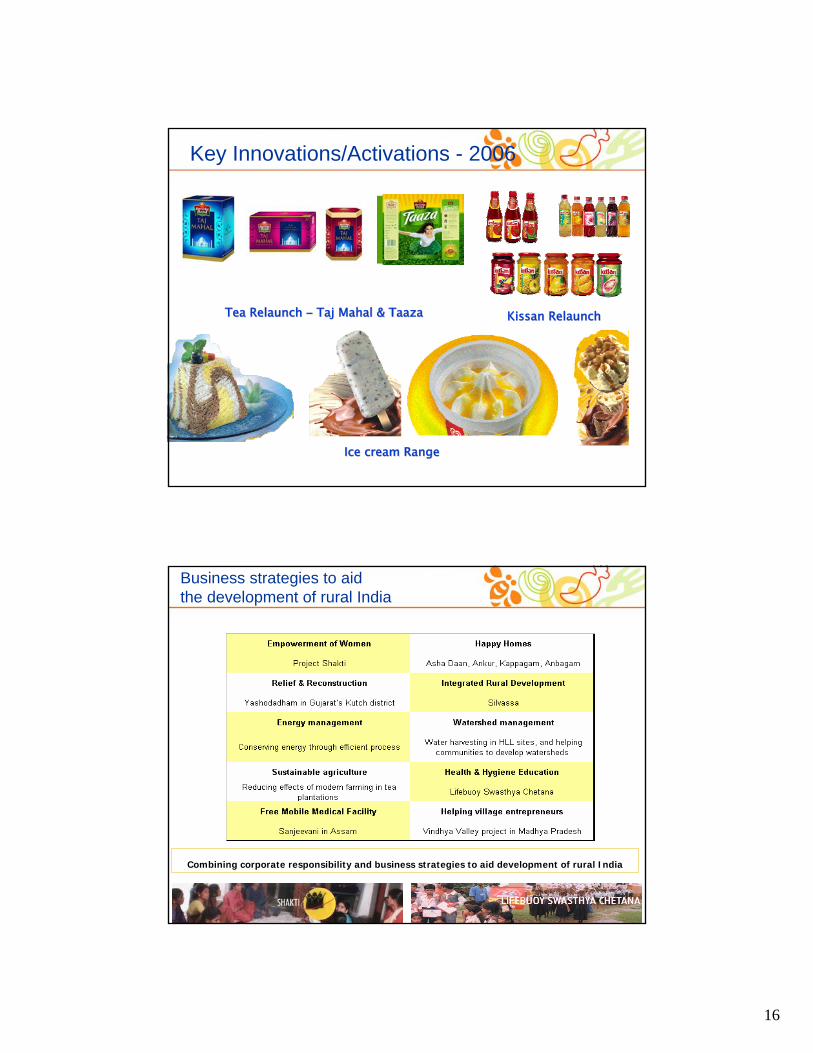
Key Innovations/Activations - 2006
Tea Tea RelaunchRelaunch –– TajTaj MahalMahal & & TaazaTaaza KissanKissan RelaunchRelaunch
Ice cream RangeIce cream Range
Business strategies to aid the development of rural India
Combining corporate responsibility and business strategies to aid development of rural India

17
– Challenges in Rural Markets
Accessibility
Viability
Media Dark
– Rural selling through Self Help Groups; provides
micro enterprise opportunities for women
– Benefits
Improving product reach (doubled direct rural reach)
Facilitating Brand-Communication
Extended into 15 major states, 370 districts
27,000 Entrepreneurs
Over 84,000 villages covered Touching 90 mn rural lives
– Ambitious future plans
Rural marketing - Project Shakti
Rural India
Business strategies to aid the development of rural India
Diarrhoea – Kills a child every 10 secs - 33%(1 mn) of these deaths are in India
LSHTM* Study - Washing hands with soap and water reduces diarrhoeal diseases by 47%
Business objective – To increase soap consumption in rural India
Lifebuoy - India’s leading health soap brand - Role in propagating health & hygiene awareness in villages
* London School of Hygiene & Tropical Medicine
The Challenge in rural India: 1. Lack of awareness about disease causing germs2. Need for repeated contacts to drive behaviour change3. Lack of media reach
27800No. of villages contacted80No. of people contacted (mn)
2002 - 2006Results
SWASTYA CHETNA
Lifebouy Swatya Chetna
18
2006 Highlights
Agenda
Overview
India Opportunity
HLL - Uniquely Placed
Growth Agenda
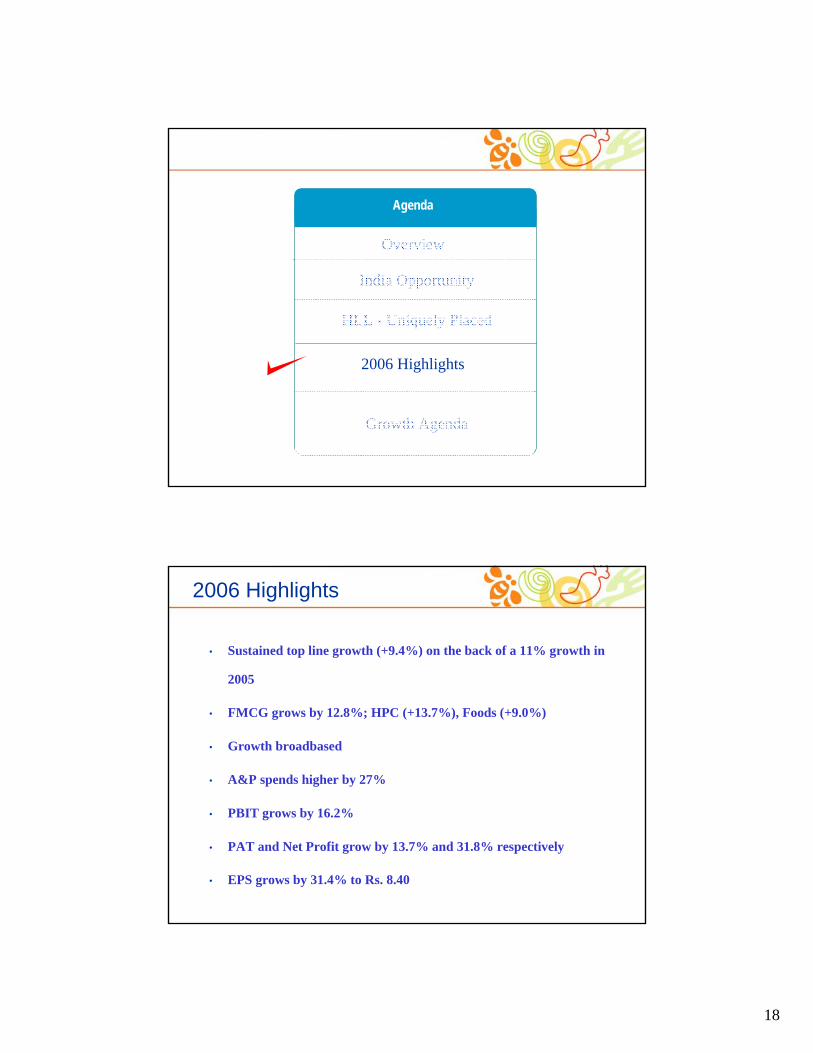
2006 Highlights
• Sustained top line growth (+9.4%) on the back of a 11% growth in
2005
• FMCG grows by 12.8%; HPC (+13.7%), Foods (+9.0%)
• Growth broadbased
• A&P spends higher by 27%
• PBIT grows by 16.2%
• PAT and Net Profit grow by 13.7% and 31.8% respectively
• EPS grows by 31.4% to Rs. 8.40

19
Robust FMCG growth
HLL FMCG Sales growth %
0.03
12.7 12.8
2004 2005 2006
++ HLL has January - December financial year.
• Good topline growth for the year
• Substantial investments behind brands throughout the year
• Good progress in all HPC Categories
• Foods grows well driven by strong growth in processed foods and ice creams categories and recovery in Tea
• Cost pressures continued, managed by selective price increases and cost effectiveness programmes
To sum up..2006

20
2006 Highlights
Agenda
Overview
India Opportunity
HLL - Uniquely Placed
Growth Agenda
• FMCG Market expected to grow at current levels; proactive
government actions should help contain increasing inflation
concerns
• High levels of innovation will be sustained and A&P
investments will be made competitively and effectively
• Focus on core foods portfolio will continue. Foods Strategy for
the longer term being in place, a phased implementation
programme will commence
Looking ahead..
21
• Excellent Water test market results give confidence for a
national rollout, commencing from 2007. Investments will be
stepped up accordingly
• Cost pressures continue with Vegetable Oil prices hardening,
though partially offset by reduction in Crude Oil. Judicious price
increases and Cost effectiveness programmes will help mitigate
the impact
• Continued investments in capability building in the area of
modern trade and supply chain. The focus will be on customer
service backed by Technology and Competitive Best Practice
Looking ahead..
Thank youThank you

22
Hindustan Lever LimitedInvestor Presentation
Namaste India ConferenceDeutsche Bank