hiland partners, lp (hlnd) hil d h ldi gp lphiland...
TRANSCRIPT
RBC Capital MarketspMLP ConferenceNovember 2008
Hiland Partners, LP (HLND)Hil d H ldi GP LP (HPGP)Hiland Holdings GP, LP (HPGP)
Joe GriffinChi f E ti OffiChief Executive Officer
Matt HarrisonChief Financial Officer
Robert ShainChief Commercial Officer
Derek GipsonDirector – Business Development & Investor Relations
Risks and Forward-Looking Statements
Investment in the common units of Hiland Partners, LP and Hiland Holdings GP, LP (collectively, “Hiland” or the“Partnership”) involves risks associated with the Partnership’s business, the Partnership’s structure and the taxcharacteristics of the common units. These risks can significantly impact the market value of Hiland’s common units.
The statements made by representatives of Hiland during the course of this presentation that are not historical facts areforward-looking statements. Although Hiland believes that the assumptions underlying these statements are reasonable,investors are cautioned that such forward-looking statements are inherently uncertain and necessarily involve risks thatmay affect Hiland’s business prospects and performance, causing actual results to differ from those discussed during thispresentation. When considering forward-looking statements, you should keep in mind the risk factors and othercautionary statements included in Hiland’s various filings with the Securities & Exchange Commission (“SEC”)cautionary statements included in Hiland s various filings with the Securities & Exchange Commission ( SEC ).
Any forward-looking statements made are subject to all of the risks and uncertainties, many of which are beyondmanagement’s control, involved in gathering, compressing, dehydrating, treating, processing and marketing natural gas,fractionating NGLs and providing air compression and water injection services for oil and gas secondary recoveryoperations These risks include the risks described in the Partnership’s Form 10 K and other documents filed from time tooperations. These risks include the risks described in the Partnership s Form 10-K and other documents filed from time totime with the SEC. Should one or more of these risks or uncertainties occur, or should underlying assumptions proveincorrect, Hiland’s actual results and plans could differ materially from those expressed in any forward-lookingstatements.
The Partnership undertakes no obligation to publicly update any forward looking statements whether as a result of newThe Partnership undertakes no obligation to publicly update any forward-looking statements, whether as a result of newinformation or future events.
2
Non-GAAP Measures
This presentation includes the non-generally accepted accounting principles (“non-GAAP”) financial measure of EBITDA.We define EBITDA, a non-GAAP financial measure, as net income plus interest expense, provisions for income taxes anddepreciation, amortization and accretion expense. EBITDA is used as a supplemental financial measure by ourmanagement and by external users of our financial statements such as investors, commercial banks, research analystsand others to assess: (1) the financial performance of our assets without regard to financial methods capital structure orand others to assess: (1) the financial performance of our assets without regard to financial methods, capital structure orhistorical costs basis; (2) the ability of our assets to generate cash sufficient to pay interest costs and support ourindebtedness; (3) our operating performance and return on capital as compared to those of other companies in themidstream energy sector, without regard to financing and structure; and (4) the viability of acquisitions and capitalexpenditure projects and the overall rates of return on alternative investment opportunities. EBITDA is also a financialmeasurement that, with certain negotiated adjustments, is reported to our banks and is used as a gauge for compliancewith our financial covenants under our credit facility. EBITDA should not be considered as an alternative to net income,operating income, cash flows from operating activities or any other measure of financial performance presented inaccordance with GAAP. Our EBITDA may not be comparable to EBITDA of similarly titled measures of other entities, asother entities may not calculate EBITDA in the same manner as we do.
3
An Overview of Hiland
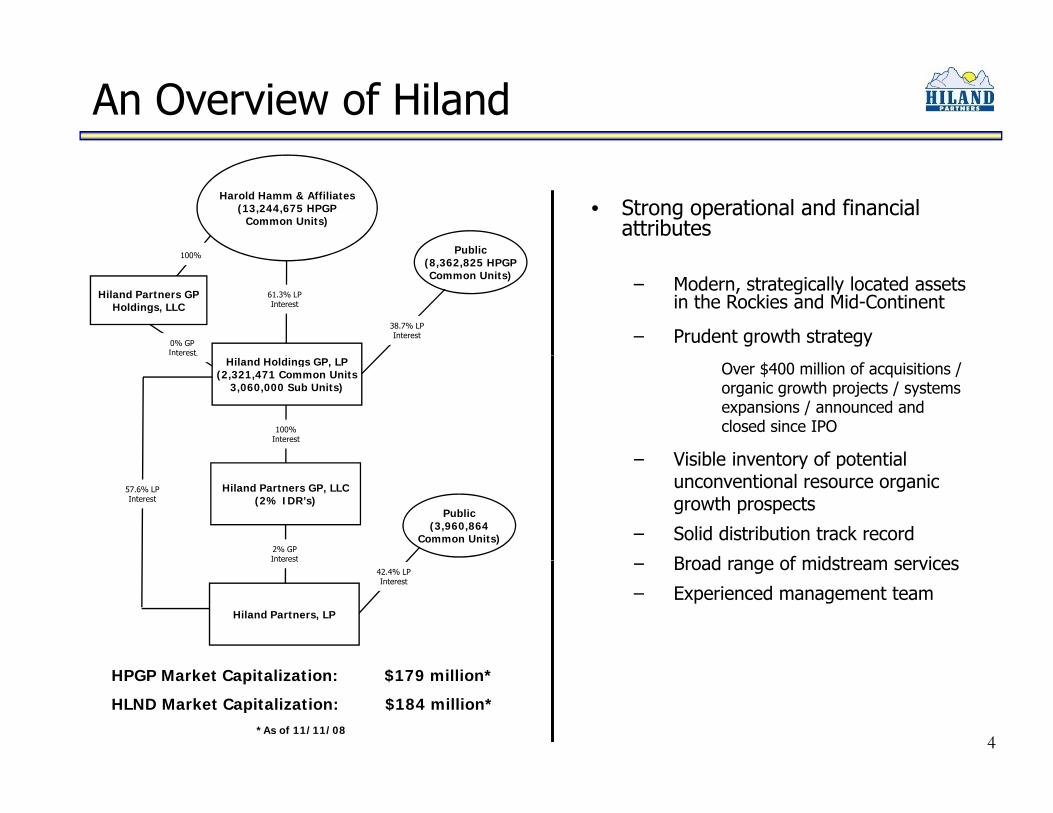
• Strong operational and financial attributes
Public100%
Harold Hamm & Affiliates(13,244,675 HPGP
Common Units)
– Modern, strategically located assets in the Rockies and Mid-Continent
– Prudent growth strategy
Public(8,362,825 HPGPCommon Units)
Hiland Partners GPHoldings, LLC
61.3% LPInterest
38.7% LPInterest
0% GPInterest
100%
Over $400 million of acquisitions / organic growth projects / systems expansions / announced and closed since IPO
Visible inventory of potential
100%Interest
te estHiland Holdings GP, LP
(2,321,471 Common Units3,060,000 Sub Units)
– Visible inventory of potential unconventional resource organic growth prospects
– Solid distribution track record
Broad range of midstream services
Public(3,960,864
Common Units)
Hiland Partners GP, LLC(2% IDR’s)
2% GPInterest
57.6% LPInterest
– Broad range of midstream services
– Experienced management team
Interest
42.4% LPInterest
Hiland Partners, LP
4
HPGP Market Capitalization: $179 million*
HLND Market Capitalization: $184 million**As of 11/11/08
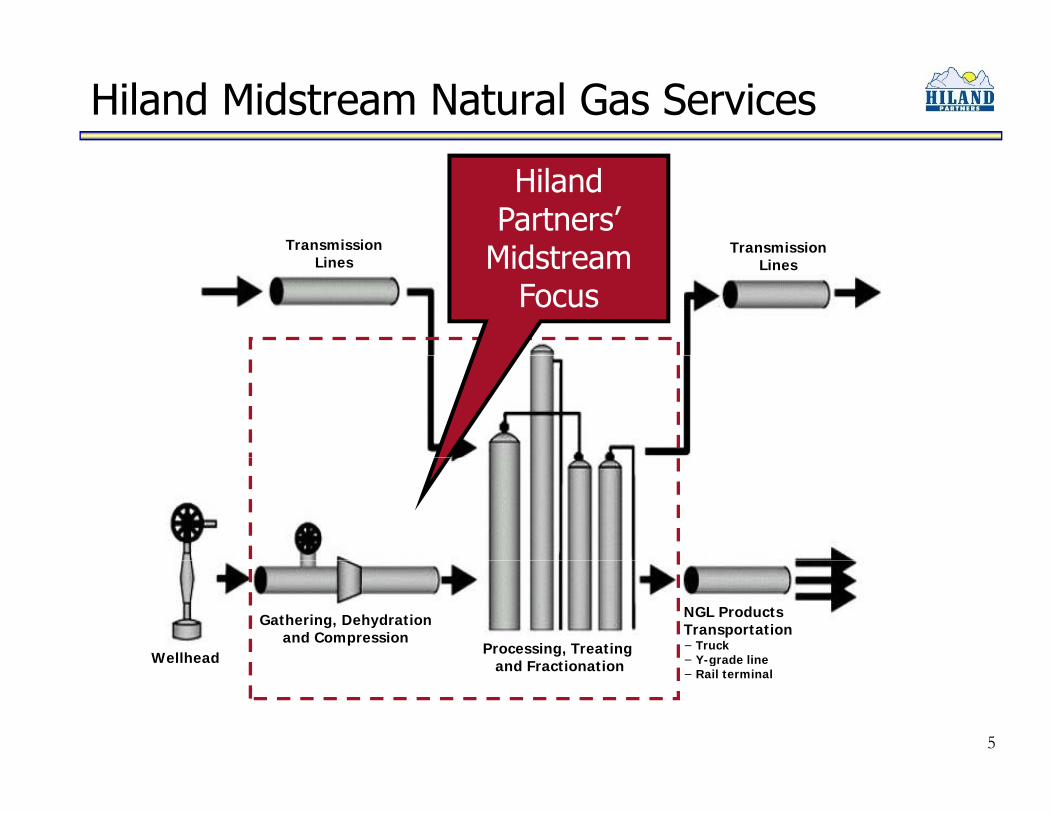
Hiland Midstream Natural Gas Services
TransmissionTransmission
Hiland Partners’
Midstream LinesLines Midstream Focus
Wellhead
Gathering, Dehydrationand Compression
Processing, Treating and Fractionation
NGL ProductsTransportation− Truck− Y-grade line
5
and Fractionation Y grade line− Rail terminal
Business Strategy
• Engage in construction of organic growth projects and system expansion opportunities
– Unique relationship with Continental Resources, Inc.
Opportunity to gain insight regarding production growth and reserve potential in emerging unconventional resource playsreserve potential in emerging unconventional resource plays
– Expand systems to meet growing demand
• Increase volumes on existing assets while controlling costs• Increase volumes on existing assets while controlling costs
• Pursue complementary acquisitions
T t t iti th t d i i ti i– Target opportunities that expand our presence in existing service territories, offer operational efficiencies and increase utilization
• Reduce exposure to commodity price risk
6
p y p
• Grow distributions to unitholders
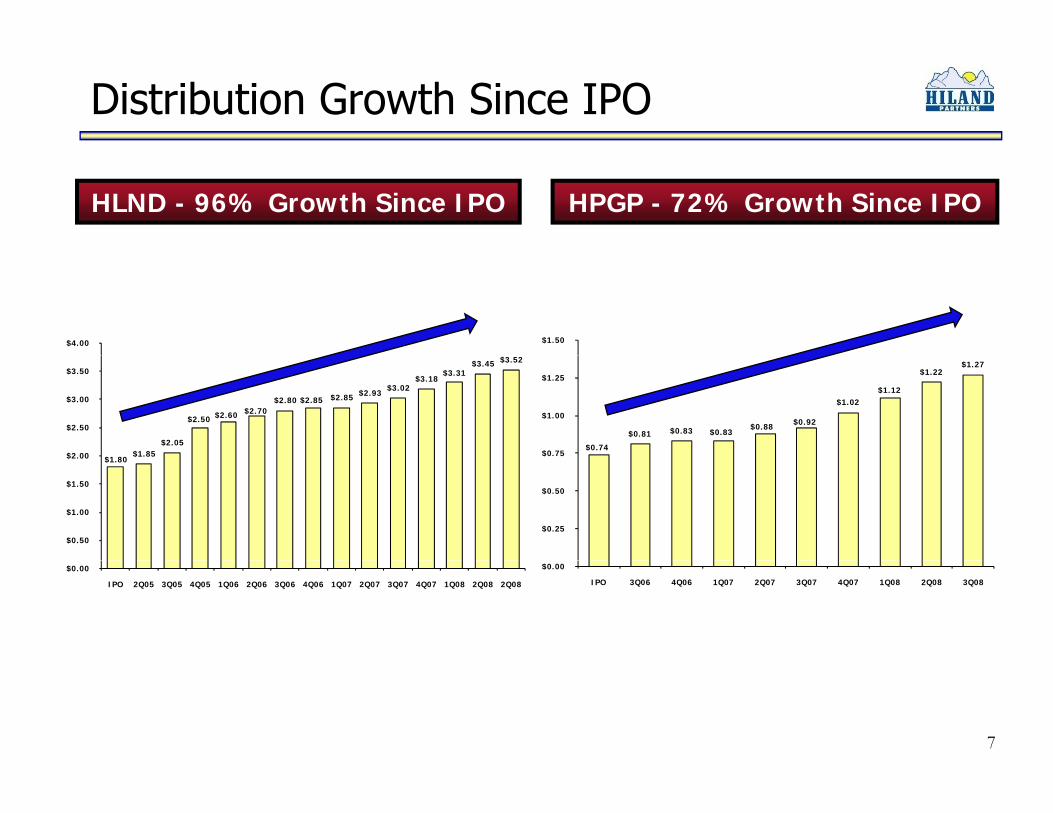
Distribution Growth Since IPO
HLND - 96% Growth Since IPO HPGP - 72% Growth Since IPO
$4.00 $1.50
$1 80$1.85
$2.05
$2.50 $2.60 $2.70 $2.80 $2.85 $2.85 $2.93
$3.02 $3.18
$3.31 $3.45 $3.52
$2.00
$2.50
$3.00
$3.50
$0.74
$0.81 $0.83 $0.83 $0.88 $0.92
$1.02 $1.12
$1.22 $1.27
$0.75
$1.00
$1.25
$1.80
$0.50
$1.00
$1.50
$2.00
$0.25
$0.50
$0.00
IPO 2Q05 3Q05 4Q05 1Q06 2Q06 3Q06 4Q06 1Q07 2Q07 3Q07 4Q07 1Q08 2Q08 2Q08
$0.00
IPO 3Q06 4Q06 1Q07 2Q07 3Q07 4Q07 1Q08 2Q08 3Q08
7
Unique Relationship with Continental Resources, Inc.
• Hiland’s predecessor formed in 1990 to support Continental Resources, Inc.’s (“CLR”) E&P activities
• CLR is a publicly-traded E&P company with an active drilling program– $4.3 billion equity market capitalization (IPO – May 2007)– $663 million drilling capex budget for 2008, $541 million drilling capex budget for 2009 (recently
announced)– EBITDAX of $665 million for the nine months ended 9/30/08– Significant reserve and production growth potentialSignificant reserve and production growth potential– Organic growth strategy focused on unconventional resource plays
− Approximately 1.1 million net undeveloped acres in unconventional plays and growing− Define new shale plays− Take large acreage positions in new and defined shale plays− Embrace and execute horizontal drilling, high psi fracturing and complex drilling and completion of high organic content shale wells
React to and perfect drilling and completion techniques to make each shale well commercial− React to and perfect drilling and completion techniques to make each shale well commercial
• HLND, HPGP and CLR are separate entities with Harold Hamm as the controlling equity holder.
• Hiland’s relationship with CLR has enabled it to significantly expand its asset base– Recently announced North Dakota Bakken organic growth projectRecently announced North Dakota Bakken organic growth project– Montana Bakken acquisition– Badlands system expansion– Woodford Shale organic growth project
8
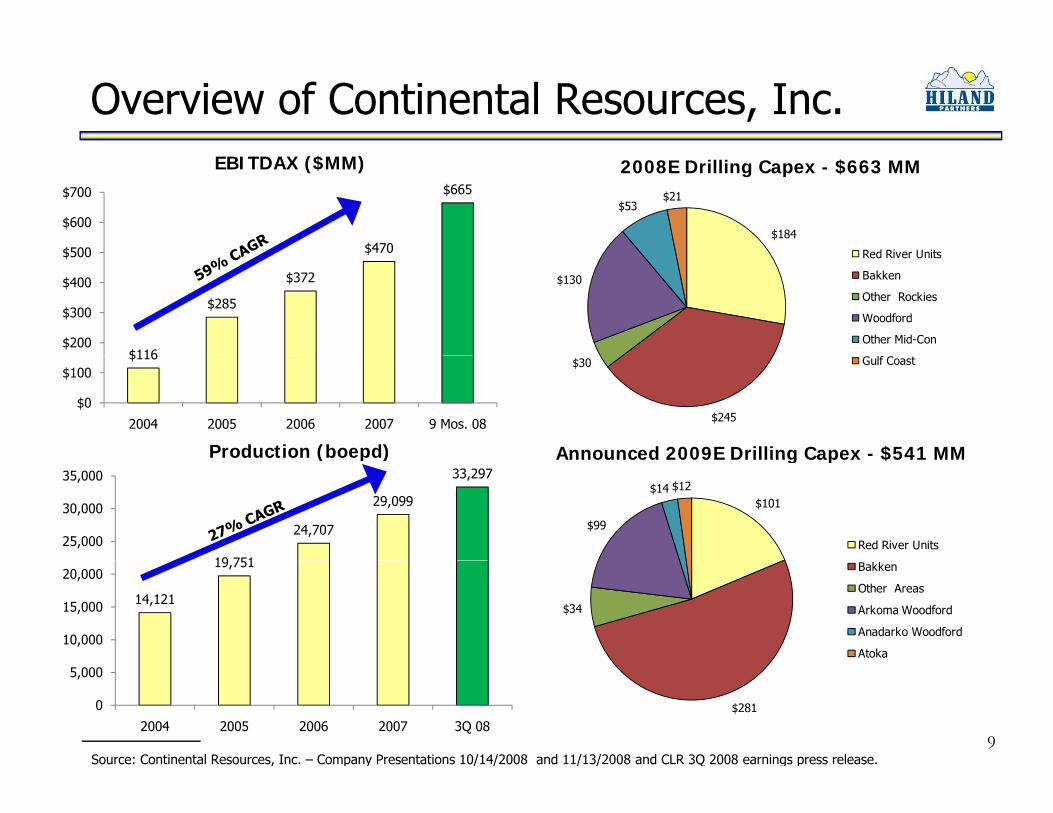
Overview of Continental Resources, Inc.
$470
$665
$500
$600
$700
EBITDAX ($MM) 2008E Drilling Capex - $663 MM
$184
$53$21
Red River Units
$116
$285
$372
$ 0
$200
$300
$400
$500
$130
Red River Units
Bakken
Other Rockies
Woodford
Other Mid-Con$116
$0
$100
2004 2005 2006 2007 9 Mos. 08
Production (boepd) Announced 2009E Drilling Capex - $541 MM
$245
$30 Gulf Coast
( p ) Announced 2009E Drilling Capex $541 MM
19 751
24,707
29,099
33,297
25,000
30,000
35,000
$101
$99
$14 $12
Red River Units
14,121
19,751
10,000
15,000
20,000
$34
Bakken
Other Areas
Arkoma Woodford
Anadarko Woodford
Atoka
Source: Continental Resources, Inc. – Company Presentations 10/14/2008 and 11/13/2008 and CLR 3Q 2008 earnings press release.9
0
5,000
2004 2005 2006 2007 3Q 08$281
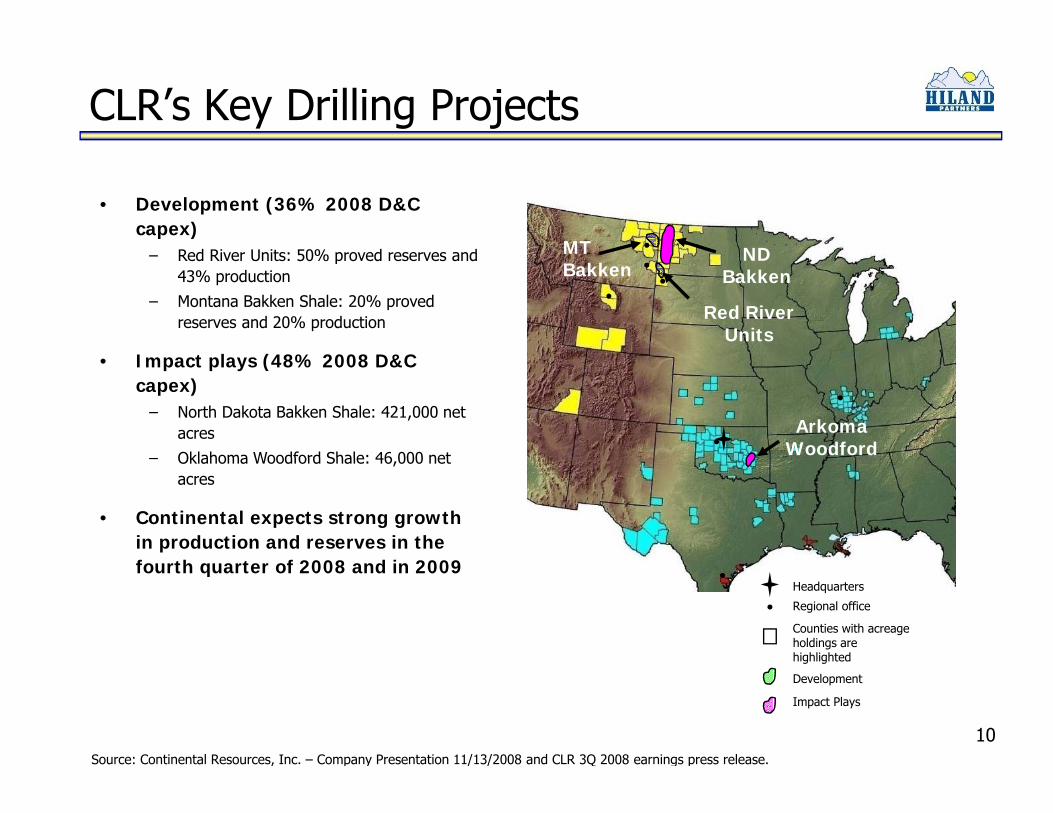
CLR’s Key Drilling Projects
• Development (36% 2008 D&C capex)
Red River Units: 50% proved reserves and MT ND− Red River Units: 50% proved reserves and 43% production
− Montana Bakken Shale: 20% proved reserves and 20% production
I t l (48% 2008 D&C
Red River Units
MT Bakken
ND Bakken
• Impact plays (48% 2008 D&C capex)− North Dakota Bakken Shale: 421,000 net
acres
− Oklahoma Woodford Shale: 46 000 net
Arkoma Woodford− Oklahoma Woodford Shale: 46,000 net
acres
• Continental expects strong growth in production and reserves in the f th t f 2008 d i 2009fourth quarter of 2008 and in 2009
Counties with acreage holdings are highlighted
Regional office
Headquarters
10
g g
Development
Impact Plays
Source: Continental Resources, Inc. – Company Presentation 11/13/2008 and CLR 3Q 2008 earnings press release.
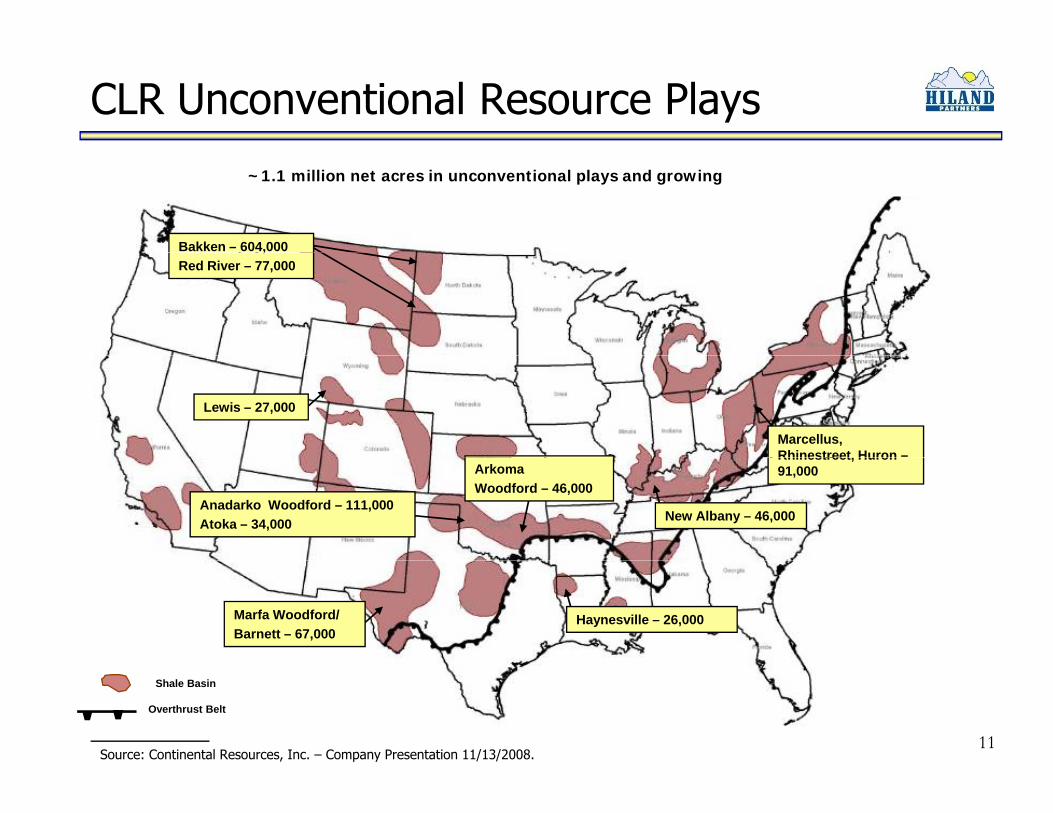
CLR Unconventional Resource Plays
~1.1 million net acres in unconventional plays and growing
Bakken – 604,000,Red River – 77,000
Marcellus, Rhinestreet, Huron –
Lewis – 27,000
Rhinestreet, Huron 91,000
New Albany – 46,000
ArkomaWoodford – 46,000
Anadarko Woodford – 111,000Atoka – 34,000
Haynesville – 26,000Marfa Woodford/Barnett – 67,000
Shale Basin
Overthrust Belt
Source: Continental Resources, Inc. – Company Presentation 11/13/2008.11
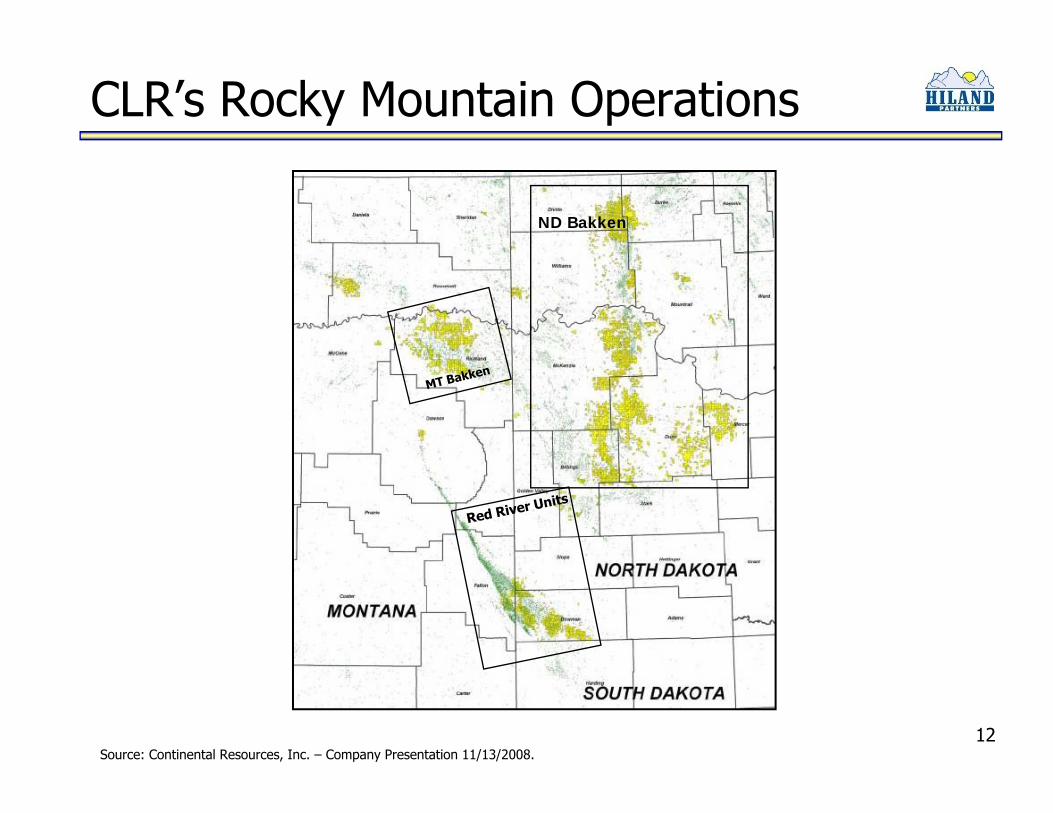
CLR’s Rocky Mountain Operations
ND Bakken
12Source: Continental Resources, Inc. – Company Presentation 11/13/2008.
Bakken Shale
Mon
t
Nort
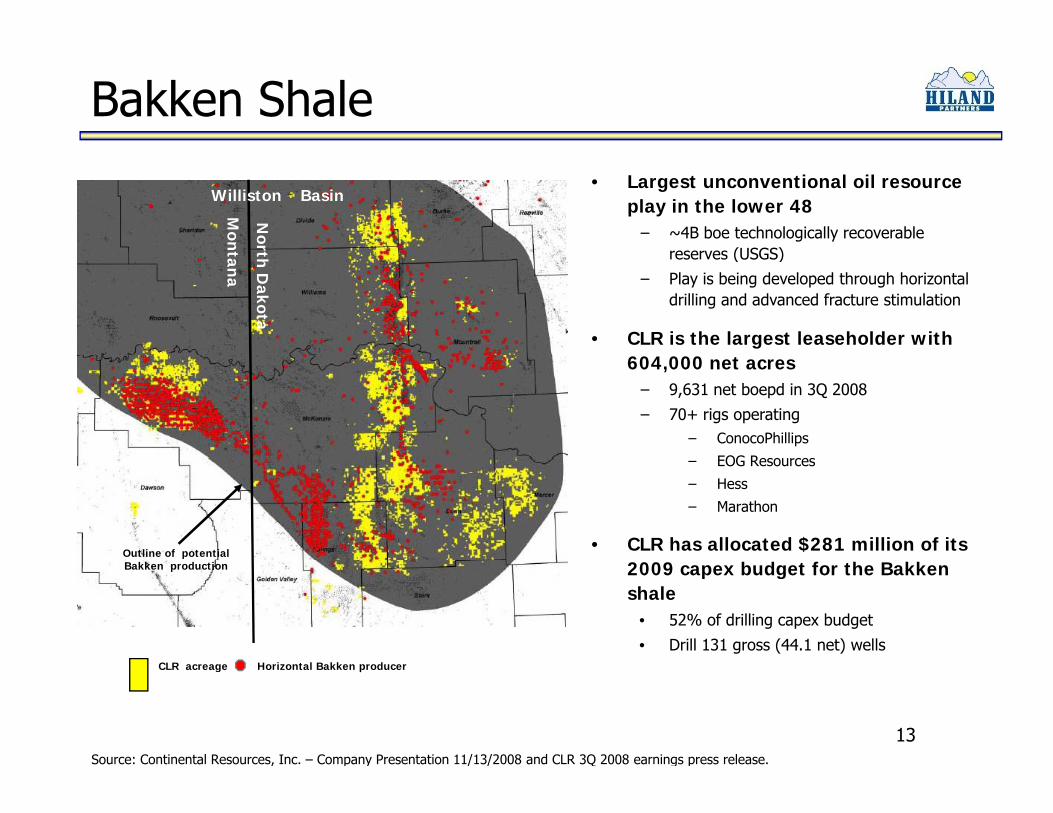
Williston Basin• Largest unconventional oil resource
play in the lower 48− ~4B boe technologically recoverable
reserves (USGS)
Mon ND
Williston Basin
tana
thD
akota
reserves (USGS)
− Play is being developed through horizontal drilling and advanced fracture stimulation
• CLR is the largest leaseholder with ntan
a
North
Dakota
604,000 net acres− 9,631 net boepd in 3Q 2008
− 70+ rigs operating− ConocoPhillips
EOG Reso ces
Outline of potential
− EOG Resources
− Hess
− Marathon
• CLR has allocated $281 million of its
CLR H i t l B kk d
Bakken production 2009 capex budget for the Bakken shale
• 52% of drilling capex budget
• Drill 131 gross (44.1 net) wells
13
CLR acreage Horizontal Bakken producer
Source: Continental Resources, Inc. – Company Presentation 11/13/2008 and CLR 3Q 2008 earnings press release.
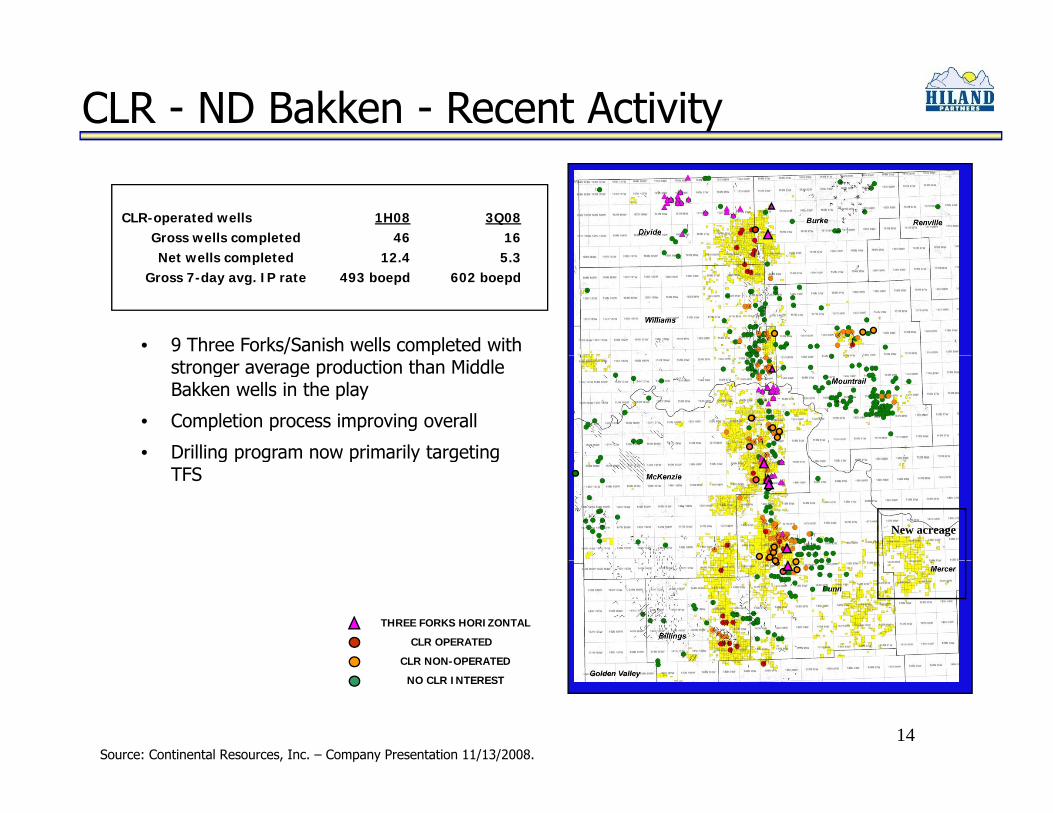
CLR - ND Bakken - Recent Activity
CLR-operated wells Gross wells completedN t ll l t d
3Q0816
5 3
1H0846
12 4
• 9 Three Forks/Sanish wells completed with
Net wells completedGross 7-day avg. IP rate
5.3602 boepd
12.4493 boepd
stronger average production than Middle Bakken wells in the play
• Completion process improving overall
• Drilling program now primarily targetingDrilling program now primarily targeting TFS
New acreage
THREE FORKS HORIZONTAL
CLR OPERATED
CLR NON-OPERATED
14
CLR NON OPERATED
NO CLR INTEREST
Source: Continental Resources, Inc. – Company Presentation 11/13/2008.
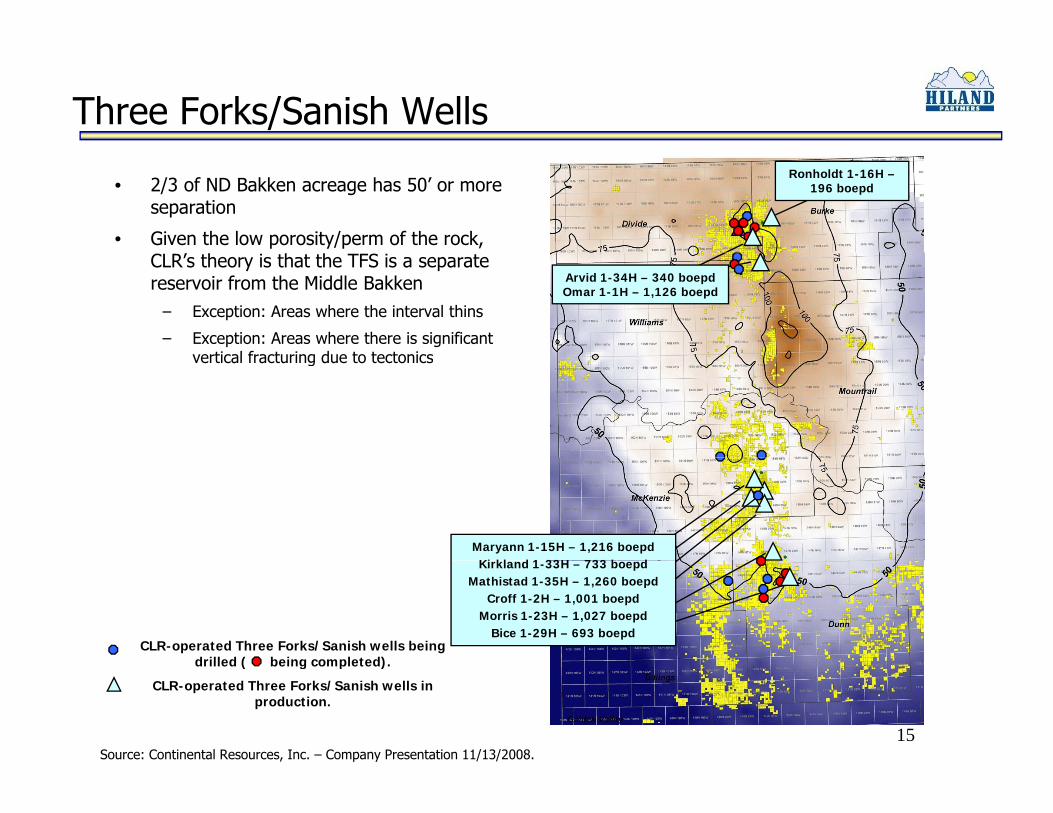
Three Forks/Sanish Wells
• 2/3 of ND Bakken acreage has 50’ or more separation
• Given the low porosity/perm of the rock,
Ronholdt 1-16H –196 boepd
CLR’s theory is that the TFS is a separate reservoir from the Middle Bakken
– Exception: Areas where the interval thins
– Exception: Areas where there is significant vertical fracturing due to tectonics
Arvid 1-34H – 340 boepdOmar 1-1H – 1,126 boepd
vertical fracturing due to tectonics
Maryann 1-15H – 1,216 boepdKi kl d 1 33H 733 b dKirkland 1-33H – 733 boepd
Mathistad 1-35H – 1,260 boepdCroff 1-2H – 1,001 boepd
Morris 1-23H – 1,027 boepdBice 1-29H – 693 boepd
CLR-operated Three Forks/Sanish wells being drilled ( being completed)
15
drilled ( being completed).
CLR-operated Three Forks/Sanish wells in production.
Source: Continental Resources, Inc. – Company Presentation 11/13/2008.
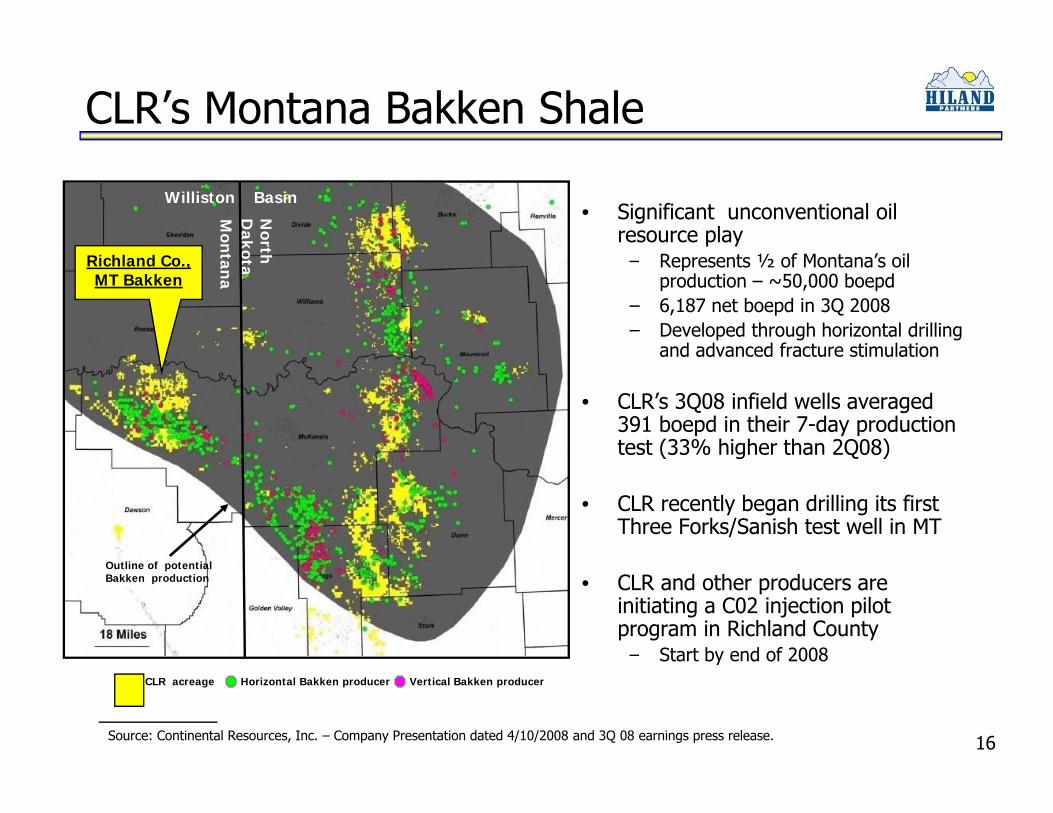
CLR’s Montana Bakken Shale
• Significant unconventional oil resource play
Mon
Nort
Dako
Williston Basin
– Represents ½ of Montana’s oil production – ~50,000 boepd
– 6,187 net boepd in 3Q 2008– Developed through horizontal drilling
and advanced fracture stimulation
tana
thotaRichland Co., MT Bakken
and advanced fracture stimulation
• CLR’s 3Q08 infield wells averaged 391 boepd in their 7-day production test (33% higher than 2Q08)( g Q )
• CLR recently began drilling its first Three Forks/Sanish test well in MT
• CLR and other producers are initiating a C02 injection pilot program in Richland County
– Start by end of 2008
Outline of potential Bakken production
yCLR acreage Horizontal Bakken producer Vertical Bakken producer
16Source: Continental Resources, Inc. – Company Presentation dated 4/10/2008 and 3Q 08 earnings press release.
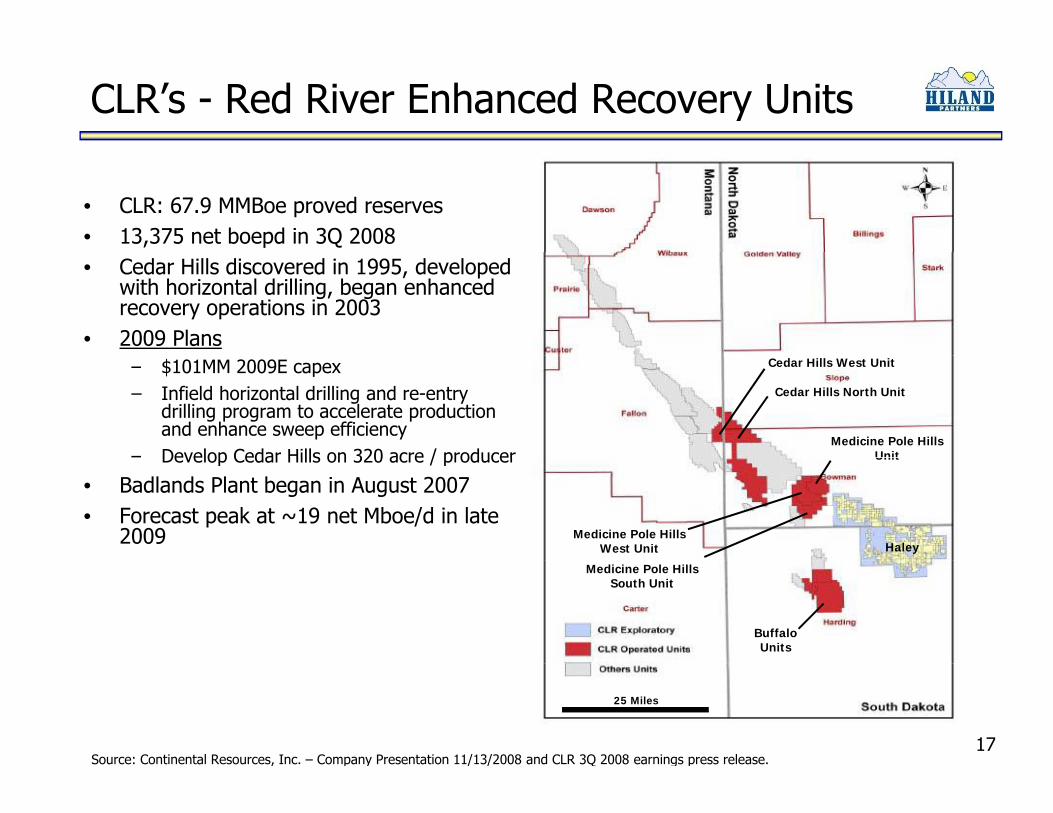
CLR’s - Red River Enhanced Recovery Units
• CLR: 67.9 MMBoe proved reserves• 13,375 net boepd in 3Q 2008• Cedar Hills discovered in 1995, developed
with horizontal drilling, began enhanced recovery operations in 2003
• 2009 Plans– $101MM 2009E capex– Infield horizontal drilling and re-entry
drilling program to accelerate production and enhance sweep efficiency
– Develop Cedar Hills on 320 acre / producer
Cedar Hills North Unit
Cedar Hills West Unit
Medicine Pole Hills UnitDevelop Cedar Hills on 320 acre / producer
• Badlands Plant began in August 2007• Forecast peak at ~19 net Mboe/d in late
2009 Medicine Pole Hills West Unit
Unit
Haley
Buffalo Units
Medicine Pole Hills South Unit
17
25 Miles25 Miles
Source: Continental Resources, Inc. – Company Presentation 11/13/2008 and CLR 3Q 2008 earnings press release.
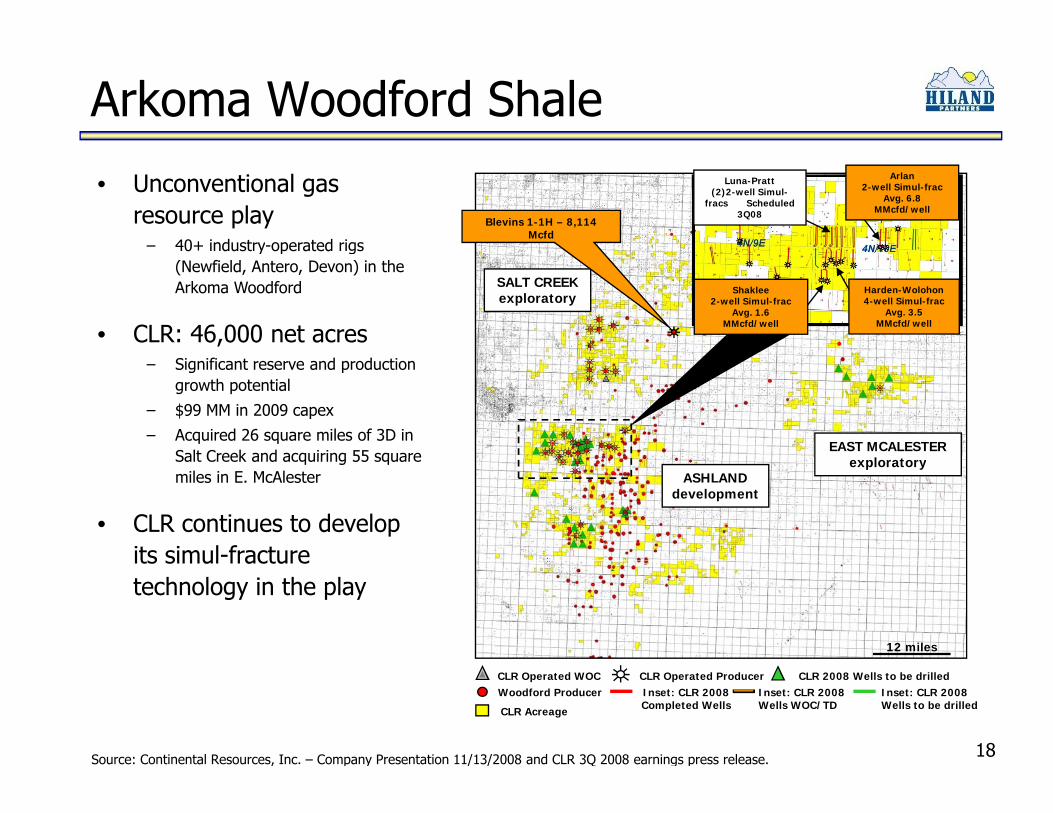
Arkoma Woodford ShaleArlan
2-well Simul-frac Avg. 6.8
MMcfd/wellBlevins 1-1H – 8,114
Mcfd
Luna-Pratt (2)2-well Simul-
fracs Scheduled 3Q08
• Unconventional gas resource play − 40+ industry-operated rigs
SALT CREEK exploratory
Harden-Wolohon 4-well Simul-frac
Avg. 3.5 MMcfd/well
Shaklee 2-well Simul-frac
Avg. 1.6 MMcfd/well
y p g(Newfield, Antero, Devon) in the Arkoma Woodford
• CLR: 46,000 net acres
EAST MCALESTER l t
− Significant reserve and production growth potential
− $99 MM in 2009 capex
− Acquired 26 square miles of 3D in Salt Creek and acquiring 55 square exploratory
ASHLANDdevelopment
Salt Creek and acquiring 55 square miles in E. McAlester
• CLR continues to develop its simul-fracture
12 miles
its simul fracture technology in the play
18
CLR Operated WOC CLR Operated Producer CLR 2008 Wells to be drilledWoodford Producer
CLR Acreage
Inset: CLR 2008 Wells WOC/TD
Inset: CLR 2008 Wells to be drilled
Inset: CLR 2008 Completed Wells
Source: Continental Resources, Inc. – Company Presentation 11/13/2008 and CLR 3Q 2008 earnings press release.
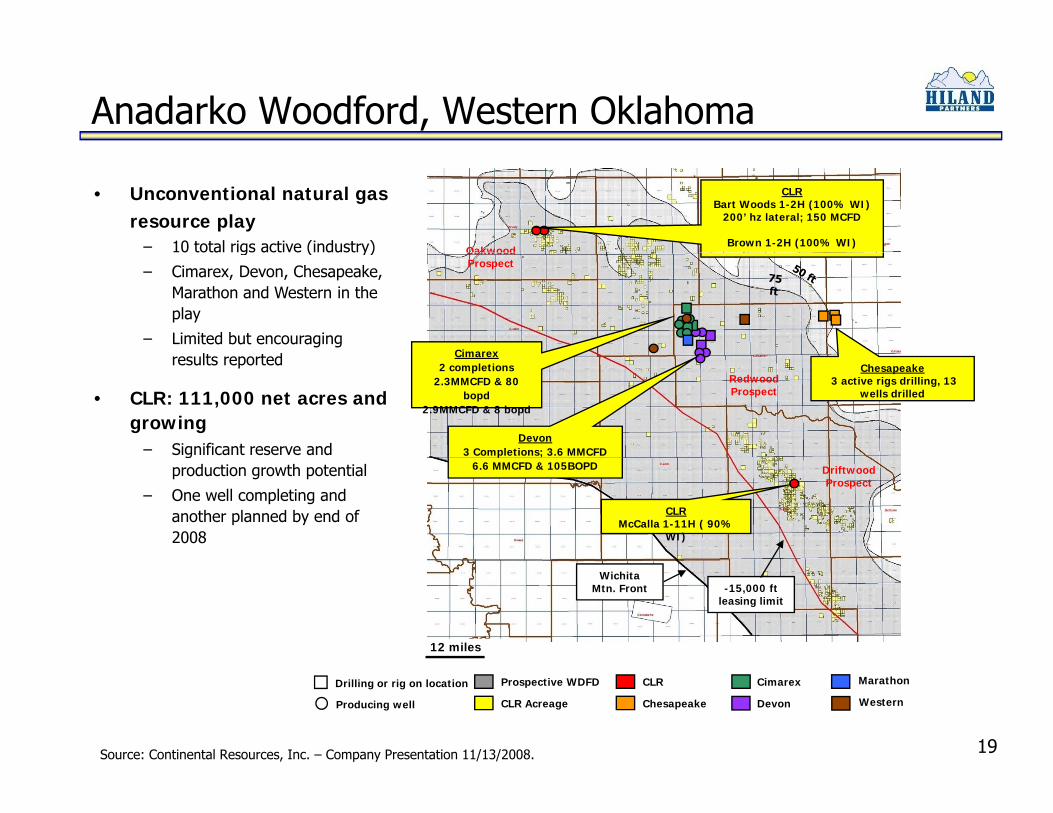
Anadarko Woodford, Western Oklahoma
• Unconventional natural gas resource play− 10 total rigs active (industry) Oakwood
CLR Bart Woods 1-2H (100% WI)
200’ hz lateral; 150 MCFD
Brown 1-2H (100% WI) g ( y)
− Cimarex, Devon, Chesapeake, Marathon and Western in the play
− Limited but encouraging lt t d
Oakwood Prospect
Cimarexresults reported
• CLR: 111,000 net acres and growing − Significant reserve and
Redwood Prospect
Chesapeake3 active rigs drilling, 13
wells drilled
Cimarex2 completions
2.3MMCFD & 80 bopd
2.9MMCFD & 8 bopd
Devon3 Completions; 3.6 MMCFD g
production growth potential
− One well completing and another planned by end of 2008
Driftwood Prospect
6.6 MMCFD & 105BOPD
CLR McCalla 1-11H ( 90%
WI)
12 miles
Wichita Mtn. Front -15,000 ft
leasing limit
19
Marathon
Western
Drilling or rig on location
Producing well
Prospective WDFD
CLR Acreage
CLR
Chesapeake
Cimarex
Devon
Source: Continental Resources, Inc. – Company Presentation 11/13/2008.
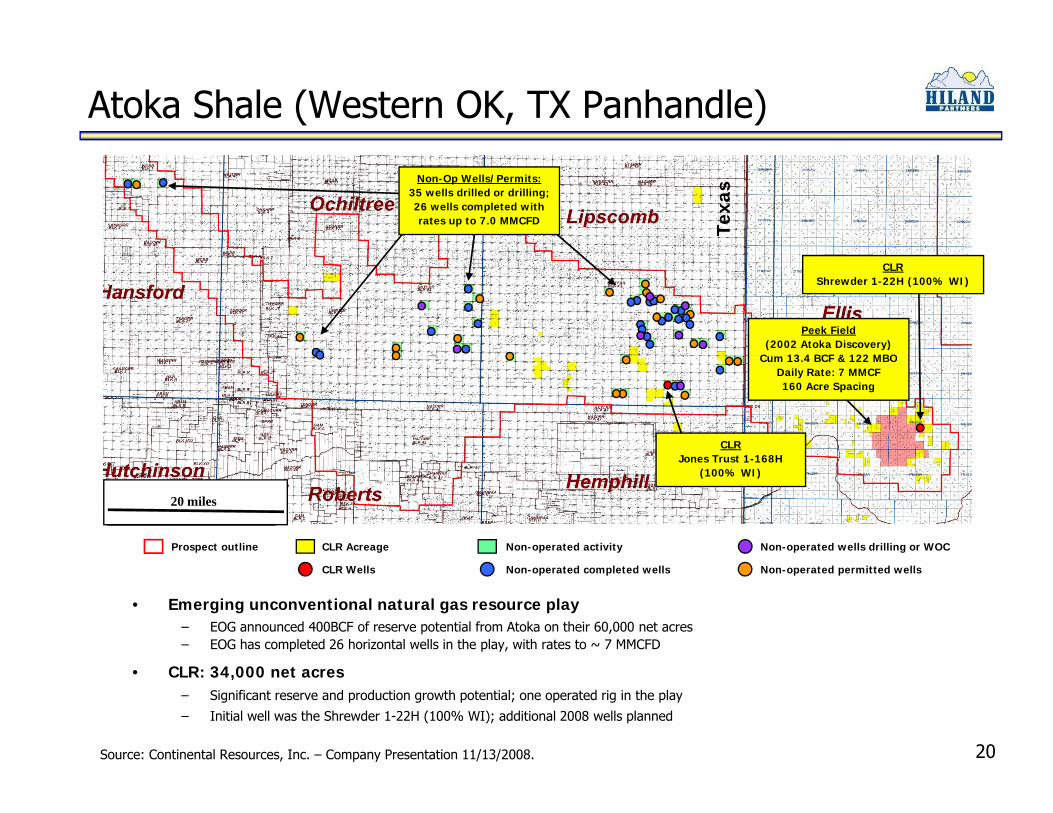
Atoka Shale (Western OK, TX Panhandle)
Non-Op Wells/Permits:35 wells drilled or drilling;26 wells completed with rates up to 7.0 MMCFD Te
xas
Peek Field(2002 Atoka Discovery)
C 13 4 BCF & 122 MBO
CLRShrewder 1-22H (100% WI)
Cum 13.4 BCF & 122 MBODaily Rate: 7 MMCF160 Acre Spacing
CLRJones Trust 1 168H
20 miles
Prospect outline CLR Acreage Non-operated wells drilling or WOCNon-operated activity
Jones Trust 1-168H (100% WI)
20 miles
• Emerging unconventional natural gas resource play − EOG announced 400BCF of reserve potential from Atoka on their 60,000 net acres − EOG has completed 26 horizontal wells in the play, with rates to ~ 7 MMCFD
CLR Wells Non-operated permitted wellsNon-operated completed wells
20
• CLR: 34,000 net acres− Significant reserve and production growth potential; one operated rig in the play
− Initial well was the Shrewder 1-22H (100% WI); additional 2008 wells planned
Source: Continental Resources, Inc. – Company Presentation 11/13/2008.
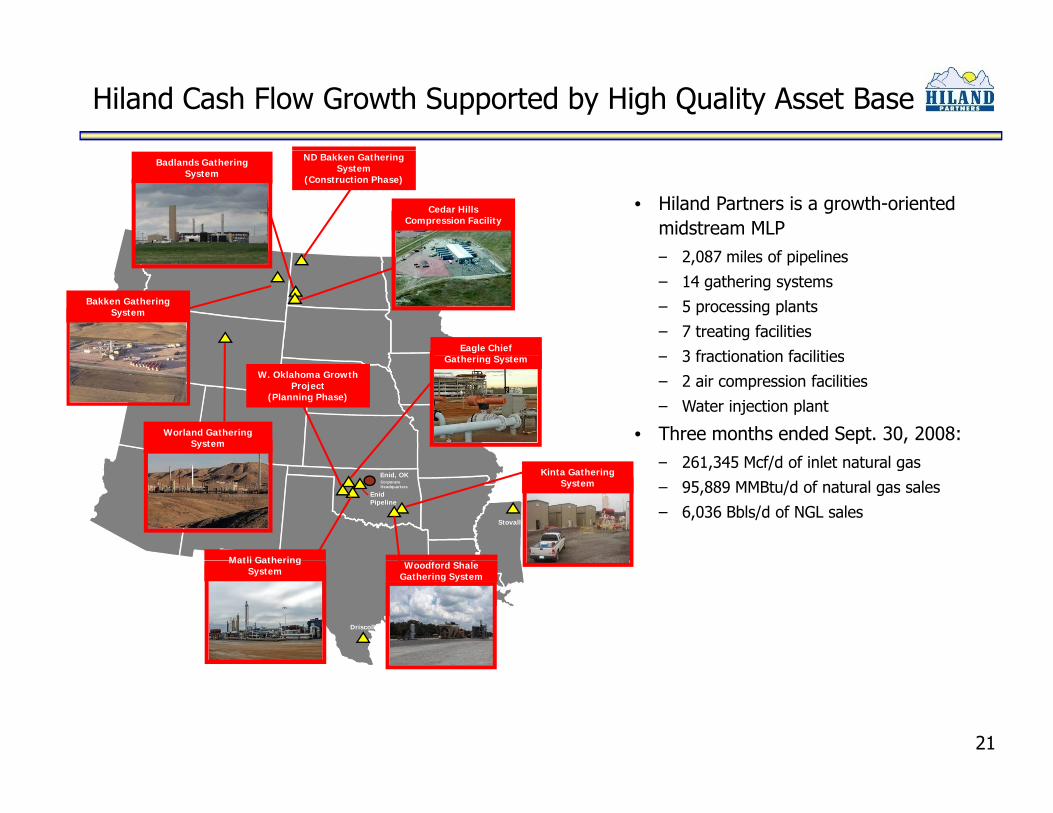
Hiland Cash Flow Growth Supported by High Quality Asset Base
• Hiland Partners is a growth-oriented midstream MLP
2 087 il f i li
Cedar Hills Compression Facility
Badlands Gathering System
ND Bakken Gathering System
(Construction Phase)
– 2,087 miles of pipelines
– 14 gathering systems
– 5 processing plants
– 7 treating facilities
3 fractionation facilities
Bakken Gathering System
Eagle Chief G h i S – 3 fractionation facilities
– 2 air compression facilities
– Water injection plant
• Three months ended Sept. 30, 2008:261 345 M f/d f i l t t l
Gathering System
Worland Gathering System
W. Oklahoma Growth Project
(Planning Phase)
– 261,345 Mcf/d of inlet natural gas
– 95,889 MMBtu/d of natural gas sales
– 6,036 Bbls/d of NGL salesStovall
Enid Pipeline
CorporateHeadquarters
Enid, OK
Matli Gathering
Kinta Gathering System
Driscoll
Matli Gathering System Woodford Shale
Gathering System
21
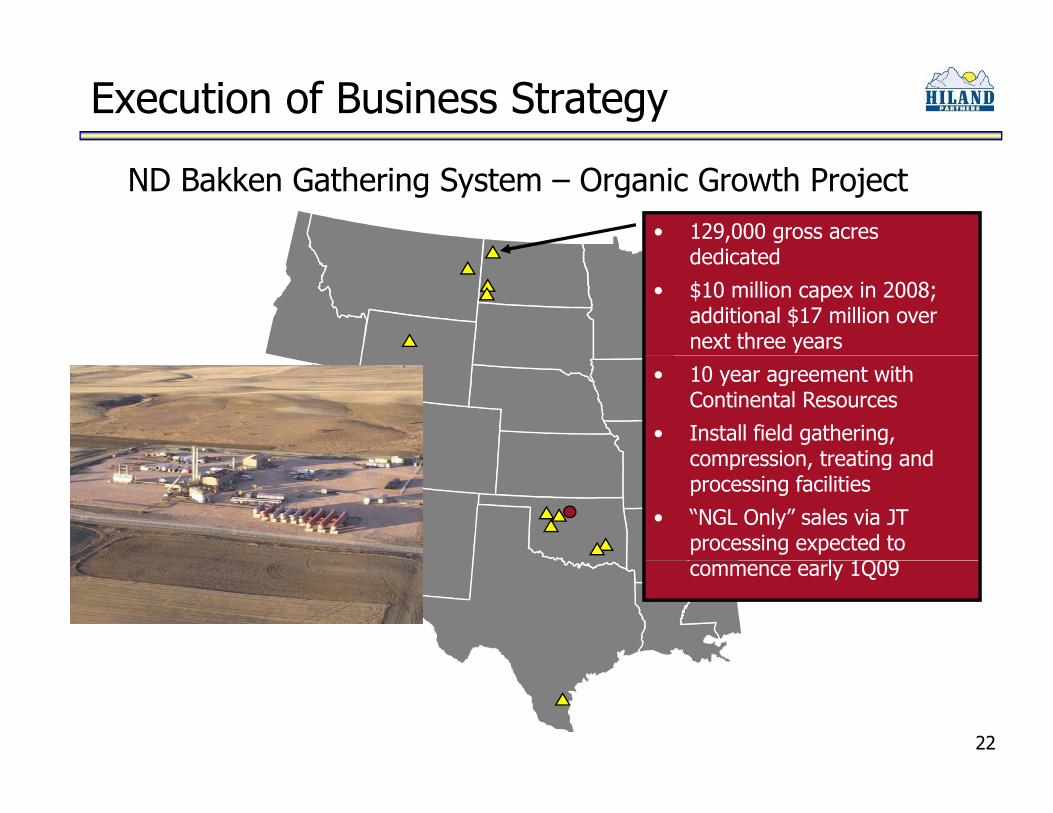
Execution of Business Strategy
• 129,000 gross acres dedicated
ND Bakken Gathering System – Organic Growth Project
dedicated
• $10 million capex in 2008; additional $17 million over next three years
• 10 year agreement with Continental Resources
• Install field gathering, compression treating andcompression, treating and processing facilities
• “NGL Only” sales via JT processing expected to
l 1Q09commence early 1Q09
22
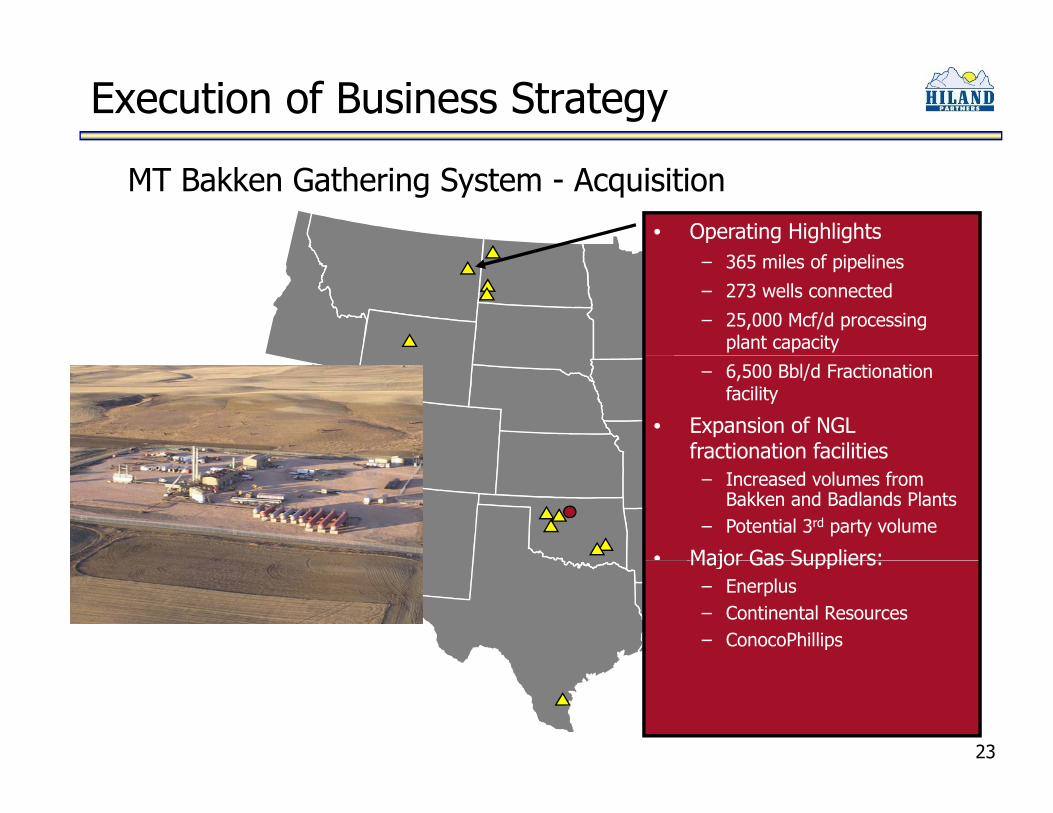
Execution of Business Strategy
• Operating Highlights
MT Bakken Gathering System - Acquisition
– 365 miles of pipelines
– 273 wells connected
– 25,000 Mcf/d processing plant capacity
– 6,500 Bbl/d Fractionation facility
• Expansion of NGL fractionation facilitiesfractionation facilities
– Increased volumes from Bakken and Badlands Plants
– Potential 3rd party volume
• Major Gas Suppliers:Major Gas Suppliers:– Enerplus– Continental Resources– ConocoPhillips
23
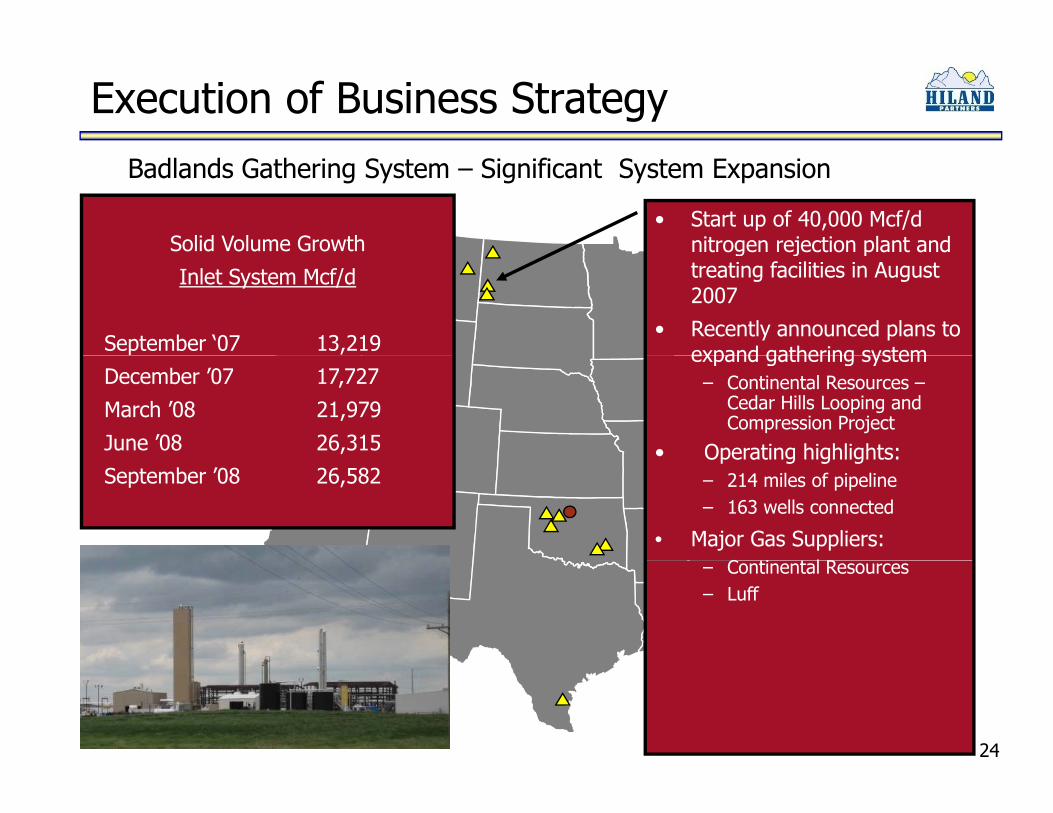
Execution of Business Strategy
• Start up of 40,000 Mcf/d nitrogen rejection plant and
Badlands Gathering System – Significant System Expansion
Solid Volume Growth g j ptreating facilities in August 2007
• Recently announced plans to expand gathering system
Inlet System Mcf/d
September ‘07 13,219 expand gathering system– Continental Resources –
Cedar Hills Looping and Compression Project
• Operating highlights:
December ’07 17,727
March ’08 21,979
June ’08 26,315 Operating highlights:– 214 miles of pipeline– 163 wells connected
• Major Gas Suppliers:C i l R
September ’08 26,582
– Continental Resources– Luff
24
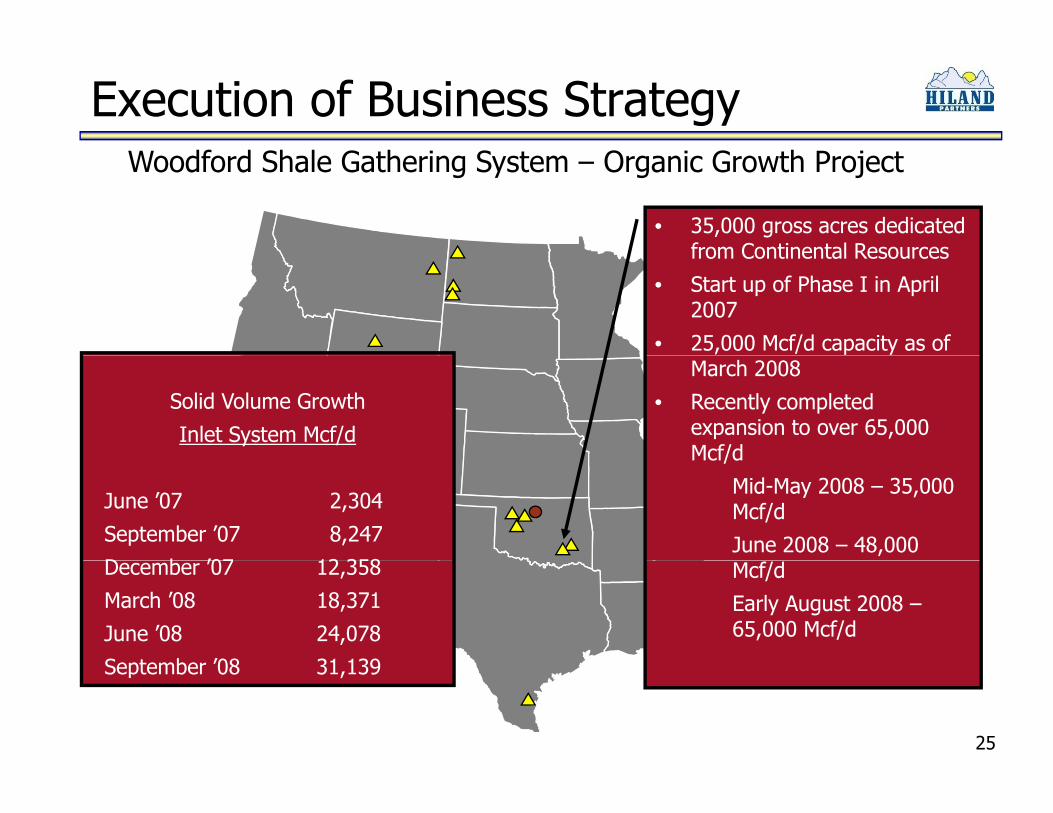
Execution of Business Strategydf d Sh l G h S O G hWoodford Shale Gathering System – Organic Growth Project
• 35,000 gross acres dedicated from Continental Resourcesfrom Continental Resources
• Start up of Phase I in April 2007
• 25,000 Mcf/d capacity as of March 2008
• Recently completed expansion to over 65,000 Mcf/d
Solid Volume Growth
Inlet System Mcf/dMcf/d
Mid-May 2008 – 35,000 Mcf/d
June 2008 – 48,000
June ’07 2,304
September ’07 8,247
D b ’07 12 358 Mcf/d
Early August 2008 –65,000 Mcf/d
December ’07 12,358
March ’08 18,371
June ’08 24,078
September ’08 31 139
25
September ’08 31,139
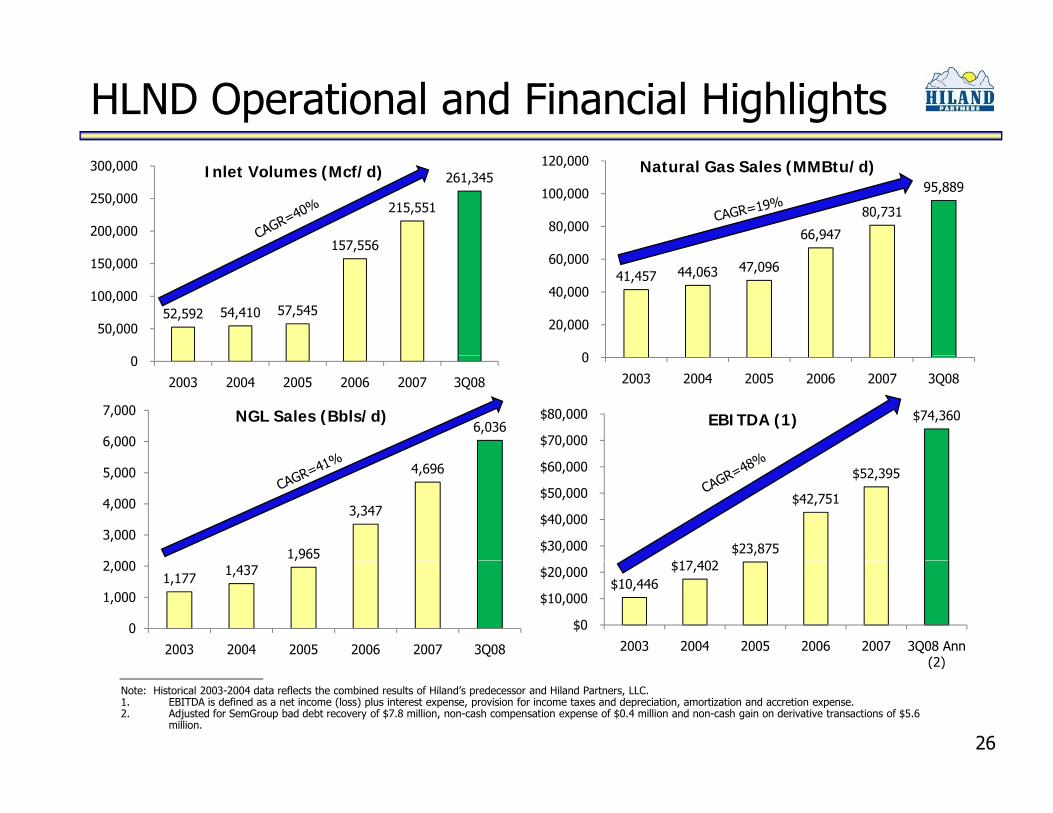
HLND Operational and Financial Highlights
157,556
215,551
261,345
200,000
250,000
300,000 Inlet Volumes (Mcf/d)
66,947
80,731
95,889
80,000
100,000
120,000 Natural Gas Sales (MMBtu/d)
52,592 54,410 57,545 50,000
100,000
150,000 41,457 44,063 47,096
0
20,000
40,000
60,000
0
2003 2004 2005 2006 2007 3Q08
0
2003 2004 2005 2006 2007 3Q08
6,0366,000
7,000 NGL Sales (Bbls/d) $74,360
$70,000
$80,000 EBITDA (1)
1,965
3,347
4,696
3,000
4,000
5,000
$ 02$23,875
$42,751
$52,395
$30,000
$40,000
$50,000
$60,000
1,177 1,437,
0
1,000
2,000
2003 2004 2005 2006 2007 3Q08
$10,446 $17,402
$0
$10,000
$20,000
2003 2004 2005 2006 2007 3Q08 Ann (2)
26
Note: Historical 2003-2004 data reflects the combined results of Hiland’s predecessor and Hiland Partners, LLC.1. EBITDA is defined as a net income (loss) plus interest expense, provision for income taxes and depreciation, amortization and accretion expense.2. Adjusted for SemGroup bad debt recovery of $7.8 million, non-cash compensation expense of $0.4 million and non-cash gain on derivative transactions of $5.6
million.
__________________(2)
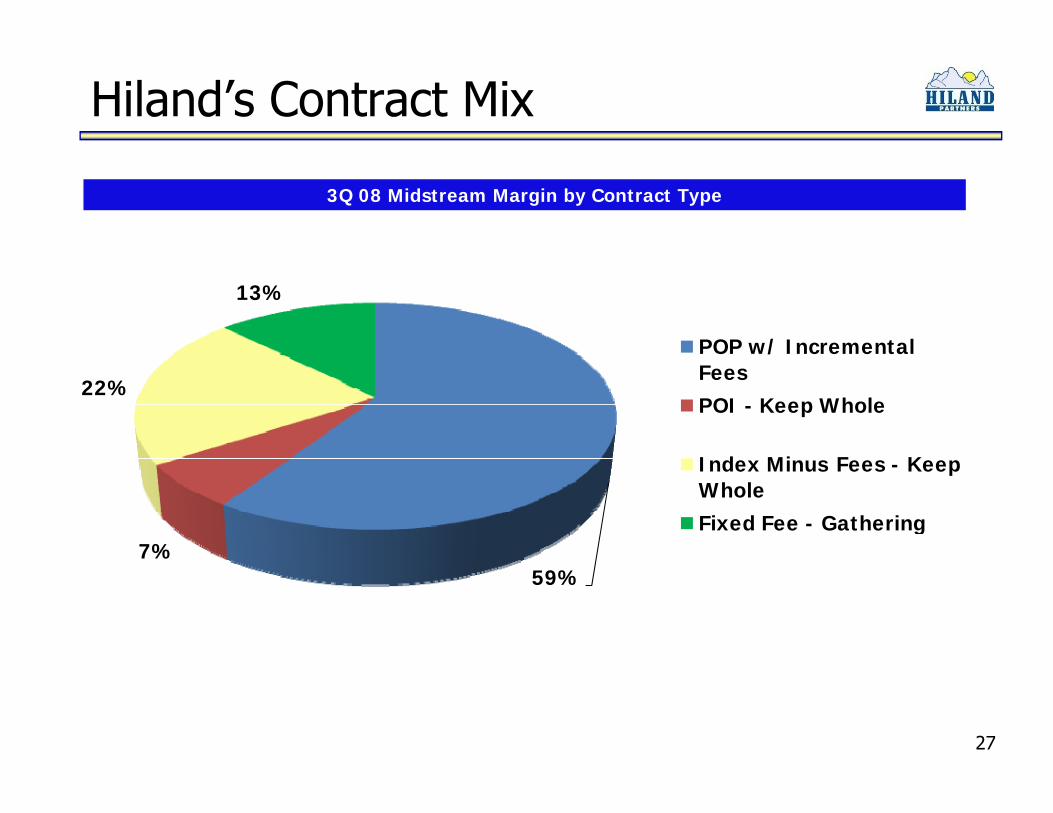
Hiland’s Contract Mix
3Q 08 Midstream Margin by Contract Type
13%
POP w/ Incremental
22%
/FeesPOI - Keep Whole
I d Mi F K
7%
Index Minus Fees - Keep WholeFixed Fee - Gathering
59%
27
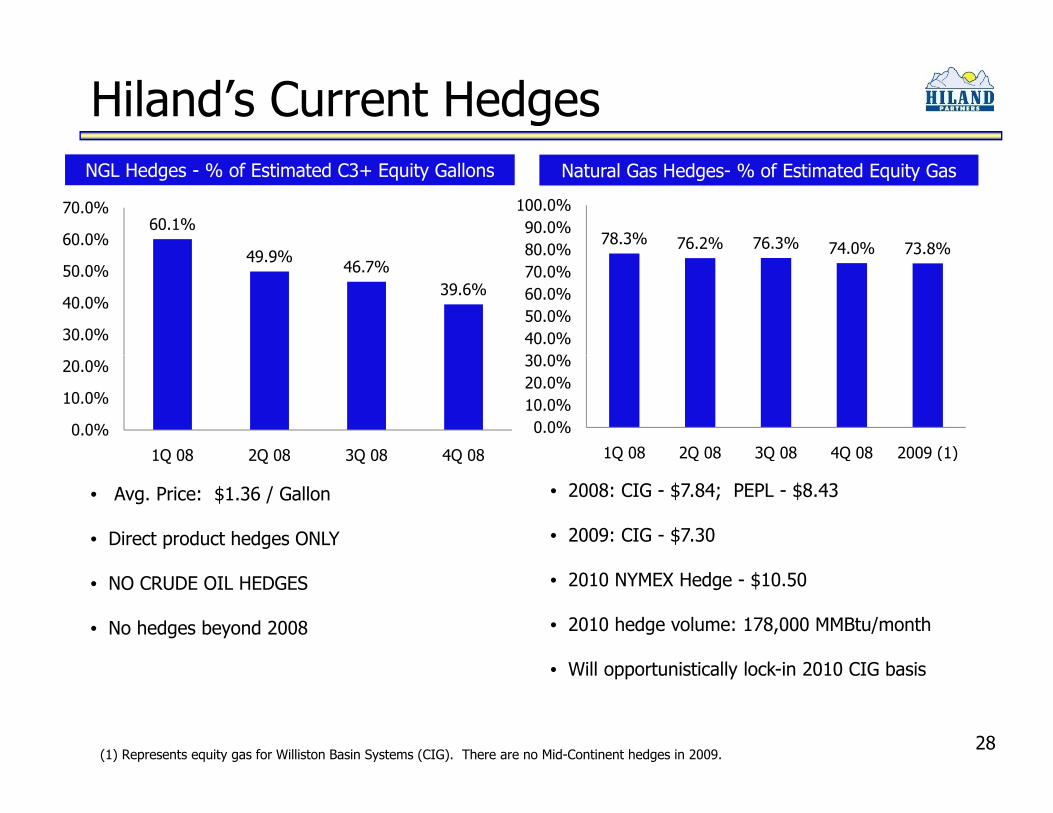
Hiland’s Current HedgesNatural Gas Hedges- % of Estimated Equity GasNGL Hedges - % of Estimated C3+ Equity Gallons
78.3% 76.2% 76.3% 74.0% 73.8%80 0%90.0%
100.0%60.1%
49 9%60.0%
70.0%
74.0% 73.8%
30 0%40.0%50.0%60.0%70.0%80.0%49.9%
46.7%39.6%
30.0%
40.0%
50.0%
0.0%10.0%20.0%30.0%
1Q 08 2Q 08 3Q 08 4Q 08 2009 (1)0.0%
10.0%
20.0%
1Q 08 2Q 08 3Q 08 4Q 08
• Avg. Price: $1.36 / Gallon
• Direct product hedges ONLY
• 2008: CIG - $7.84; PEPL - $8.43
• 2009: CIG - $7.30
1Q 08 2Q 08 3Q 08 4Q 08 2009 (1)1Q 08 2Q 08 3Q 08 4Q 08
• NO CRUDE OIL HEDGES
• No hedges beyond 2008
• 2010 NYMEX Hedge - $10.50
• 2010 hedge volume: 178,000 MMBtu/month
Will t i ti ll l k i 2010 CIG b i
28
• Will opportunistically lock-in 2010 CIG basis
(1) Represents equity gas for Williston Basin Systems (CIG). There are no Mid-Continent hedges in 2009.
Financial Flexibility
• HLND had $37.9 million of available capacity under its existing $300 million credit facility at September 30 2008$300 million credit facility at September 30, 2008
• $50 million accordion feature
• Hiland currently has adequate capital resources to fund its announced expansion projects and ongoing system expansionsannounced expansion projects and ongoing system expansions without having to access the debt or equity markets
29
Questions and AnswersQ