highway concrete pavement technology development and - about
TRANSCRIPT
Highway Concrete Pavement TechnologyDevelopment and Testing: Volume IV—Field Evaluation of Strategic HighwayResearch Program (SHRP) C-206 TestSites (Early Opening of Full-DepthPavement Repairs)
PUBLICATION NO. FHWA-RD-02-085 AUGUST 2006
Research, Development, and TechnologyTurner-Fairbank Highway Research Center6300 Georgetown PikeMcLean, VA 22101-2296
Foreword
The objective of this study was to monitor and evaluate the performance of experimental full-depth repairs made with high-early-strength (HES) materials placed under Strategic Highway Research Program (SHRP) project C-206, Optimization of Highway Concrete Technology. The C-206 full-depth repair experiment was conducted to demonstrate and validate the technologies that allow early opening of full-depth portland cement concrete (PCC) pavement repairs to traffic and to document the information needed to apply this technology.
The experimental factors for the full-depth repair experiment included material type, strength at opening, and repair length. A total of 11 different HES concrete mixes with opening times ranging from 2 to 24 hours were evaluated at 2 field sites (U.S. I-20, Augusta, GA, and State Route 2, Vermilion, OH).
One goal of the SHRP C-206 full-depth repair experiment was to establish guidelines for the minimum strength required at opening time to ensure adequate performance of full-depth PCC pavement repairs. Based on analytical results, guidelines for early opening of full-depth PCC pavement repairs were developed under SHRP C-206; however, long-term monitoring was needed to verify the guidelines developed under SHRP C-206—that task was carried out under this study.
This report presents the results of annual surveys and analysis of the collected data. The report for each site begins with a brief description of the field sections, followed by a discussion of performance of test sections. Finally, conclusions and recommendations for possible changes to fast-track full-depth repair practice are provided based on findings of this study.
Gary L. Henderson Director Office of Infrastructure Research and Development
Notice
This document is disseminated under the sponsorship of the U.S. Department of Transportation in the interest of information exchange. The U.S. Government assumes no liability for its contents or use thereof. This report does not constitute a standard, specification, or regulation.
The U.S. Government does not endorse products or manufacturers. Trade and manufacturers= names appear in this report only because they are considered essential to the object of the document.
Technical Report Documentation Page
1. Report No. 2. Government Accession No. 3. Recipient's Catalog No. FHWA-RD-02-085
4. Title and Subtitle 5. Report Date August 2006 Highway Concrete Technology Pavement Development and Testing: Volume IV—Field
Evaluation of Strategic Highway Research Program (SHRP) C-206 Test Sites (Early Opening of Full-Depth Pavement Repairs) 6. Performing Organization Code
8. Performing Organization Report No.
7. Author(s)
H. Thomas Yu, Jagannath Mallela, and Michael I. Darter
9. Performing Organization Name and Address 10. Work Unit No. (TRAIS)
11. Contract or Grant No.
ERES Division of Applied Research Associates, Inc. 505 W. University Avenue Champaign, IL 61820-3915 DTFH61-94-C-00009
13. Type of Report and Period Covered
Final Report 12. Sponsoring Agency Name and Address
14. Sponsoring Agency Code
Office of Engineering and Highway Operations Research and Development Federal Highway Administration 6300 Georgetown Pike McLean, VA 22101-2296 15. Supplementary Notes FHWA Contracting Officer's Technical Representative: Monte Symons, P.E. 16. Abstract
The objective of this study was to monitor and evaluate the performance of experimental full-depth repairs made with high-early-strength (HES) materials placed under Strategic Highway Research Program (SHRP) project C-206, Optimization of Highway Concrete Technology. The C-206 full-depth repair experiment was conducted to demonstrate and validate the technologies that allow early opening of full-depth portland cement concrete (PCC) pavement repairs to traffic and to document the information needed to apply this technology. The experimental factors for the full-depth repair experiment included material type, strength at opening, and repair length. A total of 11 different HES concrete mixes with opening times ranging from 2 to 24 hours were evaluated at 2 field sites (U.S. I-20, Augusta, GA and State Route 2, Vermilion, OH).
The scope of this study included 5-year monitoring of SHRP C-206 full-depth experiment sections, analyzing the data, and revising the guidelines for early opening of full-depth PCC pavement repairs as needed. The monitoring program consisted of annual visual distress surveys to monitor the development of cracking, faulting, and spalling. The annual surveys were conducted from the fall of 1994 through the fall of 1998. The results of this evaluation showed that full-depth repairs made with HES PCC can provide good long-term performance; however, adverse temperature conditions during installation can cause premature failures. Extremely high PCC temperatures during curing should also be avoided. The fatigue damage due to early opening is negligible, especially for repairs of 3.7 m or shorter. Within the range of strength evaluated under SHRP C-206, the strength at opening could not be correlated to performance. Based on the results of this evaluation, no changes are recommended to the opening criteria suggested in the SHRP C-206 manual of practice.
17. Key Words
Concrete pavement, high-early-strength, early opening, full-depth repair
18. Distribution Statement
No restrictions. This document is available to the public through the National Technical Information Service, Springfield, VA 22161.
19. Security Classif. (of this report) 20. Security Classif. (of this page) 21. No of Pages 1. Price
Unclassified Unclassified 51 Form DOT F 1700.7 (8-72) Reproduction of completed page authorized
SI* (MODERN METRIC) CONVERSION FACTORS APPROXIMATE CONVERSIONS TO SI UNITS
Symbol When You Know Multiply By To Find Symbol LENGTH
in inches 25.4 millimeters mm ft feet 0.305 meters m yd yards 0.914 meters m mi miles 1.61 kilometers km
AREA in2 square inches 645.2 square millimeters mm2
ft2 square feet 0.093 square meters m2
yd2 square yard 0.836 square meters m2
ac acres 0.405 hectares ha mi2 square miles 2.59 square kilometers km2
VOLUME fl oz fluid ounces 29.57 milliliters mL gal gallons 3.785 liters L ft3 cubic feet 0.028 cubic meters m3
yd3 cubic yards 0.765 cubic meters m3
NOTE: volumes greater than 1000 L shall be shown in m3
MASS oz ounces 28.35 grams glb pounds 0.454 kilograms kgT short tons (2000 lb) 0.907 megagrams (or "metric ton") Mg (or "t")
TEMPERATURE (exact degrees) oF Fahrenheit 5 (F-32)/9 Celsius oC
or (F-32)/1.8 ILLUMINATION
fc foot-candles 10.76 lux lx fl foot-Lamberts 3.426 candela/m2 cd/m2
FORCE and PRESSURE or STRESS lbf poundforce 4.45 newtons N lbf/in2 poundforce per square inch 6.89 kilopascals kPa
APPROXIMATE CONVERSIONS FROM SI UNITS Symbol When You Know Multiply By To Find Symbol
LENGTHmm millimeters 0.039 inches in m meters 3.28 feet ft m meters 1.09 yards yd km kilometers 0.621 miles mi
AREA mm2 square millimeters 0.0016 square inches in2
m2 square meters 10.764 square feet ft2
m2 square meters 1.195 square yards yd2
ha hectares 2.47 acres ac km2 square kilometers 0.386 square miles mi2
VOLUME mL milliliters 0.034 fluid ounces fl oz L liters 0.264 gallons gal m3 cubic meters 35.314 cubic feet ft3
m3 cubic meters 1.307 cubic yards yd3
MASS g grams 0.035 ounces ozkg kilograms 2.202 pounds lbMg (or "t") megagrams (or "metric ton") 1.103 short tons (2000 lb) T
TEMPERATURE (exact degrees) oC Celsius 1.8C+32 Fahrenheit oF
ILLUMINATION lx lux 0.0929 foot-candles fc cd/m2 candela/m2 0.2919 foot-Lamberts fl
FORCE and PRESSURE or STRESS N newtons 0.225 poundforce lbf kPa kilopascals 0.145 poundforce per square inch lbf/in2
*SI is the symbol for th International System of Units. Appropriate rounding should be made to comply with Section 4 of ASTM E380. e(Revised March 2003)
ii
TABLE OF CONTENTS
Chapter 1. Introduction................................................................................................................ 1
Chapter 2. Evaluation of Georgia Site ........................................................................................ 3 Description of Field Sections ..................................................................................................... 3 Performance of Georgia Sections .............................................................................................. 6 Analysis of Cracking in GADOT Section.................................................................................. 6
Chapter 3. Evaluation of Ohio Site ........................................................................................... 11 Description of Field Sections ................................................................................................... 11 Performance of Ohio Sections ................................................................................................. 15 Analysis of the Cracking Problem ........................................................................................... 16
Chapter 4. Conclusions and Recommendations....................................................................... 23
Appendix A. Summary of Annual Survey Results................................................................... 25
Appendix B. Summary Tables of Annual Survey Data........................................................... 35
References.................................................................................................................................... 45
iii
LIST OF FIGURES
Figure 1. Estimated traffic on Georgia site. .................................................................................... 7
Figure 2. Available material strength data for the Georgia sections............................................... 7
Figure 3. Estimated strength development of GADOT mix. .......................................................... 8
Figure 4. Comparison of field performance of 4.6-m repairs in the GADOT section and predicted cracking using the rigid pavement performance/rehabilitation (RPPR) 1998 model (Yu et al., 1998). ................................................................................................. 9
Figure 5. Illustration of the effects of damage due to early opening. ............................................. 9
Figure 6. The effects of repair length and built-in curling on performance of full-depth repairs. .................................................................................................................. 10
Figure 7. Map cracking observed in FS section in 1997............................................................... 16
Figure 8. Illustration of typical longitudinal cracking in Ohio sections. ...................................... 17
Figure 9. Development of longitudinal cracking in Ohio sections. .............................................. 17
Figure 10. Correlation between the difference of average curing and overnight low temperatures and longitudinal cracking in Ohio sections at 2 months. ......................... 20
Figure 11. Correlation between the difference of average curing and overnight low temperatures and longitudinal cracking in Ohio sections at 2 years.............................. 20
Figure 12. Correlation between the difference of average curing and overnight low temperatures and longitudinal cracking in Ohio sections at 6 years.............................. 21
Figure A1. Backcalculation results for the GADOT section. ....................................................... 27
Figure A2. Backcalculation results for the FT 1 section. ............................................................. 28
Figure A3. Backcalculation results for the VES section............................................................... 28
Figure A4. Void detection test results for section GA 1............................................................... 32
Figure A5. Void detection test results for section FT 1................................................................ 32
Figure A6. Void detection test results for section VES. ............................................................... 32
iv
LIST OF TABLES
Table 1. Mix design for the materials used at the Georgia site (Whiting et al., 1994). .................. 3
Table 2. Summary of Georgia sections........................................................................................... 4
Table 3. Summary of joint performance of Georgia sections......................................................... 6
Table 4. Mix design for the materials used at the Ohio site (Whiting et al., 1994). ..................... 12
Table 5. Summary of Ohio sections.............................................................................................. 13
Table 6. Summary of joint performance of Ohio sections............................................................ 15
Table 7. Estimated temperature conditions at the time of concrete hardening, and the peak temperature reached during curing for the Ohio sections, ºF. .............................................. 18
Table 8. Estimated temperature conditions at the time of concrete hardening, and the peak temperature reached during curing for the Georgia sections, ºF........................................... 18
Table 9. Comparison of the difference between average concrete temperature during curing including the peak temperature and overnight low temperature, ºF. ......................... 19
Table A1. Summary of Falling Weight Deflectometer test results............................................... 27
Table A2. Deflection load transfer test results of section GA 1, GADOT. .................................. 29
Table A3. Deflection load transfer test results of section FT 1. ................................................... 30
Table A4. Deflection load transfer test results of section GA 3, VES.......................................... 31
Table B1. Distress summary of SHRP C-206 (task D) sections in Georgia................................. 36
Table B2. Distress summary of SHRP C-206 (task D) sections in Ohio...................................... 39
Table B3. Faulting summary of SHRP C-206 (task D) sections in Ohio. .................................... 42
v

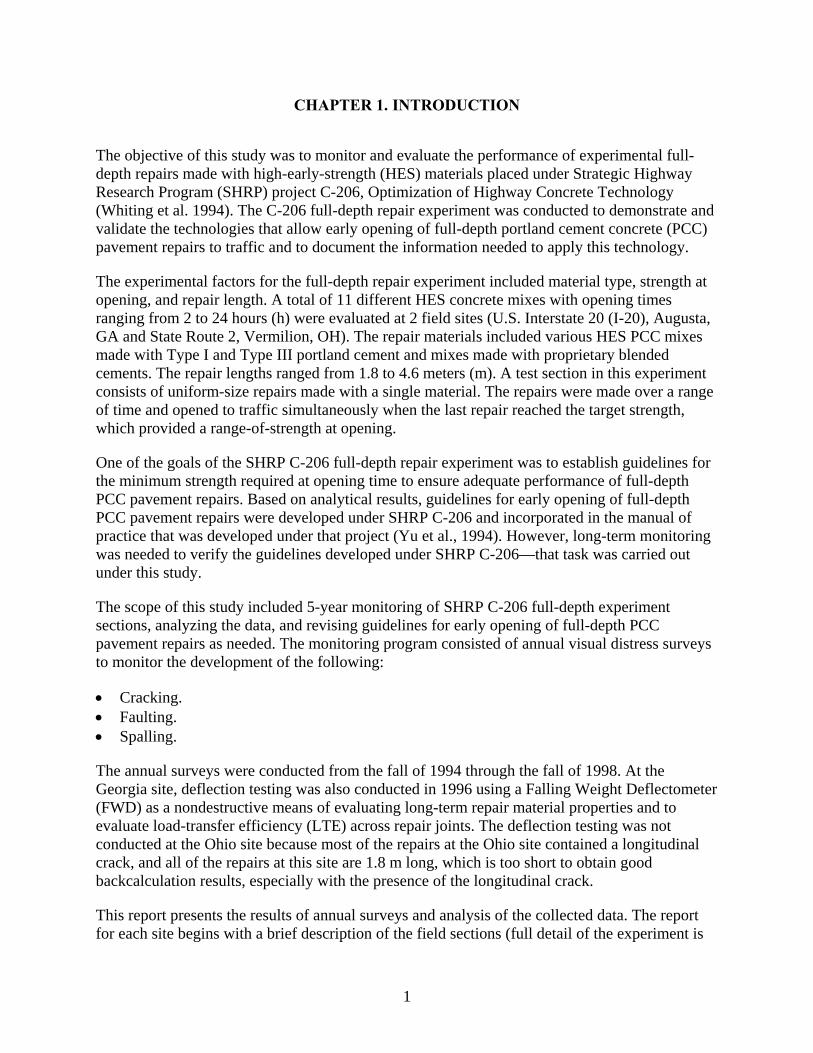
CHAPTER 1. INTRODUCTION
The objective of this study was to monitor and evaluate the performance of experimental full-depth repairs made with high-early-strength (HES) materials placed under Strategic Highway Research Program (SHRP) project C-206, Optimization of Highway Concrete Technology (Whiting et al. 1994). The C-206 full-depth repair experiment was conducted to demonstrate and validate the technologies that allow early opening of full-depth portland cement concrete (PCC) pavement repairs to traffic and to document the information needed to apply this technology.
The experimental factors for the full-depth repair experiment included material type, strength at opening, and repair length. A total of 11 different HES concrete mixes with opening times ranging from 2 to 24 hours (h) were evaluated at 2 field sites (U.S. Interstate 20 (I-20), Augusta, GA and State Route 2, Vermilion, OH). The repair materials included various HES PCC mixes made with Type I and Type III portland cement and mixes made with proprietary blended cements. The repair lengths ranged from 1.8 to 4.6 meters (m). A test section in this experiment consists of uniform-size repairs made with a single material. The repairs were made over a range of time and opened to traffic simultaneously when the last repair reached the target strength, which provided a range-of-strength at opening.
One of the goals of the SHRP C-206 full-depth repair experiment was to establish guidelines for the minimum strength required at opening time to ensure adequate performance of full-depth PCC pavement repairs. Based on analytical results, guidelines for early opening of full-depth PCC pavement repairs were developed under SHRP C-206 and incorporated in the manual of practice that was developed under that project (Yu et al., 1994). However, long-term monitoring was needed to verify the guidelines developed under SHRP C-206—that task was carried out under this study.
The scope of this study included 5-year monitoring of SHRP C-206 full-depth experiment sections, analyzing the data, and revising guidelines for early opening of full-depth PCC pavement repairs as needed. The monitoring program consisted of annual visual distress surveys to monitor the development of the following:
• Cracking. • Faulting. • Spalling.
The annual surveys were conducted from the fall of 1994 through the fall of 1998. At the Georgia site, deflection testing was also conducted in 1996 using a Falling Weight Deflectometer (FWD) as a nondestructive means of evaluating long-term repair material properties and to evaluate load-transfer efficiency (LTE) across repair joints. The deflection testing was not conducted at the Ohio site because most of the repairs at the Ohio site contained a longitudinal crack, and all of the repairs at this site are 1.8 m long, which is too short to obtain good backcalculation results, especially with the presence of the longitudinal crack.
This report presents the results of annual surveys and analysis of the collected data. The report for each site begins with a brief description of the field sections (full detail of the experiment is
1

provided in Whiting et al., 1994), followed by a discussion of performance of test sections. Finally, conclusions and recommendations for possible changes to fast-track full-depth repair practice are provided based on findings of this study. A summary of the results of annual condition survey is provided in appendix A. Appendix B provides summary tables of the data collected for all sections.
2
CHAPTER 2. EVALUATION OF GEORGIA SITE
DESCRIPTION OF FIELD SECTIONS
The Georgia site consists of three test sections located on eastbound U.S. Interstate 20 (I-20), near Augusta, GA, between mileposts 189 and 192. The existing pavement at this site is
230-millimeter (mm) jointed plain concrete pavement (JPCP) with 9-meter (m) joint spacing. The two-way annual average daily traffic (ADT) at this location was 25,750, with 19.5 percent trucks. The average truck factor during the time of field testing was 1.37.
The materials tested at this site include Georgia Department of Transportation’s 4-hour (h) mix (GADOT), Fast Track I (FT I), and Very-High-Early-Strength (VES). The mix designs for these materials are given in table 1. GADOT has extensive experience with fast-track full-depth repairs, and the SHRP C-206 repairs were included as a part of an on-going repair project. FT I is a 12- to 24-h opening PCC mix developed by the Iowa DOT (Grove, Jones, and Bharil, 1993). VES is a 4-h opening PCC mix that utilizes a nonchloride accelerator (calcium nitrite) developed under SHRP C-205.
Table 1. Mix design for the materials used at the Georgia site (Whiting et al., 1994).
Mix Component (per cubic yard (yd3)) GADOT FT I VES
Cement type Type I Type III Type III Cement, pound (lb) 752 740 870 Fine aggregate, lb 1,025 1,320 825 Coarse aggregate, lb 1,805 1,420 1,720 Water, lb 285 262 335 Water reducer, ounce (oz) — 44.0 — Accelerator (DSA), gallon (gal) — — 6.0 Accelerator (CaCl2), gal 1.6 — — High-range water reducer, oz — — 43.5 Air entraining agent, oz 9.8 12.0 43.5 w/c ratio 0.38 0.35 0.39 Nominal opening time 4 hr 12 to 24 hr 4 hr
1 yd3 = 0.7645 m3; 1 lb = 0.4535 kg; 1 gal = 3.78 liter (L); 1 oz = 29.57 millileter (mL)
w/c = water to cement ratio
The Georgia sections were placed between about 10 p.m. and 2 a.m. and opened to traffic at 6 a.m. At this site, a typical day’s work started at 6:30 p.m. with the closing of the work area to traffic. Concrete removal started as soon as enough of the work area was blocked off, and concrete placement typically started at 10 p.m. (Whiting et al., 1994).
3
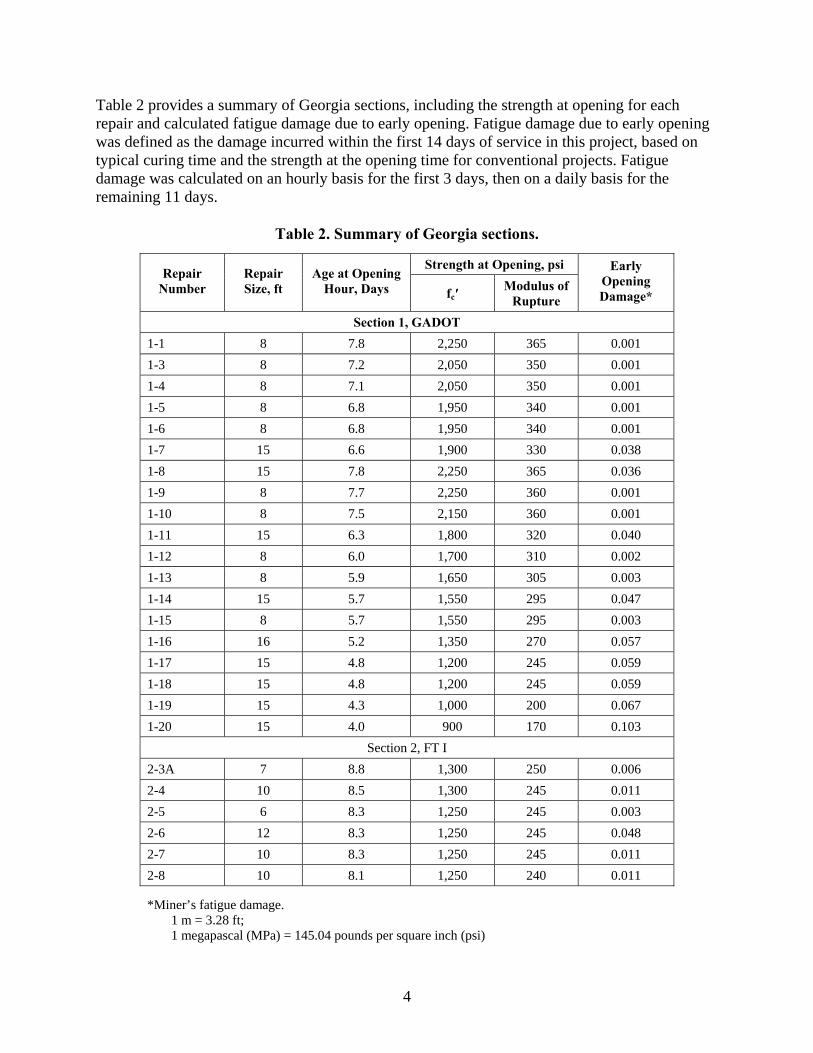
Table 2 provides a summary of Georgia sections, including the strength at opening for each repair and calculated fatigue damage due to early opening. Fatigue damage due to early opening was defined as the damage incurred within the first 14 days of service in this project, based on typical curing time and the strength at the opening time for conventional projects. Fatigue damage was calculated on an hourly basis for the first 3 days, then on a daily basis for the remaining 11 days.
Table 2. Summary of Georgia sections.
Strength at Opening, psi Repair
Number Repair Size, ft
Age at Opening Hour, Days fc′
Modulus of Rupture
Early Opening Damage*
Section 1, GADOT 1-1 8 7.8 2,250 365 0.001 1-3 8 7.2 2,050 350 0.001 1-4 8 7.1 2,050 350 0.001 1-5 8 6.8 1,950 340 0.001 1-6 8 6.8 1,950 340 0.001 1-7 15 6.6 1,900 330 0.038 1-8 15 7.8 2,250 365 0.036 1-9 8 7.7 2,250 360 0.001 1-10 8 7.5 2,150 360 0.001 1-11 15 6.3 1,800 320 0.040 1-12 8 6.0 1,700 310 0.002 1-13 8 5.9 1,650 305 0.003 1-14 15 5.7 1,550 295 0.047 1-15 8 5.7 1,550 295 0.003 1-16 16 5.2 1,350 270 0.057 1-17 15 4.8 1,200 245 0.059 1-18 15 4.8 1,200 245 0.059 1-19 15 4.3 1,000 200 0.067 1-20 15 4.0 900 170 0.103
Section 2, FT I 2-3A 7 8.8 1,300 250 0.006 2-4 10 8.5 1,300 245 0.011 2-5 6 8.3 1,250 245 0.003 2-6 12 8.3 1,250 245 0.048 2-7 10 8.3 1,250 245 0.011 2-8 10 8.1 1,250 240 0.011
*Miner’s fatigue damage. 1 m = 3.28 ft; 1 megapascal (MPa) = 145.04 pounds per square inch (psi)
4
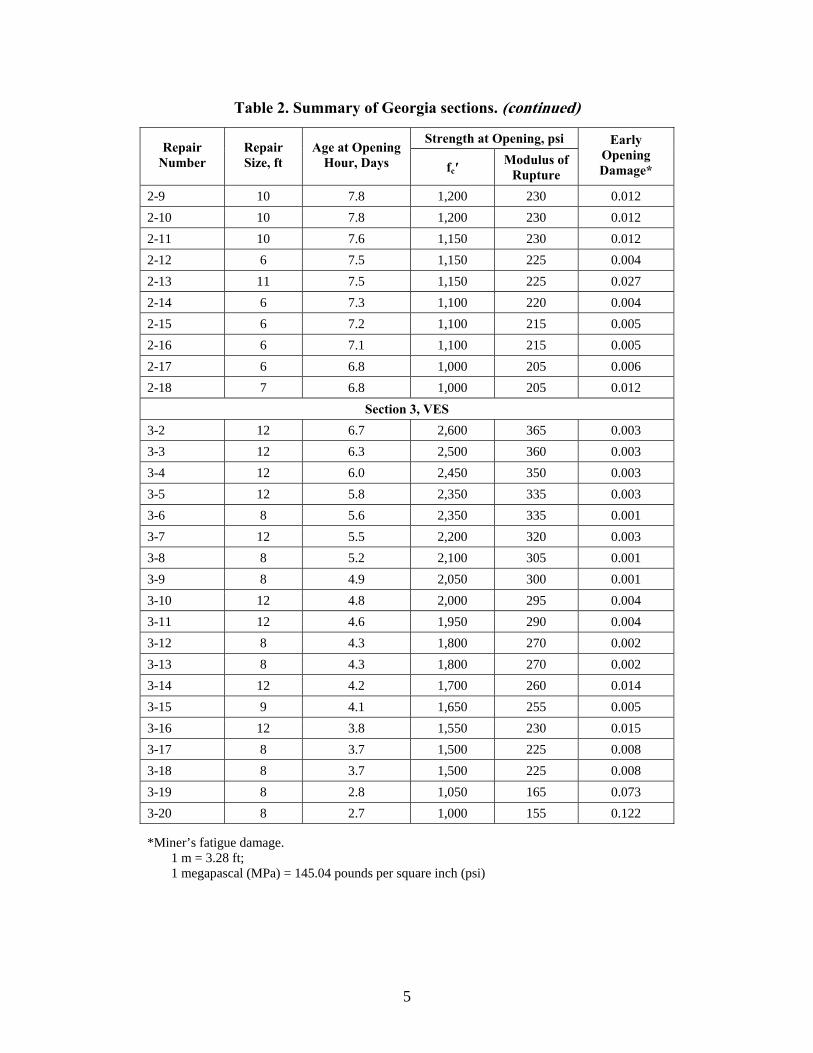
Table 2. Summary of Georgia sections. (continued)
Strength at Opening, psi Repair
Number Repair Size, ft
Age at Opening Hour, Days fc′
Modulus of Rupture
Early Opening Damage*
2-9 10 7.8 1,200 230 0.012 2-10 10 7.8 1,200 230 0.012 2-11 10 7.6 1,150 230 0.012 2-12 6 7.5 1,150 225 0.004 2-13 11 7.5 1,150 225 0.027 2-14 6 7.3 1,100 220 0.004 2-15 6 7.2 1,100 215 0.005 2-16 6 7.1 1,100 215 0.005 2-17 6 6.8 1,000 205 0.006 2-18 7 6.8 1,000 205 0.012
Section 3, VES 3-2 12 6.7 2,600 365 0.003 3-3 12 6.3 2,500 360 0.003 3-4 12 6.0 2,450 350 0.003 3-5 12 5.8 2,350 335 0.003 3-6 8 5.6 2,350 335 0.001 3-7 12 5.5 2,200 320 0.003 3-8 8 5.2 2,100 305 0.001 3-9 8 4.9 2,050 300 0.001 3-10 12 4.8 2,000 295 0.004 3-11 12 4.6 1,950 290 0.004 3-12 8 4.3 1,800 270 0.002 3-13 8 4.3 1,800 270 0.002 3-14 12 4.2 1,700 260 0.014 3-15 9 4.1 1,650 255 0.005 3-16 12 3.8 1,550 230 0.015 3-17 8 3.7 1,500 225 0.008 3-18 8 3.7 1,500 225 0.008 3-19 8 2.8 1,050 165 0.073 3-20 8 2.7 1,000 155 0.122
*Miner’s fatigue damage. 1 m = 3.28 ft; 1 megapascal (MPa) = 145.04 pounds per square inch (psi)
5
PERFORMANCE OF GEORGIA SECTIONS
In general, the Georgia sections provided excellent performance. After 6 years of service, the only patches that developed any distresses were the 4.6-m repairs in the GADOT section and one 2.4-m repair in the same section. Faulting was minimal (less than 1 mm) and remained unchanged (within measurement error) throughout the monitoring period, although the LTE was somewhat less than that found in new pavements with an effective load transfer design. A summary of joint performance data is given in table 3; detailed data are given in appendix B. The Georgia sections also did not exhibit any material-related distresses.
ANALYSIS OF CRACKING IN GADOT SECTION
The cracking of the longer (4.6-m) repairs in the GADOT section is consistent with expectations. The Georgia sections were placed at night and opened to traffic at 6 a.m. At the time of concrete hardening, there was no difference in the temperature between the top and bottom of the PCC slab. Thus, the repair slabs were built flat with no built-in temperature gradients. Although an excessive built-in negative temperature gradient is undesirable because it contributes to top-down cracking, a moderate amount of built-in negative curling is beneficial because it moderates the effects of high daytime temperature gradients (Yu et al., 1998). Without any built-in curling, the 4.6-m repair length is excessive for a 230-mm repair slab. Differential shrinkage does provide equivalent built-in temperature of about –2.2 °C (28.04 °F), but that is not enough to counter sufficiently the effects of high daytime temperature gradients.
Table 3. Summary of joint performance of Georgia sections.
Faulting, inch* Average LTE, percent Section
1994 1995 1996 1997 1998 1992 1996 GA DOT 0.04 0.01 0.01 0.01 0.01 73 75 FT I 0.04 0.03 0.03 0.03 0.03 77 72 VES 0.04 0.01 0.01 0.00 0.03 77 80
*Average absolute faulting.
1 inch = 25.4 mm
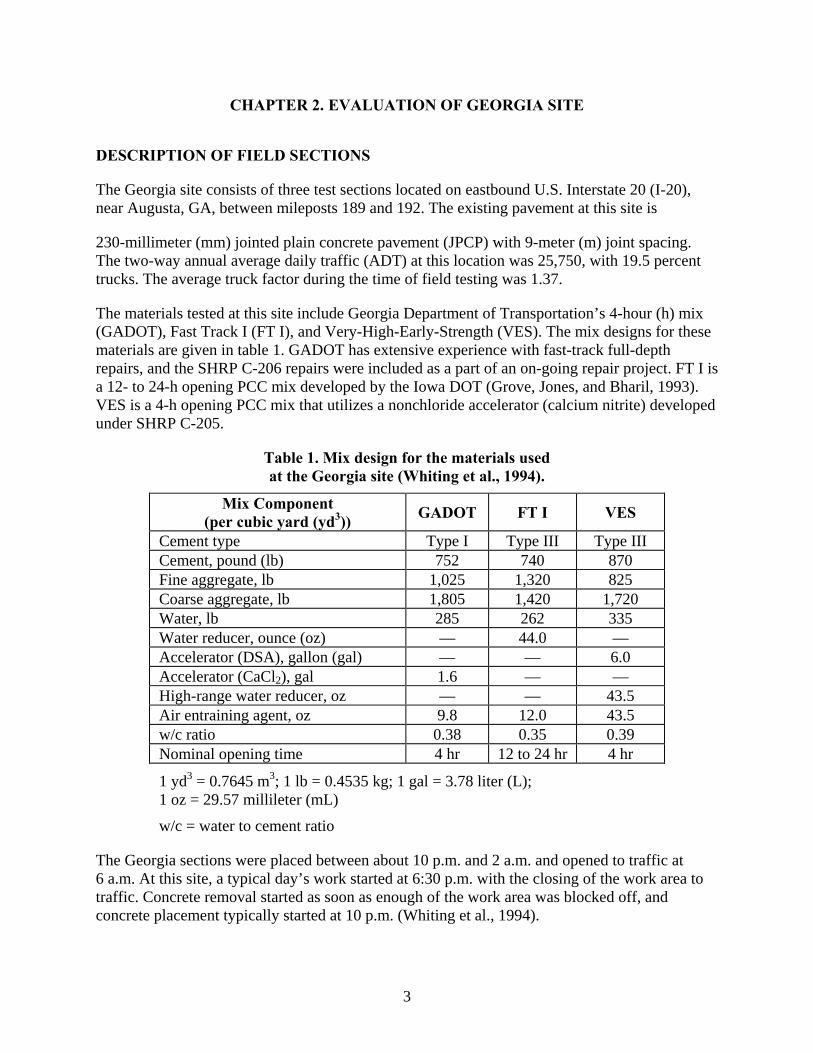
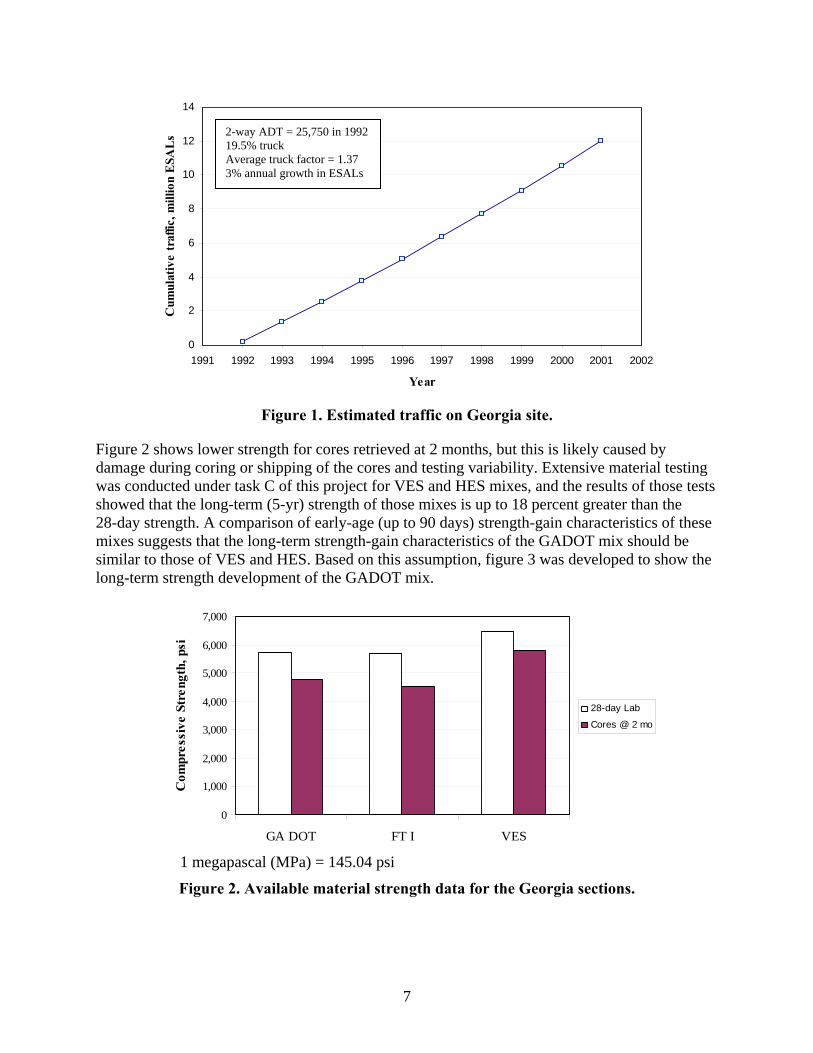
The cracking problem was analyzed using the fatigue calculation procedure and model developed by Yu and colleagues (1998). The traffic data needed for the fatigue analysis are shown in figure 1. The traffic on I-20 through the project site is relatively high. The annual traffic is about 1.1 million equivalent single axles (ESALs) in the design lane.
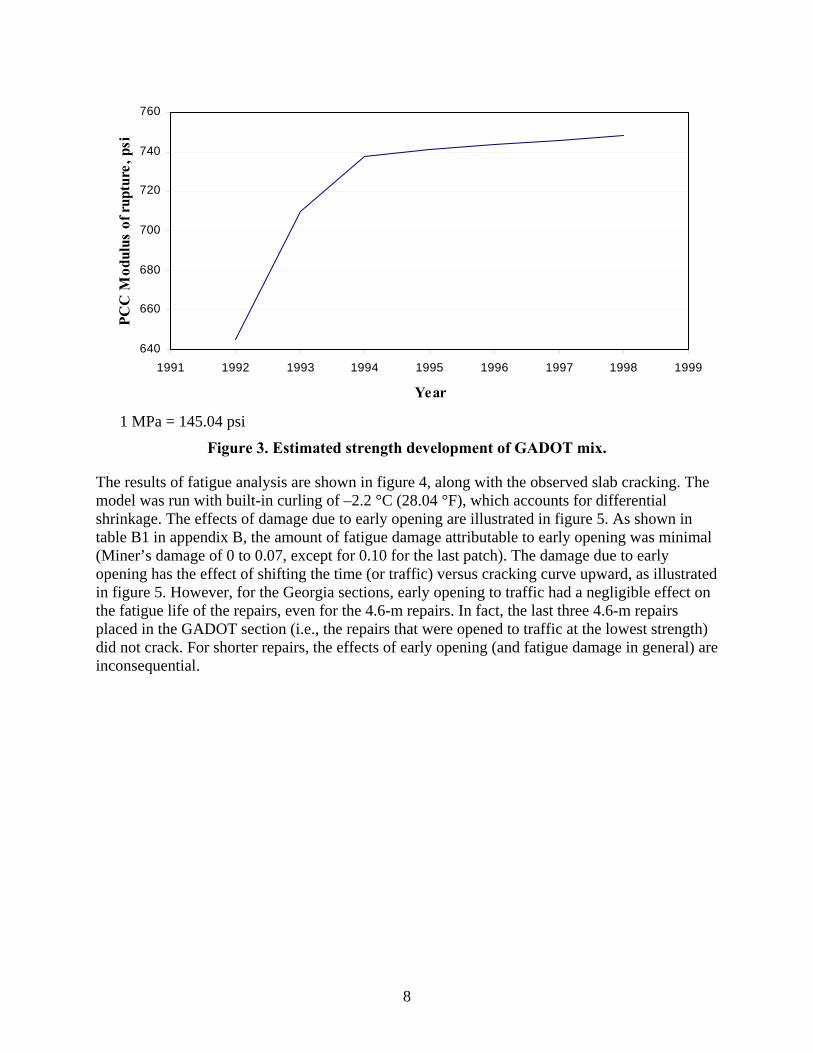
This project did not include a material-testing program; therefore, certain assumptions had to be made regarding long-term strength development of the GADOT mix. Under SHRP C-206, extensive laboratory testing of repair materials was conducted to develop correlation relationships for maturity and pulse-velocity methods of determining in-place material properties (Whiting et al., 1994). Those tests showed that for the GADOT mix, the 90-day compressive strength is about 9 percent greater than the 28-day strength. Also under SHRP C-206, cores were retrieved from the test sections during a 2-month evaluation and tested for strength. Figure 2 summarizes the available information on Georgia site materials.
6
0
2
4
6
8
10
12
14
1991 1992 1993 1994 1995 1996 1997 1998 1999 2000 2001 2002
Year
Cum
ulat
ive
traf
fic, m
illio
n E
SAL
s
2-way ADT = 25,750 in 1992 19.5% truck Average truck factor = 1.37 3% annual growth in ESALs
Figure 1. Estimated traffic on Georgia site.
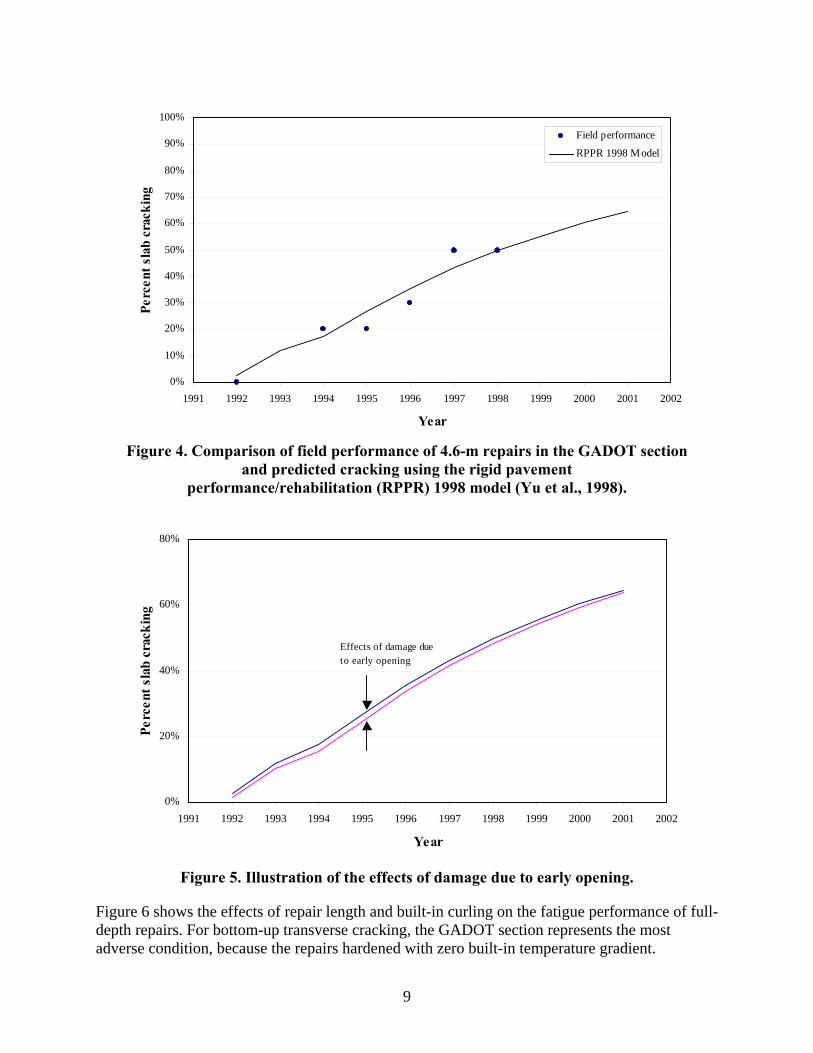
Figure 2 shows lower strength for cores retrieved at 2 months, but this is likely caused by damage during coring or shipping of the cores and testing variability. Extensive material testing was conducted under task C of this project for VES and HES mixes, and the results of those tests showed that the long-term (5-yr) strength of those mixes is up to 18 percent greater than the 28-day strength. A comparison of early-age (up to 90 days) strength-gain characteristics of these mixes suggests that the long-term strength-gain characteristics of the GADOT mix should be similar to those of VES and HES. Based on this assumption, figure 3 was developed to show the long-term strength development of the GADOT mix.
0
1,000
2,000
3,000
4,000
5,000
6,000
7,000
GA DOT FT I VES
Com
pres
sive
Str
engt
h, p
si
28-day Lab
Cores @ 2 mo
1 megapascal (MPa) = 145.04 psi
Figure 2. Available material strength data for the Georgia sections.
7
640
660
680
700
720
740
760
1991 1992 1993 1994 1995 1996 1997 1998 1999
Year
PCC
Mod
ulus
of r
uptu
re, p
si
1 MPa = 145.04 psi
Figure 3. Estimated strength development of GADOT mix.
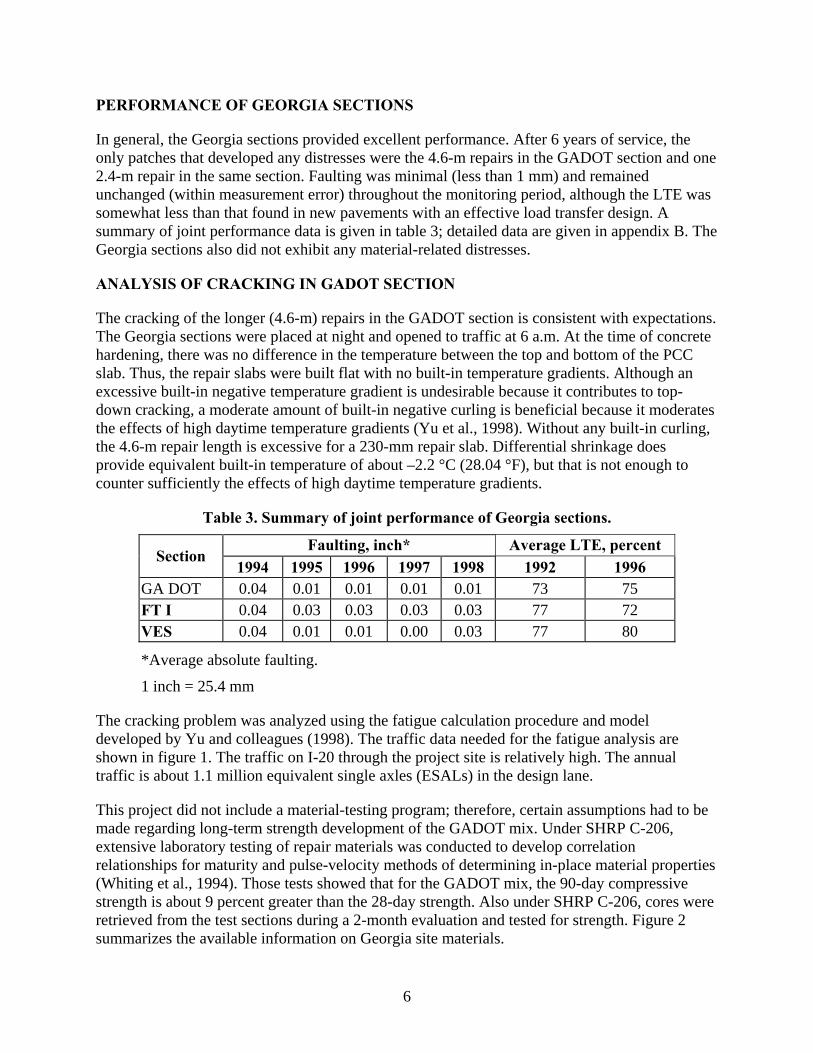
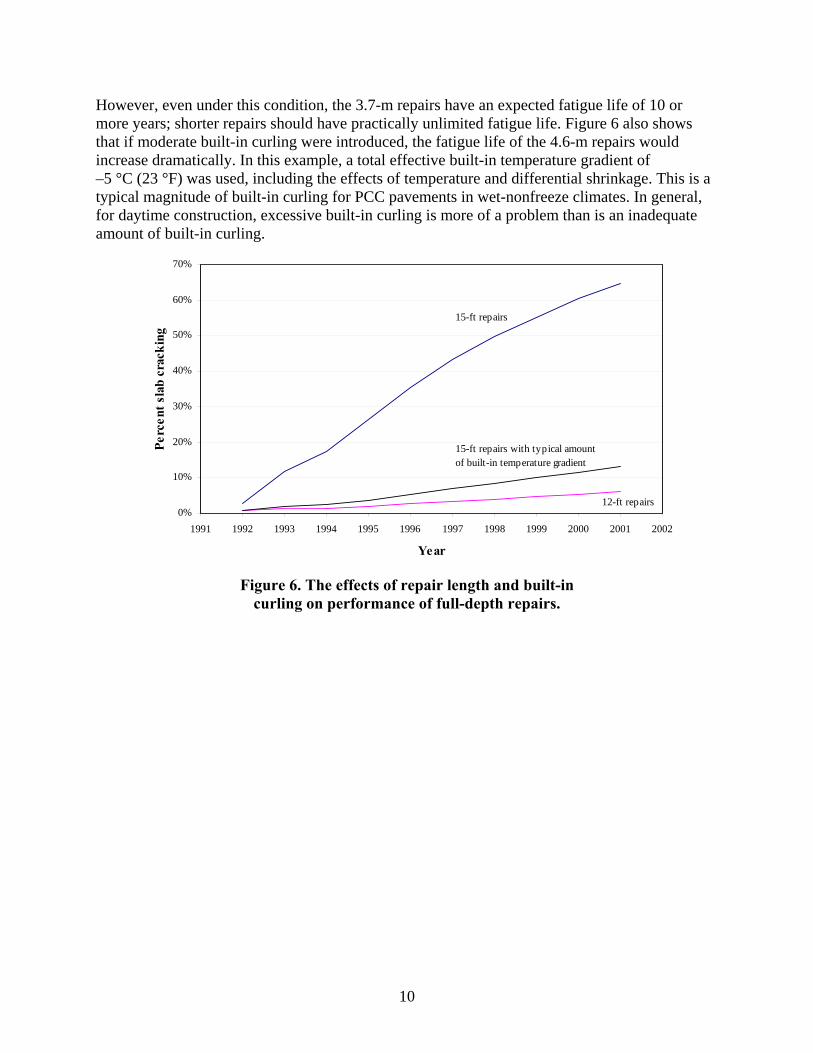
The results of fatigue analysis are shown in figure 4, along with the observed slab cracking. The model was run with built-in curling of –2.2 °C (28.04 °F), which accounts for differential shrinkage. The effects of damage due to early opening are illustrated in figure 5. As shown in table B1 in appendix B, the amount of fatigue damage attributable to early opening was minimal (Miner’s damage of 0 to 0.07, except for 0.10 for the last patch). The damage due to early opening has the effect of shifting the time (or traffic) versus cracking curve upward, as illustrated in figure 5. However, for the Georgia sections, early opening to traffic had a negligible effect on the fatigue life of the repairs, even for the 4.6-m repairs. In fact, the last three 4.6-m repairs placed in the GADOT section (i.e., the repairs that were opened to traffic at the lowest strength) did not crack. For shorter repairs, the effects of early opening (and fatigue damage in general) are inconsequential.
8
0%
10%
20%
30%
40%
50%
60%
70%
80%
90%
100%
1991 1992 1993 1994 1995 1996 1997 1998 1999 2000 2001 2002
Year
Perc
ent s
lab
crac
king
Field performance
RPPR 1998 Model
Figure 4. Comparison of field performance of 4.6-m repairs in the GADOT section
and predicted cracking using the rigid pavement performance/rehabilitation (RPPR) 1998 model (Yu et al., 1998).
0%
20%
40%
60%
80%
1991 1992 1993 1994 1995 1996 1997 1998 1999 2000 2001 2002
Year
Perc
ent s
lab
crac
king
Effects of damage dueto early opening
Figure 5. Illustration of the effects of damage due to early opening.
Figure 6 shows the effects of repair length and built-in curling on the fatigue performance of full-depth repairs. For bottom-up transverse cracking, the GADOT section represents the most adverse condition, because the repairs hardened with zero built-in temperature gradient.
9
However, even under this condition, the 3.7-m repairs have an expected fatigue life of 10 or more years; shorter repairs should have practically unlimited fatigue life. Figure 6 also shows that if moderate built-in curling were introduced, the fatigue life of the 4.6-m repairs would increase dramatically. In this example, a total effective built-in temperature gradient of –5 °C (23 °F) was used, including the effects of temperature and differential shrinkage. This is a typical magnitude of built-in curling for PCC pavements in wet-nonfreeze climates. In general, for daytime construction, excessive built-in curling is more of a problem than is an inadequate amount of built-in curling.
0%
10%
20%
30%
40%
50%
60%
70%
1991 1992 1993 1994 1995 1996 1997 1998 1999 2000 2001 2002
Year
Perc
ent s
lab
crac
king
15-ft repairs
12-ft repairs
15-ft repairs with typical amount of built-in temperature gradient
Figure 6. The effects of repair length and built-in
curling on performance of full-depth repairs.
10
11
CHAPTER 3. EVALUATION OF OHIO SITE
DESCRIPTION OF FIELD SECTIONS
The Ohio site consists of eight test sections located on eastbound and westbound State Route 2, near Vermilion, OH, between the Baumhart Road and Vermilion Road exits. This section of State Route 2 is an Ohio Department of Transportation (ODOT) research road constructed in 1974 with 104 test sections to evaluate the effects of various pavement design and material factors on PCC pavement performance. Extensive research was conducted at this site into various material factors affecting D-cracking. The existing pavement through the project sections is 230-mm jointed reinforced concrete pavement (JRCP) with 12.2-m joint spacing. The ADT taken in 1990 was 14,400 with 22 percent trucks. The average truck factor during the time of field testing was 1.94.
Eight different materials were evaluated at this site:
• HES—a Type III PCC mix containing nonchloride accelerator (calcium nitrite) developed under SHRP C-205 to provide a 12- to 24-h opening time.
• FT I—a Type III PCC mix developed by Iowa DOT for 12- to 24-h opening.
• Pyrament (PC 1 and PC 2)—mixes made with proprietary blended cement (alkali-activated alumino-silicates). Two different mixes were tested: PC 1 for 2- to 4-h opening and PC 2 for 4- to 6-h opening.
• Rapid set (RSC 1 and RSC 2)—mixes made with another proprietary blended cement (sulfo-aluminate). Two different mixes were tested: RSC 1 for 2- to 4-h opening and RSC 2 for 4- to 6-h opening.
• VES—a Type III PCC mix containing nonchloride accelerator (calcium nitrite) developed under SHRP C-205 to provide a 2- to 4-h opening time.
• ODOT FS (FS)—a Type III PCC mix containing calcium chloride developed by ODOT to provide a 4- to 6-h opening time.
The mix designs for the materials tested at the Ohio site are given in table 4. All repairs placed at this site are 1.8 m long.
All work at the Ohio site was carried out during daytime hours. Work started about 7 a.m. each day with the closing of the work area to traffic and concrete removal operation. Concrete placement typically started about 10 a.m., and the sections were opened to traffic generally by 5:30 p.m. One material (section) was placed per day.
Table 5 provides a summary of Ohio sections. As for the Georgia sections, fatigue damage due to early opening was defined as the damage incurred during the first 14 days of service. The same procedure was used to calculate the damage.
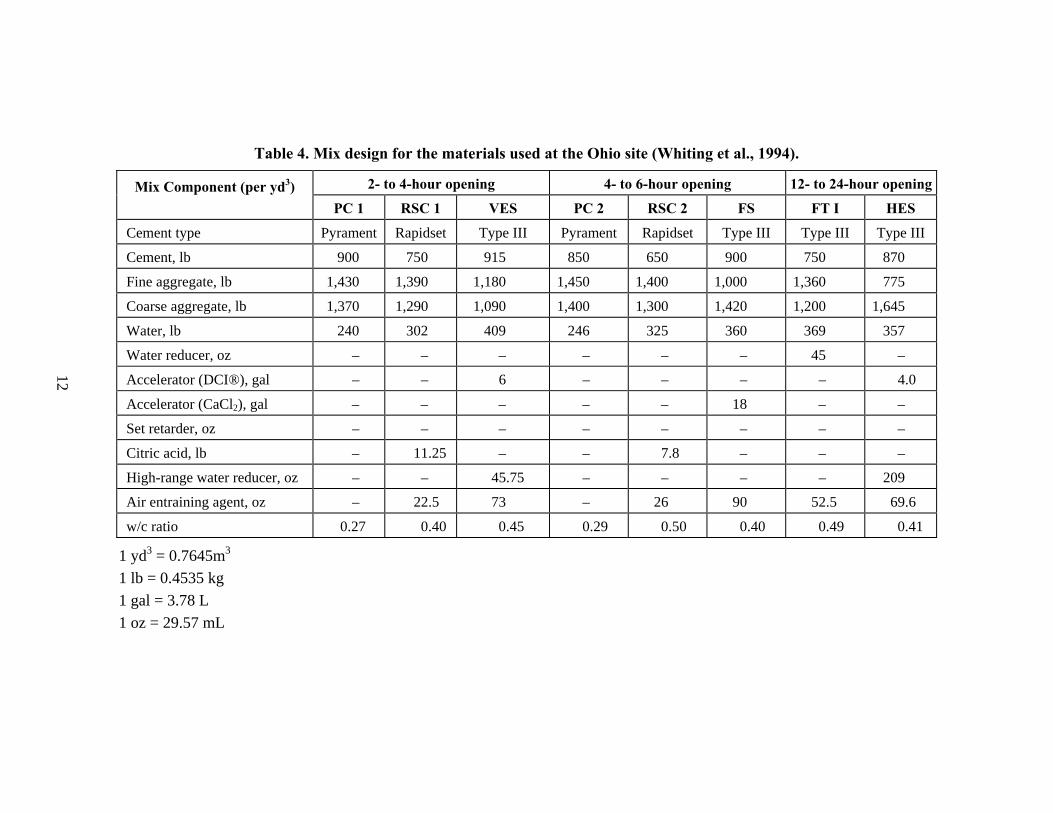
Table 4. Mix design for the materials used at the Ohio site (Whiting et al., 1994).
2- to 4-hour opening 4- to 6-hour opening 12- to 24-hour openingMix Component (per yd3) PC 1 RSC 1 VES PC 2 RSC 2 FS FT I HES
Cement type Pyrament Rapidset Type III Pyrament Rapidset Type III Type III Type III
Cement, lb 900 750 915 850 650 900 750 870
Fine aggregate, lb 1,430 1,390 1,180 1,450 1,400 1,000 1,360 775
Coarse aggregate, lb 1,370 1,290 1,090 1,400 1,300 1,420 1,200 1,645
Water, lb 240 302 409 246 325 360 369 357
Water reducer, oz – – – – – – 45 –
Accelerator (DCI®), gal – – 6 – – – – 4.0
Accelerator (CaCl2), gal – – – – – 18 – –
Set retarder, oz – – – – – – – –
Citric acid, lb – 11.25 – – 7.8 – – –
High-range water reducer, oz – – 45.75 – – – – 209
Air entraining agent, oz – 22.5 73 – 26 90 52.5 69.6
w/c ratio 0.27 0.40 0.45 0.29 0.50 0.40 0.49 0.41
1 yd3 = 0.7645m3
1 lb = 0.4535 kg 1 gal = 3.78 L 1 oz = 29.57 mL
12
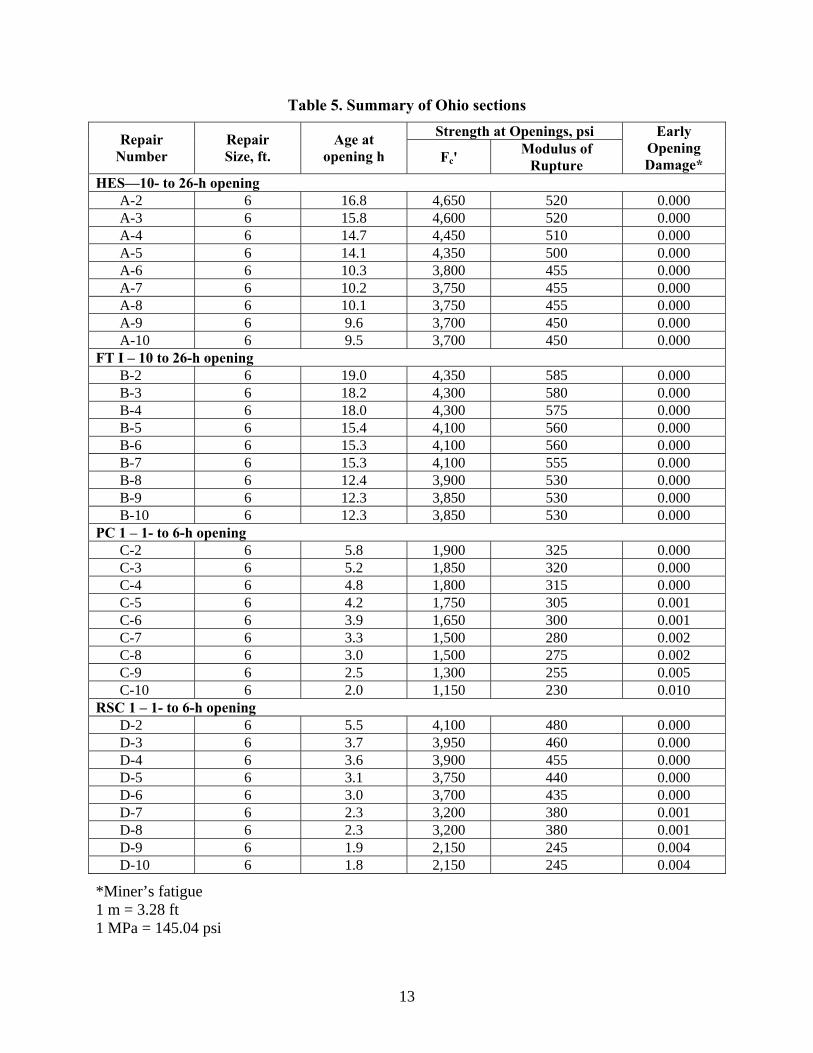
Table 5. Summary of Ohio sections Strength at Openings, psi Repair
Number Repair Size, ft.
Age at opening h Fc'
Modulus of Rupture
Early Opening Damage*
HES—10- to 26-h opening A-2 6 16.8 4,650 520 0.000 A-3 6 15.8 4,600 520 0.000 A-4 6 14.7 4,450 510 0.000 A-5 6 14.1 4,350 500 0.000 A-6 6 10.3 3,800 455 0.000 A-7 6 10.2 3,750 455 0.000 A-8 6 10.1 3,750 455 0.000 A-9 6 9.6 3,700 450 0.000 A-10 6 9.5 3,700 450 0.000
FT I – 10 to 26-h opening B-2 6 19.0 4,350 585 0.000 B-3 6 18.2 4,300 580 0.000 B-4 6 18.0 4,300 575 0.000 B-5 6 15.4 4,100 560 0.000 B-6 6 15.3 4,100 560 0.000 B-7 6 15.3 4,100 555 0.000 B-8 6 12.4 3,900 530 0.000 B-9 6 12.3 3,850 530 0.000 B-10 6 12.3 3,850 530 0.000
PC 1 – 1- to 6-h opening C-2 6 5.8 1,900 325 0.000 C-3 6 5.2 1,850 320 0.000 C-4 6 4.8 1,800 315 0.000 C-5 6 4.2 1,750 305 0.001 C-6 6 3.9 1,650 300 0.001 C-7 6 3.3 1,500 280 0.002 C-8 6 3.0 1,500 275 0.002 C-9 6 2.5 1,300 255 0.005 C-10 6 2.0 1,150 230 0.010
RSC 1 – 1- to 6-h opening D-2 6 5.5 4,100 480 0.000 D-3 6 3.7 3,950 460 0.000 D-4 6 3.6 3,900 455 0.000 D-5 6 3.1 3,750 440 0.000 D-6 6 3.0 3,700 435 0.000 D-7 6 2.3 3,200 380 0.001 D-8 6 2.3 3,200 380 0.001 D-9 6 1.9 2,150 245 0.004 D-10 6 1.8 2,150 245 0.004
*Miner’s fatigue 1 m = 3.28 ft 1 MPa = 145.04 psi
13
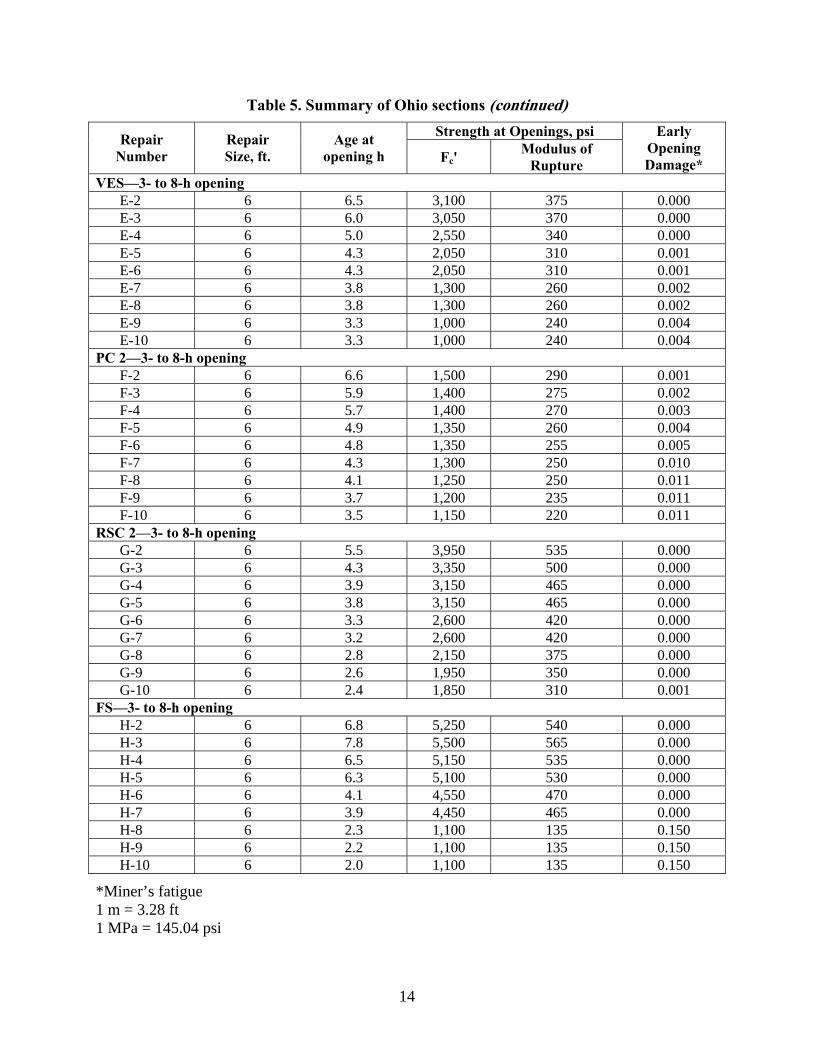
Table 5. Summary of Ohio sections (continued) Strength at Openings, psi Repair
Number Repair Size, ft.
Age at opening h Fc'
Modulus of Rupture
Early Opening Damage*
VES—3- to 8-h opening E-2 6 6.5 3,100 375 0.000 E-3 6 6.0 3,050 370 0.000 E-4 6 5.0 2,550 340 0.000 E-5 6 4.3 2,050 310 0.001 E-6 6 4.3 2,050 310 0.001 E-7 6 3.8 1,300 260 0.002 E-8 6 3.8 1,300 260 0.002 E-9 6 3.3 1,000 240 0.004 E-10 6 3.3 1,000 240 0.004
PC 2—3- to 8-h opening F-2 6 6.6 1,500 290 0.001 F-3 6 5.9 1,400 275 0.002 F-4 6 5.7 1,400 270 0.003 F-5 6 4.9 1,350 260 0.004 F-6 6 4.8 1,350 255 0.005 F-7 6 4.3 1,300 250 0.010 F-8 6 4.1 1,250 250 0.011 F-9 6 3.7 1,200 235 0.011 F-10 6 3.5 1,150 220 0.011
RSC 2—3- to 8-h opening G-2 6 5.5 3,950 535 0.000 G-3 6 4.3 3,350 500 0.000 G-4 6 3.9 3,150 465 0.000 G-5 6 3.8 3,150 465 0.000 G-6 6 3.3 2,600 420 0.000 G-7 6 3.2 2,600 420 0.000 G-8 6 2.8 2,150 375 0.000 G-9 6 2.6 1,950 350 0.000 G-10 6 2.4 1,850 310 0.001
FS—3- to 8-h opening H-2 6 6.8 5,250 540 0.000 H-3 6 7.8 5,500 565 0.000 H-4 6 6.5 5,150 535 0.000 H-5 6 6.3 5,100 530 0.000 H-6 6 4.1 4,550 470 0.000 H-7 6 3.9 4,450 465 0.000 H-8 6 2.3 1,100 135 0.150 H-9 6 2.2 1,100 135 0.150 H-10 6 2.0 1,100 135 0.150
*Miner’s fatigue 1 m = 3.28 ft 1 MPa = 145.04 psi
14
PERFORMANCE OF OHIO SECTIONS
The performance of Ohio sections was plagued by the longitudinal cracking that developed in the majority of repairs shortly after construction. The cracks appeared within weeks of construction. Three sections also developed transverse cracks and corner breaks, but those distresses are secondary cracking that is unlikely to have occurred had the longitudinal cracking not occurred. Transverse fatigue cracking is not an issue for short (1.8-m) repairs.
The distress data for Ohio sections are summarized in table B2 (appendix B). Faulting performance of Ohio sections is summarized in table 6; the detailed joint performance data are given in table B3. As with the Georgia sections, all Ohio sections gave excellent joint performance except for RSC 1, which developed excessive faulting.
Table 6. Summary of joint performance of Ohio sections.
Faulting, in1 Section 1994 1995 1996 1997 1998 Average LTE
HES 0.03 0.02 0.02 0.02 0.02 74% FT I 0.04 0.02 0.03 0.03 0.05 64% PC 1 0.01 0.01 0.01 0.01 0.01 74% RSC 1 0.14 0.18 0.17 n/a2 n/a2 77% VES 0.02 0.01 0.01 0.01 0.02 79% PC 2 0.02 0.03 0.02 0.02 0.01 82% RSC 2 0.02 0.02 0.02 0.02 0.02 80% FS 0.04 0.02 0.02 0.02 0.03 75% 1Absolute average. 1 in = 25.4 mm 2Overlaid after 1996 survey.
The unusually poor joint performance RSC 1 section is inexplicable. The possible causes of excessive faulting in doweled full-depth repairs include the following:
• Excessive curling due to high temperature gradient at the time of concrete hardening.
• Excessive dowel bearing stress due to low compressive strength at the time of opening.
• Improper installation—inadequate coverage of grouting material around the dowels or poor consolidation of concrete around the dowels.
This section did not have an unusually high temperature gradient at the time of concrete hardening, and the compressive strength at opening was relatively high. Improper installation is a possibility, but not likely because this is the only section with this problem. The RSC 1 section was overlaid after the 1996 survey.
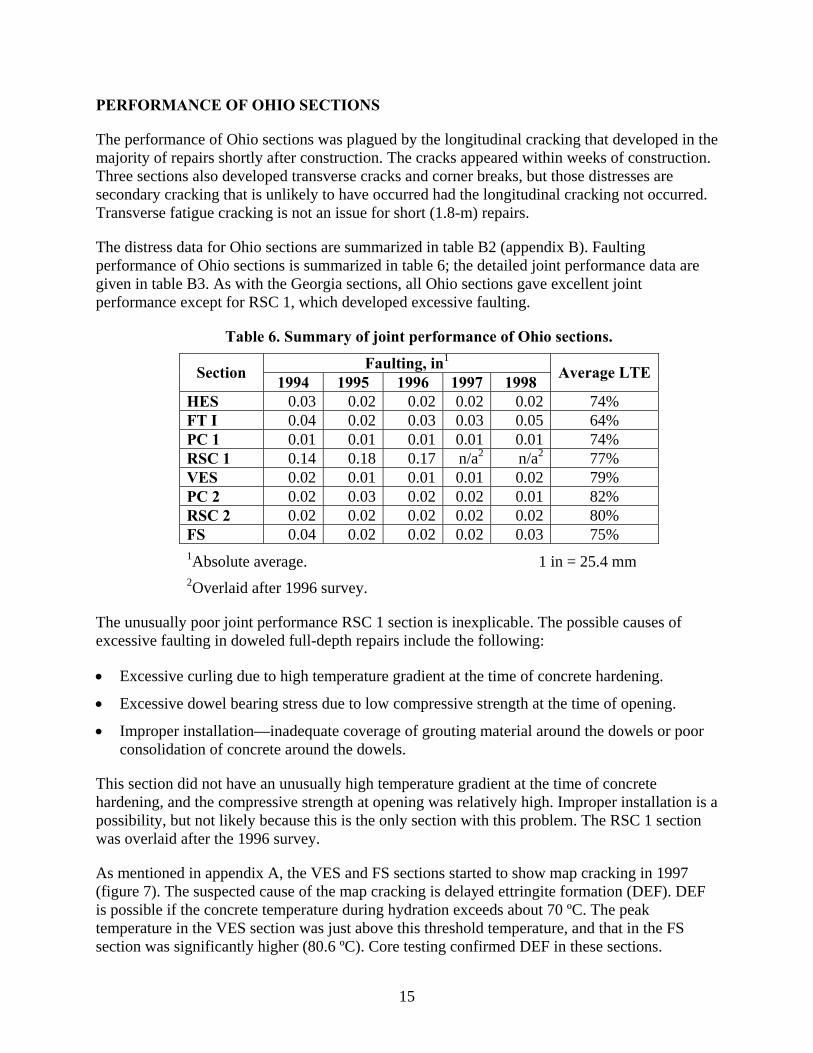
As mentioned in appendix A, the VES and FS sections started to show map cracking in 1997 (figure 7). The suspected cause of the map cracking is delayed ettringite formation (DEF). DEF is possible if the concrete temperature during hydration exceeds about 70 ºC. The peak temperature in the VES section was just above this threshold temperature, and that in the FS section was significantly higher (80.6 ºC). Core testing confirmed DEF in these sections.
15
Continued development of D-cracking in the surrounding concrete was also a problem at this site. As a part the pavement rehabilitation program, edgedrains were installed after the completion of all repair work in 1992. However, the edgedrains were not effective in mitigating D-cracking in the original pavement at this site, although the RPPR study showed a significant benefit of edgedrains provided at the time of initial construction (Smith et al., 1995). As mentioned earlier, the project site in Ohio contains 104 test sections, many of which were evaluated in the RPPR study. The result of a field survey conducted under the RPPR study showed that the sections originally provided with edgedrains exhibited significantly less spalling due to D-cracking at this site. However, the retrofitted edgedrains installed in 1992 did not appear effective in mitigating D-cracking. By 1998, some repairs started showing signs of D-cracking on the original pavement side of the repair joints. This may be an indication that accumulated internal damage over the years does play a significant role in the development of D-cracking, as commonly believed.
Figure 7. Map cracking observed in FS section in 1997.
ANALYSIS OF THE CRACKING PROBLEM
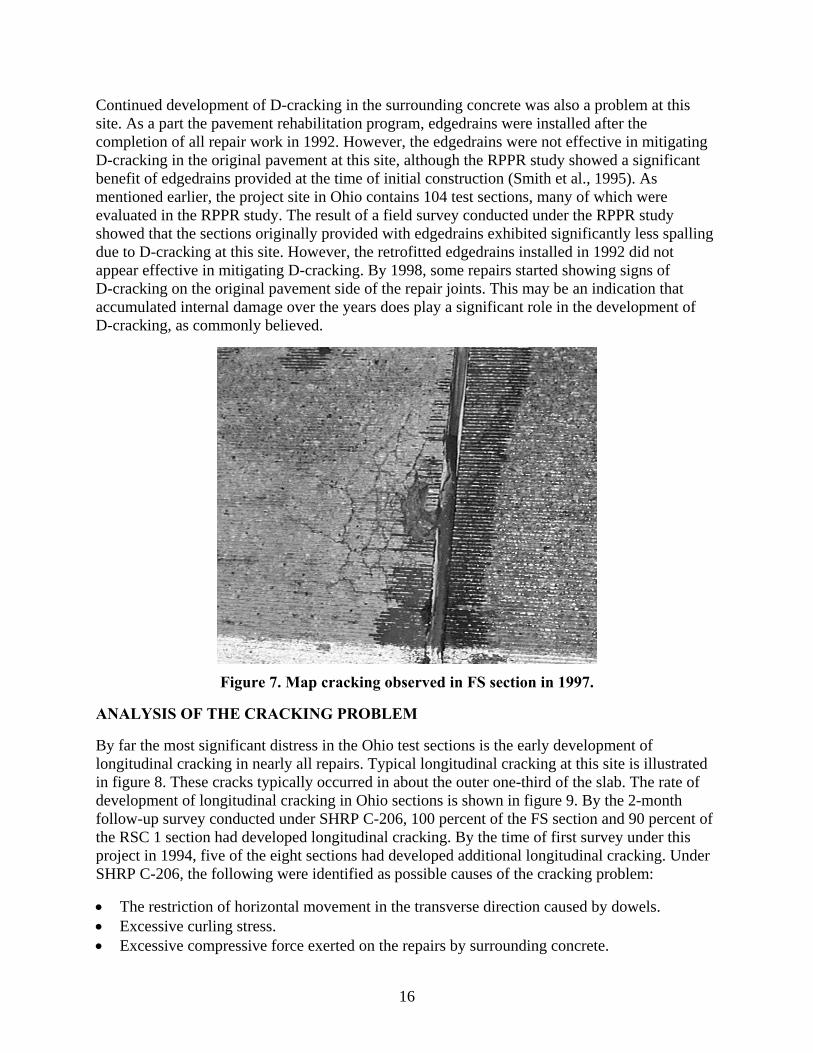
By far the most significant distress in the Ohio test sections is the early development of longitudinal cracking in nearly all repairs. Typical longitudinal cracking at this site is illustrated in figure 8. These cracks typically occurred in about the outer one-third of the slab. The rate of development of longitudinal cracking in Ohio sections is shown in figure 9. By the 2-month follow-up survey conducted under SHRP C-206, 100 percent of the FS section and 90 percent of the RSC 1 section had developed longitudinal cracking. By the time of first survey under this project in 1994, five of the eight sections had developed additional longitudinal cracking. Under SHRP C-206, the following were identified as possible causes of the cracking problem:
• The restriction of horizontal movement in the transverse direction caused by dowels. • Excessive curling stress. • Excessive compressive force exerted on the repairs by surrounding concrete.
16
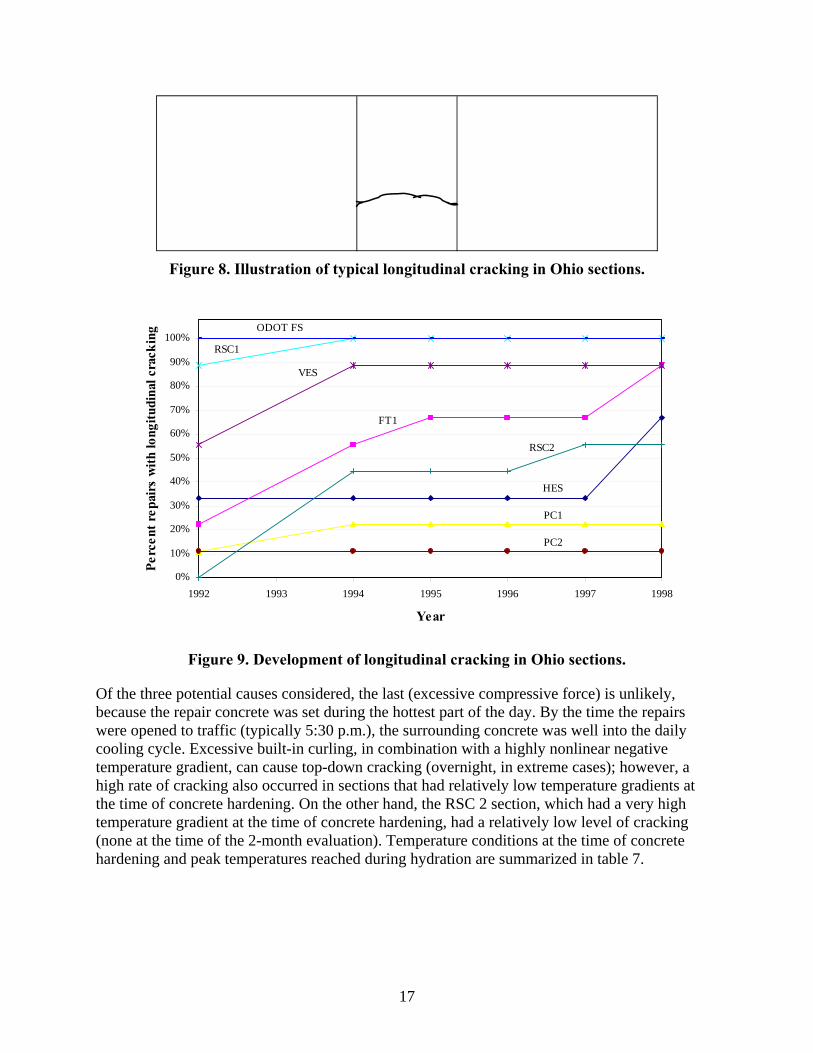
Figure 8. Illustration of typical longitudinal cracking in Ohio sections.
0%
10%
20%
30%
40%
50%
60%
70%
80%
90%
100%
1992 1993 1994 1995 1996 1997 1998
Year
Perc
ent r
epai
rs w
ith lo
ngitu
dina
l cra
ckin
g ODOT FS
RSC1
VES
HES
RSC2
FT1
PC2
PC1
Figure 9. Development of longitudinal cracking in Ohio sections.
Of the three potential causes considered, the last (excessive compressive force) is unlikely, because the repair concrete was set during the hottest part of the day. By the time the repairs were opened to traffic (typically 5:30 p.m.), the surrounding concrete was well into the daily cooling cycle. Excessive built-in curling, in combination with a highly nonlinear negative temperature gradient, can cause top-down cracking (overnight, in extreme cases); however, a high rate of cracking also occurred in sections that had relatively low temperature gradients at the time of concrete hardening. On the other hand, the RSC 2 section, which had a very high temperature gradient at the time of concrete hardening, had a relatively low level of cracking (none at the time of the 2-month evaluation). Temperature conditions at the time of concrete hardening and peak temperatures reached during hydration are summarized in table 7.
17
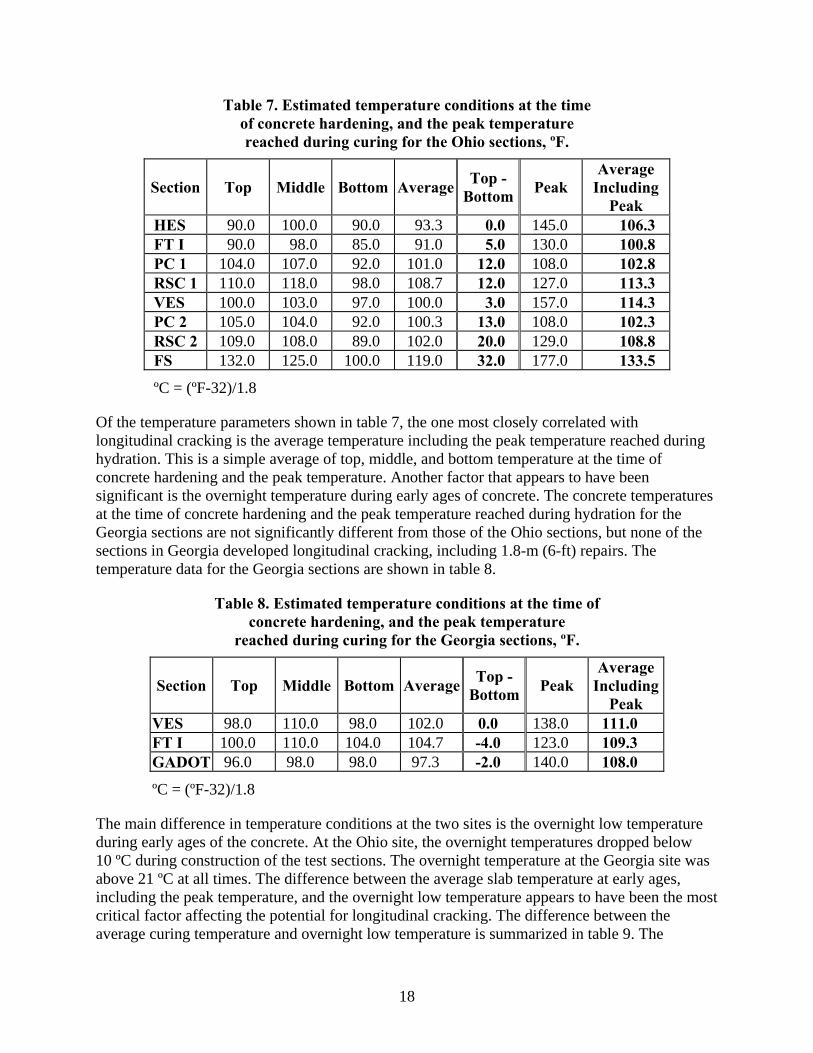
Table 7. Estimated temperature conditions at the time of concrete hardening, and the peak temperature reached during curing for the Ohio sections, ºF.
Section Top Middle Bottom Average Top - Bottom Peak
Average Including
Peak HES 90.0 100.0 90.0 93.3 0.0 145.0 106.3 FT I 90.0 98.0 85.0 91.0 5.0 130.0 100.8 PC 1 104.0 107.0 92.0 101.0 12.0 108.0 102.8 RSC 1 110.0 118.0 98.0 108.7 12.0 127.0 113.3 VES 100.0 103.0 97.0 100.0 3.0 157.0 114.3 PC 2 105.0 104.0 92.0 100.3 13.0 108.0 102.3 RSC 2 109.0 108.0 89.0 102.0 20.0 129.0 108.8 FS 132.0 125.0 100.0 119.0 32.0 133.5 177.0
ºC = (ºF-32)/1.8
Of the temperature parameters shown in table 7, the one most closely correlated with longitudinal cracking is the average temperature including the peak temperature reached during hydration. This is a simple average of top, middle, and bottom temperature at the time of concrete hardening and the peak temperature. Another factor that appears to have been significant is the overnight temperature during early ages of concrete. The concrete temperatures at the time of concrete hardening and the peak temperature reached during hydration for the Georgia sections are not significantly different from those of the Ohio sections, but none of the sections in Georgia developed longitudinal cracking, including 1.8-m (6-ft) repairs. The temperature data for the Georgia sections are shown in table 8.
Table 8. Estimated temperature conditions at the time of concrete hardening, and the peak temperature
reached during curing for the Georgia sections, ºF.
Section Top Middle Bottom Average Top - Bottom Peak
Average Including
Peak VES 98.0 110.0 98.0 102.0 0.0 138.0 111.0 FT I 100.0 110.0 104.0 104.7 -4.0 123.0 109.3 GADOT 96.0 98.0 98.0 97.3 -2.0 108.0 140.0
ºC = (ºF-32)/1.8
The main difference in temperature conditions at the two sites is the overnight low temperature during early ages of the concrete. At the Ohio site, the overnight temperatures dropped below 10 ºC during construction of the test sections. The overnight temperature at the Georgia site was above 21 ºC at all times. The difference between the average slab temperature at early ages, including the peak temperature, and the overnight low temperature appears to have been the most critical factor affecting the potential for longitudinal cracking. The difference between the average curing temperature and overnight low temperature is summarized in table 9. The
18
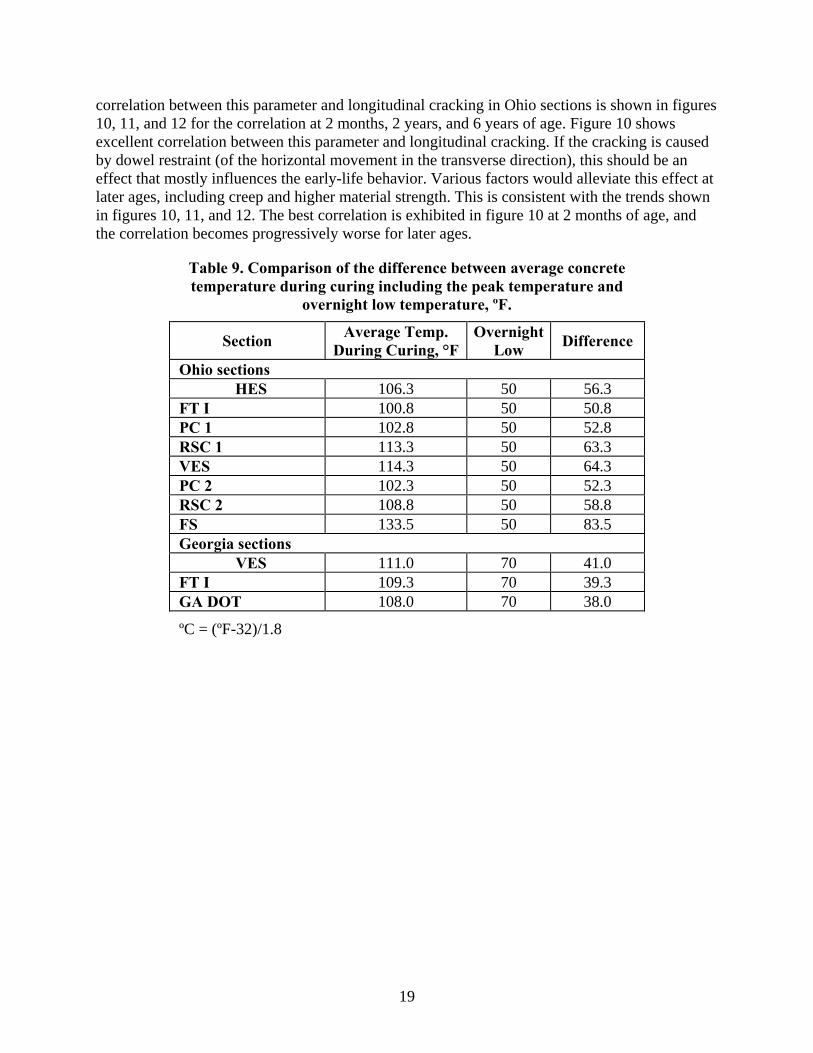
correlation between this parameter and longitudinal cracking in Ohio sections is shown in figures 10, 11, and 12 for the correlation at 2 months, 2 years, and 6 years of age. Figure 10 shows excellent correlation between this parameter and longitudinal cracking. If the cracking is caused by dowel restraint (of the horizontal movement in the transverse direction), this should be an effect that mostly influences the early-life behavior. Various factors would alleviate this effect at later ages, including creep and higher material strength. This is consistent with the trends shown in figures 10, 11, and 12. The best correlation is exhibited in figure 10 at 2 months of age, and the correlation becomes progressively worse for later ages.
Table 9. Comparison of the difference between average concrete temperature during curing including the peak temperature and
overnight low temperature, ºF.
Section Average Temp. Overnight Low Difference During Curing, °F
Ohio sections HES 106.3 50 56.3
FT I 100.8 50 50.8 PC 1 102.8 50 52.8 RSC 1 113.3 50 63.3 VES 114.3 50 64.3 PC 2 102.3 50 52.3 RSC 2 108.8 50 58.8 FS 133.5 50 83.5 Georgia sections
VES 111.0 70 41.0 FT I 109.3 70 39.3 GA DOT 108.0 70 38.0
ºC = (ºF-32)/1.8
19
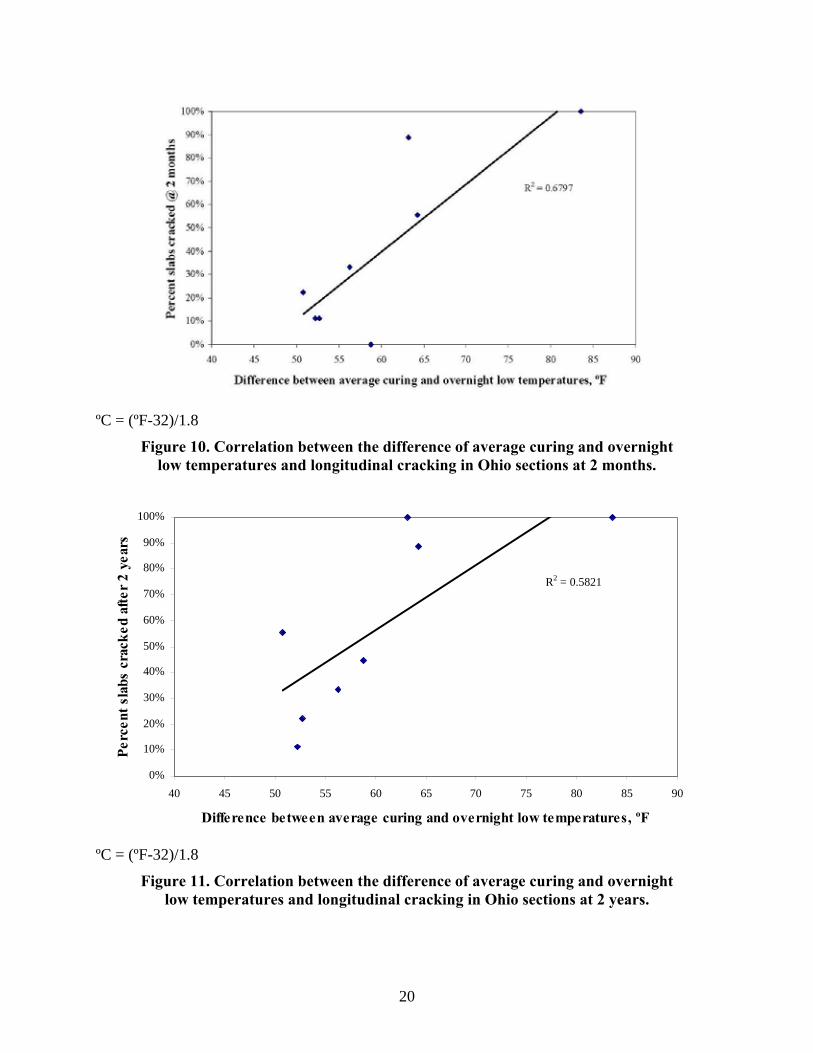
ºC = (ºF-32)/1.8
Figure 10. Correlation between the difference of average curing and overnight low temperatures and longitudinal cracking in Ohio sections at 2 months.
R2 = 0.5821
0%
10%
20%
30%
40%
50%
60%
70%
80%
90%
100%
40 45 50 55 60 65 70 75 80 85 90
Difference between average curing and overnight low temperatures, ºF
Perc
ent s
labs
cra
cked
afte
r 2
year
s
ºC = (ºF-32)/1.8
Figure 11. Correlation between the difference of average curing and overnight low temperatures and longitudinal cracking in Ohio sections at 2 years.
20
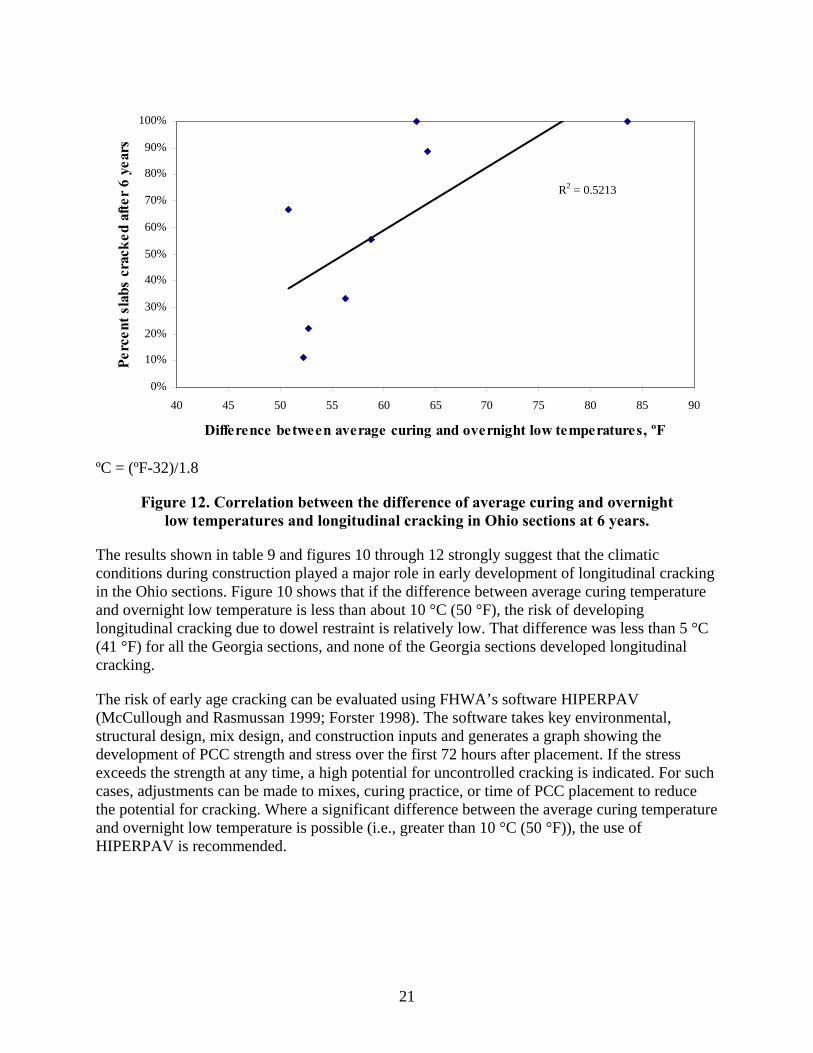
R2 = 0.5213
0%
10%
20%
30%
40%
50%
60%
70%
80%
90%
100%
40 45 50 55 60 65 70 75 80 85 90
Difference between average curing and overnight low temperatures, ºF
Perc
ent s
labs
cra
cked
afte
r 6
year
s
ºC = (ºF-32)/1.8
Figure 12. Correlation between the difference of average curing and overnight low temperatures and longitudinal cracking in Ohio sections at 6 years.
The results shown in table 9 and figures 10 through 12 strongly suggest that the climatic conditions during construction played a major role in early development of longitudinal cracking in the Ohio sections. Figure 10 shows that if the difference between average curing temperature and overnight low temperature is less than about 10 °C (50 °F), the risk of developing longitudinal cracking due to dowel restraint is relatively low. That difference was less than 5 °C (41 °F) for all the Georgia sections, and none of the Georgia sections developed longitudinal cracking.
The risk of early age cracking can be evaluated using FHWA’s software HIPERPAV (McCullough and Rasmussan 1999; Forster 1998). The software takes key environmental, structural design, mix design, and construction inputs and generates a graph showing the development of PCC strength and stress over the first 72 hours after placement. If the stress exceeds the strength at any time, a high potential for uncontrolled cracking is indicated. For such cases, adjustments can be made to mixes, curing practice, or time of PCC placement to reduce the potential for cracking. Where a significant difference between the average curing temperature and overnight low temperature is possible (i.e., greater than 10 °C (50 °F)), the use of HIPERPAV is recommended.
21

C HAPTER 4. CONCLUSIONS AND RECOMMENDATIONS
The full-depth repairs made with HES materials placed under SHRP C-206 gave variable long-term performance. All sections in Georgia provided excellent performance; however, the performance of the Ohio sections was plagued by the longitudinal cracking that developed in a majority of the repairs within few weeks after the repairs were opened to traffic. An analysis conducted under this study showed that the most likely cause of the longitudinal cracking in the Ohio sections is the excessive difference between the PCC temperature during curing and the nighttime low temperatures. Two of the Ohio sections (VES and FS) also started to develop map cracking by 1997. These two sections developed extremely high temperatures during curing (excess of 70 ºC); DEF is the suspect cause of the map cracking.
The following conclusions can be made based on the performance of the full-depth repairs at the two SHRP C-206 test sites:
• Full-depth repairs made with HES PCC can provide good long-term performance; however, adverse temperature conditions during installation can cause premature failures.
• A large difference in the average PCC temperature during curing and overnight low temperatures should be avoided. If this difference in temperature is large, longitudinal cracking is possible, because the thermal contraction in the transverse direction is restrained by dowels.
• The temperature data from the Ohio site suggest that the risk of longitudinal cracking is high if the difference in average curing temperature and nighttime low temperatures exceeds about 10 °C (50 °F). The use of HIPERPAV is recommended in adverse conditions to avoid premature failures.
• Extremely high PCC temperatures during curing should be avoided. If the PCC temperature during curing exceed 70 ºC, DEF is possible. Two of the Ohio sections (VES and FS) showed map cracking characteristic of DEF, and core testing confirmed DEF in those sections.
• All sections except the RSC 1 section in Ohio showed excellent faulting performance. Average faulting was less than 1 mm and remained unchanged throughout the monitoring period.
• The fatigue damage due to early opening is negligible, especially for repairs 3.7 m (12 ft) or shorter. The repairs in each experimental section had a range of strength at the time of opening to traffic; however, within the range of strength evaluated, the strength at opening could not be correlated to performance. The minimum compressive strength at opening was 6.9 megapascals (MPa) for all sections.
The results of this evaluation showed that in terms of fatigue damage or faulting performance, the repairs could be opened to traffic at much lower strengths than those typically recommended. However, opening at strengths much less than those recommended in various manuals of practice (ACPA 1995; Yu et al., 1994; Snyder et al., 1989) is not advisable because of the risk of random failures caused by a single heavy load at an early age. Therefore, the following opening criteria suggested in the SHRP C-206 manual of practice are still recommended:
23
• PCC modulus of rupture of 2.0 MPa by third-point testing.
• Compressive strength of 13.8 MPa.
No change is recommended to the minimum repair size, but further research is recommended into the effects of repair size on potential for longitudinal cracking. The Ohio site where the longitudinal cracking was a problem only had 1.8-m repairs. Therefore, the effects of repair size could not be determined. Although the temperature conditions during construction appear to be the dominant factor affecting the risk of longitudinal cracking, it is possible for repair dimension to be a factor.
24
APPENDIX A
SUMMARY OF ANNUAL SURVEY RESULTS
1994 Survey
At both sites, the full-depth PCC repairs are performing very well. None of the repairs exhibited any material problems at either site.
Georgia Site
At the Georgia site, only two of the long (4.6-m or longer) repairs developed cracks. No other repair distresses were observed. The surrounding pavement at the Georgia site did not show any significant further deterioration, but it exhibited very high deflection under load. The deflection of the pavement under truck wheel loads was readily visible.
Ohio Site
The observed changes in the Ohio sections (since the follow-up survey conducted during SHRP C-206) consist of:
• Further progression of longitudinal cracking that developed shortly after opening of the test sections to traffic.
• Development of transverse cracking in one slab.
• Development of corner breaks in two slabs (both VES).
Two of the repairs in the Pyrament 1 section (PC 1) had been removed and replaced. The most likely reason for this replacement is the deterioration of the surrounding pavement and not the repairs themselves. Many of the C-206 repairs are surrounded by very short slabs (1.8 to 2.4 m), resulting from the placement of the repairs. If the deterioration of the original joint in the surrounding slabs is excessive (due to D-cracking, which is a widespread problem at this site), the only way the repairs can be made is by removing all of the short slabs in the immediate area and replacing them with full slabs. The other important noticeable change at the Ohio site was the deterioration of the surrounding pavement. D-cracking in the surrounding pavement had progressed significantly since the placement of the repairs. Virtually all original joints in the surrounding pavement exhibited extensive D-cracking.
1995 Survey
In 1995, the Ohio sections were surveyed on November 15, and the Georgia sections were surveyed on November 30. At both sites, the PCC repairs are performing well. None of the repairs exhibited any material problems at either site.
Georgia Site
Considering the length of some of the Georgia repairs, the Georgia sections are performing very well. The GADOT section contained the longest repairs (repair lengths up to 4.9 m). During the
25
1994 survey, a transverse crack was observed on two of the 4.6-m repairs in this section (one medium- and one high-severity). Both repairs had been partially replaced before the 1995 survey to repair the cracked portion. The remaining portions of these two repairs are now 2.7 m and 3.7 m. Full-depth repairs have also been made adjacent to two of the 1.8-m repairs in the FT 1 section. No other distresses were observed at this site. Faulting in all sections was minimal (less than 1.0 mm (0.04 in)).
The shoulders at the Georgia site were replaced with a new asphalt shoulder in November 1995. The contractor was just finishing the construction of the new shoulder in section 3 when it was surveyed. Because of the construction work in the area, the FWD testing originally planned for this section could not be completed. That testing will be completed next year.
Ohio Site
The observed changes in the Ohio sections consist of:
• One repair in the FT1 section (B5) developed a longitudinal crack. The longitudinal cracking is prevalent in all Ohio sections. The likely cause of these cracks is the excessive temperature gradients that were present in the slabs when the concrete hardened.
• One repair in the VES section (E3) developed a transverse crack. This repair also has a longitudinal crack at about 1.8 m from the lane-shoulder joint.
• With the exception of RSC 1, which has an average faulting of -4.6 mm on the approach side and 4.8 mm on the leave side, faulting in all sections is minimal (less than 1.3 mm).
Another noticeable change at the Ohio site is the general condition of the surrounding pavement. A significant number of transverse joints in the surrounding pavement were badly deteriorated due to D-cracking. All of these joints had been repaired since the last survey, either by full-depth repair, patching, or sealing. Many of the cracks in the surrounding pavement were also repaired by full-depth repair.
1996 Survey
In 1996, the Ohio site was surveyed on September 19, and the Georgia sections were surveyed on November 13.
Georgia Site
This year, FWD testing was conducted in addition to the visual distress survey to detect changes in LTE and PCC modulus (EPCC). The results of the visual distress survey and faulting measurements are shown in table B1. Since last year, only one 4.5-m repair in section 1 (GADOT mix) developed a crack. This amounts to 30 percent of 4.5-m repairs, but this is substantially better than the predicted performance. None of the shorter repairs developed cracks. The level of faulting in all sections remains about the same.
The FWD testing results are summarized in table A1. The backcalculated moduli from this year’s test results show that PCC properties have not changed significantly over the 4 years the repairs have been in place. The backcalculated subgrade k-values from this year’s test results
26
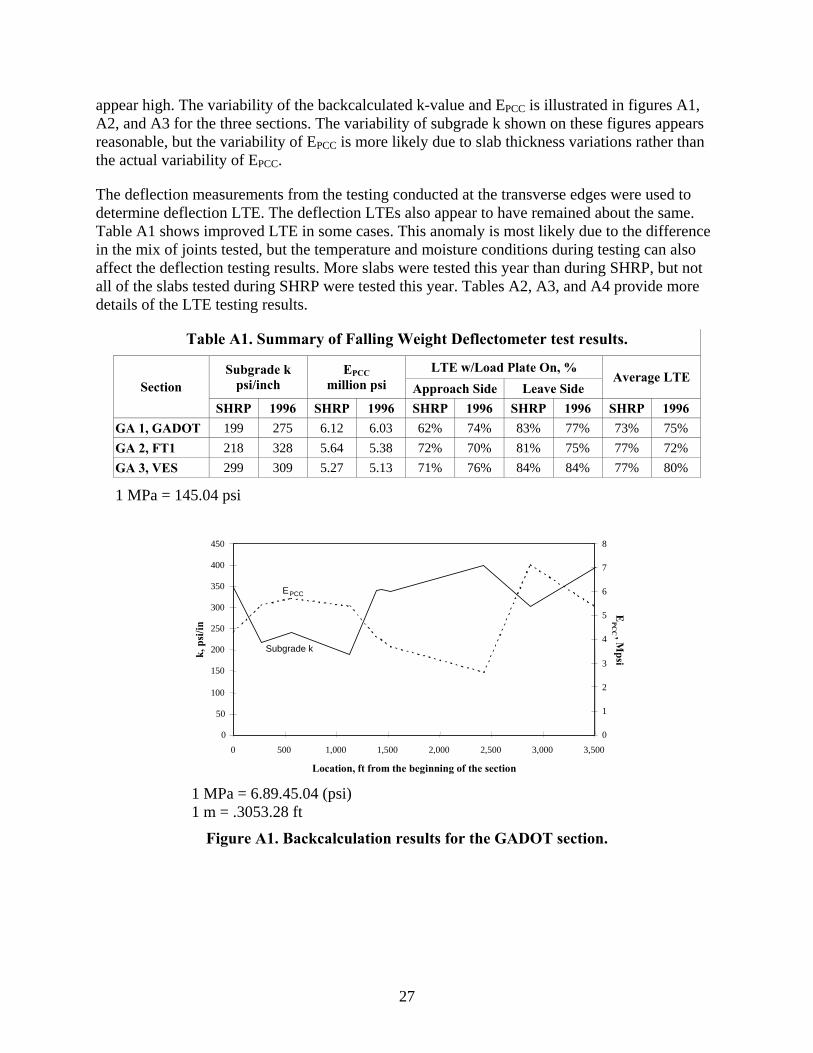
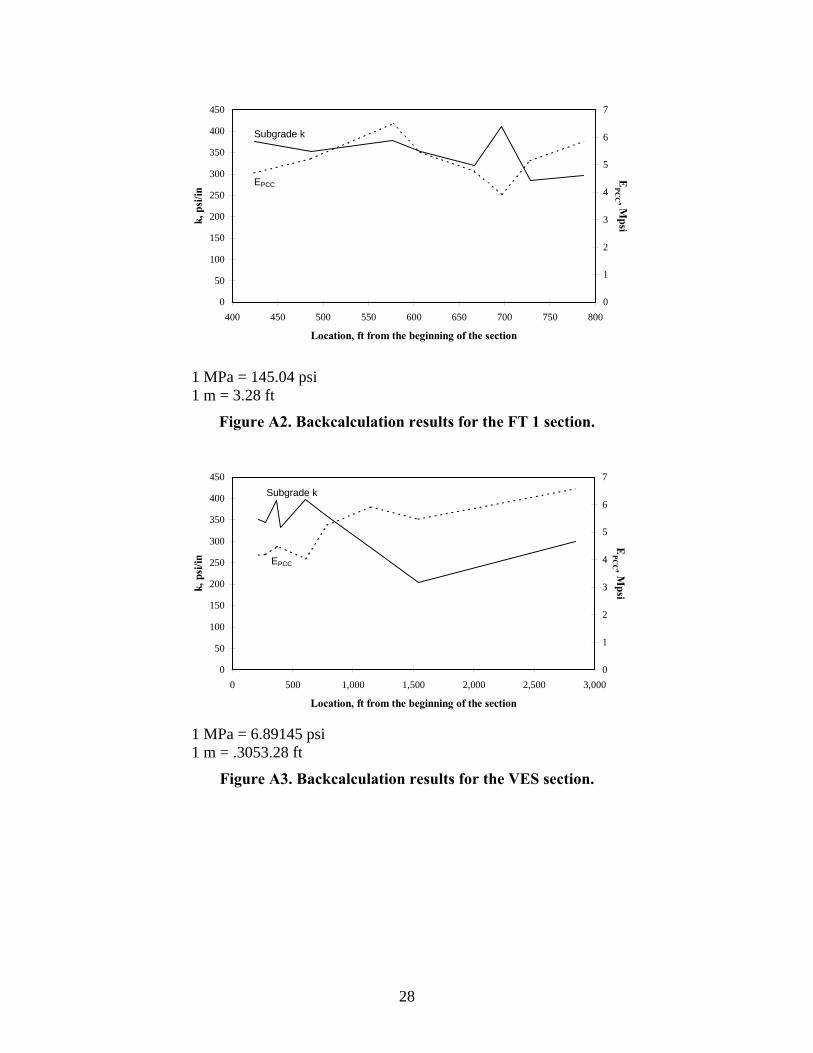
appear high. The variability of the backcalculated k-value and EPCC is illustrated in figures A1, A2, and A3 for the three sections. The variability of subgrade k shown on these figures appears reasonable, but the variability of EPCC is more likely due to slab thickness variations rather than the actual variability of EPCC.
The deflection measurements from the testing conducted at the transverse edges were used to determine deflection LTE. The deflection LTEs also appear to have remained about the same. Table A1 shows improved LTE in some cases. This anomaly is most likely due to the difference in the mix of joints tested, but the temperature and moisture conditions during testing can also affect the deflection testing results. More slabs were tested this year than during SHRP, but not all of the slabs tested during SHRP were tested this year. Tables A2, A3, and A4 provide more details of the LTE testing results.
Table A1. Summary of Falling Weight Deflectometer test results.
LTE w/Load Plate On, % Subgrade k psi/inch
EPCC million psi Approach Side Leave Side
Average LTE Section
SHRP 1996 SHRP 1996 SHRP 1996 SHRP 1996 SHRP 1996 GA 1, GADOT 199 275 6.12 6.03 62% 74% 83% 77% 73% 75% GA 2, FT1 218 328 5.64 5.38 72% 70% 81% 75% 77% 72% GA 3, VES 299 309 5.27 5.13 71% 76% 84% 84% 77% 80%
1 MPa = 145.04 psi
0 50
100 150 200 250 300 350 400 450
0 500 1,000 1,500 2,000 2,500 3,000 3,500 Location, ft from the beginning of the section
k, p
si/in
0 1 2 3 4 5 6 7 8
E PCC , M
psi
E PCC
Subgrade k
1 MPa = 6.89.45.04 (psi) 1 m = .3053.28 ft
Figure A1. Backcalculation results for the GADOT section.
27
0
50
100
150
200
250
300
350
400
450
400 450 500 550 600 650 700 750 800
Location, ft from the beginning of the section
k, p
si/in
0
1
2
3
4
5
6
7
EPC
C , Mpsi
EPCC
Subgrade k
1 MPa = 145.04 psi 1 m = 3.28 ft
Figure A2. Backcalculation results for the FT 1 section.
0
50
100
150
200
250
300
350
400
450
0 500 1,000 1,500 2,000 2,500 3,000
Location, ft from the beginning of the section
k, p
si/in
0
1
2
3
4
5
6
7
EPC
C , Mpsi
EPCC
Subgrade k
1 MPa = 6.89145 psi 1 m = .3053.28 ft
Figure A3. Backcalculation results for the VES section.
28

Table A2. Deflection load transfer test results of section GA 1, GADOT. LTE w/ Load Plate On Section
ID Slab
Size, ft Joint RelativeStation Approach Side Leave Side
Average LTE
1-1 8 Approach 0+00 83% 88% 86% 1-1 8 Leave 0+05 69% 66% 68% 1-2 8 Approach 1+06 34% 61% 48% 1-2 8 Leave 1+22 84% 81% 82% 1-3 8 Approach 2+69 70% 79% 75% 1-3 8 Leave 2+76 85% 85% 85% 1-4 8 Approach 5+57 71% 86% 78% 1-4 8 Leave 5+65 83% 89% 86% 1-5 8 Approach 11+28 78% 72% 75% 1-5 8 Leave 11+39 82% 80% 81% 1-6 8 Approach 11+61 53% 53% 53% 1-6 8 Leave 11+69 86% 83% 85% 1-8 15 Approach 15+22 56% 59% 57% 1-8 15 Leave 15+37 85% 92% 88%
1-16 16 Approach 19+73 54% 60% 57% 1-16 16 Leave 19+89 85% 77% 81% 1-17 15 Approach 20+34 72% 72% 72% 1-17 15 Leave 20+48 89% 90% 90% 1-18 15 Approach 24+24 70% 75% 73% 1-18 15 Leave 24+39 87% 90% 88%
Average LTE 74% 77% 75%
1 m = 3.28 ft
29

Table A3. Deflection load transfer test results of section FT 1. LTE w/ Load Plate On Section
ID Slab
Size, ft Joint RelativeStation Approach Side Leave Side
Average LTE
2-3A 7 Approach 0+00 63% 70% 67% 2-3A 7 Leave 0+08 86% 84% 85%
2-4 10 Approach 4+19 73% 74% 74% 2-4 10 Leave 4+28 88% 89% 89% 2-5 6 Approach 4+57 65% 71% 68% 2-5 6 Leave 4+62 71% 72% 72% 2-7 10 Approach 5+71 60% 61% 61% 2-7 10 Leave 5+82 78% 76% 77% 2-9 10 Approach 6+60 59% 69% 64% 2-9 10 Leave 6+70 88% 89% 88%
2-10 10 Approach 6+91 74% 71% 73% 2-10 10 Leave 7+01 78% 81% 80% 2-11 10 Approach 7+23 69% 85% 77% 2-11 10 Leave 7+33 81% 85% 83% 2-12 6 Approach 7+83 19% 24% 22% 2-12 6 Leave 7+90 86% 93% 89% 2-13 11 Approach 10+50 74% 79% 77% 2-13 11 Leave 10+62 10% 37% 23% 2-15 6 Approach 11+86 79% 86% 83% 2-15 6 Leave 11+91 93% 93% 93%
Average LTE 70% 75% 72%
1 m = 3.28 ft
30
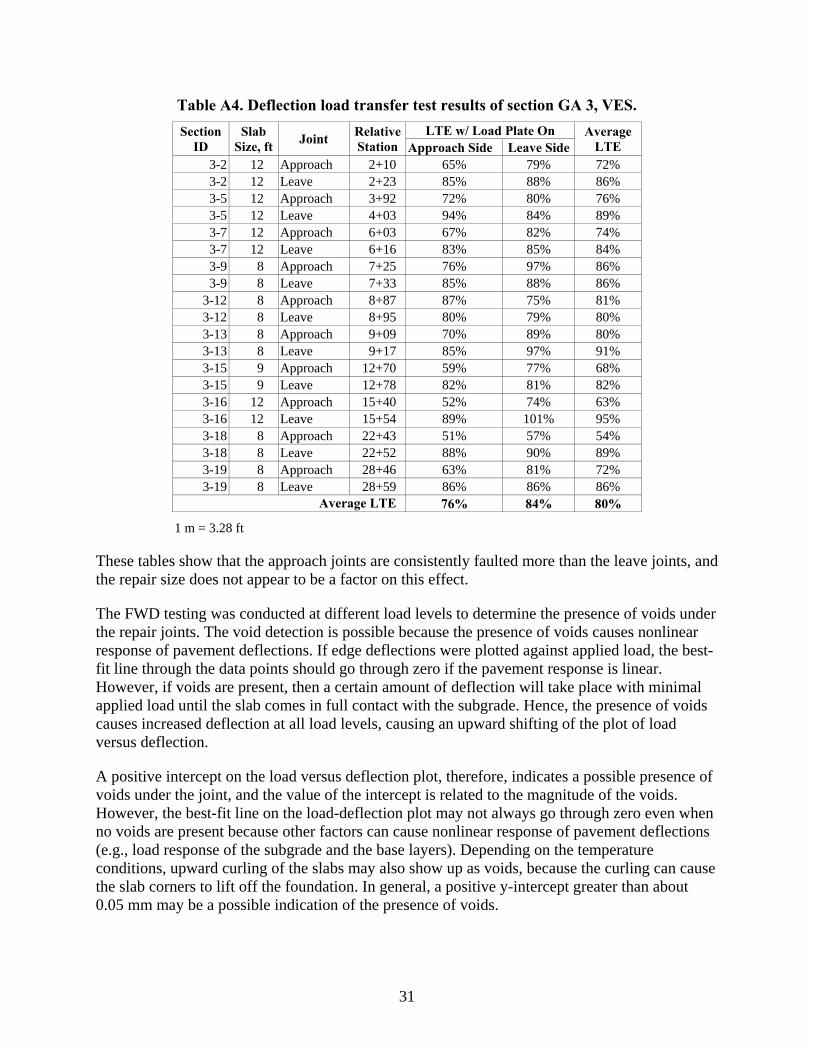
Table A4. Deflection load transfer test results of section GA 3, VES. LTE w/ Load Plate On Section
ID Slab
Size, ft Joint RelativeStation Approach Side Leave Side
Average LTE
3-2 12 Approach 2+10 65% 79% 72% 3-2 12 Leave 2+23 85% 88% 86% 3-5 12 Approach 3+92 72% 80% 76% 3-5 12 Leave 4+03 94% 84% 89% 3-7 12 Approach 6+03 67% 82% 74% 3-7 12 Leave 6+16 83% 85% 84% 3-9 8 Approach 7+25 76% 97% 86% 3-9 8 Leave 7+33 85% 88% 86%
3-12 8 Approach 8+87 87% 75% 81% 3-12 8 Leave 8+95 80% 79% 80% 3-13 8 Approach 9+09 70% 89% 80% 3-13 8 Leave 9+17 85% 97% 91% 3-15 9 Approach 12+70 59% 77% 68% 3-15 9 Leave 12+78 82% 81% 82% 3-16 12 Approach 15+40 52% 74% 63% 3-16 12 Leave 15+54 89% 101% 95% 3-18 8 Approach 22+43 51% 57% 54% 3-18 8 Leave 22+52 88% 90% 89% 3-19 8 Approach 28+46 63% 81% 72% 3-19 8 Leave 28+59 86% 86% 86%
Average LTE 76% 84% 80%
1 m = 3.28 ft
These tables show that the approach joints are consistently faulted more than the leave joints, and the repair size does not appear to be a factor on this effect.
The FWD testing was conducted at different load levels to determine the presence of voids under the repair joints. The void detection is possible because the presence of voids causes nonlinear response of pavement deflections. If edge deflections were plotted against applied load, the best-fit line through the data points should go through zero if the pavement response is linear. However, if voids are present, then a certain amount of deflection will take place with minimal applied load until the slab comes in full contact with the subgrade. Hence, the presence of voids causes increased deflection at all load levels, causing an upward shifting of the plot of load versus deflection.
A positive intercept on the load versus deflection plot, therefore, indicates a possible presence of voids under the joint, and the value of the intercept is related to the magnitude of the voids. However, the best-fit line on the load-deflection plot may not always go through zero even when no voids are present because other factors can cause nonlinear response of pavement deflections (e.g., load response of the subgrade and the base layers). Depending on the temperature conditions, upward curling of the slabs may also show up as voids, because the curling can cause the slab corners to lift off the foundation. In general, a positive y-intercept greater than about 0.05 mm may be a possible indication of the presence of voids.
31
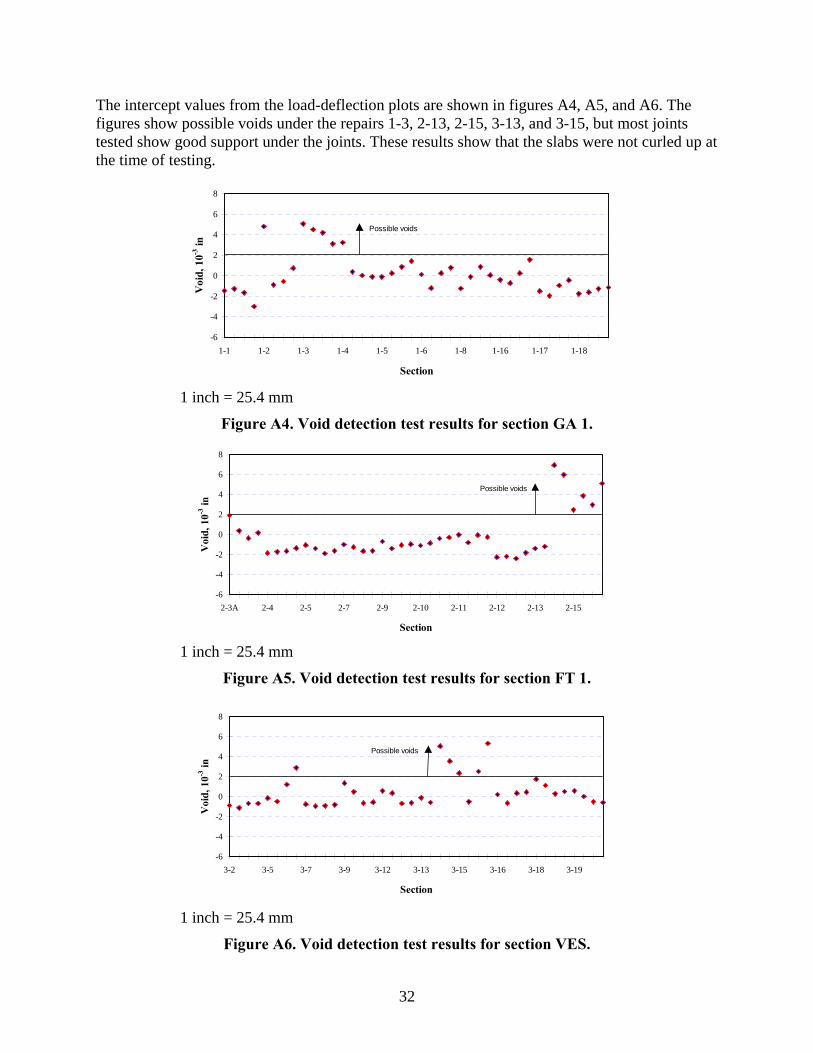
The intercept values from the load-deflection plots are shown in figures A4, A5, and A6. The figures show possible voids under the repairs 1-3, 2-13, 2-15, 3-13, and 3-15, but most joints tested show good support under the joints. These results show that the slabs were not curled up at the time of testing.
-6
-4
-2
0
2
4
6
8
1-1 1-2 1-3 1-4 1-5 1-6 1-8 1-16 1-17 1-18
Section
Voi
d, 1
0-3 in
Possible voids
1 inch = 25.4 mm
Figure A4. Void detection test results for section GA 1.
-6
-4
-2
0
2
4
6
8
2-3A 2-4 2-5 2-7 2-9 2-10 2-11 2-12 2-13 2-15
Section
Voi
d, 1
0-3 in
Possible voids
1 inch = 25.4 mm
Figure A5. Void detection test results for section FT 1.
-6
-4
-2
0
2
4
6
8
3-2 3-5 3-7 3-9 3-12 3-13 3-15 3-16 3-18 3-19
Section
Voi
d, 1
0-3 in
Possible voids
1 inch = 25.4 mm
Figure A6. Void detection test results for section VES.
32
Ohio Site
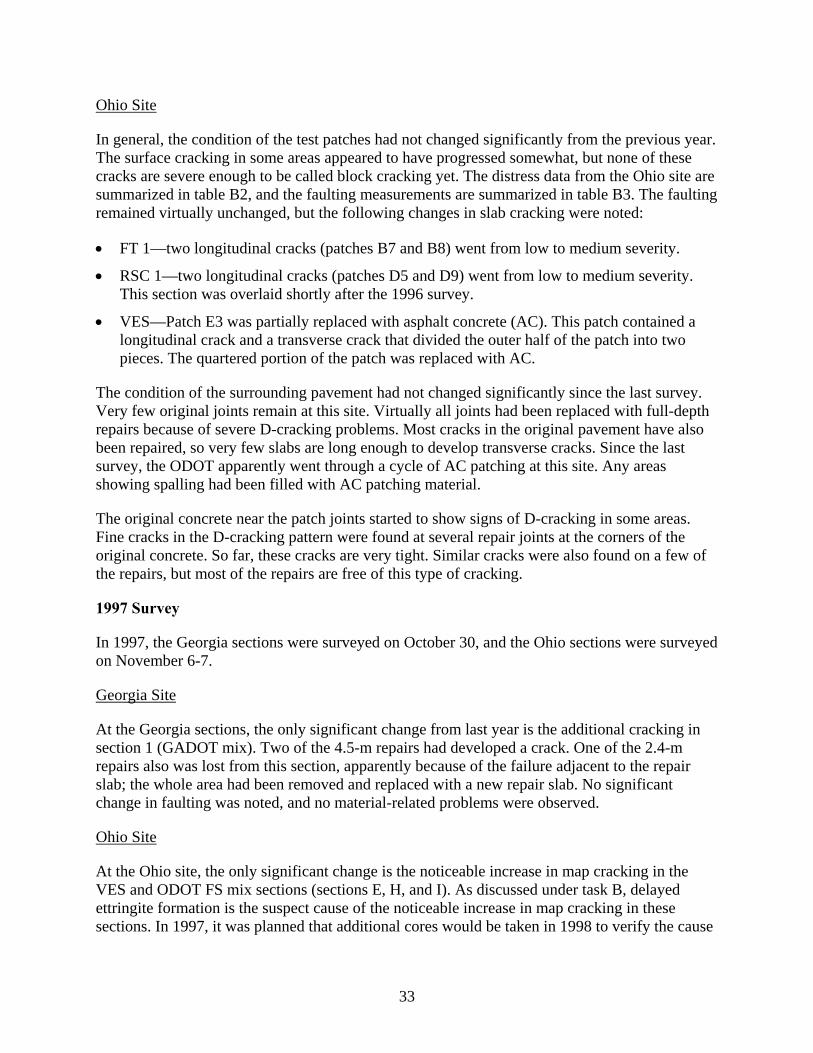
In general, the condition of the test patches had not changed significantly from the previous year. The surface cracking in some areas appeared to have progressed somewhat, but none of these cracks are severe enough to be called block cracking yet. The distress data from the Ohio site are summarized in table B2, and the faulting measurements are summarized in table B3. The faulting remained virtually unchanged, but the following changes in slab cracking were noted:
• FT 1—two longitudinal cracks (patches B7 and B8) went from low to medium severity.
• RSC 1—two longitudinal cracks (patches D5 and D9) went from low to medium severity. This section was overlaid shortly after the 1996 survey.
• VES—Patch E3 was partially replaced with asphalt concrete (AC). This patch contained a longitudinal crack and a transverse crack that divided the outer half of the patch into two pieces. The quartered portion of the patch was replaced with AC.
The condition of the surrounding pavement had not changed significantly since the last survey. Very few original joints remain at this site. Virtually all joints had been replaced with full-depth repairs because of severe D-cracking problems. Most cracks in the original pavement have also been repaired, so very few slabs are long enough to develop transverse cracks. Since the last survey, the ODOT apparently went through a cycle of AC patching at this site. Any areas showing spalling had been filled with AC patching material.
The original concrete near the patch joints started to show signs of D-cracking in some areas. Fine cracks in the D-cracking pattern were found at several repair joints at the corners of the original concrete. So far, these cracks are very tight. Similar cracks were also found on a few of the repairs, but most of the repairs are free of this type of cracking.
1997 Survey
In 1997, the Georgia sections were surveyed on October 30, and the Ohio sections were surveyed on November 6-7.
Georgia Site
At the Georgia sections, the only significant change from last year is the additional cracking in section 1 (GADOT mix). Two of the 4.5-m repairs had developed a crack. One of the 2.4-m repairs also was lost from this section, apparently because of the failure adjacent to the repair slab; the whole area had been removed and replaced with a new repair slab. No significant change in faulting was noted, and no material-related problems were observed.
Ohio Site
At the Ohio site, the only significant change is the noticeable increase in map cracking in the VES and ODOT FS mix sections (sections E, H, and I). As discussed under task B, delayed ettringite formation is the suspect cause of the noticeable increase in map cracking in these sections. In 1997, it was planned that additional cores would be taken in 1998 to verify the cause
33

of the map cracking. As previously reported, the RSC 1 section was overlaid after the 1996 survey.
1998 Survey
In 1998, the Ohio sections were surveyed on October 22-23, and the Georgia sections were surveyed on November 4.
Georgia Site
The Georgia sections did not show any change in either structural or material condition since the last survey. Faulting levels remain very low and virtually unchanged throughout the entire monitoring period.
Ohio Site
The structural condition of the Ohio sections remained largely unchanged since the last survey, but some of the sections showed modest increase in map cracking that first became significantly noticeable in 1997. The only changes in structural condition were in section B (FT I) and section E (VES). Each section developed two additional transverse cracks. Faulting levels were again very low and virtually unchanged throughout the entire monitoring period. Sections E, H, and I (VES and FS mix sections) showed a modest increase in map cracking. Delayed ettringite formation was the suspected cause of the map cracking in these sections. Additional cores were taken from those sections to verify the cause of the map cracking. Both Pyrament sections (sections C and F) also exhibited some map cracking.
34
35
APPENDIX B
SUMMARY TABLES OF ANNUAL SURVEY DATA
Appendix B presents the distress summary tables for the Georgia and Ohio sites. Surveys from 1994 through 1998 are summarized in these tables. The following distress types are covered:
• Faulting.
• Transverse cracking.
• Longitudinal cracking.
• Corner breaks.
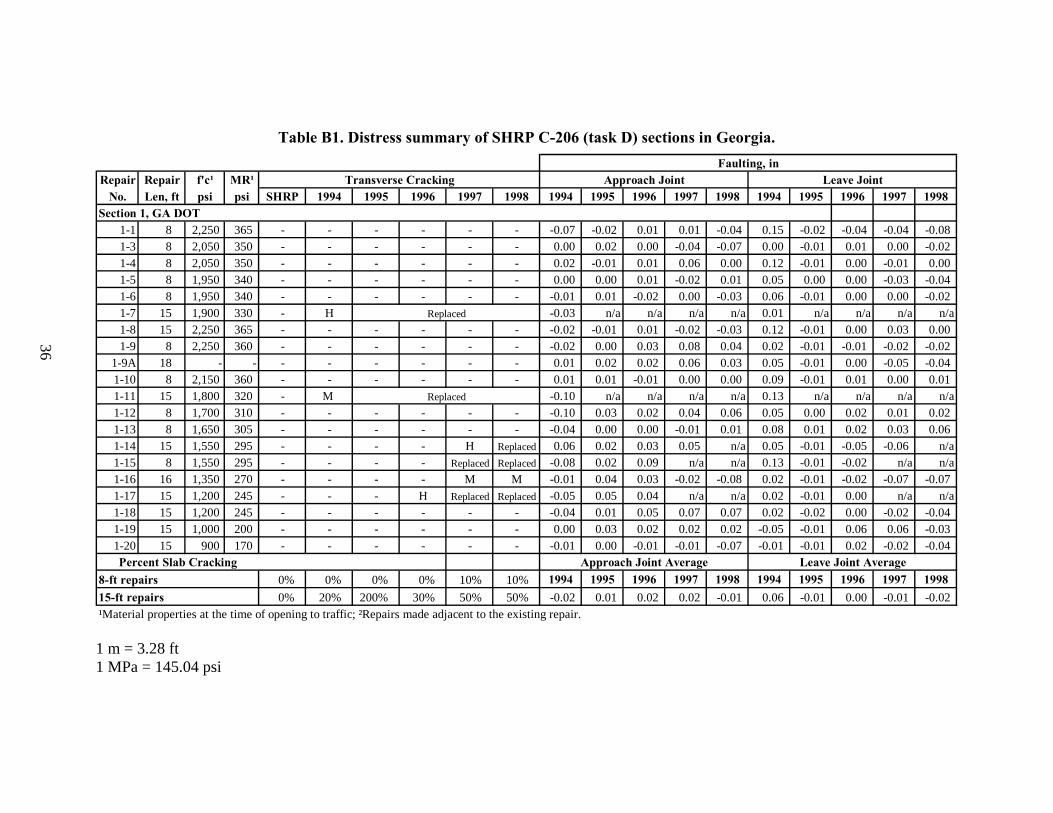
Table B1. Distress summary of SHRP C-206 (task D) sections in Georgia. Faulting, in
Repair Repair f'c¹ MR¹ Transverse Cracking Approach Joint Leave JointNo. Len, ft psi psi SHRP 1994 1995 1996 1997 1998 1994 1995 1996 1997 1998 1994 1995 1996 1997 1998
Section 1, GA DOT1-1 8 2,250 365 - - - - - - -0.07 -0.02 0.01 0.01 -0.04 0.15 -0.02 -0.04 -0.04 -0.081-3 8 2,050 350 - - - - - - 0.00 0.02 0.00 -0.04 -0.07 0.00 -0.01 0.01 0.00 -0.021-4 8 2,050 350 - - - - - - 0.02 -0.01 0.01 0.06 0.00 0.12 -0.01 0.00 -0.01 0.001-5 8 1,950 340 - - - - - - 0.00 0.00 0.01 -0.02 0.01 0.05 0.00 0.00 -0.03 -0.041-6 8 1,950 340 - - - - - - -0.01 0.01 -0.02 0.00 -0.03 0.06 -0.01 0.00 0.00 -0.021-7 15 1,900 330 - H Replaced -0.03 n/a n/a n/a n/a 0.01 n/a n/a n/a n/a1-8 15 2,250 365 - - - - - - -0.02 -0.01 0.01 -0.02 -0.03 0.12 -0.01 0.00 0.03 0.001-9 8 2,250 360 - - - - - - -0.02 0.00 0.03 0.08 0.04 0.02 -0.01 -0.01 -0.02 -0.02
1-9A 18 - - - - - - - - 0.01 0.02 0.02 0.06 0.03 0.05 -0.01 0.00 -0.05 -0.041-10 8 2,150 360 - - - - - - 0.01 0.01 -0.01 0.00 0.00 0.09 -0.01 0.01 0.00 0.011-11 15 1,800 320 - M Replaced -0.10 n/a n/a n/a n/a 0.13 n/a n/a n/a n/a1-12 8 1,700 310 - - - - - - -0.10 0.03 0.02 0.04 0.06 0.05 0.00 0.02 0.01 0.021-13 8 1,650 305 - - - - - - -0.04 0.00 0.00 -0.01 0.01 0.08 0.01 0.02 0.03 0.061-14 15 1,550 295 - - - - H Replaced 0.06 0.02 0.03 0.05 n/a 0.05 -0.01 -0.05 -0.06 n/a1-15 8 1,550 295 - - - - Replaced Replaced -0.08 0.02 0.09 n/a n/a 0.13 -0.01 -0.02 n/a n/a1-16 16 1,350 270 - - - - M M -0.01 0.04 0.03 -0.02 -0.08 0.02 -0.01 -0.02 -0.07 -0.071-17 15 1,200 245 - - - H Replaced Replaced -0.05 0.05 0.04 n/a n/a 0.02 -0.01 0.00 n/a n/a1-18 15 1,200 245 - - - - - - -0.04 0.01 0.05 0.07 0.07 0.02 -0.02 0.00 -0.02 -0.041-19 15 1,000 200 - - - - - - 0.00 0.03 0.02 0.02 0.02 -0.05 -0.01 0.06 0.06 -0.031-20 15 900 170 - - - - - - -0.01 0.00 -0.01 -0.01 -0.07 -0.01 -0.01 0.02 -0.02 -0.04Percent Slab Cracking Approach Joint Average Leave Joint Average
0% 0% 0% 0% 10% 10% 1994 1995 1996 1997 1998 1994 1995 1996 1997 19980% 20% 200% 30% 50% 50% -0.02 0.01 0.02 0.02 -0.01 0.06 -0.01 0.00 -0.01 -0.02
¹Material properties at the time of opening to traffic; ²Repairs made adjacent to the existing repair.
8-ft repairs 15-ft repairs
36
1 m = 3.28 ft 1 MPa = 145.04 psi
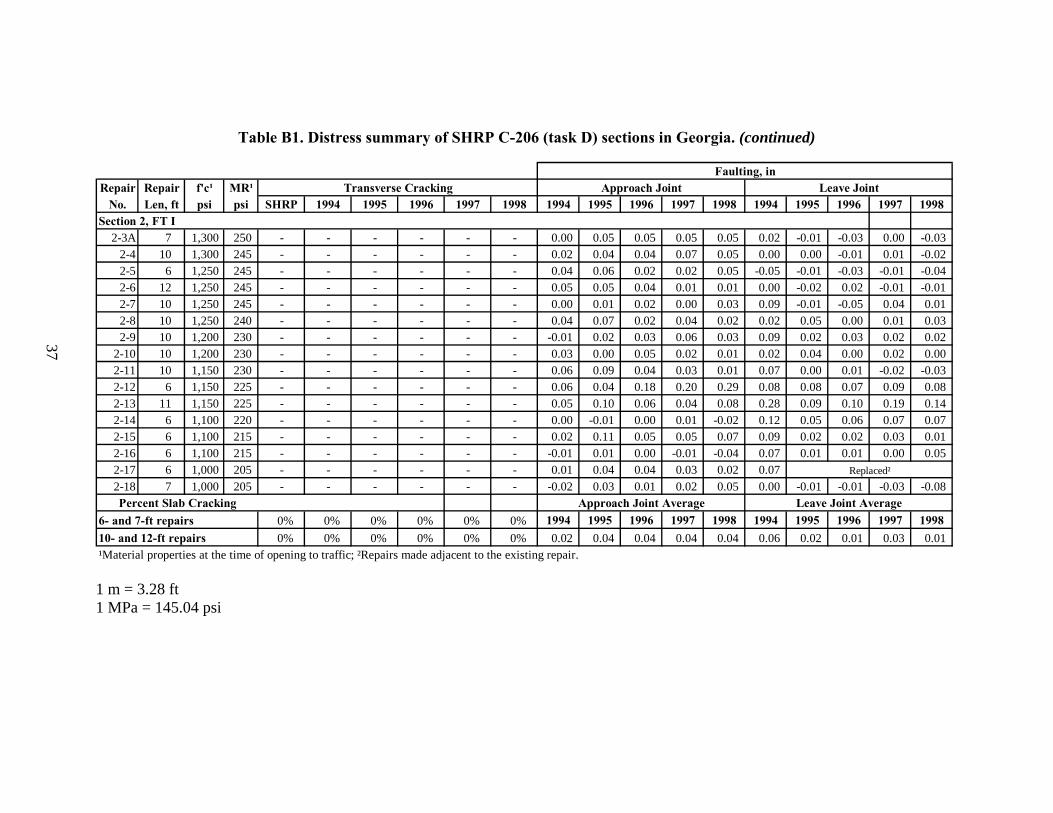
Table B1. Distress summary of SHRP C-206 (task D) sections in Georgia. (continued)
Faulting, inRepair Repair f'c¹ MR¹ Transverse Cracking Approach Joint Leave Joint
No. Len, ft psi psi SHRP 1994 1995 1996 1997 1998 1994 1995 1996 1997 1998 1994 1995 1996 1997 1998Section 2, FT I
2-3A 7 1,300 250 - - - - - - 0.00 0.05 0.05 0.05 0.05 0.02 -0.01 -0.03 0.00 -0.032-4 10 1,300 245 - - - - - - 0.02 0.04 0.04 0.07 0.05 0.00 0.00 -0.01 0.01 -0.022-5 6 1,250 245 - - - - - - 0.04 0.06 0.02 0.02 0.05 -0.05 -0.01 -0.03 -0.01 -0.042-6 12 1,250 245 - - - - - - 0.05 0.05 0.04 0.01 0.01 0.00 -0.02 0.02 -0.01 -0.012-7 10 1,250 245 - - - - - - 0.00 0.01 0.02 0.00 0.03 0.09 -0.01 -0.05 0.04 0.012-8 10 1,250 240 - - - - - - 0.04 0.07 0.02 0.04 0.02 0.02 0.05 0.00 0.01 0.032-9 10 1,200 230 - - - - - - -0.01 0.02 0.03 0.06 0.03 0.09 0.02 0.03 0.02 0.02
2-10 10 1,200 230 - - - - - - 0.03 0.00 0.05 0.02 0.01 0.02 0.04 0.00 0.02 0.002-11 10 1,150 230 - - - - - - 0.06 0.09 0.04 0.03 0.01 0.07 0.00 0.01 -0.02 -0.032-12 6 1,150 225 - - - - - - 0.06 0.04 0.18 0.20 0.29 0.08 0.08 0.07 0.09 0.082-13 11 1,150 225 - - - - - - 0.05 0.10 0.06 0.04 0.08 0.28 0.09 0.10 0.19 0.142-14 6 1,100 220 - - - - - - 0.00 -0.01 0.00 0.01 -0.02 0.12 0.05 0.06 0.07 0.072-15 6 1,100 215 - - - - - - 0.02 0.11 0.05 0.05 0.07 0.09 0.02 0.02 0.03 0.012-16 6 1,100 215 - - - - - - -0.01 0.01 0.00 -0.01 -0.04 0.07 0.01 0.01 0.00 0.052-17 6 1,000 205 - - - - - - 0.01 0.04 0.04 0.03 0.02 0.07 Replaced²2-18 7 1,000 205 - - - - - - -0.02 0.03 0.01 0.02 0.05 0.00 -0.01 -0.01 -0.03 -0.08Percent Slab Cracking Approach Joint Average Leave Joint Average
0% 0% 0% 0% 0% 0% 1994 1995 1996 1997 1998 1994 1995 1996 1997 19980% 0% 0% 0% 0% 0% 0.02 0.04 0.04 0.04 0.04 0.06 0.02 0.01 0.03 0.01
¹Material properties at the time of opening to traffic; ²Repairs made adjacent to the existing repair.
6- and 7-ft repairs 10- and 12-ft repairs
37
1 m = 3.28 ft 1 MPa = 145.04 psi

Table B1. Distress summary of SHRP C-206 (task D) sections in Georgia. (continued)
Faulting, inRepair Repair f'c¹ MR¹ Transverse Cracking Approach Joint Leave Joint
No. Len, ft psi psi SHRP 1994 1995 1996 1997 1998 1994 1995 1996 1997 1998 1994 1995 1996 1997 1998Section 3, VES
3-2 12 2,600 365 - - - - - - -0.06 0.01 0.01 0.00 0.00 0.01 0.01 0.01 -0.02 -0.033-3 12 2,500 360 - - - - - - -0.07 0.08 -0.01 -0.02 -0.05 0.01 0.01 0.00 0.07 0.033-4 12 2,450 350 - - - - - - -0.09 -0.01 0.03 -0.06 -0.07 0.01 0.06 0.03 0.05 0.023-5 12 2,350 335 - - - - - - -0.07 -0.01 -0.01 -0.05 -0.08 0.05 0.04 0.00 0.01 -0.023-6 8 2,350 335 - - - - - - -0.12 -0.01 -0.09 -0.06 -0.08 0.02 0.02 0.02 0.01 -0.033-7 12 2,200 320 - - - - - - -0.18 0.00 0.03 0.01 -0.01 0.08 -0.01 0.01 0.03 0.013-8 8 2,100 305 - - - - - - -0.05 0.00 -0.03 -0.02 -0.08 -0.01 -0.01 -0.04 -0.02 -0.073-9 8 2,050 300 - - - - - - -0.04 0.01 -0.03 -0.05 -0.06 0.00 0.01 -0.02 -0.01 -0.04
3-10 12 2,000 295 - - - - - - -0.01 0.00 -0.02 -0.02 n/a2 0.03 0.01 0.01 0.00 -0.033-11 12 1,950 290 - - - - - - 0.01 0.02 0.01 0.04 -0.03 0.03 0.05 0.00 0.02 -0.043-12 8 1,800 270 - - - - - - -0.05 Replaced² 0.01 -0.02 -0.08 -0.11 -0.063-13 8 1,800 270 - - - - - - -0.05 0.03 0.04 0.05 0.00 0.04 -0.01 -0.03 -0.04 -0.023-14 12 1,700 260 - - - - - - -0.08 -0.03 -0.04 -0.01 -0.05 0.06 0.00 0.00 -0.02 -0.053-15 9 1,650 255 - - - - - - -0.01 -0.04 -0.03 0.00 0.00 -0.02 0.02 0.01 -0.02 0.003-16 12 1,550 230 - - - - - - -0.05 0.03 0.02 0.03 0.02 0.07 0.01 0.02 0.02 0.023-17 8 1,500 225 - - - - - - -0.01 0.00 0.01 0.00 -0.05 0.02 -0.01 -0.01 0.01 -0.073-18 8 1,500 225 - - - - - - -0.08 0.08 0.01 0.06 -0.01 0.05 0.00 0.00 0.03 -0.023-19 8 1,050 165 - - - - - - -0.07 0.05 -0.03 0.01 -0.05 0.01 -0.02 -0.03 -0.01 0.013-20 8 1,000 155 - - - - - - -0.01 0.00 0.01 0.04 0.02 0.03 -0.01 0.00 0.00 -0.02Percent Slab Cracking Approach Joint Average Leave Joint Average
0% 0% 0% 0% 0% 0% 1994 1995 1996 1997 1998 1994 1995 1996 1997 19980% 0% 0% 0% 0% 0% -0.06 0.01 -0.01 0.00 -0.03 0.03 0.01 -0.01 0.00 -0.02
¹Material properties at the time of opening to traffic; ²Repairs made adjacent to the existing repair.
8-ft repairs 12-ft repairs
38
1 m = 3.28 ft 1 MPa = 145.04 psi
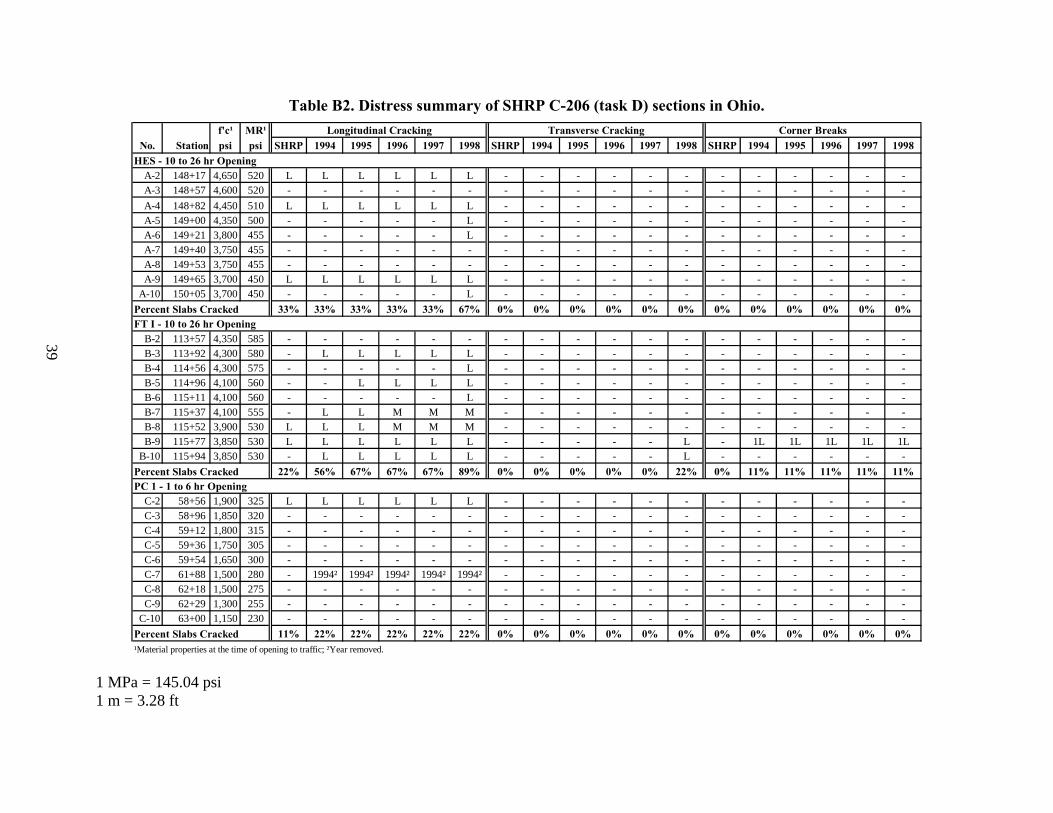
Table B2. Distress summary of SHRP C-206 (task D) sections in Ohio. f'c¹ MR¹ Longitudinal Cracking Transverse Cracking Corner Breaks
No. Station psi psi SHRP 1994 1995 1996 1997 1998 SHRP 1994 1995 1996 1997 1998 SHRP 1994 1995 1996 1997 1998HES - 10 to 26 hr Opening
A-2 148+17 4,650 520 L L L L L L - - - - - - - - - - - -A-3 148+57 4,600 520 - - - - - - - - - - - - - - - - - -A-4 148+82 4,450 510 L L L L L L - - - - - - - - - - - -A-5 149+00 4,350 500 - - - - - L - - - - - - - - - - - -A-6 149+21 3,800 455 - - - - - L - - - - - - - - - - - -A-7 149+40 3,750 455 - - - - - - - - - - - - - - - - - -A-8 149+53 3,750 455 - - - - - - - - - - - - - - - - - -A-9 149+65 3,700 450 L L L L L L - - - - - - - - - - - -
A-10 150+05 3,700 450 - - - - - L - - - - - - - - - - - -33% 33% 33% 33% 33% 67% 0% 0% 0% 0% 0% 0% 0% 0% 0% 0% 0% 0%
FT I - 10 to 26 hr OpeningB-2 113+57 4,350 585 - - - - - - - - - - - - - - - - - -B-3 113+92 4,300 580 - L L L L L - - - - - - - - - - - -B-4 114+56 4,300 575 - - - - - L - - - - - - - - - - - -B-5 114+96 4,100 560 - - L L L L - - - - - - - - - - - -B-6 115+11 4,100 560 - - - - - L - - - - - - - - - - - -B-7 115+37 4,100 555 - L L M M M - - - - - - - - - - - -B-8 115+52 3,900 530 L L L M M M - - - - - - - - - - - -B-9 115+77 3,850 530 L L L L L L - - - - - L - 1L 1L 1L 1L 1L
B-10 115+94 3,850 530 - L L L L L - - - - - L - - - - - -22% 56% 67% 67% 67% 89% 0% 0% 0% 0% 0% 22% 0% 11% 11% 11% 11% 11%
PC 1 - 1 to 6 hr OpeningC-2 58+56 1,900 325 L L L L L L - - - - - - - - - - - -C-3 58+96 1,850 320 - - - - - - - - - - - - - - - - - -C-4 59+12 1,800 315 - - - - - - - - - - - - - - - - - -C-5 59+36 1,750 305 - - - - - - - - - - - - - - - - - -C-6 59+54 1,650 300 - - - - - - - - - - - - - - - - - -C-7 61+88 1,500 280 - 1994² 1994² 1994² 1994² 1994² - - - - - - - - - - - -C-8 62+18 1,500 275 - - - - - - - - - - - - - - - - - -C-9 62+29 1,300 255 - - - - - - - - - - - - - - - - - -
C-10 63+00 1,150 230 - - - - - - - - - - - - - - - - - -11% 22% 22% 22% 22% 22% 0% 0% 0% 0% 0% 0% 0% 0% 0% 0% 0% 0%
¹Material properties at the time of opening to traffic; ²Year removed.
Percent Slabs Cracked
Percent Slabs Cracked
Percent Slabs Cracked
39
1 MPa = 145.04 psi 1 m = 3.28 ft
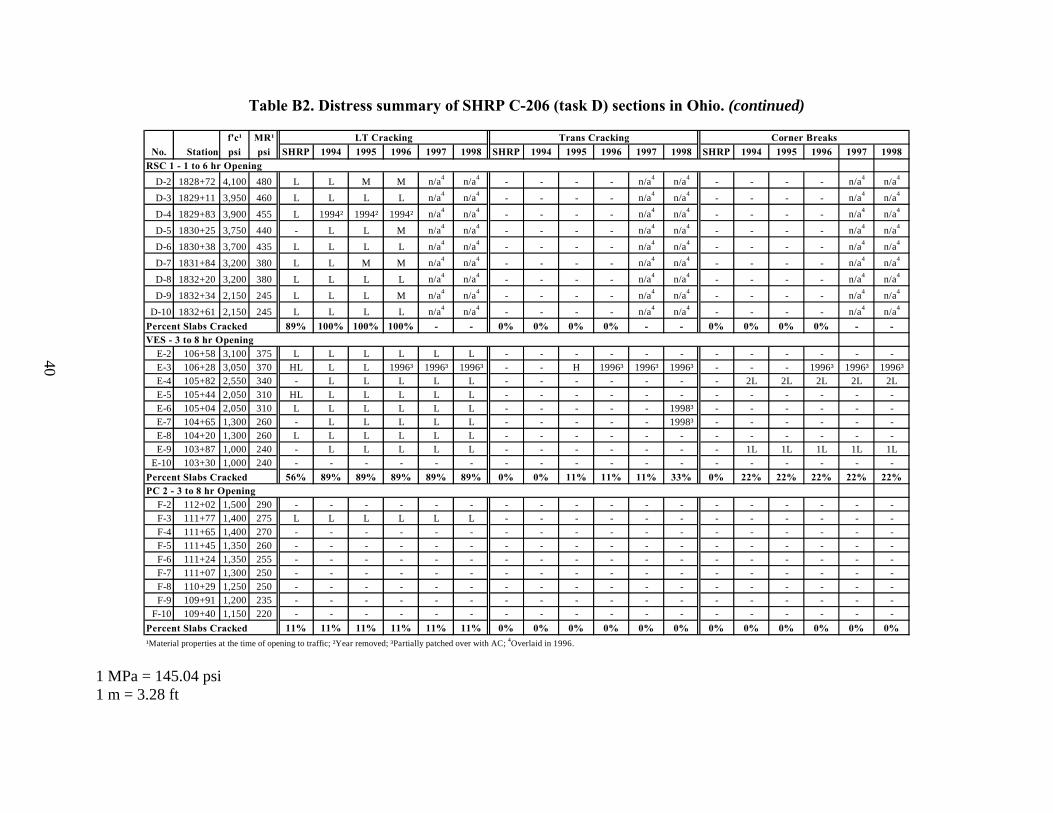
Table B2. Distress summary of SHRP C-206 (task D) sections in Ohio. (continued)
f'c¹ MR¹ LT Cracking Trans Cracking Corner BreaksNo. Station psi psi SHRP 1994 1995 1996 1997 1998 SHRP 1994 1995 1996 1997 1998 SHRP 1994 1995 1996 1997 1998
RSC 1 - 1 to 6 hr OpeningD-2 1828+72 4,100 480 L L M M n/a4 n/a4 - - - - n/a4 n/a4 - - - - n/a4 n/a4
D-3 1829+11 3,950 460 L L L L n/a4 n/a4 - - - - n/a4 n/a4 - - - - n/a4 n/a4
D-4 1829+83 3,900 455 L 1994² 1994² 1994² n/a4 n/a4 - - - - n/a4 n/a4 - - - - n/a4 n/a4
D-5 1830+25 3,750 440 - L L M n/a4 n/a4 - - - - n/a4 n/a4 - - - - n/a4 n/a4
D-6 1830+38 3,700 435 L L L L n/a4 n/a4 - - - - n/a4 n/a4 - - - - n/a4 n/a4
D-7 1831+84 3,200 380 L L M M n/a4 n/a4 - - - - n/a4 n/a4 - - - - n/a4 n/a4
D-8 1832+20 3,200 380 L L L L n/a4 n/a4 - - - - n/a4 n/a4 - - - - n/a4 n/a4
D-9 1832+34 2,150 245 L L L M n/a4 n/a4 - - - - n/a4 n/a4 - - - - n/a4 n/a4
D-10 1832+61 2,150 245 L L L L n/a4 n/a4 - - - - n/a4 n/a4 - - - - n/a4 n/a4
89% 100% 100% 100% - - 0% 0% 0% 0% - - 0% 0% 0% 0% - -VES - 3 to 8 hr Opening
E-2 106+58 3,100 375 L L L L L L - - - - - - - - - - - -E-3 106+28 3,050 370 HL L L 1996³ 1996³ 1996³ - - H 1996³ 1996³ 1996³ - - - 1996³ 1996³ 1996³E-4 105+82 2,550 340 - L L L L L - - - - - - - 2L 2L 2L 2L 2LE-5 105+44 2,050 310 HL L L L L L - - - - - - - - - - - -E-6 105+04 2,050 310 L L L L L L - - - - - 1998³ - - - - - -E-7 104+65 1,300 260 - L L L L L - - - - - 1998³ - - - - - -E-8 104+20 1,300 260 L L L L L L - - - - - - - - - - - -E-9 103+87 1,000 240 - L L L L L - - - - - - - 1L 1L 1L 1L 1L
E-10 103+30 1,000 240 - - - - - - - - - - - - - - - - - -56% 89% 89% 89% 89% 89% 0% 0% 11% 11% 11% 33% 0% 22% 22% 22% 22% 22%
PC 2 - 3 to 8 hr OpeningF-2 112+02 1,500 290 - - - - - - - - - - - - - - - - - -F-3 111+77 1,400 275 L L L L L L - - - - - - - - - - - -F-4 111+65 1,400 270 - - - - - - - - - - - - - - - - - -F-5 111+45 1,350 260 - - - - - - - - - - - - - - - - - -F-6 111+24 1,350 255 - - - - - - - - - - - - - - - - - -F-7 111+07 1,300 250 - - - - - - - - - - - - - - - - - -F-8 110+29 1,250 250 - - - - - - - - - - - - - - - - - -F-9 109+91 1,200 235 - - - - - - - - - - - - - - - - - -
F-10 109+40 1,150 220 - - - - - - - - - - - - - - - - - -11% 11% 11% 11% 11% 11% 0% 0% 0% 0% 0% 0% 0% 0% 0% 0% 0% 0%
¹Material properties at the time of opening to traffic; ²Year removed; ³Partially patched over with AC; 4Overlaid in 1996.
Percent Slabs Cracked
Percent Slabs Cracked
Percent Slabs Cracked
40
1 MPa = 145.04 psi 1 m = 3.28 ft
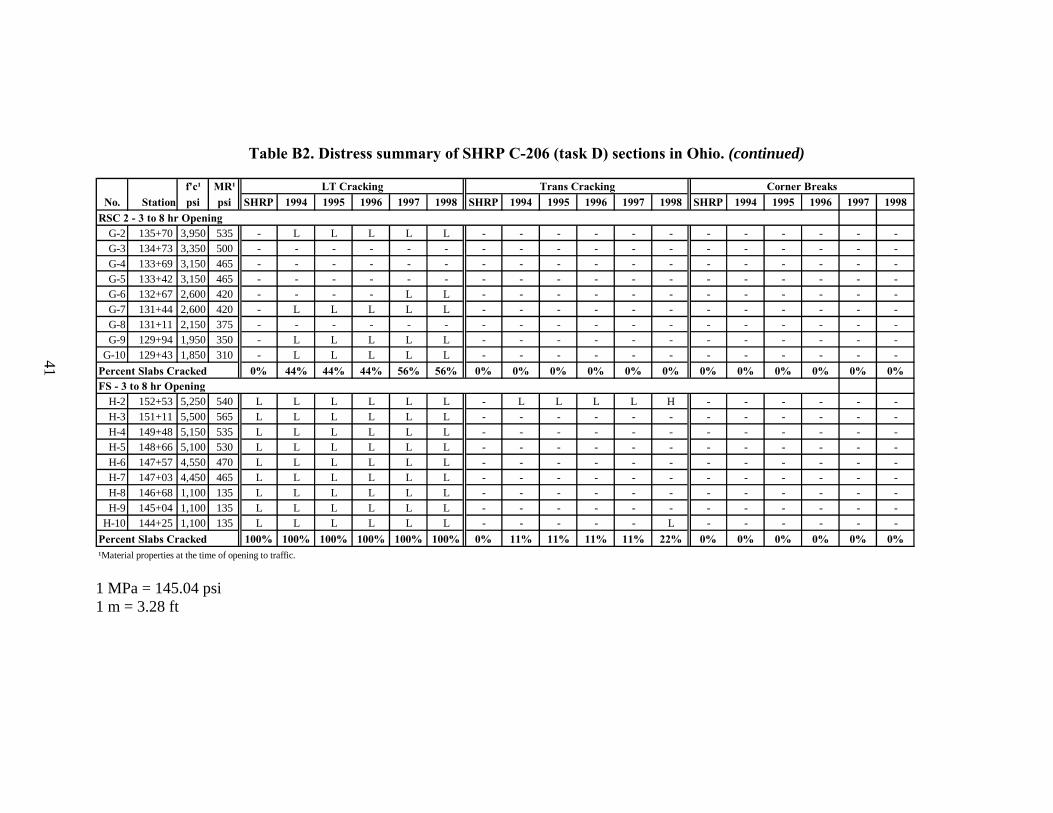
Table B2. Distress summary of SHRP C-206 (task D) sections in Ohio. (continued)
f'c¹ MR¹ LT Cracking Trans Cracking Corner BreaksNo. Station psi psi SHRP 1994 1995 1996 1997 1998 SHRP 1994 1995 1996 1997 1998 SHRP 1994 1995 1996 1997 1998
RSC 2 - 3 to 8 hr OpeningG-2 135+70 3,950 535 - L L L L L - - - - - - - - - - - -G-3 134+73 3,350 500 - - - - - - - - - - - - - - - - - -G-4 133+69 3,150 465 - - - - - - - - - - - - - - - - - -G-5 133+42 3,150 465 - - - - - - - - - - - - - - - - - -G-6 132+67 2,600 420 - - - - L L - - - - - - - - - - - -G-7 131+44 2,600 420 - L L L L L - - - - - - - - - - - -G-8 131+11 2,150 375 - - - - - - - - - - - - - - - - - -G-9 129+94 1,950 350 - L L L L L - - - - - - - - - - - -
G-10 129+43 1,850 310 - L L L L L - - - - - - - - - - - -0% 44% 44% 44% 56% 56% 0% 0% 0% 0% 0% 0% 0% 0% 0% 0% 0% 0%
FS - 3 to 8 hr OpeningH-2 152+53 5,250 540 L L L L L L - L L L L H - - - - - -H-3 151+11 5,500 565 L L L L L L - - - - - - - - - - - -H-4 149+48 5,150 535 L L L L L L - - - - - - - - - - - -H-5 148+66 5,100 530 L L L L L L - - - - - - - - - - - -H-6 147+57 4,550 470 L L L L L L - - - - - - - - - - - -H-7 147+03 4,450 465 L L L L L L - - - - - - - - - - - -H-8 146+68 1,100 135 L L L L L L - - - - - - - - - - - -H-9 145+04 1,100 135 L L L L L L - - - - - - - - - - - -
H-10 144+25 1,100 135 L L L L L L - - - - - L - - - - - -100% 100% 100% 100% 100% 100% 0% 11% 11% 11% 11% 22% 0% 0% 0% 0% 0% 0%
¹Material properties at the time of opening to traffic.
Percent Slabs Cracked
Percent Slabs Cracked
1 MPa = 145.04 psi 1 m = 3.28 ft
41
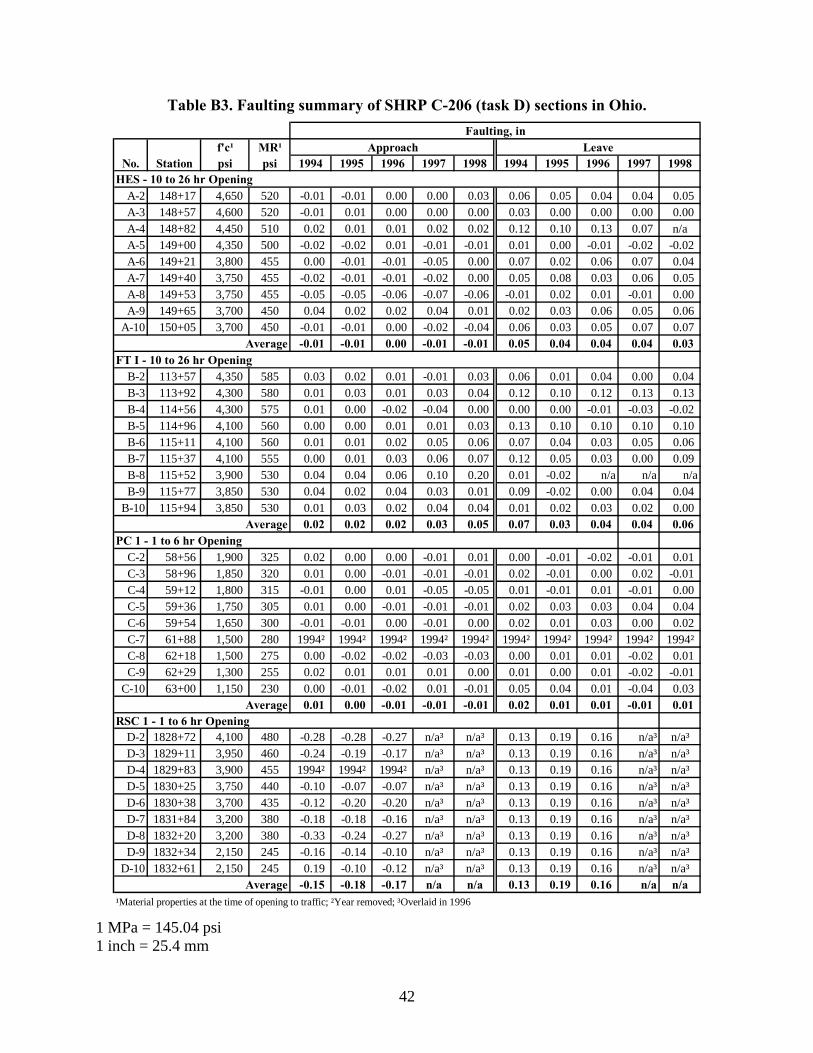
Table B3. Faulting summary of SHRP C-206 (task D) sections in Ohio. Faulting, in
f'c¹ MR¹ Approach LeaveNo. Station psi psi 1994 1995 1996 1997 1998 1994 1995 1996 1997 1998
HES - 10 to 26 hr OpeningA-2 148+17 4,650 520 -0.01 -0.01 0.00 0.00 0.03 0.06 0.05 0.04 0.04 0.05A-3 148+57 4,600 520 -0.01 0.01 0.00 0.00 0.00 0.03 0.00 0.00 0.00 0.00A-4 148+82 4,450 510 0.02 0.01 0.01 0.02 0.02 0.12 0.10 0.13 0.07 n/aA-5 149+00 4,350 500 -0.02 -0.02 0.01 -0.01 -0.01 0.01 0.00 -0.01 -0.02 -0.02A-6 149+21 3,800 455 0.00 -0.01 -0.01 -0.05 0.00 0.07 0.02 0.06 0.07 0.04A-7 149+40 3,750 455 -0.02 -0.01 -0.01 -0.02 0.00 0.05 0.08 0.03 0.06 0.05A-8 149+53 3,750 455 -0.05 -0.05 -0.06 -0.07 -0.06 -0.01 0.02 0.01 -0.01 0.00A-9 149+65 3,700 450 0.04 0.02 0.02 0.04 0.01 0.02 0.03 0.06 0.05 0.06
A-10 150+05 3,700 450 -0.01 -0.01 0.00 -0.02 -0.04 0.06 0.03 0.05 0.07 0.07Average -0.01 -0.01 0.00 -0.01 -0.01 0.05 0.04 0.04 0.04 0.03
FT I - 10 to 26 hr OpeningB-2 113+57 4,350 585 0.03 0.02 0.01 -0.01 0.03 0.06 0.01 0.04 0.00 0.04B-3 113+92 4,300 580 0.01 0.03 0.01 0.03 0.04 0.12 0.10 0.12 0.13 0.13B-4 114+56 4,300 575 0.01 0.00 -0.02 -0.04 0.00 0.00 0.00 -0.01 -0.03 -0.02B-5 114+96 4,100 560 0.00 0.00 0.01 0.01 0.03 0.13 0.10 0.10 0.10 0.10B-6 115+11 4,100 560 0.01 0.01 0.02 0.05 0.06 0.07 0.04 0.03 0.05 0.06B-7 115+37 4,100 555 0.00 0.01 0.03 0.06 0.07 0.12 0.05 0.03 0.00 0.09B-8 115+52 3,900 530 0.04 0.04 0.06 0.10 0.20 0.01 -0.02 n/a n/a n/aB-9 115+77 3,850 530 0.04 0.02 0.04 0.03 0.01 0.09 -0.02 0.00 0.04 0.04
B-10 115+94 3,850 530 0.01 0.03 0.02 0.04 0.04 0.01 0.02 0.03 0.02 0.00Average 0.02 0.02 0.02 0.03 0.05 0.07 0.03 0.04 0.04 0.06
PC 1 - 1 to 6 hr OpeningC-2 58+56 1,900 325 0.02 0.00 0.00 -0.01 0.01 0.00 -0.01 -0.02 -0.01 0.01C-3 58+96 1,850 320 0.01 0.00 -0.01 -0.01 -0.01 0.02 -0.01 0.00 0.02 -0.01C-4 59+12 1,800 315 -0.01 0.00 0.01 -0.05 -0.05 0.01 -0.01 0.01 -0.01 0.00C-5 59+36 1,750 305 0.01 0.00 -0.01 -0.01 -0.01 0.02 0.03 0.03 0.04 0.04C-6 59+54 1,650 300 -0.01 -0.01 0.00 -0.01 0.00 0.02 0.01 0.03 0.00 0.02C-7 61+88 1,500 280 1994² 1994² 1994² 1994² 1994² 1994² 1994² 1994² 1994² 1994²C-8 62+18 1,500 275 0.00 -0.02 -0.02 -0.03 -0.03 0.00 0.01 0.01 -0.02 0.01C-9 62+29 1,300 255 0.02 0.01 0.01 0.01 0.00 0.01 0.00 0.01 -0.02 -0.01
C-10 63+00 1,150 230 0.00 -0.01 -0.02 0.01 -0.01 0.05 0.04 0.01 -0.04 0.03Average 0.01 0.00 -0.01 -0.01 -0.01 0.02 0.01 0.01 -0.01 0.01
RSC 1 - 1 to 6 hr OpeningD-2 1828+72 4,100 480 -0.28 -0.28 -0.27 n/a³ n/a³ 0.13 0.19 0.16 n/a³ n/a³D-3 1829+11 3,950 460 -0.24 -0.19 -0.17 n/a³ n/a³ 0.13 0.19 0.16 n/a³ n/a³D-4 1829+83 3,900 455 1994² 1994² 1994² n/a³ n/a³ 0.13 0.19 0.16 n/a³ n/a³D-5 1830+25 3,750 440 -0.10 -0.07 -0.07 n/a³ n/a³ 0.13 0.19 0.16 n/a³ n/a³D-6 1830+38 3,700 435 -0.12 -0.20 -0.20 n/a³ n/a³ 0.13 0.19 0.16 n/a³ n/a³D-7 1831+84 3,200 380 -0.18 -0.18 -0.16 n/a³ n/a³ 0.13 0.19 0.16 n/a³ n/a³D-8 1832+20 3,200 380 -0.33 -0.24 -0.27 n/a³ n/a³ 0.13 0.19 0.16 n/a³ n/a³D-9 1832+34 2,150 245 -0.16 -0.14 -0.10 n/a³ n/a³ 0.13 0.19 0.16 n/a³ n/a³
D-10 1832+61 2,150 245 0.19 -0.10 -0.12 n/a³ n/a³ 0.13 0.19 0.16 n/a³ n/a³Average -0.15 -0.18 -0.17 n/a n/a 0.13 0.19 0.16 n/a n/a
¹Material properties at the time of opening to traffic; ²Year removed; ³Overlaid in 1996 1 MPa = 145.04 psi 1 inch = 25.4 mm
42
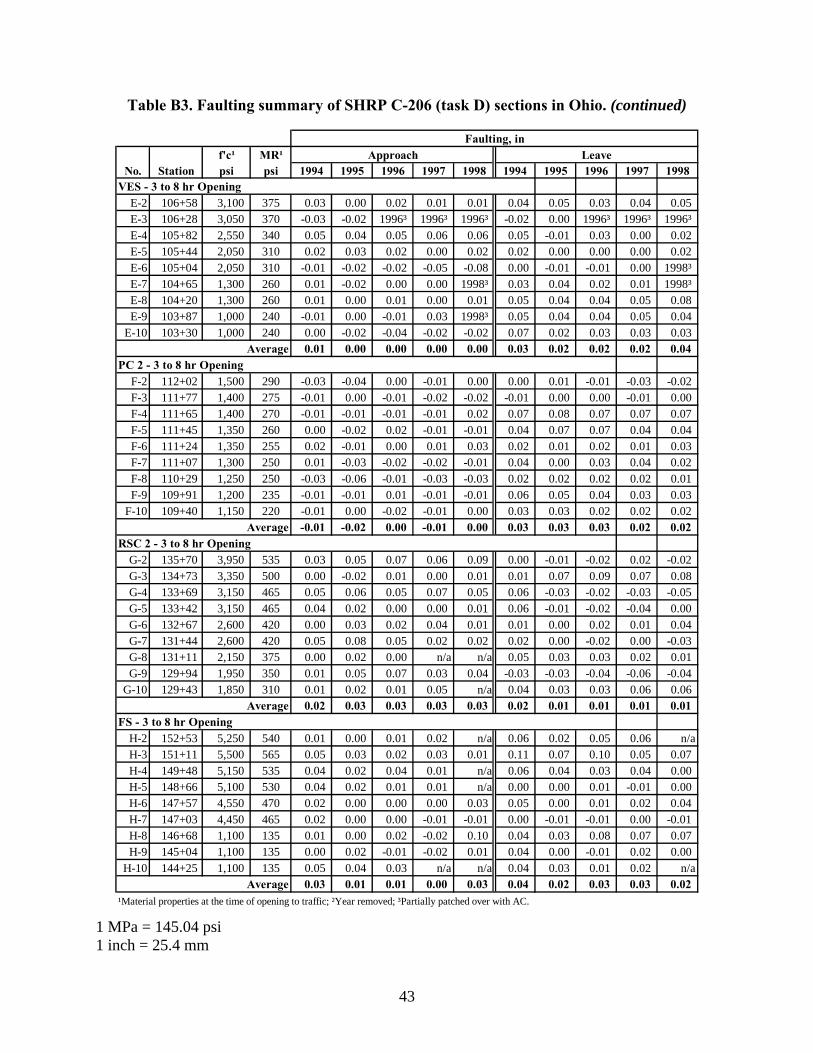
Table B3. Faulting summary of SHRP C-206 (task D) sections in Ohio. (continued)
Faulting, inf'c¹ MR¹ Approach Leave
No. Station psi psi 1994 1995 1996 1997 1998 1994 1995 1996 1997 1998VES - 3 to 8 hr Opening
E-2 106+58 3,100 375 0.03 0.00 0.02 0.01 0.01 0.04 0.05 0.03 0.04 0.05E-3 106+28 3,050 370 -0.03 -0.02 1996³ 1996³ 1996³ -0.02 0.00 1996³ 1996³ 1996³E-4 105+82 2,550 340 0.05 0.04 0.05 0.06 0.06 0.05 -0.01 0.03 0.00 0.02E-5 105+44 2,050 310 0.02 0.03 0.02 0.00 0.02 0.02 0.00 0.00 0.00 0.02E-6 105+04 2,050 310 -0.01 -0.02 -0.02 -0.05 -0.08 0.00 -0.01 -0.01 0.00 1998³E-7 104+65 1,300 260 0.01 -0.02 0.00 0.00 1998³ 0.03 0.04 0.02 0.01 1998³E-8 104+20 1,300 260 0.01 0.00 0.01 0.00 0.01 0.05 0.04 0.04 0.05 0.08E-9 103+87 1,000 240 -0.01 0.00 -0.01 0.03 1998³ 0.05 0.04 0.04 0.05 0.04
E-10 103+30 1,000 240 0.00 -0.02 -0.04 -0.02 -0.02 0.07 0.02 0.03 0.03 0.03Average 0.01 0.00 0.00 0.00 0.00 0.03 0.02 0.02 0.02 0.04
PC 2 - 3 to 8 hr OpeningF-2 112+02 1,500 290 -0.03 -0.04 0.00 -0.01 0.00 0.00 0.01 -0.01 -0.03 -0.02F-3 111+77 1,400 275 -0.01 0.00 -0.01 -0.02 -0.02 -0.01 0.00 0.00 -0.01 0.00F-4 111+65 1,400 270 -0.01 -0.01 -0.01 -0.01 0.02 0.07 0.08 0.07 0.07 0.07F-5 111+45 1,350 260 0.00 -0.02 0.02 -0.01 -0.01 0.04 0.07 0.07 0.04 0.04F-6 111+24 1,350 255 0.02 -0.01 0.00 0.01 0.03 0.02 0.01 0.02 0.01 0.03F-7 111+07 1,300 250 0.01 -0.03 -0.02 -0.02 -0.01 0.04 0.00 0.03 0.04 0.02F-8 110+29 1,250 250 -0.03 -0.06 -0.01 -0.03 -0.03 0.02 0.02 0.02 0.02 0.01F-9 109+91 1,200 235 -0.01 -0.01 0.01 -0.01 -0.01 0.06 0.05 0.04 0.03 0.03
F-10 109+40 1,150 220 -0.01 0.00 -0.02 -0.01 0.00 0.03 0.03 0.02 0.02 0.02Average -0.01 -0.02 0.00 -0.01 0.00 0.03 0.03 0.03 0.02 0.02
RSC 2 - 3 to 8 hr OpeningG-2 135+70 3,950 535 0.03 0.05 0.07 0.06 0.09 0.00 -0.01 -0.02 0.02 -0.02G-3 134+73 3,350 500 0.00 -0.02 0.01 0.00 0.01 0.01 0.07 0.09 0.07 0.08G-4 133+69 3,150 465 0.05 0.06 0.05 0.07 0.05 0.06 -0.03 -0.02 -0.03 -0.05G-5 133+42 3,150 465 0.04 0.02 0.00 0.00 0.01 0.06 -0.01 -0.02 -0.04 0.00G-6 132+67 2,600 420 0.00 0.03 0.02 0.04 0.01 0.01 0.00 0.02 0.01 0.04G-7 131+44 2,600 420 0.05 0.08 0.05 0.02 0.02 0.02 0.00 -0.02 0.00 -0.03G-8 131+11 2,150 375 0.00 0.02 0.00 n/a n/a 0.05 0.03 0.03 0.02 0.01G-9 129+94 1,950 350 0.01 0.05 0.07 0.03 0.04 -0.03 -0.03 -0.04 -0.06 -0.04
G-10 129+43 1,850 310 0.01 0.02 0.01 0.05 n/a 0.04 0.03 0.03 0.06 0.06Average 0.02 0.03 0.03 0.03 0.03 0.02 0.01 0.01 0.01 0.01
FS - 3 to 8 hr OpeningH-2 152+53 5,250 540 0.01 0.00 0.01 0.02 n/a 0.06 0.02 0.05 0.06 n/aH-3 151+11 5,500 565 0.05 0.03 0.02 0.03 0.01 0.11 0.07 0.10 0.05 0.07H-4 149+48 5,150 535 0.04 0.02 0.04 0.01 n/a 0.06 0.04 0.03 0.04 0.00H-5 148+66 5,100 530 0.04 0.02 0.01 0.01 n/a 0.00 0.00 0.01 -0.01 0.00H-6 147+57 4,550 470 0.02 0.00 0.00 0.00 0.03 0.05 0.00 0.01 0.02 0.04H-7 147+03 4,450 465 0.02 0.00 0.00 -0.01 -0.01 0.00 -0.01 -0.01 0.00 -0.01H-8 146+68 1,100 135 0.01 0.00 0.02 -0.02 0.10 0.04 0.03 0.08 0.07 0.07H-9 145+04 1,100 135 0.00 0.02 -0.01 -0.02 0.01 0.04 0.00 -0.01 0.02 0.00
H-10 144+25 1,100 135 0.05 0.04 0.03 n/a n/a 0.04 0.03 0.01 0.02 n/aAverage 0.03 0.01 0.01 0.00 0.03 0.04 0.02 0.03 0.03 0.02
¹Material properties at the time of opening to traffic; ²Year removed; ³Partially patched over with AC. 1 MPa = 145.04 psi 1 inch = 25.4 mm
43
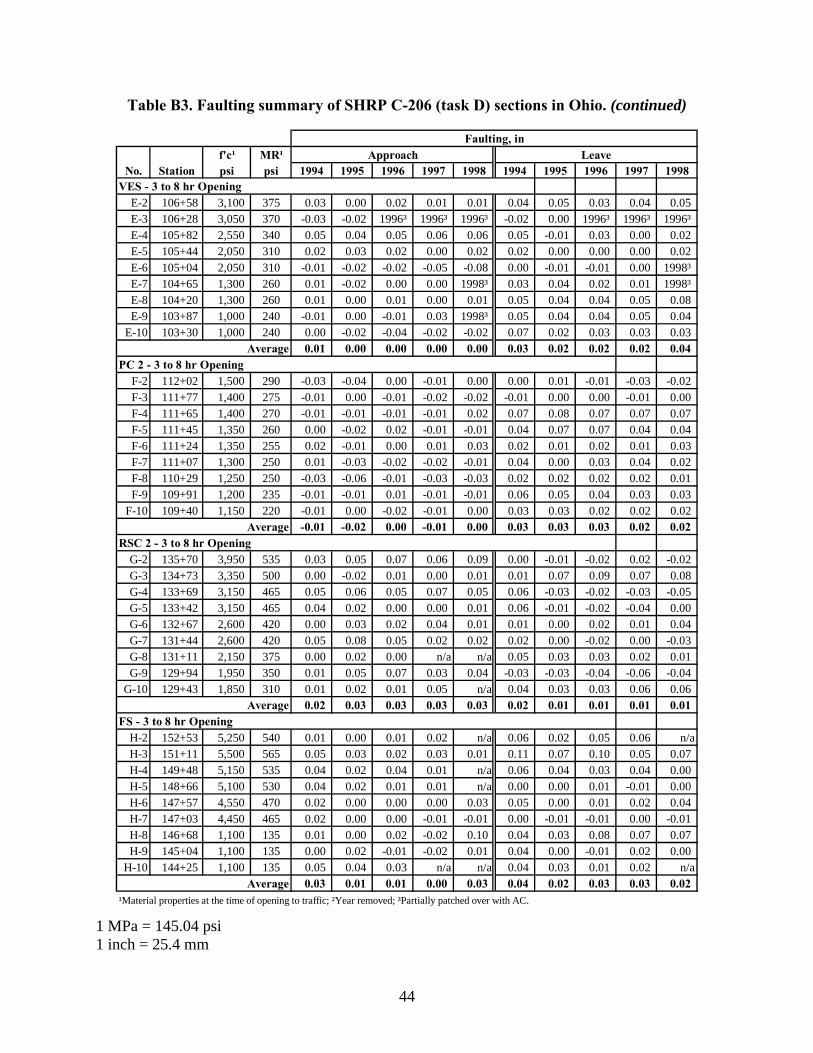
Table B3. Faulting summary of SHRP C-206 (task D) sections in Ohio. (continued)
Faulting, inf'c¹ MR¹ Approach Leave
No. Station psi psi 1994 1995 1996 1997 1998 1994 1995 1996 1997 1998VES - 3 to 8 hr Opening
E-2 106+58 3,100 375 0.03 0.00 0.02 0.01 0.01 0.04 0.05 0.03 0.04 0.05E-3 106+28 3,050 370 -0.03 -0.02 1996³ 1996³ 1996³ -0.02 0.00 1996³ 1996³ 1996³E-4 105+82 2,550 340 0.05 0.04 0.05 0.06 0.06 0.05 -0.01 0.03 0.00 0.02E-5 105+44 2,050 310 0.02 0.03 0.02 0.00 0.02 0.02 0.00 0.00 0.00 0.02E-6 105+04 2,050 310 -0.01 -0.02 -0.02 -0.05 -0.08 0.00 -0.01 -0.01 0.00 1998³E-7 104+65 1,300 260 0.01 -0.02 0.00 0.00 1998³ 0.03 0.04 0.02 0.01 1998³E-8 104+20 1,300 260 0.01 0.00 0.01 0.00 0.01 0.05 0.04 0.04 0.05 0.08E-9 103+87 1,000 240 -0.01 0.00 -0.01 0.03 1998³ 0.05 0.04 0.04 0.05 0.04
E-10 103+30 1,000 240 0.00 -0.02 -0.04 -0.02 -0.02 0.07 0.02 0.03 0.03 0.03Average 0.01 0.00 0.00 0.00 0.00 0.03 0.02 0.02 0.02 0.04
PC 2 - 3 to 8 hr OpeningF-2 112+02 1,500 290 -0.03 -0.04 0.00 -0.01 0.00 0.00 0.01 -0.01 -0.03 -0.02F-3 111+77 1,400 275 -0.01 0.00 -0.01 -0.02 -0.02 -0.01 0.00 0.00 -0.01 0.00F-4 111+65 1,400 270 -0.01 -0.01 -0.01 -0.01 0.02 0.07 0.08 0.07 0.07 0.07F-5 111+45 1,350 260 0.00 -0.02 0.02 -0.01 -0.01 0.04 0.07 0.07 0.04 0.04F-6 111+24 1,350 255 0.02 -0.01 0.00 0.01 0.03 0.02 0.01 0.02 0.01 0.03F-7 111+07 1,300 250 0.01 -0.03 -0.02 -0.02 -0.01 0.04 0.00 0.03 0.04 0.02F-8 110+29 1,250 250 -0.03 -0.06 -0.01 -0.03 -0.03 0.02 0.02 0.02 0.02 0.01F-9 109+91 1,200 235 -0.01 -0.01 0.01 -0.01 -0.01 0.06 0.05 0.04 0.03 0.03
F-10 109+40 1,150 220 -0.01 0.00 -0.02 -0.01 0.00 0.03 0.03 0.02 0.02 0.02Average -0.01 -0.02 0.00 -0.01 0.00 0.03 0.03 0.03 0.02 0.02
RSC 2 - 3 to 8 hr OpeningG-2 135+70 3,950 535 0.03 0.05 0.07 0.06 0.09 0.00 -0.01 -0.02 0.02 -0.02G-3 134+73 3,350 500 0.00 -0.02 0.01 0.00 0.01 0.01 0.07 0.09 0.07 0.08G-4 133+69 3,150 465 0.05 0.06 0.05 0.07 0.05 0.06 -0.03 -0.02 -0.03 -0.05G-5 133+42 3,150 465 0.04 0.02 0.00 0.00 0.01 0.06 -0.01 -0.02 -0.04 0.00G-6 132+67 2,600 420 0.00 0.03 0.02 0.04 0.01 0.01 0.00 0.02 0.01 0.04G-7 131+44 2,600 420 0.05 0.08 0.05 0.02 0.02 0.02 0.00 -0.02 0.00 -0.03G-8 131+11 2,150 375 0.00 0.02 0.00 n/a n/a 0.05 0.03 0.03 0.02 0.01G-9 129+94 1,950 350 0.01 0.05 0.07 0.03 0.04 -0.03 -0.03 -0.04 -0.06 -0.04
G-10 129+43 1,850 310 0.01 0.02 0.01 0.05 n/a 0.04 0.03 0.03 0.06 0.06Average 0.02 0.03 0.03 0.03 0.03 0.02 0.01 0.01 0.01 0.01
FS - 3 to 8 hr OpeningH-2 152+53 5,250 540 0.01 0.00 0.01 0.02 n/a 0.06 0.02 0.05 0.06 n/aH-3 151+11 5,500 565 0.05 0.03 0.02 0.03 0.01 0.11 0.07 0.10 0.05 0.07H-4 149+48 5,150 535 0.04 0.02 0.04 0.01 n/a 0.06 0.04 0.03 0.04 0.00H-5 148+66 5,100 530 0.04 0.02 0.01 0.01 n/a 0.00 0.00 0.01 -0.01 0.00H-6 147+57 4,550 470 0.02 0.00 0.00 0.00 0.03 0.05 0.00 0.01 0.02 0.04H-7 147+03 4,450 465 0.02 0.00 0.00 -0.01 -0.01 0.00 -0.01 -0.01 0.00 -0.01H-8 146+68 1,100 135 0.01 0.00 0.02 -0.02 0.10 0.04 0.03 0.08 0.07 0.07H-9 145+04 1,100 135 0.00 0.02 -0.01 -0.02 0.01 0.04 0.00 -0.01 0.02 0.00
H-10 144+25 1,100 135 0.05 0.04 0.03 n/a n/a 0.04 0.03 0.01 0.02 n/aAverage 0.03 0.01 0.01 0.00 0.03 0.04 0.02 0.03 0.03 0.02
¹Material properties at the time of opening to traffic; ²Year removed; ³Partially patched over with AC. 1 MPa = 145.04 psi 1 inch = 25.4 mm
44
REFERENCES
American Concrete Pavement Association (ACPA). 1995. Guidelines for Full-Depth Repair. Technical Bulletin TB002.02P. American Concrete Pavement Association, Skokie, IL.
Forster, S.W. 1998. “HIPERPAV: A User-Friendly Tool to Help Us ‘Build It Right’.” Public Roads. Vol 61, No. 4 (http://www.tfhrc.gov/pubrds/may98/hiper.htm). Federal Highway Administration, Washington, DC.
Grove, J. D., K. Jones, K. Bharil. 1993. Fast Track and Fast Track II: Cedar Rapids, Iowa. Report HR-544. Iowa Department of Transportation, Ames, IA.
McCullough, B.F. and R. O. Rasmussan. 1999. Fast-Track Paving: Concrete Temperature Control and Traffic Opening Criteria for Bonding Concrete Overlays, Volume I: Final Report. Report FHWA−RD-98-167. Federal Highway Administration, Washington, DC.
Smith, K. D., M. J. Wade, D. G. Peshkin, L. Khazanovich, H. T. Yu, and M. I. Darter. 1995. Performance of Concrete Pavements, Volume II—Evaluation of In-Service Concrete Pavements. Report FHWA-RD-95-110, Federal Highway Administration, Washington, DC.
Snyder, M. B., M. J. Reiter, K. T. Hall, and M. I. Darter. 1989. Rehabilitation of Concrete Pavements, Volume I — Repair Rehabilitation Techniques. Report FHWA-RD-88-071. Federal Highway Administration, Washington, DC.
Whiting, D. M. Nagi, P. A. Okamoto, H. T. Yu, D. G. Peshkin, K. D. Smith, M. I. Darter, J. Clifton, and L. Kaetzel. 1994. Optimization of Highway Concrete Technology. Report SHRP-C-373. Strategic Highway Research Program, Washington, DC.
Yu, H.T., K.D. Smith, M.I. Darter, J. Jiang, and L. Khazanovich. 1998. Performance of Concrete Pavements, Volume III: Improving Concrete Pavement Performance. Report FHWA-RD-95-111. Federal Highway Administration, Washington, DC.
Yu, H. T., D. G. Peshkin, K. D. Smith, M. I. Darter, D. Whiting, and H. Delaney. 1994. Concrete Rehabilitation—Users Manual. Report SHRP-C-412, Strategic Highway Research Program, Washington, DC.
45

RecycledRecyclable HRDI-13/08-06(1M)E