highlights report 3rs recycling knowledge, attitudes and ... recycling highlights 2015... · wrap...
TRANSCRIPT
Highlights report
3Rs recycling knowledge, attitudes
and reported behaviour survey 2015
Key highlights about recycling from the 3Rs tracking survey
(Recycling, Re-use and Repair consumer behaviour, knowledge and
attitudes survey), Spring 2015
Project code: RAK008-001
Research date: February – March 2015 Date: March 2016

WRAP’s vision is a world in which
resources are used sustainably.
Our mission is to accelerate the move to a
sustainable resource-efficient economy
through re-inventing how we design,
produce and sell products; re-thinking
how we use and consume products; and
re-defining what is possible through re-
use and recycling.
Find out more at www.wrap.org.uk
Document reference :
WRAP, 2015, Banbury, 3Rs: recycling knowledge, attitudes and claimed behaviour 2015, Prepared by Phil Downing,
Roisin Jones and Alex Plumb
Document reference: [e.g. WRAP, 2006, Report Name (WRAP Project TYR009-19. Report prepared by…..Banbury, WRAP]
Written by: Phil Downing and Alex Plumb, ICARO and Roisin Jones, WRAP
Front cover photography: Woman recycling glass bottle and newspaper at kerbside recycling bin.
While we have tried to make sure this report is accurate, we cannot accept responsibility or be held legally responsible for any loss or damage arising out of or in
connection with this information being inaccurate, incomplete or misleading. This material is copyrighted. You can copy it free of charge as long as the material is
accurate and not used in a misleading context. You must identify the source of the material and acknowledge our copyright. You must not use material to endorse or
suggest we have endorsed a commercial product or service. For more details please see our terms and conditions on our website at www.wrap.org.uk
WRAP – 3Rs recycling knowledge, attitudes and reported behaviour survey 2015 1
Executive summary
● This report summarises the key findings in relation to claimed recycling behaviour,
knowledge and attitude from WRAP’s 3Rs (recycling, reuse and repair) consumer
survey.
● Self-reported recycling levels are high and relatively stable across years for most
materials. There has been a substantial decrease from 2013 in the proportion of
households putting plastic pots, tubs and trays in the general rubbish, while drinks
cartons/ tetra-pak, soft plastic packaging and garden waste have also recorded
smaller (but still statistically significant) decreases.
● Capture: Just under half (46%) of UK households say that on the last disposal
occasion they disposed of at least one material in the general rubbish bin that their
council collects as part of the kerbside recycling collection.
● Quality: 47% of households are putting at least one material in their recycling that is
not intended to be collected locally for recycling. Drinks cartons/tetra-pak and plastic
pots, tubs and trays are the two materials most frequently put out for recycling
kerbside despite the council not collecting them.
● Looking at both dimensions of capture and quality, similar to 2014, around a quarter
of households are ‘completely effective recyclers’, in that they neither place non-
targeted materials in their recycling collection, nor dispose of any items in the
general rubbish that could be put in the kerbside recycling. Conversely,
approximately three-quarters of households could improve their recycling
effectiveness in one or both of these respects.
● Across the UK, one-third of the population used a council food waste collection
service the last time they had food to dispose of. There is a large degree of variability
between nations in line with differences in coverage of food waste collection
services. In Wales where the vast majority of households have a service, 71% of
respondents claim to use the service.
● The breadth of issues identified as barriers to using a food waste collection service
suggests that improvements to both services and communications will be required
to encourage participation, especially to overcome perceived hygiene issues which
were cited as a barrier by a substantial proportion of non-users.
● More could be done to increase capture of food waste amongst existing users.
Between 7% and 13% of those who use their council food waste collection service
still claimed to use the general rubbish bin for a range of food types on the last
disposal occasion. This increases for items that are potentially more challenging to
dispose of such as food still in its packaging; only about half of users report using the
food waste service effectively for these items, with between 35% and 41% either
failing to take food out of its wrapping before placing it in the food waste collection
or saying they would use the general rubbish bin.
● For dry recycling, levels of uncertainty about what is and isn’t collected locally for
recycling are still high. Around four in five households are unsure about which
container to put at least one material in. This is important because, as confidence
about what can and can’t be recycled increases, so do levels of recycling (although,
WRAP – 3Rs recycling knowledge, attitudes and reported behaviour survey 2015 2
once there is a base level of confidence, there is a correlation between increased
confidence and increased likelihood of people putting material in their recycling that
is not intended to be collected locally for recycling).
● Those who are confident about what can and can’t be recycled are much more likely
to say they have received information about the kerbside collection in the past year.
56% of those who say they are ‘very confident’ say they received information
compared to just 23% who are ’50:50’ and 17% of those who are ‘not very’ or ‘not at
all confident’.
● By extension, there is a strong relationship between reported receipt of information
on the kerbside collection and levels of effective recycling – 56% of those who
correctly recycle 9+ materials say they received information (vs. 36% and 22% of
those correctly recycling 1-2 materials and 0 materials, respectively).
● There is a significant decrease in the proportion of respondents reporting that they
received information in the past year. Just over half (55%) said that they received
information on the kerbside collection in 2014, compared to 42% this year.
● There is no consensus among householders on the right thing to do with tops, lids
and trigger sprays. A large minority (between 32% and 45%) are dissuaded from
recycling materials by the perceived need to do something and /or a lack of clarity
about what is required.
● Similarly, there is no consensus about whether householders are required to wash,
rinse or clean out materials prior to recycling. Actual or perceived cleaning
requirements also cause a large minority (41%) of households to not recycle certain
materials, suggesting that councils communicating minimum requirements may
encourage greater capture.
● Age has a significant bearing on self-reported recycling across materials. Rates of
recycling paper, card, cans/tins, aerosols and foil all increase in line with age.

WRAP – 3Rs recycling knowledge, attitudes and reported behaviour survey 2015 3
Contents
Introduction .................................................................................................................................... 4
Key Findings .................................................................................................................................... 5
1.0 Levels of dry recycling across the UK .............................................................................. 5
2.0 Opportunities to increase capture and improve quality ............................................. 6
2.1 Not recycling materials targeted for collection at kerbside............................. 7
2.2 Keeping non-targeted materials out of the dry recycling ................................ 7
3.0 Increasing effective dry recycling .................................................................................... 9
4.0 Food waste recycling ....................................................................................................... 10
4.1 Participation .......................................................................................................... 10
4.2 Capture .................................................................................................................. 13
5.0 Levels of confidence ........................................................................................................ 14
5.1 Confidence as a predictor of effective dry recycling ....................................... 16
6.0 Knowledge of recycling collection services .................................................................. 17
7.0 Lids, tops and rinsing out ............................................................................................... 18
8.0 Communications .............................................................................................................. 21
8.1 Receiving information ......................................................................................... 21
8.2 Searching for information................................................................................... 23

WRAP – 3Rs recycling knowledge, attitudes and reported behaviour survey 2015 4
Introduction
The 3Rs survey has been a staple of WRAP’s research portfolio for nearly a decade,
initially focusing on recycling (the Recycle Now survey) and expanding in recent years to
also cover reuse and repair (the 3Rs). This report presents key highlights from the
recycling section of the 2015 3Rs survey that have implications for recycling policy and
practice.
Methodology
The survey was undertaken online between 27th February and 13th March 2015 by Icaro.
Respondents were part of online panels1 across the four UK nations.
A total of 4,512 interviews were completed with sample sizes in each of the four nations
as follows: England (1,810), Scotland (1,101), Wales (1,101) and Northern Ireland (500).
The UK sample overall is representative of the target audience, i.e. adults aged 18+ who
passed the initial filter of being at least jointly responsible for waste and recycling in the
household. Nationally representative quotas were set on age within gender, region
within nation and work status to ensure a representative sample were given the
opportunity to answer this filter question.
To achieve the overall UK sample, the samples from each of the four nations were
combined. Using the English sample as a reference point, the other three nations were
weighted in line with their proportion of the UK population as follows: England (83.0%),
Scotland (8.8%), Wales (5.2%) and Northern Ireland (3%). The overall ‘effective base’ for
the UK, once this weighting is taken into account, is 2,169.
Question design and use of local authority scheme data
For key behavioural questions, each respondent’s answers to the survey were compared
with their known kerbside recycling provision, so that claimed behaviour, knowledge
and attitudes could be understood in the context of the services that respondents have
access to. The data matching process was as follows:
1 This is not a longitudinal study where a single cohort is tracked over time. The researchers aim to have a fresh sample each
wave to reduce priming. Panellists who complete the survey are prevented from doing so again in the following wave, but may
participate in subsequent waves.
WRAP – 3Rs recycling knowledge, attitudes and reported behaviour survey 2015 5
● Respondents’ postcodes were used to identify their local authority and their kerbside
recycling provision (using a database of all UK council schemes held by WRAP, and
updated annually)2.
● Respondents’ survey answers were then compared with the service data across 12
material streams/materials3. Some respondents were excluded from the analysis for
each material4
● The results of the data matching exercise apply to England, Wales, Scotland and
Northern Ireland. The results give 3,785 valid, matched, records. When this is
weighted in line with the distribution of the population across the UK the “effective
matched base” is 1,892.
2. Key findings
1.0 Levels of dry recycling across the UK
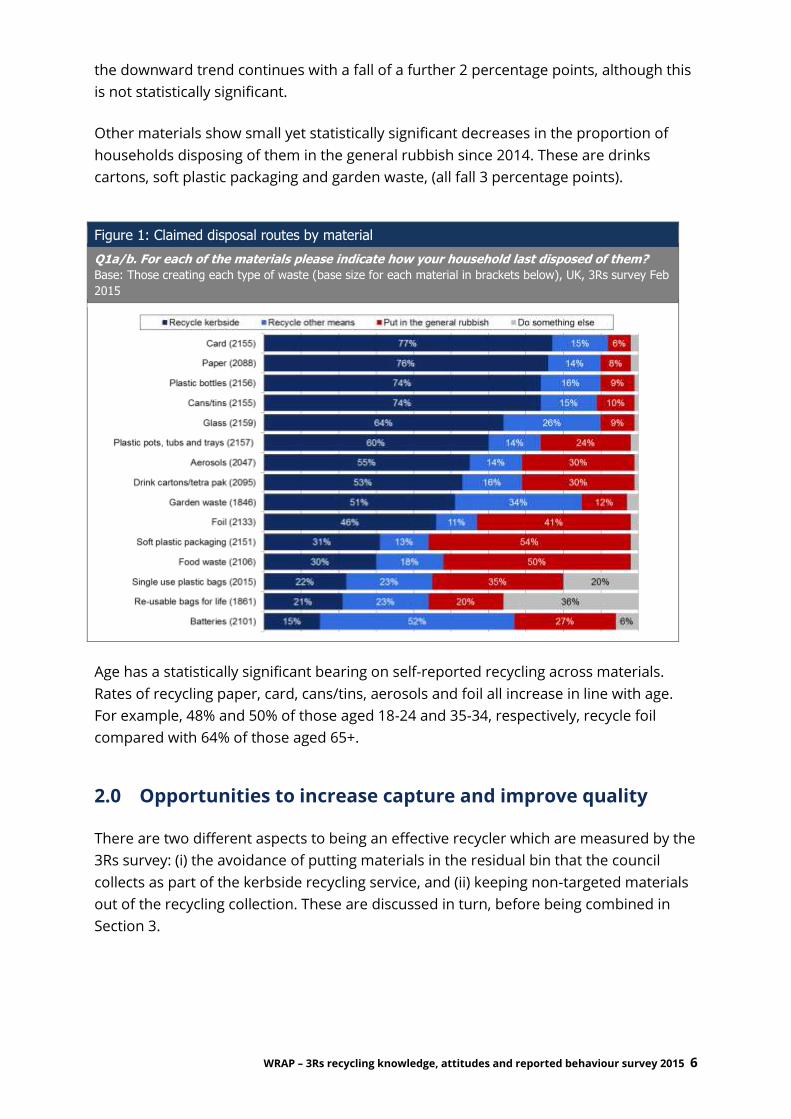
Claimed levels of recycling are high across a range of materials (Figure 1). When
recycling at kerbside as well as by other means (such as at HWRCs and communal
facilities at flats) are taken into account, four materials were recycled ‘last time’ 5 by 90%
or more of householders: cardboard (92%), paper (90%), plastic bottles (90%) and glass
(90%).
A high proportion of some materials are still disposed of in the general rubbish –
particularly soft plastic packaging6 (54% of respondents disposed of this in the general
rubbish), food waste (50%) and foil (41%). Sizeable proportions also dispose of aerosols
(30%) and food/drink cartons (30%) in the general rubbish.
For many materials, there has been no significant change in disposal routes since 2014.
For others, however, there have been some statistically significant changes.
Between the 2013 and 2014 waves, plastic pots, tubs and trays showed a reduction of 8
percentage points in households disposing of these in the general rubbish. This year,
2 NOTE: The database is updated annually. There are margins of error within the population survey and the council survey.
Postcodes also do not align precisely with council boundaries. Therefore, the results which draw on the matching exercise
should be viewed as indicative rather than absolute. 3 Paper; card; glass; cans and tins; plastic bottles; plastic pots, tubs and trays; food and drink cartons; batteries; foil; carrier
bags; aerosols; food waste 4 Respondents who stated that they did not generate a particular waste were not included in analysis for that material. Those
living in a council area served by what is termed, for the purposes of the project, a “partial collection” were also excluded (i.e. in
cases where local authorities do not offer a collection of that material to all households it is not known whether a respondent
receives that collection or not). Respondents living in flats or tenements were excluded due to the high level of variability seen
in recycling provision at these types of dwellings. 5 The question was “For each of the items please indicate how your household last disposed of them?” This was felt by the
researchers to be better measure of recycling behaviour than asking respondents to consider their general recycling practices 6 Defined as “Soft plastic packaging (e.g. bread and cereal bags, magazine wrappers and toilet paper packaging)“
WRAP – 3Rs recycling knowledge, attitudes and reported behaviour survey 2015 6
the downward trend continues with a fall of a further 2 percentage points, although this
is not statistically significant.
Other materials show small yet statistically significant decreases in the proportion of
households disposing of them in the general rubbish since 2014. These are drinks
cartons, soft plastic packaging and garden waste, (all fall 3 percentage points).
Figure 1: Claimed disposal routes by material
Q1a/b. For each of the materials please indicate how your household last disposed of them?
Base: Those creating each type of waste (base size for each material in brackets below), UK, 3Rs survey Feb
2015
Age has a statistically significant bearing on self-reported recycling across materials.
Rates of recycling paper, card, cans/tins, aerosols and foil all increase in line with age.
For example, 48% and 50% of those aged 18-24 and 35-34, respectively, recycle foil
compared with 64% of those aged 65+.
2.0 Opportunities to increase capture and improve quality
There are two different aspects to being an effective recycler which are measured by the
3Rs survey: (i) the avoidance of putting materials in the residual bin that the council
collects as part of the kerbside recycling service, and (ii) keeping non-targeted materials
out of the recycling collection. These are discussed in turn, before being combined in
Section 3.

WRAP – 3Rs recycling knowledge, attitudes and reported behaviour survey 2015 7
2.1 Not recycling materials targeted for collection at kerbside
Nearly half of households (46%) could divert one or more materials from their residual
bin into their recycling bin, as these materials are collected for recycling in their local
area (Figure 2). Just under a quarter of households (24%) put a single material in the
general rubbish bin that is recyclable kerbside, while a further 15% dispose of 2-3
materials that could be recycled kerbside. A small minority of 7% are a particularly low
performing group – disposing of 4+ materials in the rubbish bin that can be recycled
kerbside in their area.
By contrast, over half (54%) of householders do not report disposing of any materials in
the general rubbish that could be collected kerbside for recycling. In simple terms, this
suggests that just over half of the population are using the services they are provided
with to recycle as much as possible7 and just under half are not.
2.2 Keeping non-targeted materials out of the dry recycling
Drinks cartons/Tetrapaks and plastic pots tubs and trays are the two materials most
frequently put in the recycling container despite the council not collecting them in the
kerbside collection service. Nearly six in 10 households8 (58%) say that they put their last
7 According to what they did the last time they disposed of each material
8 Of those living in houses
Figure 2: Items being put in the residual bin that could be collected kerbside for recycling
Looking at the materials that households say they currently put in the bin and comparing this to what materials their council recycles at kerbside, this graph shows the % of households who are putting items in the bin that they could recycle kerbside. For example, 7% of households are putting 4 or more materials in the bin that are collected kerbside for recycling.
Base: Those creating each type of waste (excluding partial collections and flat dwellers), UK weighted records (1,892), 3Rs survey Feb 2015
WRAP – 3Rs recycling knowledge, attitudes and reported behaviour survey 2015 8
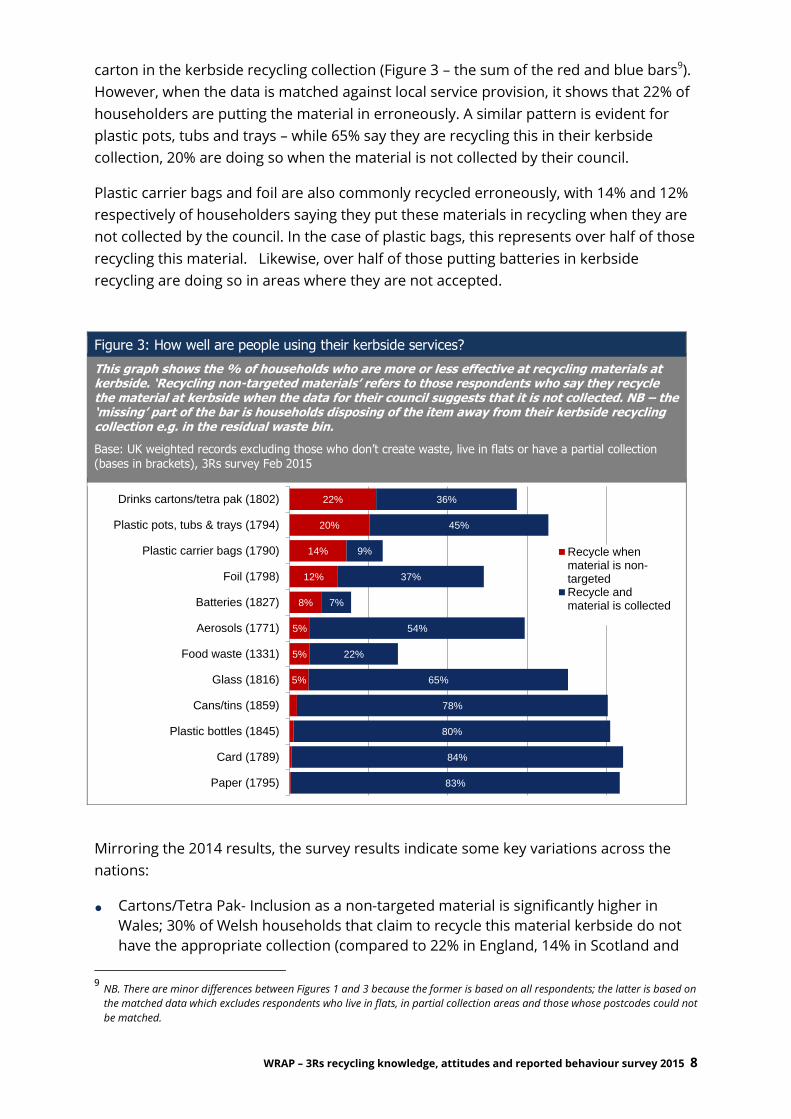
carton in the kerbside recycling collection (Figure 3 – the sum of the red and blue bars9).
However, when the data is matched against local service provision, it shows that 22% of
householders are putting the material in erroneously. A similar pattern is evident for
plastic pots, tubs and trays – while 65% say they are recycling this in their kerbside
collection, 20% are doing so when the material is not collected by their council.
Plastic carrier bags and foil are also commonly recycled erroneously, with 14% and 12%
respectively of householders saying they put these materials in recycling when they are
not collected by the council. In the case of plastic bags, this represents over half of those
recycling this material. Likewise, over half of those putting batteries in kerbside
recycling are doing so in areas where they are not accepted.
Mirroring the 2014 results, the survey results indicate some key variations across the
nations:
● Cartons/Tetra Pak- Inclusion as a non-targeted material is significantly higher in
Wales; 30% of Welsh households that claim to recycle this material kerbside do not
have the appropriate collection (compared to 22% in England, 14% in Scotland and
9 NB. There are minor differences between Figures 1 and 3 because the former is based on all respondents; the latter is based on
the matched data which excludes respondents who live in flats, in partial collection areas and those whose postcodes could not
be matched.
Figure 3: How well are people using their kerbside services?
This graph shows the % of households who are more or less effective at recycling materials at kerbside. ‘Recycling non-targeted materials’ refers to those respondents who say they recycle the material at kerbside when the data for their council suggests that it is not collected. NB – the ‘missing’ part of the bar is households disposing of the item away from their kerbside recycling collection e.g. in the residual waste bin.
Base: UK weighted records excluding those who don’t create waste, live in flats or have a partial collection (bases in brackets), 3Rs survey Feb 2015
5%
5%
5%
8%
12%
14%
20%
22%
83%
84%
80%
78%
65%
22%
54%
7%
37%
9%
45%
36%
Paper (1795)
Card (1789)
Plastic bottles (1845)
Cans/tins (1859)
Glass (1816)
Food waste (1331)
Aerosols (1771)
Batteries (1827)
Foil (1798)
Plastic carrier bags (1790)
Plastic pots, tubs & trays (1794)
Drinks cartons/tetra pak (1802)
Recycle whenmaterial is non-targetedRecycle andmaterial is collected

WRAP – 3Rs recycling knowledge, attitudes and reported behaviour survey 2015 9
10% in Northern Ireland). This is an improvement, (12 percentage point decrease
from 2014). However, this is most likely due to the increased collection of this
material, (12 councils collect the material compared to seven in 2014) rather than the
public changing their behaviour because the same proportion recycled this material
kerbside as they did in 2014.
● Plastic pots, tubs and trays - By contrast, levels of contamination is lowest in Wales
(9%), compared to Northern Ireland (25%), Scotland (23%) and England (22%). Again,
this is likely to be due, at least partially, to higher levels of collection of this material
in Wales. 77% of respondents in Wales lived in areas where this material is accepted
for recycling, compared with 62% in Northern Ireland, 47% in Scotland and 55% in
England.
3.0 Increasing effective dry recycling
Further improvements in recycling performance will require action to increase the
capture of materials that are collected for recycling while, at the same time, ensuring
that this does not lead to increased levels of non-targeted materials (thereby reducing
quality). To establish current levels of performance, these two requirements – increasing
capture and improving quality - can be used to segment UK households (Figure 4).
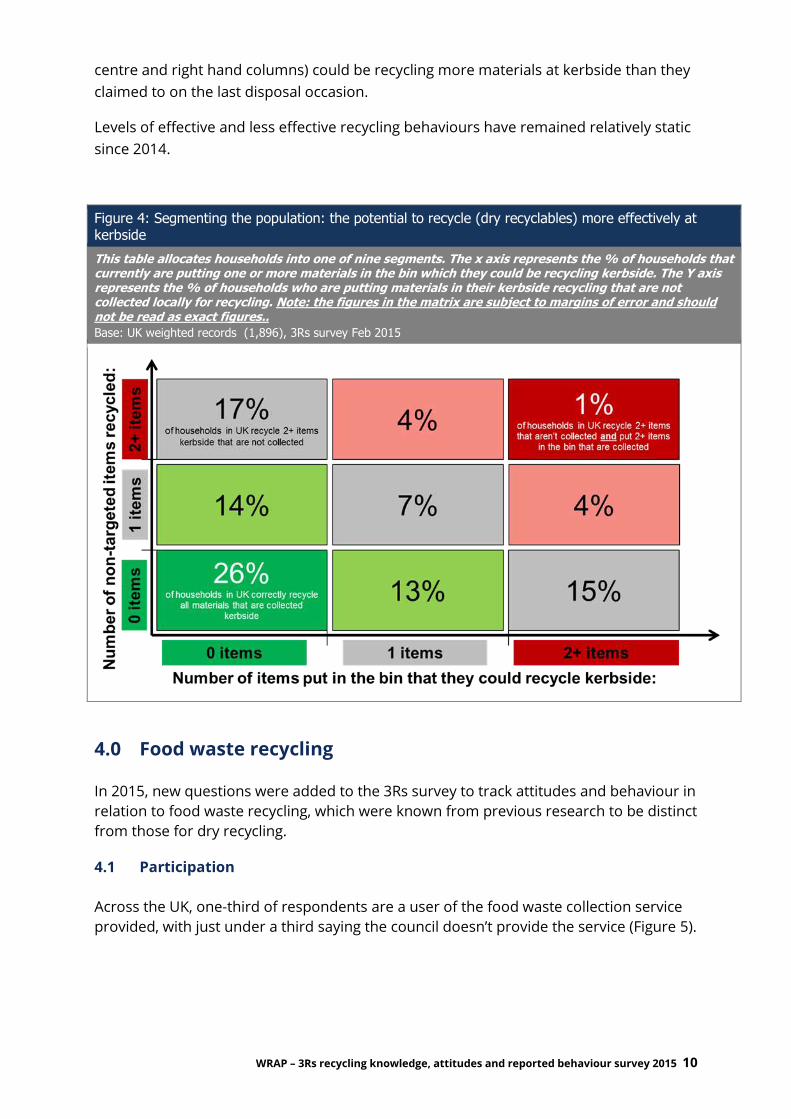
According to this segmentation, approximately a quarter of households are ‘highly
effective’ recyclers – they neither placed non-targeted materials in their dry kerbside
collection on the last disposal occasion nor did they put any materials in the general
waste bin that are collected for recycling by their council. However, by extension, this
means that approximately three quarters could be recycling more effectively in one or
more ways: either because they say they disposed of a material in the general waste bin
that they could recycle kerbside; or because they say they placed a material in the
kerbside recycling that is not collected locally for recycling; or both.
For example, and taking the bottom row first (and in particular the middle and right
hand boxes), these two segments combined show that circa 28% of households did not
place non-targeted materials in their recycling but could be recycling more (i.e. by
recycling one or more materials that are collected at kerbside which they put in the
general waste bin on the last disposal occasion) 10. By contrast, and looking at the left
hand column (and in particular the central and upper boxes) a similar proportion (circa
31%) could be recycling more effectively by not placing one or more non-targeted
materials in their kerbside recycling collection.
Overall, half of all households (circa 47%) say they placed at least one non-targeted
material in their recycling (sum of the top two rows) whereas circa 44% (the sum of the
10 Survey respondents’ self-reported behaviours were matched against actual service provision by councils using respondents’
postcodes and a WRAP database of the materials collected by each council. The database is updated annually, primarily via a
survey with every council in the UK. There are margins of error within the population survey and the council survey.
Postcodes also do not align precisely with council boundaries. Therefore these proportions should be viewed as indicative
rather than absolute.
WRAP – 3Rs recycling knowledge, attitudes and reported behaviour survey 2015 10
centre and right hand columns) could be recycling more materials at kerbside than they
claimed to on the last disposal occasion.
Levels of effective and less effective recycling behaviours have remained relatively static
since 2014.
4.0 Food waste recycling
In 2015, new questions were added to the 3Rs survey to track attitudes and behaviour in
relation to food waste recycling, which were known from previous research to be distinct
from those for dry recycling.
4.1 Participation
Across the UK, one-third of respondents are a user of the food waste collection service
provided, with just under a third saying the council doesn’t provide the service (Figure 5).
Figure 4: Segmenting the population: the potential to recycle (dry recyclables) more effectively at kerbside
This table allocates households into one of nine segments. The x axis represents the % of households that currently are putting one or more materials in the bin which they could be recycling kerbside. The Y axis represents the % of households who are putting materials in their kerbside recycling that are not collected locally for recycling. Note: the figures in the matrix are subject to margins of error and should not be read as exact figures..
Base: UK weighted records (1,896), 3Rs survey Feb 2015

WRAP – 3Rs recycling knowledge, attitudes and reported behaviour survey 2015 11
Figure 5: Profile of food waste collection users
Q1b + Q2a – What type of food waste user are they? (1b – how did you last dispose of food waste?; 2a – have you ever used your council’s food waste collection service?)
Base: UK weighted records excluding those who don’t create food waste, live in flats or have a partial collection (bases in brackets), 3Rs survey Feb 2015
There is a large degree of variability between nations, particularly in Wales where 71% of
respondents claim to use the service, compared with less than half of respondents in
each of the other nations.
User profiles are also associated with a number of demographic differences:
● Gender: Non-users tend to have a higher proportion of women – they account for
60% of non-users (vs. 51% of users and 54% of lapsed users).
● Age: Lapsed users have a younger age profile – 21% are aged 18-24 and 32% are 35-
34 (vs. 9% and 16%, respectively, of users). Users have a slightly older profile (38%
are aged 55+ vs. 15% of lapsed users and 33% of non-users).
● Dwelling: 24% of users live in detached homes (vs. 18% of lapsed users and 12% of
non-users). Both lapsed and non-users are more likely than users to live in flats (20%
and 20%, respectively, vs. 11% of users).
● Young children in home: Lapsed users are much more likely to have young children
at home – 22% have a child aged 0-5 (vs 11% of users) and 22% have a child aged 5-9
(vs. 14% of users).
Respondents who said that they didn’t use the food waste collection service offered by
their council were given a list of potential barriers and asked to select four that most
applied to them (Figure 6). From these they could then select one primary barrier.
WRAP – 3Rs recycling knowledge, attitudes and reported behaviour survey 2015 12
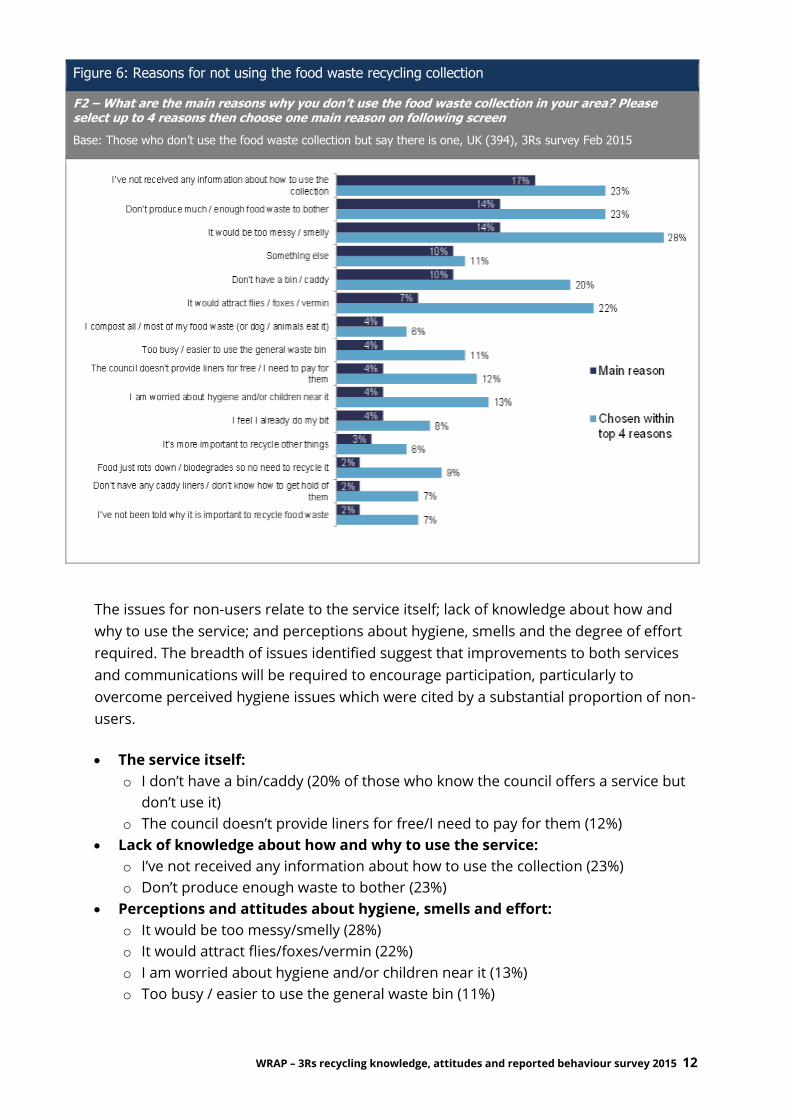
Figure 6: Reasons for not using the food waste recycling collection
F2 – What are the main reasons why you don’t use the food waste collection in your area? Please select up to 4 reasons then choose one main reason on following screen
Base: Those who don’t use the food waste collection but say there is one, UK (394), 3Rs survey Feb 2015
The issues for non-users relate to the service itself; lack of knowledge about how and
why to use the service; and perceptions about hygiene, smells and the degree of effort
required. The breadth of issues identified suggest that improvements to both services
and communications will be required to encourage participation, particularly to
overcome perceived hygiene issues which were cited by a substantial proportion of non-
users.
The service itself:
o I don’t have a bin/caddy (20% of those who know the council offers a service but
don’t use it)
o The council doesn’t provide liners for free/I need to pay for them (12%)
Lack of knowledge about how and why to use the service:
o I’ve not received any information about how to use the collection (23%)
o Don’t produce enough waste to bother (23%)
Perceptions and attitudes about hygiene, smells and effort:
o It would be too messy/smelly (28%)
o It would attract flies/foxes/vermin (22%)
o I am worried about hygiene and/or children near it (13%)
o Too busy / easier to use the general waste bin (11%)
WRAP – 3Rs recycling knowledge, attitudes and reported behaviour survey 2015 13
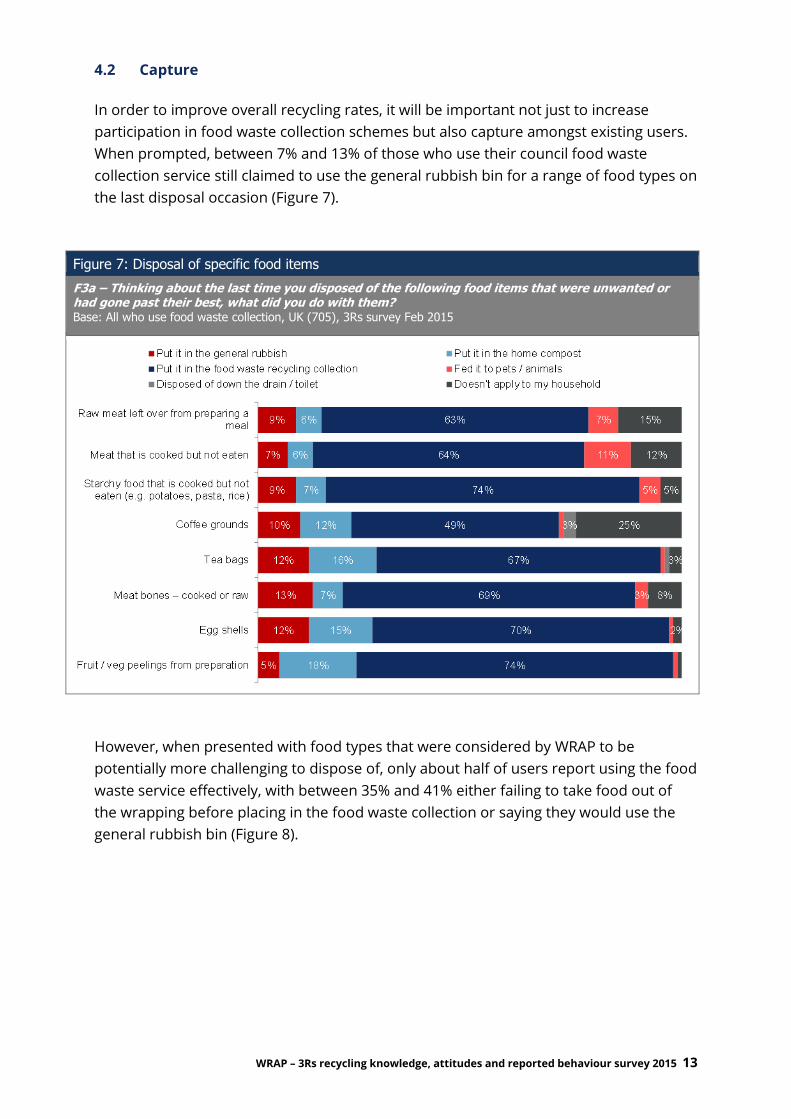
4.2 Capture
In order to improve overall recycling rates, it will be important not just to increase
participation in food waste collection schemes but also capture amongst existing users.
When prompted, between 7% and 13% of those who use their council food waste
collection service still claimed to use the general rubbish bin for a range of food types on
the last disposal occasion (Figure 7).
Figure 7: Disposal of specific food items
F3a – Thinking about the last time you disposed of the following food items that were unwanted or had gone past their best, what did you do with them? Base: All who use food waste collection, UK (705), 3Rs survey Feb 2015
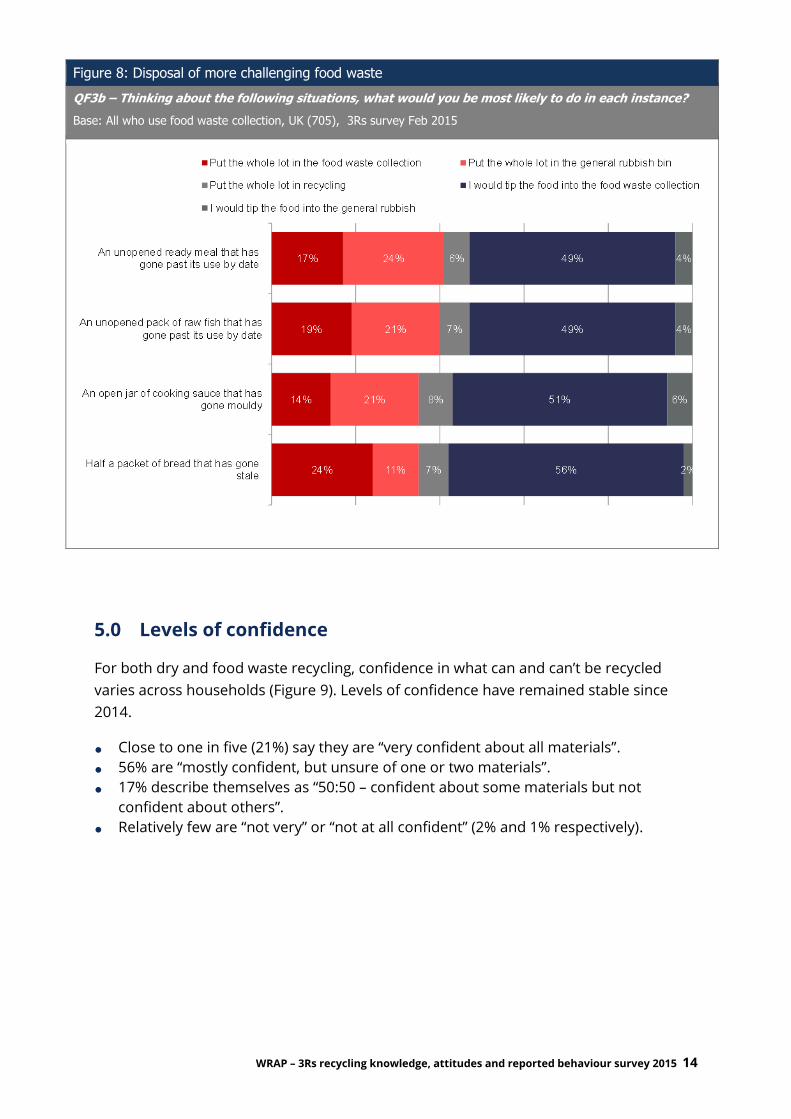
However, when presented with food types that were considered by WRAP to be
potentially more challenging to dispose of, only about half of users report using the food
waste service effectively, with between 35% and 41% either failing to take food out of
the wrapping before placing in the food waste collection or saying they would use the
general rubbish bin (Figure 8).
WRAP – 3Rs recycling knowledge, attitudes and reported behaviour survey 2015 14
Figure 8: Disposal of more challenging food waste
QF3b – Thinking about the following situations, what would you be most likely to do in each instance?
Base: All who use food waste collection, UK (705), 3Rs survey Feb 2015
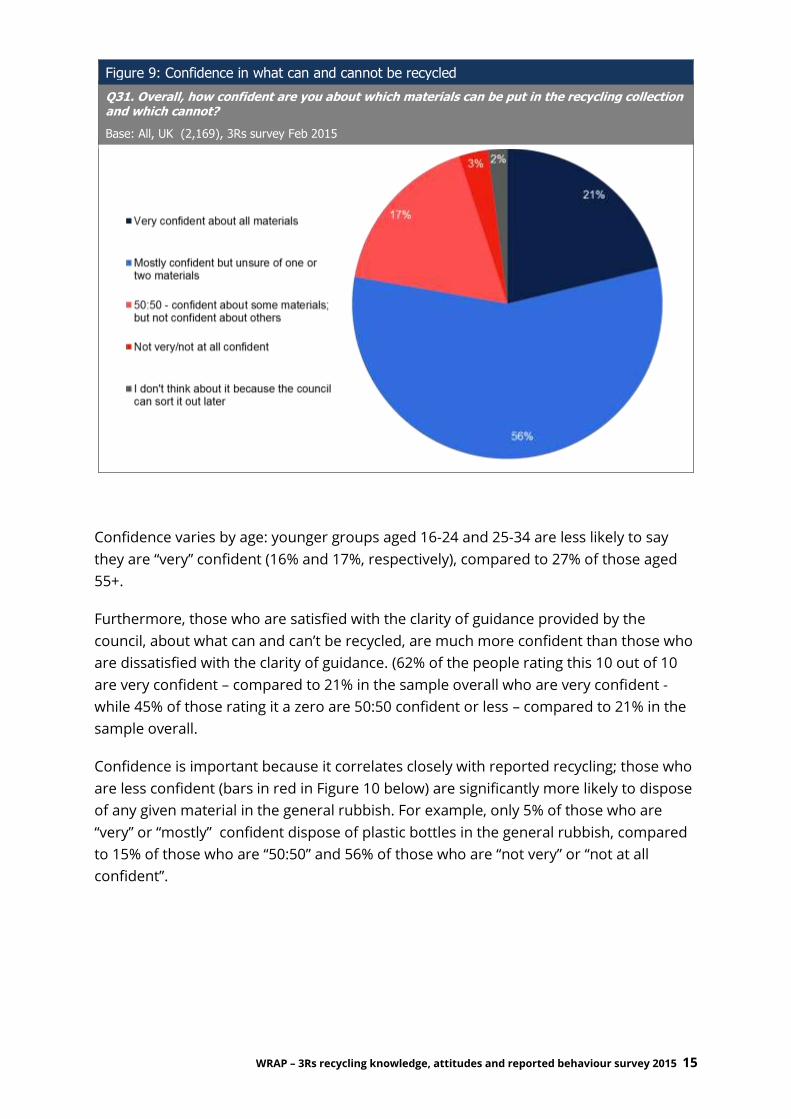
5.0 Levels of confidence
For both dry and food waste recycling, confidence in what can and can’t be recycled
varies across households (Figure 9). Levels of confidence have remained stable since
2014.
● Close to one in five (21%) say they are “very confident about all materials”.
● 56% are “mostly confident, but unsure of one or two materials”.
● 17% describe themselves as “50:50 – confident about some materials but not
confident about others”.
● Relatively few are “not very” or “not at all confident” (2% and 1% respectively).
WRAP – 3Rs recycling knowledge, attitudes and reported behaviour survey 2015 15
Figure 9: Confidence in what can and cannot be recycled
Q31. Overall, how confident are you about which materials can be put in the recycling collection and which cannot?
Base: All, UK (2,169), 3Rs survey Feb 2015
Confidence varies by age: younger groups aged 16-24 and 25-34 are less likely to say
they are “very” confident (16% and 17%, respectively), compared to 27% of those aged
55+.
Furthermore, those who are satisfied with the clarity of guidance provided by the
council, about what can and can’t be recycled, are much more confident than those who
are dissatisfied with the clarity of guidance. (62% of the people rating this 10 out of 10
are very confident – compared to 21% in the sample overall who are very confident -
while 45% of those rating it a zero are 50:50 confident or less – compared to 21% in the
sample overall.
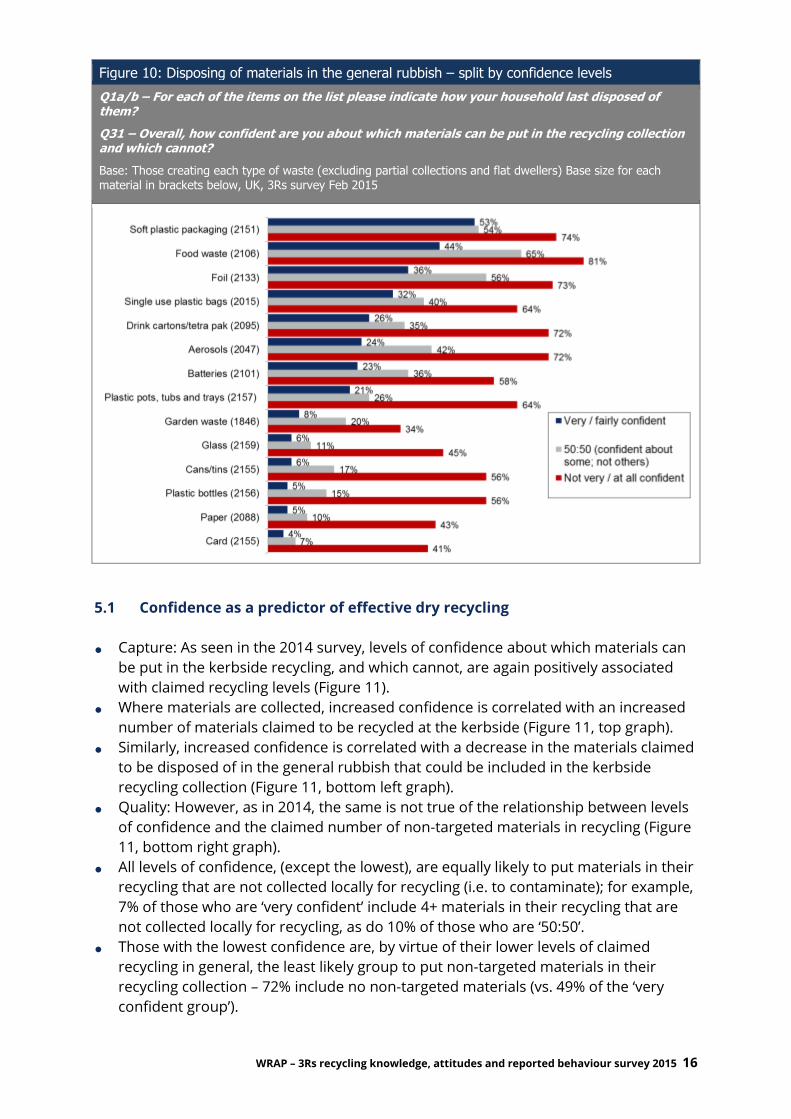
Confidence is important because it correlates closely with reported recycling; those who
are less confident (bars in red in Figure 10 below) are significantly more likely to dispose
of any given material in the general rubbish. For example, only 5% of those who are
“very” or “mostly” confident dispose of plastic bottles in the general rubbish, compared
to 15% of those who are “50:50” and 56% of those who are “not very” or “not at all
confident”.
WRAP – 3Rs recycling knowledge, attitudes and reported behaviour survey 2015 16
Figure 10: Disposing of materials in the general rubbish – split by confidence levels
Q1a/b – For each of the items on the list please indicate how your household last disposed of them?
Q31 – Overall, how confident are you about which materials can be put in the recycling collection and which cannot?
Base: Those creating each type of waste (excluding partial collections and flat dwellers) Base size for each material in brackets below, UK, 3Rs survey Feb 2015
5.1 Confidence as a predictor of effective dry recycling
● Capture: As seen in the 2014 survey, levels of confidence about which materials can
be put in the kerbside recycling, and which cannot, are again positively associated
with claimed recycling levels (Figure 11).
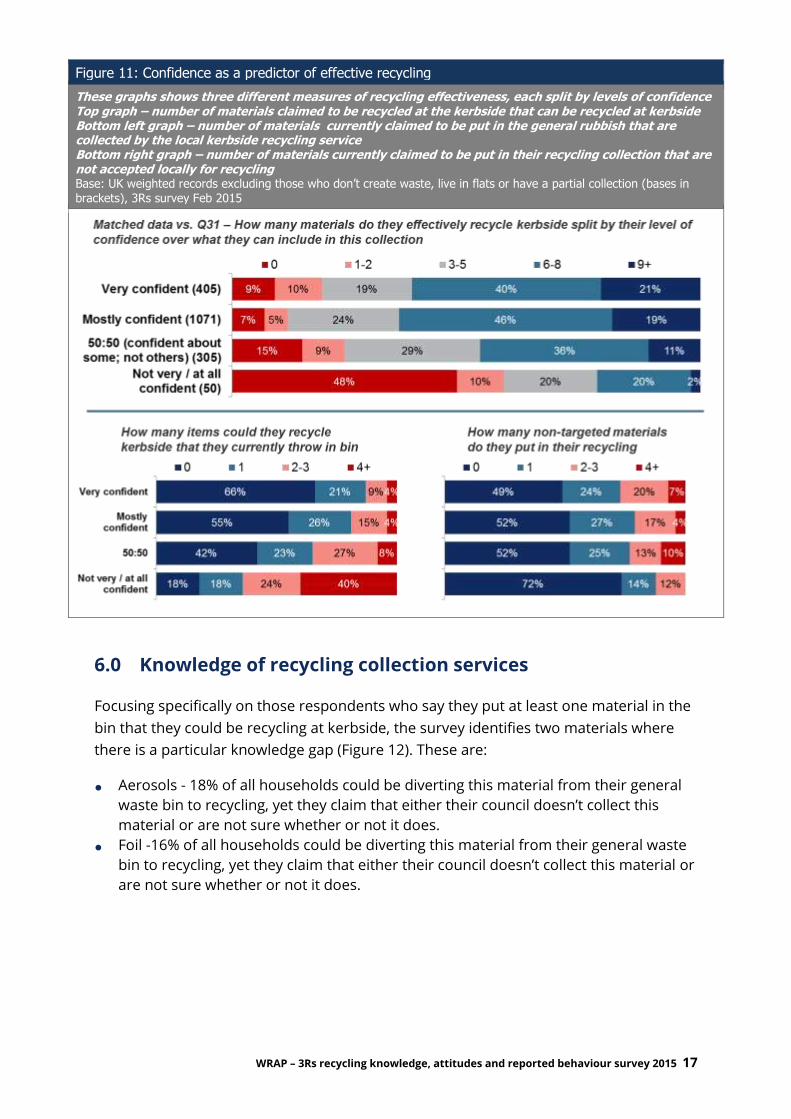
● Where materials are collected, increased confidence is correlated with an increased
number of materials claimed to be recycled at the kerbside (Figure 11, top graph).
● Similarly, increased confidence is correlated with a decrease in the materials claimed
to be disposed of in the general rubbish that could be included in the kerbside
recycling collection (Figure 11, bottom left graph).
● Quality: However, as in 2014, the same is not true of the relationship between levels
of confidence and the claimed number of non-targeted materials in recycling (Figure
11, bottom right graph).
● All levels of confidence, (except the lowest), are equally likely to put materials in their
recycling that are not collected locally for recycling (i.e. to contaminate); for example,
7% of those who are ‘very confident’ include 4+ materials in their recycling that are
not collected locally for recycling, as do 10% of those who are ‘50:50’.
● Those with the lowest confidence are, by virtue of their lower levels of claimed
recycling in general, the least likely group to put non-targeted materials in their
recycling collection – 72% include no non-targeted materials (vs. 49% of the ‘very
confident group’).
WRAP – 3Rs recycling knowledge, attitudes and reported behaviour survey 2015 17
Figure 11: Confidence as a predictor of effective recycling
These graphs shows three different measures of recycling effectiveness, each split by levels of confidence Top graph – number of materials claimed to be recycled at the kerbside that can be recycled at kerbside Bottom left graph – number of materials currently claimed to be put in the general rubbish that are
collected by the local kerbside recycling service Bottom right graph – number of materials currently claimed to be put in their recycling collection that are
not accepted locally for recycling Base: UK weighted records excluding those who don’t create waste, live in flats or have a partial collection (bases in brackets), 3Rs survey Feb 2015
6.0 Knowledge of recycling collection services
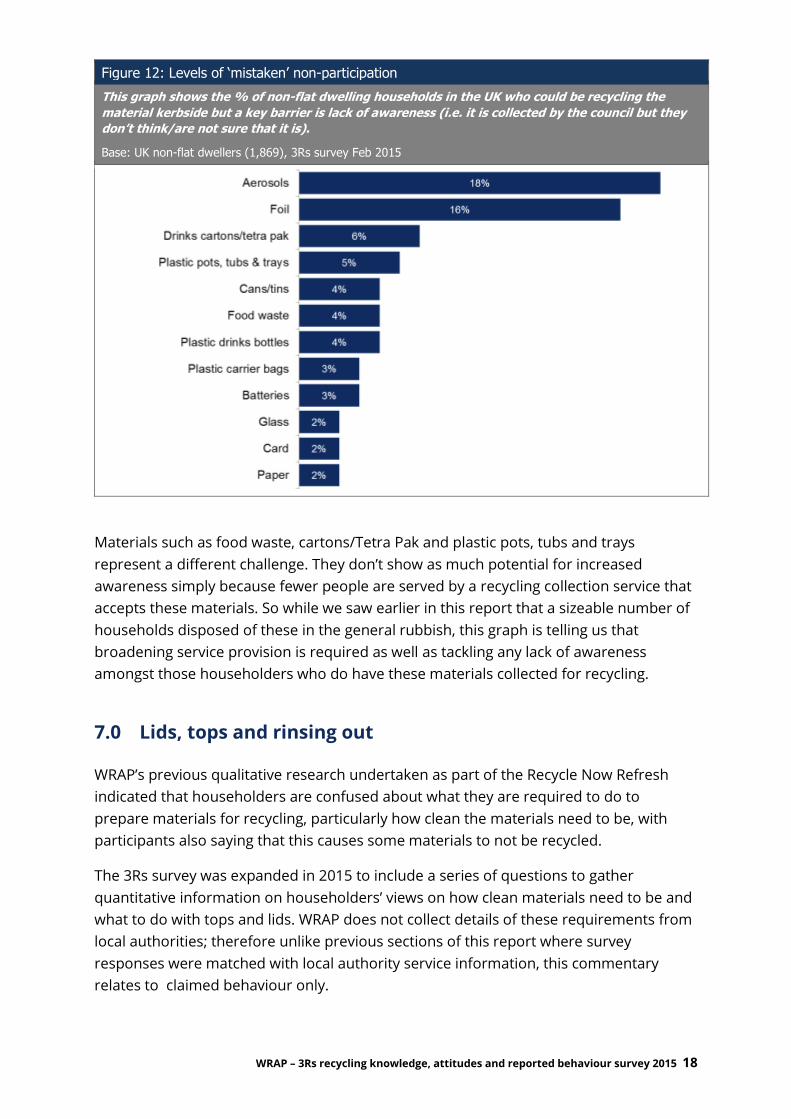
Focusing specifically on those respondents who say they put at least one material in the
bin that they could be recycling at kerbside, the survey identifies two materials where
there is a particular knowledge gap (Figure 12). These are:
● Aerosols - 18% of all households could be diverting this material from their general
waste bin to recycling, yet they claim that either their council doesn’t collect this
material or are not sure whether or not it does.
● Foil -16% of all households could be diverting this material from their general waste
bin to recycling, yet they claim that either their council doesn’t collect this material or
are not sure whether or not it does.
WRAP – 3Rs recycling knowledge, attitudes and reported behaviour survey 2015 18
Figure 12: Levels of ‘mistaken’ non-participation
This graph shows the % of non-flat dwelling households in the UK who could be recycling the
material kerbside but a key barrier is lack of awareness (i.e. it is collected by the council but they
don’t think/are not sure that it is).
Base: UK non-flat dwellers (1,869), 3Rs survey Feb 2015
Materials such as food waste, cartons/Tetra Pak and plastic pots, tubs and trays
represent a different challenge. They don’t show as much potential for increased
awareness simply because fewer people are served by a recycling collection service that
accepts these materials. So while we saw earlier in this report that a sizeable number of
households disposed of these in the general rubbish, this graph is telling us that
broadening service provision is required as well as tackling any lack of awareness
amongst those householders who do have these materials collected for recycling.
7.0 Lids, tops and rinsing out
WRAP’s previous qualitative research undertaken as part of the Recycle Now Refresh
indicated that householders are confused about what they are required to do to
prepare materials for recycling, particularly how clean the materials need to be, with
participants also saying that this causes some materials to not be recycled.
The 3Rs survey was expanded in 2015 to include a series of questions to gather
quantitative information on householders’ views on how clean materials need to be and
what to do with tops and lids. WRAP does not collect details of these requirements from
local authorities; therefore unlike previous sections of this report where survey
responses were matched with local authority service information, this commentary
relates to claimed behaviour only.
WRAP – 3Rs recycling knowledge, attitudes and reported behaviour survey 2015 19
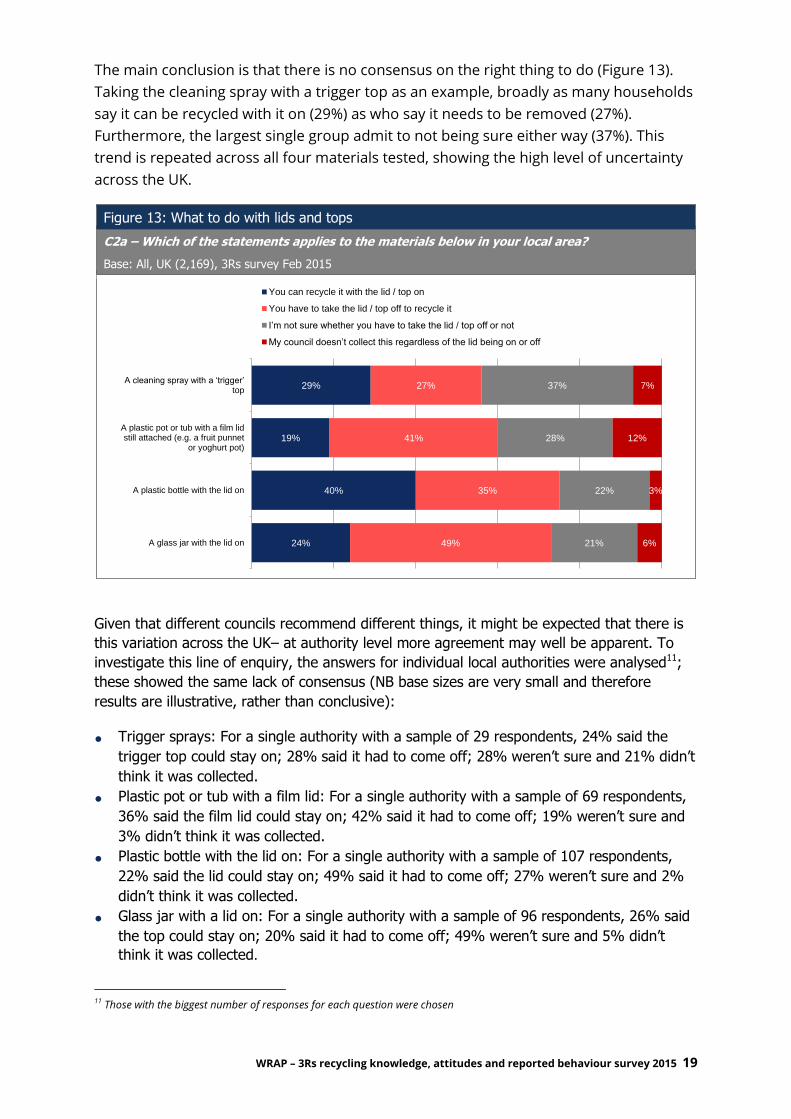
The main conclusion is that there is no consensus on the right thing to do (Figure 13).
Taking the cleaning spray with a trigger top as an example, broadly as many households
say it can be recycled with it on (29%) as who say it needs to be removed (27%).
Furthermore, the largest single group admit to not being sure either way (37%). This
trend is repeated across all four materials tested, showing the high level of uncertainty
across the UK.
Figure 13: What to do with lids and tops
C2a – Which of the statements applies to the materials below in your local area?
Base: All, UK (2,169), 3Rs survey Feb 2015
Given that different councils recommend different things, it might be expected that there is
this variation across the UK– at authority level more agreement may well be apparent. To
investigate this line of enquiry, the answers for individual local authorities were analysed11;
these showed the same lack of consensus (NB base sizes are very small and therefore
results are illustrative, rather than conclusive):
● Trigger sprays: For a single authority with a sample of 29 respondents, 24% said the
trigger top could stay on; 28% said it had to come off; 28% weren’t sure and 21% didn’t
think it was collected.
● Plastic pot or tub with a film lid: For a single authority with a sample of 69 respondents,
36% said the film lid could stay on; 42% said it had to come off; 19% weren’t sure and
3% didn’t think it was collected.
● Plastic bottle with the lid on: For a single authority with a sample of 107 respondents,
22% said the lid could stay on; 49% said it had to come off; 27% weren’t sure and 2%
didn’t think it was collected.
● Glass jar with a lid on: For a single authority with a sample of 96 respondents, 26% said
the top could stay on; 20% said it had to come off; 49% weren’t sure and 5% didn’t
think it was collected.
11 Those with the biggest number of responses for each question were chosen
24%
40%
19%
29%
49%
35%
41%
27%
21%
22%
28%
37%
6%
3%
12%
7%
A glass jar with the lid on
A plastic bottle with the lid on
A plastic pot or tub with a film lidstill attached (e.g. a fruit punnet
or yoghurt pot)
A cleaning spray with a ‘trigger’ top
You can recycle it with the lid / top on
You have to take the lid / top off to recycle it
I’m not sure whether you have to take the lid / top off or not
My council doesn’t collect this regardless of the lid being on or off

WRAP – 3Rs recycling knowledge, attitudes and reported behaviour survey 2015 20
A large minority claim to be discouraged to some extent from recycling these materials
because of the requirement to remove lids and tops or because of their uncertainty about
whether or not this is necessary (Figure 14).
Figure 14: Does the need to remove lids reduce recycling rates?
C2b – How often does the need to take the lid off (or the uncertainty of knowing if the lid needs to be removed) prevent you from recycling the item?
Base: Those thinking the lid needs to be removed or aren’t sure, UK (bases below), 3Rs survey Feb 2015
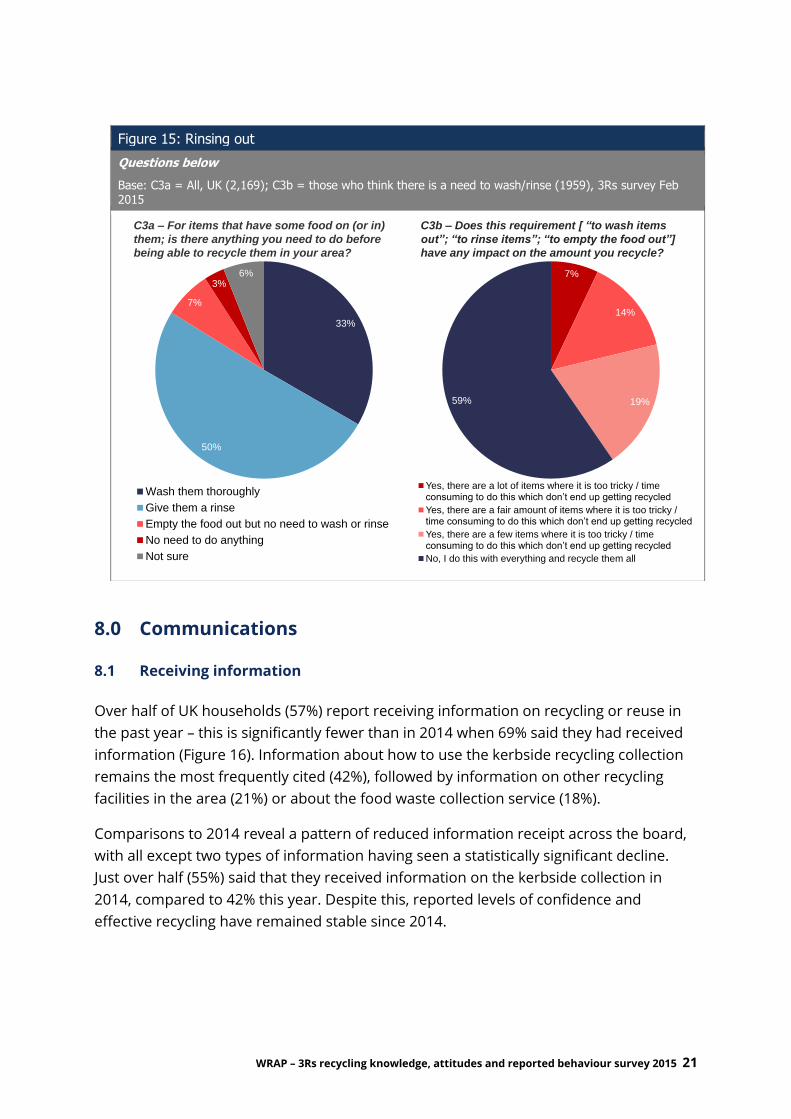
Rinsing materials generates slightly less variation in responses (Figure 15):
● Half the sample agree that materials need to be rinsed before recycling; 33% say it is necessary to wash things thoroughly; and
Just 3% of respondents claim nothing needs to be done with materials before recycling
– not even emptying the food out – but this small minority could contribute
disproportionally to levels of contamination if materials containing food are placed in dry
recycling collections.
41% claim to be discouraged to some extent from recycling these materials because of the
actual or perceived cleaning requirements (Figure 15 – C3b).
7%
7%
8%
8%
15%
16%
16%
16%
10%
12%
17%
21%
68%
64%
60%
55%
A glass jar with the lid on (1526)
A plastic bottle with the lid on(1245)
A plastic pot or tub with a film lidstill attached (e.g. a fruit punnet
or yoghurt pot) (1496)
A cleaning spray with a ‘trigger’ top (1397)
There are a lot of items like this which don’t end up getting recycled because of the need to remove the lid
There are a fair amount of items like this which don’t end up getting recycled because of the need to remove the lid
There are a few items like this which don’t end up getting recycled because of the need to remove the lid
No, I take the lid off all items like this and recycle them
WRAP – 3Rs recycling knowledge, attitudes and reported behaviour survey 2015 21
8.0 Communications
8.1 Receiving information
Over half of UK households (57%) report receiving information on recycling or reuse in
the past year – this is significantly fewer than in 2014 when 69% said they had received
information (Figure 16). Information about how to use the kerbside recycling collection
remains the most frequently cited (42%), followed by information on other recycling
facilities in the area (21%) or about the food waste collection service (18%).
Comparisons to 2014 reveal a pattern of reduced information receipt across the board,
with all except two types of information having seen a statistically significant decline.
Just over half (55%) said that they received information on the kerbside collection in
2014, compared to 42% this year. Despite this, reported levels of confidence and
effective recycling have remained stable since 2014.
Figure 15: Rinsing out
Questions below
Base: C3a = All, UK (2,169); C3b = those who think there is a need to wash/rinse (1959), 3Rs survey Feb 2015
33%
50%
7%
3%6%
Wash them thoroughly
Give them a rinse
Empty the food out but no need to wash or rinse
No need to do anything
Not sure
C3a – For items that have some food on (or in)
them; is there anything you need to do before
being able to recycle them in your area?
7%
14%
19%59%
Yes, there are a lot of items where it is too tricky / time consuming to do this which don’t end up getting recycled
Yes, there are a fair amount of items where it is too tricky / time consuming to do this which don’t end up getting recycled
Yes, there are a few items where it is too tricky / time consuming to do this which don’t end up getting recycled
No, I do this with everything and recycle them all
C3b – Does this requirement [ “to wash items
out”; “to rinse items”; “to empty the food out”]
have any impact on the amount you recycle?

WRAP – 3Rs recycling knowledge, attitudes and reported behaviour survey 2015 22
Figure 16: Receipt of information at home
Q5 – Do you recall receiving any of the following information at your home in the past year, e.g. in a leaflet or a council newsletter?
Base: All UK (2,176), 3Rs survey Feb 2014 NB. Statistically significant differences from the 2014 wave are shown in the red text boxes.
There are a number of important differences across sub-groups within the population.
For example:
● Age: there is a strong relationship between age and reported information receipt,
with older age groups reporting much higher levels of receipt of all information
types. For example, only around a third (32%) of those aged 65+ say they have not
received any information in the past year, compared to 52% of those aged 18-24.
● Dwelling: Those in flats are less likely to report having received information – those
in blocks of flats (57%) and those in converted houses (60%) are both far more likely
than those in terraces, semis or fully detached houses (40%) to say they have
received no forms of information.
There are a number of strong associations between receipt of information about how to
use the kerbside recycling collection and corresponding recycling behaviours. It should
be noted that these serve only to highlight an association between the variables - it is
not possible to demonstrate a causal link (i.e. receiving information causes e.g. correct
recycling):
● Confidence: Those who are confident about what can and can’t be recycled are
much more likely to say they have received information about the kerbside collection
in the past year. 56% of those who say they are ‘very confident’ say they received
information compared to just 23% who are ’50:50’ and 17% of those who are ‘not
very’ or ‘not at all confident’.
● Number of materials recycled correctly: there is a strong relationship between
reported receipt of information on the kerbside collection and levels of effective
43%
10%
13%
15%
16%
16%
18%
21%
42%
I’ve not received any information like this in the last year
How you can donate or dispose of unwanted or brokenelectrical items
How you can donate or dispose of clothing and textiles
How you can donate or dispose of bulky/large householditems
How to get recycling bags, boxes or bins
The benefits of using your recycling service, e.g. helps theenvironment; saves your council money
How to use your food waste collection or recycling service
What other recycling facilities are available in your area, e.g. the household waste recycling centre (the “tip”);
recycling banks
How to use your kerbside recycling collection, e.g. collection times/days; what you can and can’t recycle;
27% in 2014
55% in 2014
24% in 2014
23% in 2014
21% in 2014
19% in 2014
31% in 2014
WRAP – 3Rs recycling knowledge, attitudes and reported behaviour survey 2015 23
recycling – 56% of those who correctly recycle 9+ materials say they received
information (vs. 36% and 22% of those correctly recycling 1-2 materials and 0
materials, respectively).
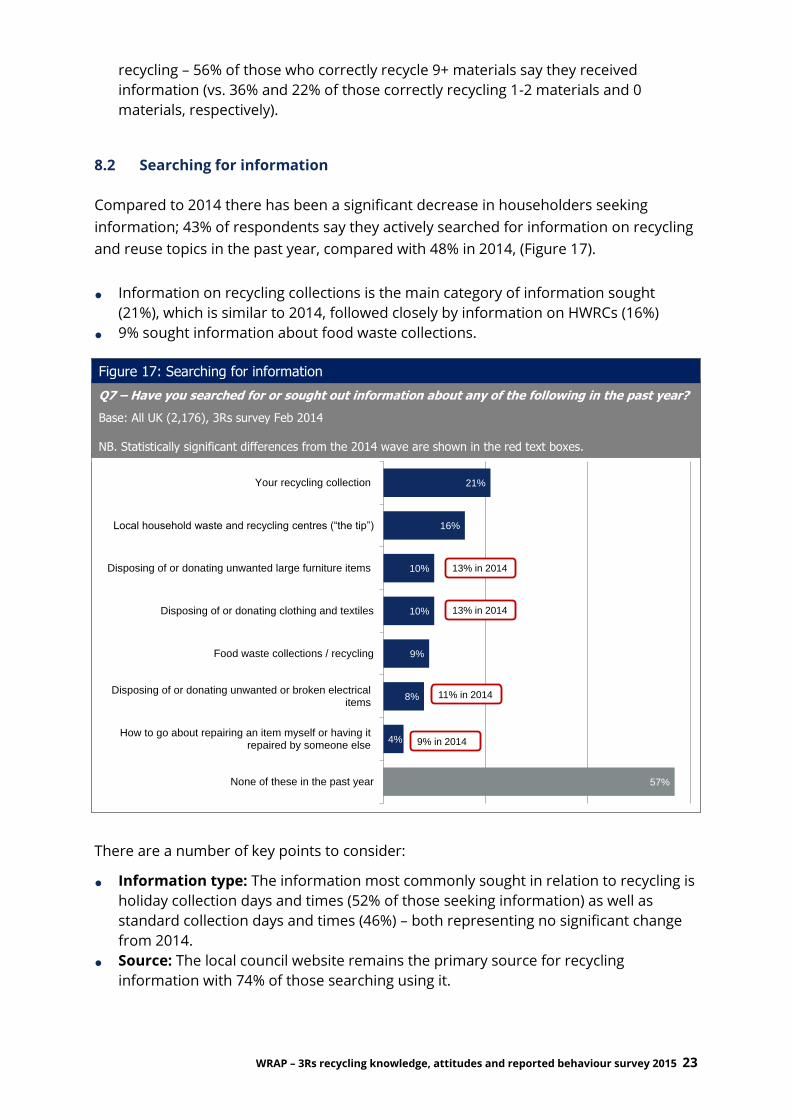
8.2 Searching for information
Compared to 2014 there has been a significant decrease in householders seeking
information; 43% of respondents say they actively searched for information on recycling
and reuse topics in the past year, compared with 48% in 2014, (Figure 17).
● Information on recycling collections is the main category of information sought
(21%), which is similar to 2014, followed closely by information on HWRCs (16%)
● 9% sought information about food waste collections.
Figure 17: Searching for information
Q7 – Have you searched for or sought out information about any of the following in the past year?
Base: All UK (2,176), 3Rs survey Feb 2014 NB. Statistically significant differences from the 2014 wave are shown in the red text boxes.
There are a number of key points to consider:
● Information type: The information most commonly sought in relation to recycling is
holiday collection days and times (52% of those seeking information) as well as
standard collection days and times (46%) – both representing no significant change
from 2014.
● Source: The local council website remains the primary source for recycling
information with 74% of those searching using it.
57%
4%
8%
9%
10%
10%
16%
21%
None of these in the past year
How to go about repairing an item myself or having itrepaired by someone else
Disposing of or donating unwanted or broken electricalitems
Food waste collections / recycling
Disposing of or donating clothing and textiles
Disposing of or donating unwanted large furniture items
Local household waste and recycling centres (“the tip”)
Your recycling collection
13% in 2014
13% in 2014
11% in 2014
9% in 2014
WRAP – 3Rs recycling knowledge, attitudes and reported behaviour survey 2015 24
● Age: the youngest two age groups (18-24s and 25-34s) are significantly more likely to
search for information on food waste collections – 16% and 14% respectively
compared to 5% of those aged 55+.
● Confidence: 24% of those describing themselves as “very confident” with their
recycling have searched for information about the kerbside collection (vs. 7% of
those are not very/not at all confident).

www.wrap.org.uk/la