highlights and insights - the cmo survey · highlights and insights ... about the cmo survey...
TRANSCRIPT

About The CMO Survey
Mission
- The CMO Survey collects and disseminates the opinions of top marketers in order to
predict the future of markets, track marketing excellence, and improve the value of
marketing in firms and society.
Survey Operation
- Founded in August 2008, The CMO Survey is administered twice a year via an Internet
survey. Questions repeat to observe trends. Special topics are introduced for each survey.
- The August 2012 survey was the ninth administration of The CMO Survey.
Sponsoring Organizations
Founder and Director
- Professor Christine Moorman, T. Austin Finch, Sr. Professor of Business Administration,
Fuqua School of Business, Duke University
2 © Christine Moorman
Survey Methodology
Survey Sample
- 4674 Top U.S. Marketers at Fortune 1000, Forbes Top 200, and Top Marketers who
are AMA Members or Duke University Alumni and Friends
- 531 responded for a 11.3% response rate
Survey Administration
- Email contact with three follow-up reminders
- Survey in field from July 17-August 3, 2012
- 86% of respondents VP-level or above
Results Interpretation
- M = sample mean; SD = sample standard deviation
- B2B = Business-to-Business firms; B2C = Business-to-Consumer firms
3 © Christine Moorman
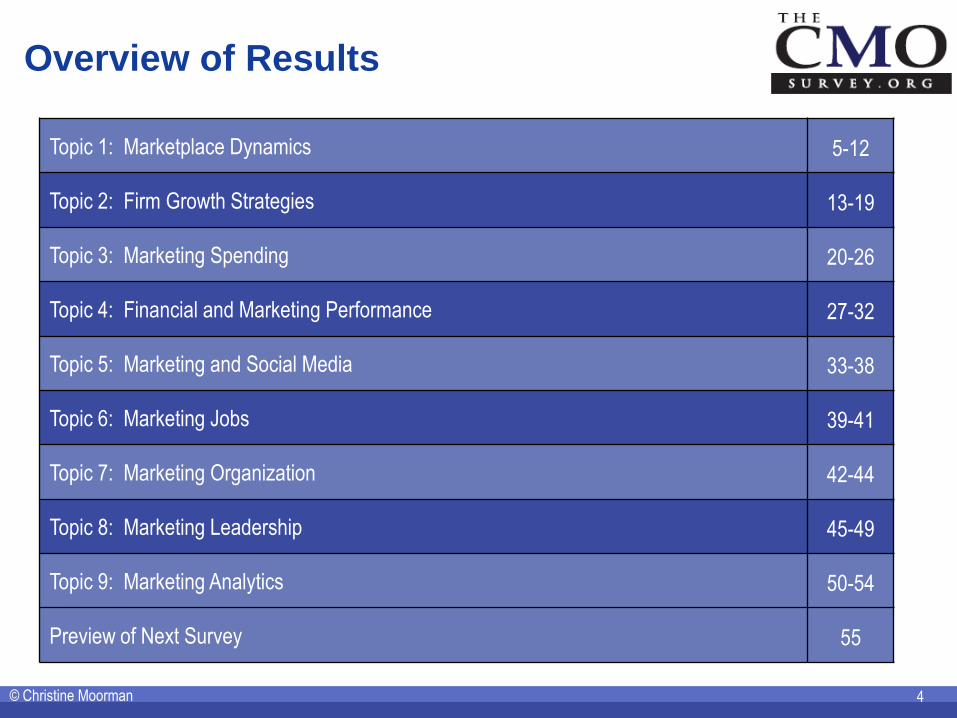
Topic 1: Marketplace Dynamics 5-12
Topic 2: Firm Growth Strategies 13-19
Topic 3: Marketing Spending 20-26
Topic 4: Financial and Marketing Performance 27-32
Topic 5: Marketing and Social Media 33-38
Topic 6: Marketing Jobs 39-41
Topic 7: Marketing Organization 42-44
Topic 8: Marketing Leadership 45-49
Topic 9: Marketing Analytics 50-54
Preview of Next Survey 55
Overview of Results
4 © Christine Moorman
5
Topic 1:
Marketplace Dynamics
5
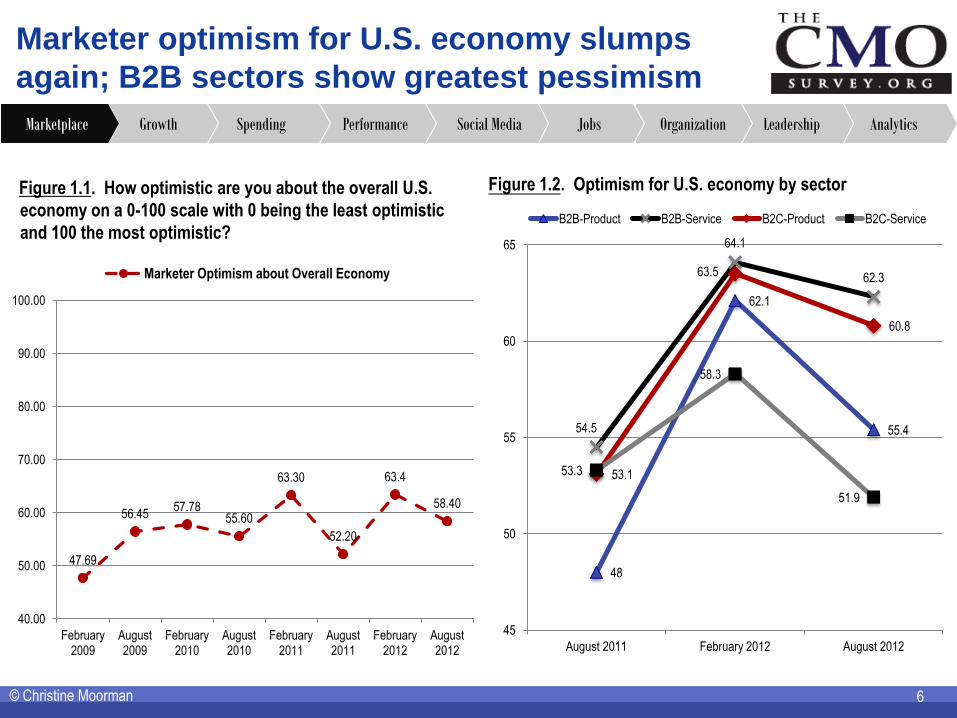
Marketer optimism for U.S. economy slumps
again; B2B sectors show greatest pessimism
Figure 1.1. How optimistic are you about the overall U.S.
economy on a 0-100 scale with 0 being the least optimistic
and 100 the most optimistic?
6 © Christine Moorman
Figure 1.2. Optimism for U.S. economy by sector
Analytics Leadership Organization Jobs Social Media Performance Spending Growth Marketplace
47.69
56.45 57.78
55.60
63.30
52.20
63.4
58.40
40.00
50.00
60.00
70.00
80.00
90.00
100.00
February 2009
August 2009
February 2010
August 2010
February 2011
August 2011
February 2012
August 2012
Marketer Optimism about Overall Economy
48
62.1
55.4 54.5
64.1
62.3
53.1
63.5
60.8
53.3
58.3
51.9
45
50
55
60
65
August 2011 February 2012 August 2012
B2B-Product B2B-Service B2C-Product B2C-Service
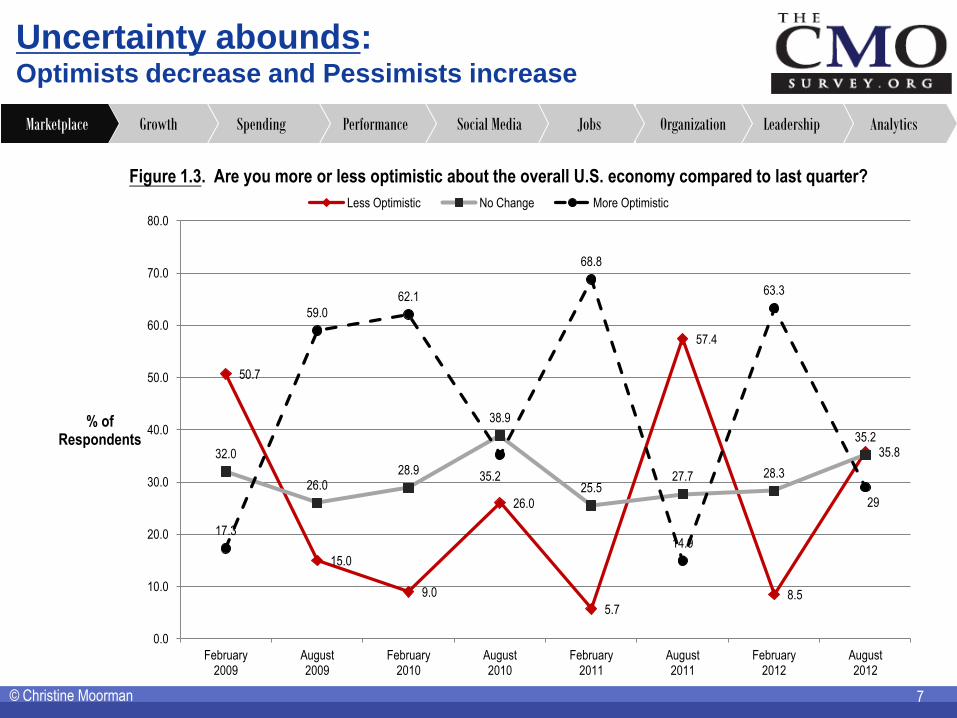
Uncertainty abounds: Optimists decrease and Pessimists increase
7 © Christine Moorman
Figure 1.3. Are you more or less optimistic about the overall U.S. economy compared to last quarter?
Analytics Leadership Organization Jobs Social Media Performance Spending Growth Marketplace
50.7
15.0
9.0
26.0
5.7
57.4
8.5
35.8 32.0
26.0 28.9
38.9
25.5 27.7 28.3
35.2
17.3
59.0
62.1
35.2
68.8
14.9
63.3
29
0.0
10.0
20.0
30.0
40.0
50.0
60.0
70.0
80.0
February 2009
August 2009
February 2010
August 2010
February 2011
August 2011
February 2012
August 2012
% of Respondents
Less Optimistic No Change More Optimistic
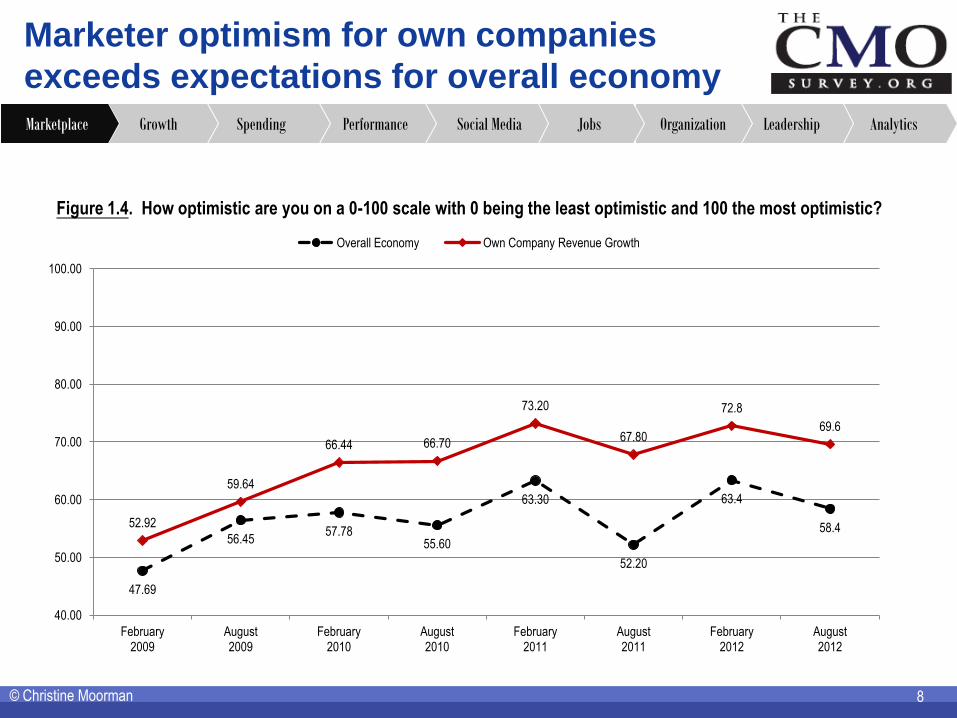
Marketer optimism for own companies
exceeds expectations for overall economy
© Christine Moorman 8
Figure 1.4. How optimistic are you on a 0-100 scale with 0 being the least optimistic and 100 the most optimistic?
Analytics Leadership Organization Jobs Social Media Performance Spending Growth Marketplace
47.69
56.45 57.78
55.60
63.30
52.20
63.4
58.4 52.92
59.64
66.44 66.70
73.20
67.80
72.8
69.6
40.00
50.00
60.00
70.00
80.00
90.00
100.00
February 2009
August 2009
February 2010
August 2010
February 2011
August 2011
February 2012
August 2012
Overall Economy Own Company Revenue Growth
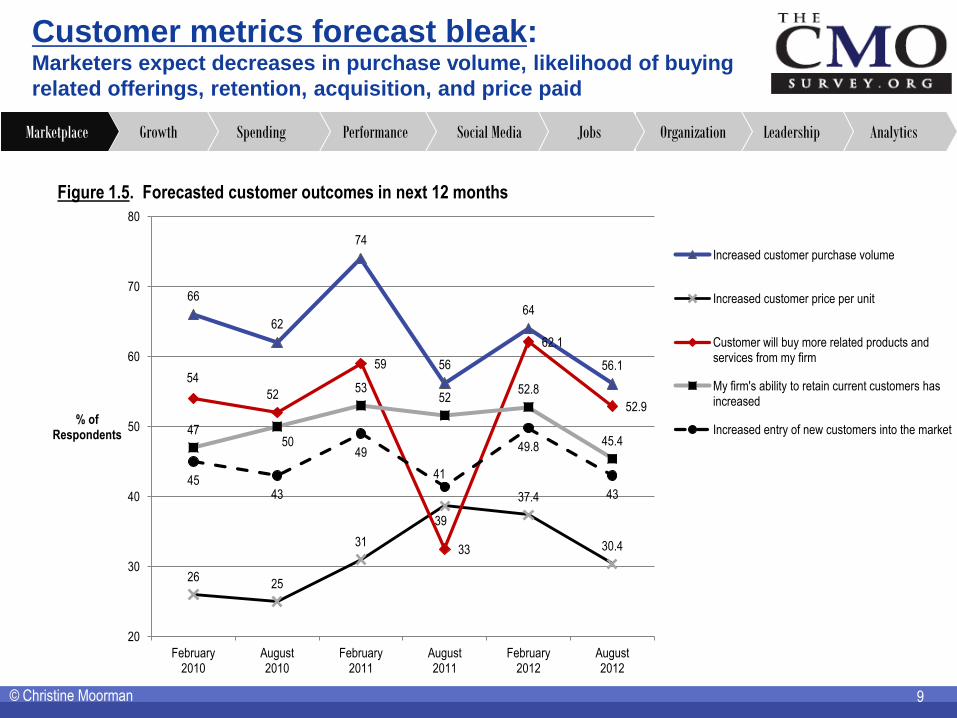
Customer metrics forecast bleak: Marketers expect decreases in purchase volume, likelihood of buying
related offerings, retention, acquisition, and price paid
9 © Christine Moorman
Figure 1.5. Forecasted customer outcomes in next 12 months
Analytics Leadership Organization Jobs Social Media Performance Spending Growth Marketplace
66
62
74
56
64
56.1
26 25
31
39
37.4
30.4
54
52
59
33
62.1
52.9
47 50
53 52
52.8
45.4
45 43
49
41
49.8
43
20
30
40
50
60
70
80
February 2010
August 2010
February 2011
August 2011
February 2012
August 2012
% of Respondents
Increased customer purchase volume
Increased customer price per unit
Customer will buy more related products and services from my firm
My firm's ability to retain current customers has increased
Increased entry of new customers into the market
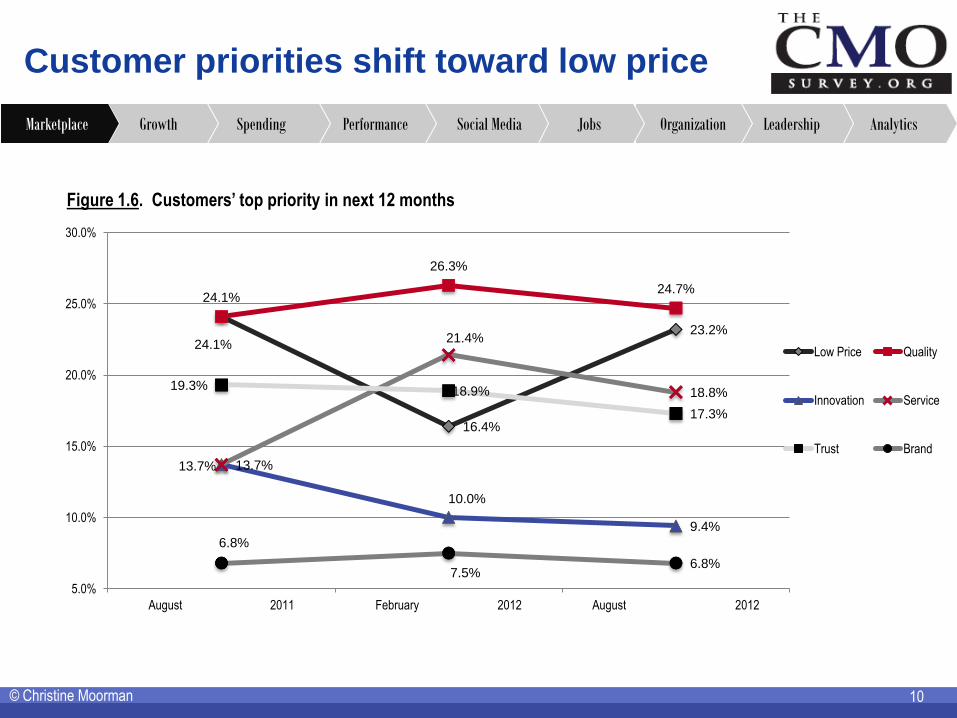
Customer priorities shift toward low price
© Christine Moorman
Figure 1.6. Customers’ top priority in next 12 months
10
Analytics Leadership Organization Jobs Social Media Performance Spending Growth Marketplace
24.1%
16.4%
23.2%
24.1%
26.3%
24.7%
13.7%
10.0%
9.4%
13.7%
21.4%
18.8% 19.3% 18.9%
17.3%
6.8%
7.5% 6.8%
5.0%
10.0%
15.0%
20.0%
25.0%
30.0%
August 2011 February 2012 August 2012
Low Price Quality
Innovation Service
Trust Brand
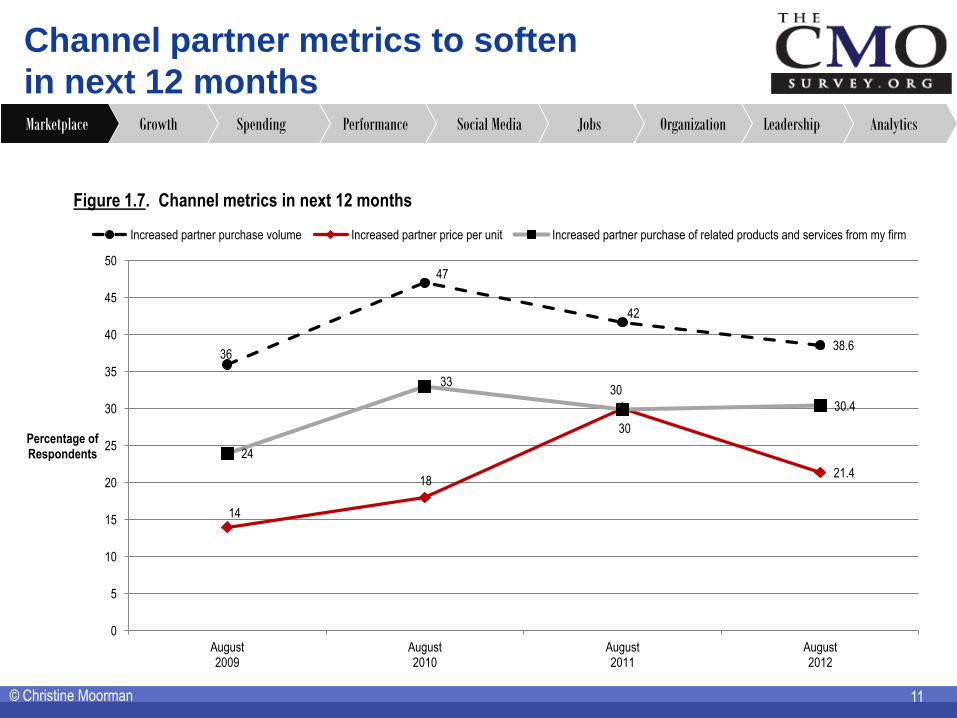
Channel partner metrics to soften
in next 12 months
11 © Christine Moorman
Figure 1.7. Channel metrics in next 12 months
Analytics Leadership Organization Jobs Social Media Performance Spending Growth Marketplace
36
47
42
38.6
14
18
30
21.4
24
33 30
30.4
0
5
10
15
20
25
30
35
40
45
50
August 2009
August 2010
August 2011
August 2012
Percentage of Respondents
Increased partner purchase volume Increased partner price per unit Increased partner purchase of related products and services from my firm
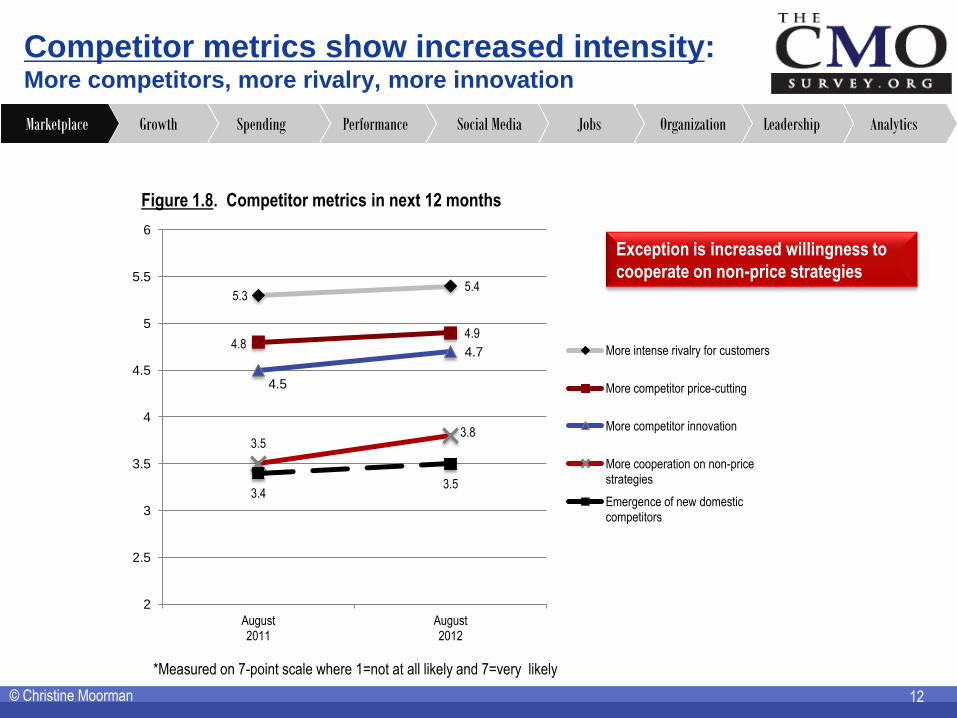
Competitor metrics show increased intensity: More competitors, more rivalry, more innovation
Analytics Leadership Organization Jobs Social Media Performance Spending Growth Marketplace
Figure 1.8. Competitor metrics in next 12 months
12 © Christine Moorman
5.3 5.4
4.8 4.9
4.5
4.7
3.5 3.8
3.4 3.5
2
2.5
3
3.5
4
4.5
5
5.5
6
August 2011
August 2012
More intense rivalry for customers
More competitor price-cutting
More competitor innovation
More cooperation on non-price strategies
Emergence of new domestic competitors
*Measured on 7-point scale where 1=not at all likely and 7=very likely
Exception is increased willingness to
cooperate on non-price strategies
13
Topic 2:
Firm Growth Strategies
13
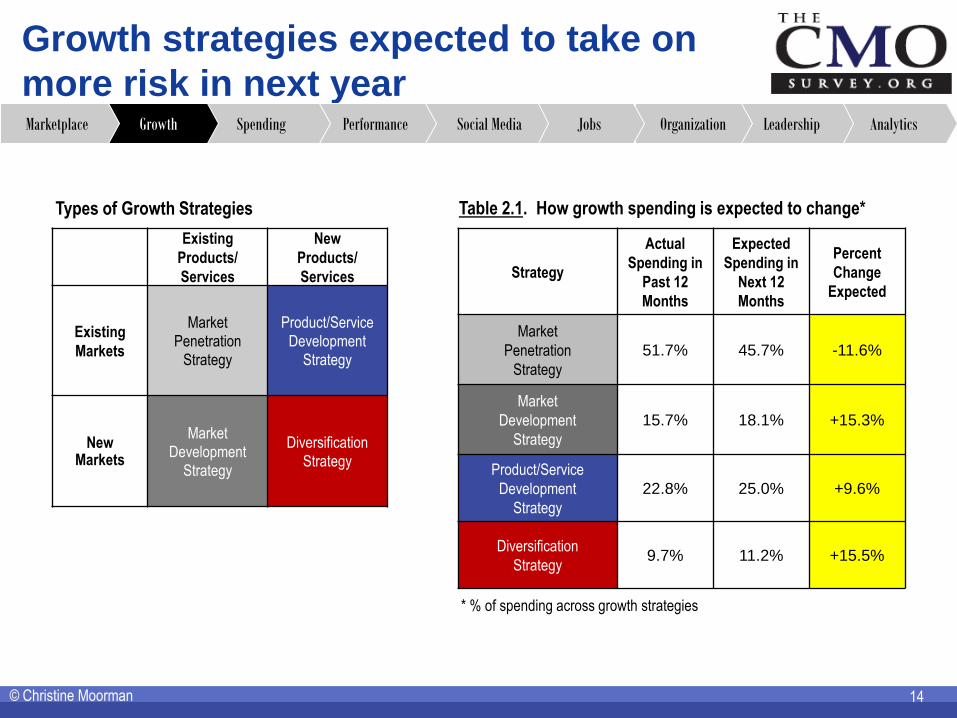
Growth strategies expected to take on
more risk in next year
Table 2.1. How growth spending is expected to change*
Existing
Products/
Services
New
Products/
Services
Existing
Markets
Market Penetration
Strategy
Product/Service Development
Strategy
New Markets
Market Development
Strategy
Diversification Strategy
* % of spending across growth strategies
14 © Christine Moorman
Types of Growth Strategies
Strategy
Actual
Spending in
Past 12
Months
Expected
Spending in
Next 12
Months
Percent
Change
Expected
Market
Penetration
Strategy
51.7% 45.7% -11.6%
Market
Development
Strategy
15.7% 18.1% +15.3%
Product/Service
Development
Strategy
22.8% 25.0% +9.6%
Diversification
Strategy 9.7% 11.2% +15.5%
Analytics Leadership Organization Jobs Social Media Performance Spending Growth Marketplace
© Christine Moorman
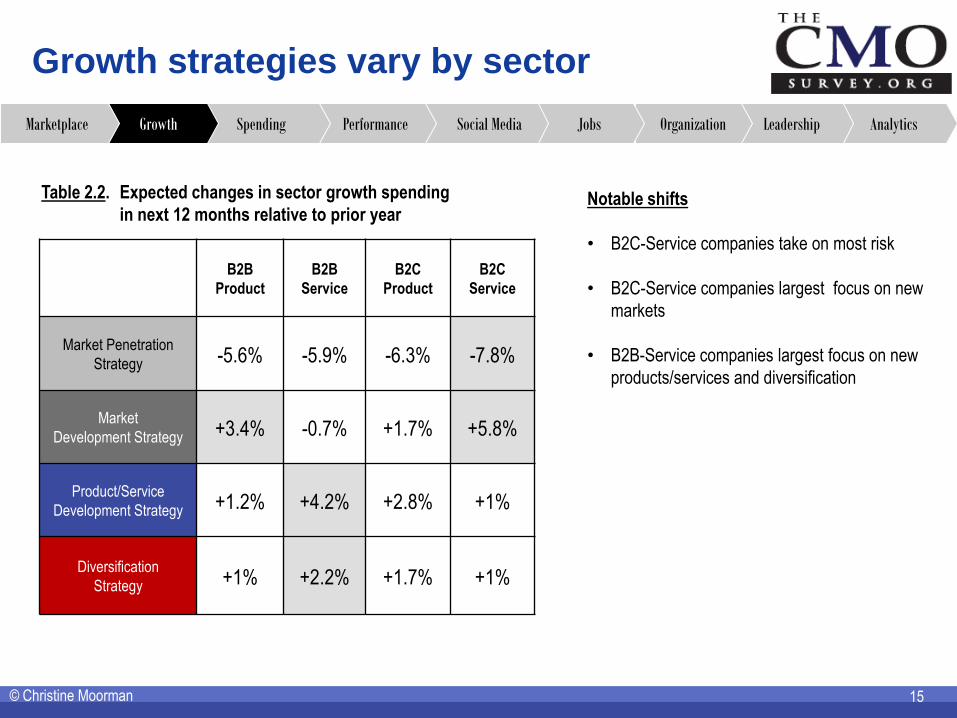
Table 2.2. Expected changes in sector growth spending
in next 12 months relative to prior year
Growth strategies vary by sector
15
B2B
Product
B2B
Service
B2C
Product
B2C
Service
Market Penetration
Strategy -5.6% -5.9% -6.3% -7.8%
Market
Development Strategy +3.4% -0.7% +1.7% +5.8%
Product/Service
Development Strategy +1.2% +4.2% +2.8% +1%
Diversification
Strategy +1% +2.2% +1.7% +1%
Notable shifts
• B2C-Service companies take on most risk
• B2C-Service companies largest focus on new
markets
• B2B-Service companies largest focus on new
products/services and diversification
Analytics Leadership Organization Jobs Social Media Performance Spending Growth Marketplace
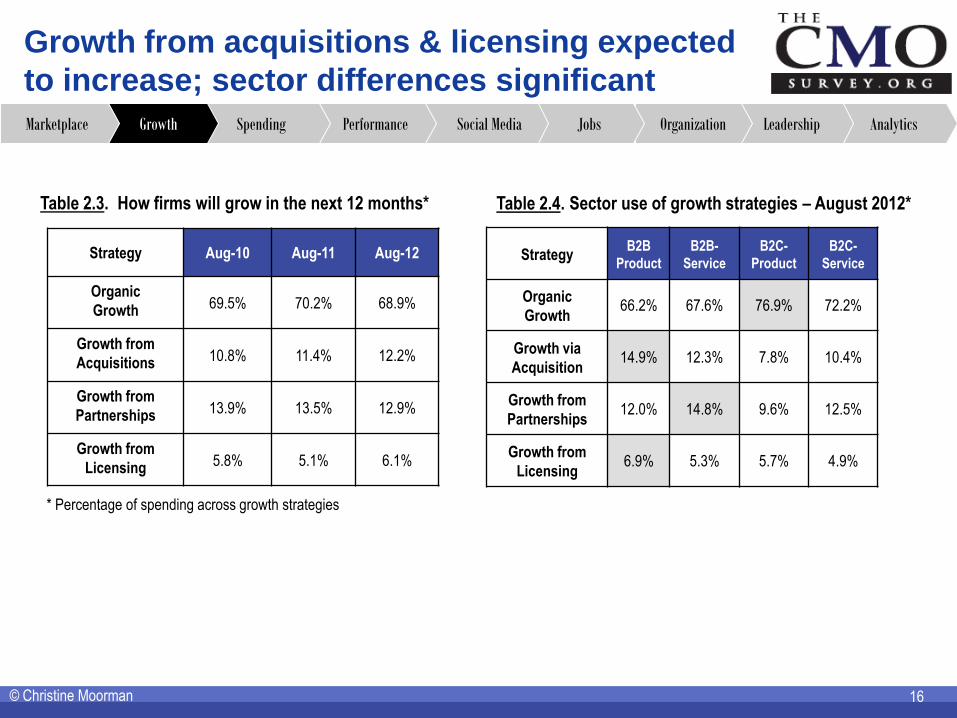
Growth from acquisitions & licensing expected
to increase; sector differences significant
Table 2.3. How firms will grow in the next 12 months*
16 © Christine Moorman
Strategy Aug-10 Aug-11 Aug-12
Organic
Growth 69.5% 70.2% 68.9%
Growth from
Acquisitions 10.8% 11.4% 12.2%
Growth from
Partnerships 13.9% 13.5% 12.9%
Growth from
Licensing 5.8% 5.1% 6.1%
* Percentage of spending across growth strategies
Table 2.4. Sector use of growth strategies – August 2012*
Strategy B2B
Product
B2B-
Service
B2C-
Product
B2C-
Service
Organic
Growth 66.2% 67.6% 76.9% 72.2%
Growth via
Acquisition 14.9% 12.3% 7.8% 10.4%
Growth from
Partnerships 12.0% 14.8% 9.6% 12.5%
Growth from
Licensing 6.9% 5.3% 5.7% 4.9%
Analytics Leadership Organization Jobs Social Media Performance Spending Growth Marketplace
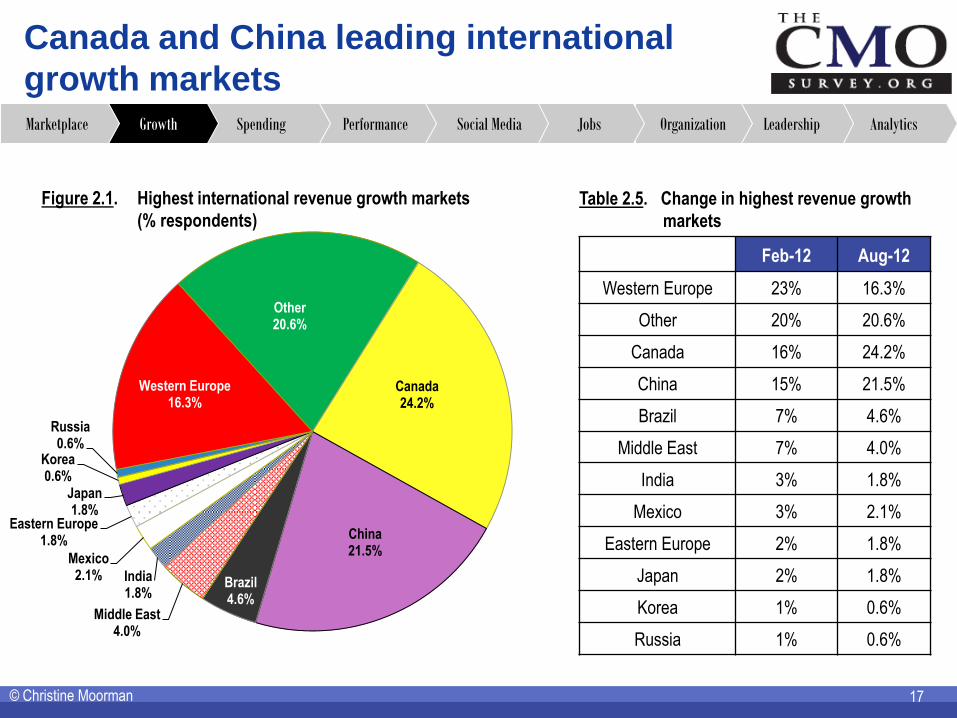
Canada and China leading international
growth markets
Figure 2.1. Highest international revenue growth markets
(% respondents)
© Christine Moorman 17
Analytics Leadership Organization Jobs Social Media Performance Spending Growth Marketplace
Table 2.5. Change in highest revenue growth
markets
Feb-12 Aug-12
Western Europe 23% 16.3%
Other 20% 20.6%
Canada 16% 24.2%
China 15% 21.5%
Brazil 7% 4.6%
Middle East 7% 4.0%
India 3% 1.8%
Mexico 3% 2.1%
Eastern Europe 2% 1.8%
Japan 2% 1.8%
Korea 1% 0.6%
Russia 1% 0.6%
Western Europe 16.3%
Other 20.6%
Canada 24.2%
China 21.5%
Brazil 4.6%
Middle East 4.0%
India 1.8%
Mexico 2.1%
Eastern Europe 1.8%
Japan 1.8%
Korea 0.6%
Russia 0.6%
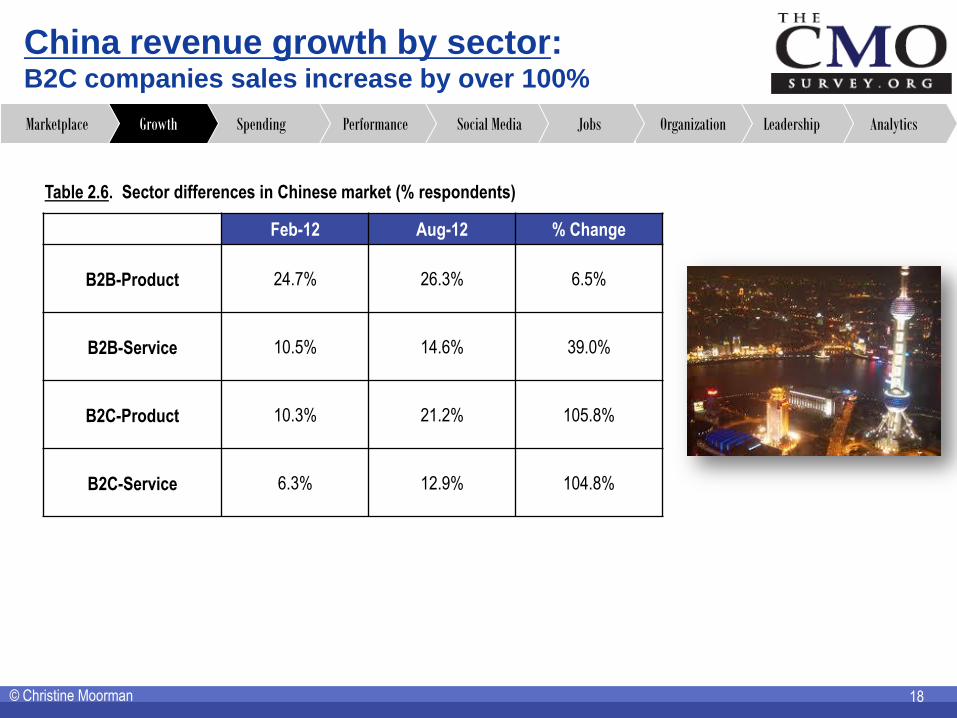
China revenue growth by sector: B2C companies sales increase by over 100%
© Christine Moorman 18
Table 2.6. Sector differences in Chinese market (% respondents)
Analytics Leadership Organization Jobs Social Media Performance Spending Growth Marketplace
Feb-12 Aug-12 % Change
B2B-Product 24.7% 26.3% 6.5%
B2B-Service 10.5% 14.6% 39.0%
B2C-Product 10.3% 21.2% 105.8%
B2C-Service 6.3% 12.9% 104.8%
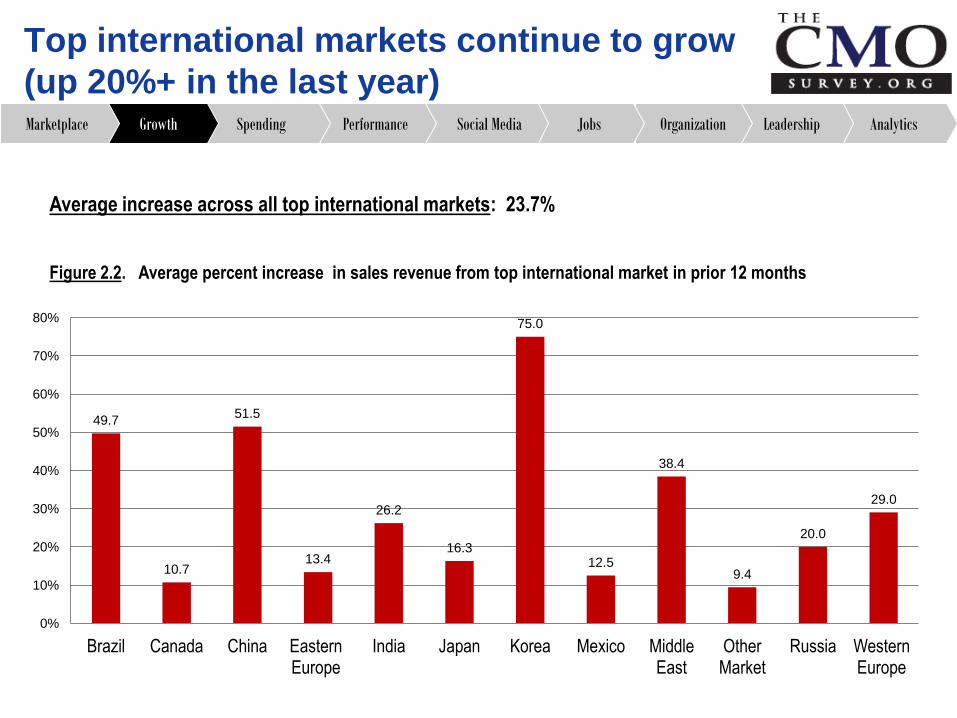
Top international markets continue to grow
(up 20%+ in the last year) Analytics Leadership Organization Jobs Social Media Performance Spending Growth Marketplace
Average increase across all top international markets: 23.7%
Figure 2.2. Average percent increase in sales revenue from top international market in prior 12 months
49.7
10.7
51.5
13.4
26.2
16.3
75.0
12.5
38.4
9.4
20.0
29.0
0%
10%
20%
30%
40%
50%
60%
70%
80%
Brazil Canada China Eastern Europe
India Japan Korea Mexico Middle East
Other Market
Russia Western Europe
20
Topic 3:
Marketing Spending
20
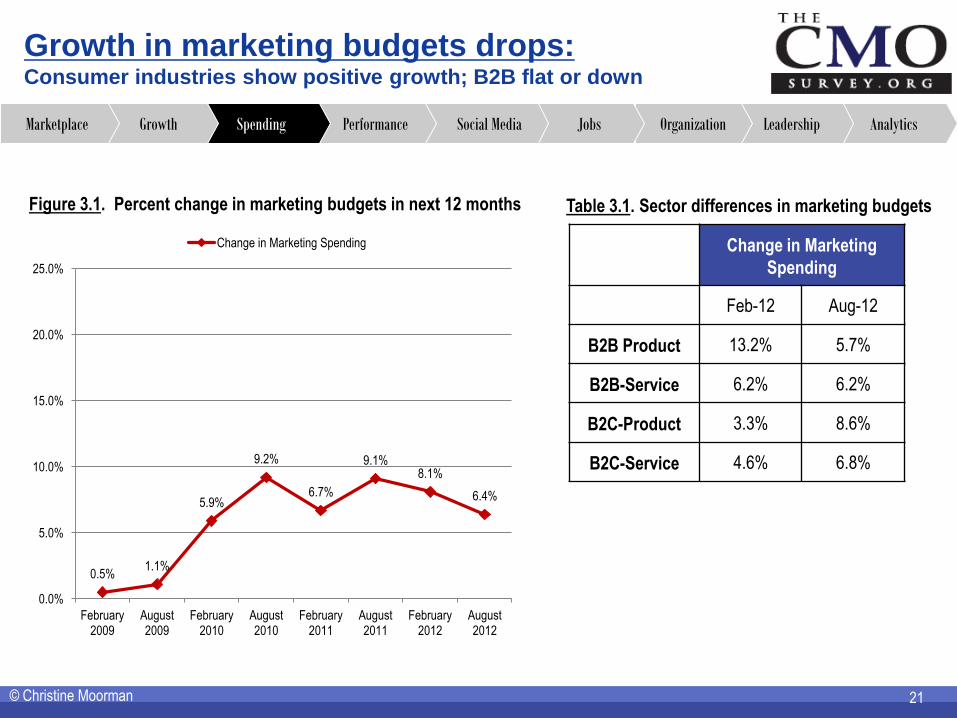
Growth in marketing budgets drops: Consumer industries show positive growth; B2B flat or down
Figure 3.1. Percent change in marketing budgets in next 12 months
21 © Christine Moorman
Table 3.1. Sector differences in marketing budgets
Change in Marketing
Spending
Feb-12 Aug-12
B2B Product 13.2% 5.7%
B2B-Service 6.2% 6.2%
B2C-Product 3.3% 8.6%
B2C-Service 4.6% 6.8%
Analytics Leadership Organization Jobs Social Media Performance Spending Growth Marketplace
0.5% 1.1%
5.9%
9.2%
6.7%
9.1% 8.1%
6.4%
0.0%
5.0%
10.0%
15.0%
20.0%
25.0%
February 2009
August 2009
February 2010
August 2010
February 2011
August 2011
February 2012
August 2012
Change in Marketing Spending
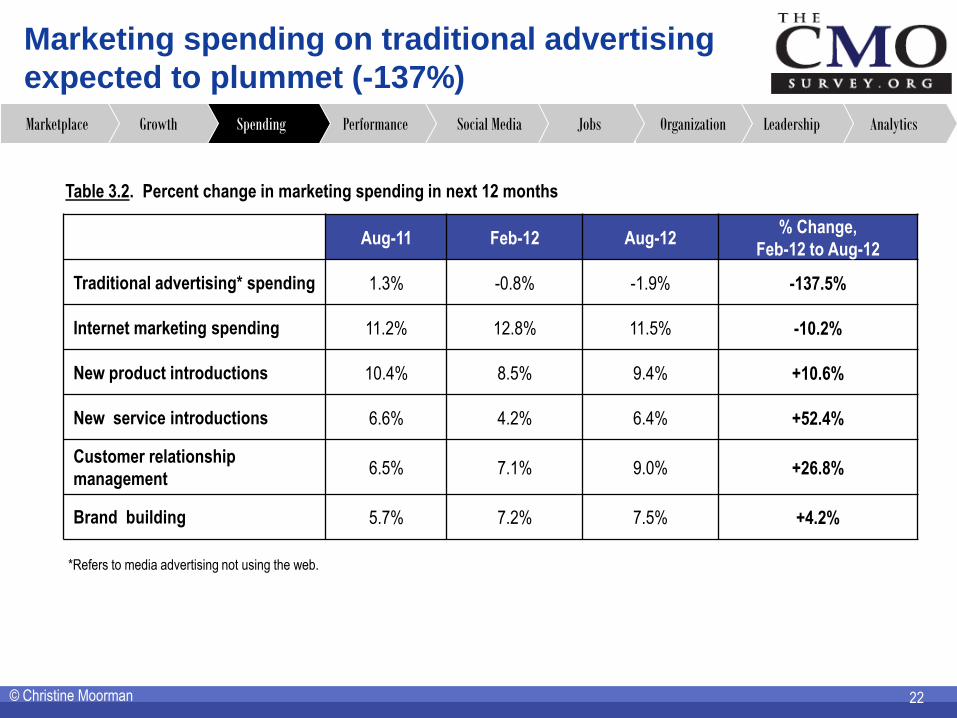
Marketing spending on traditional advertising
expected to plummet (-137%)
Table 3.2. Percent change in marketing spending in next 12 months
22 © Christine Moorman
Aug-11 Feb-12 Aug-12 % Change,
Feb-12 to Aug-12
Traditional advertising* spending 1.3% -0.8% -1.9% -137.5%
Internet marketing spending 11.2% 12.8% 11.5% -10.2%
New product introductions 10.4% 8.5% 9.4% +10.6%
New service introductions 6.6% 4.2% 6.4% +52.4%
Customer relationship
management 6.5% 7.1% 9.0% +26.8%
Brand building 5.7% 7.2% 7.5% +4.2%
Analytics Leadership Organization Jobs Social Media Performance Spending Growth Marketplace
*Refers to media advertising not using the web.
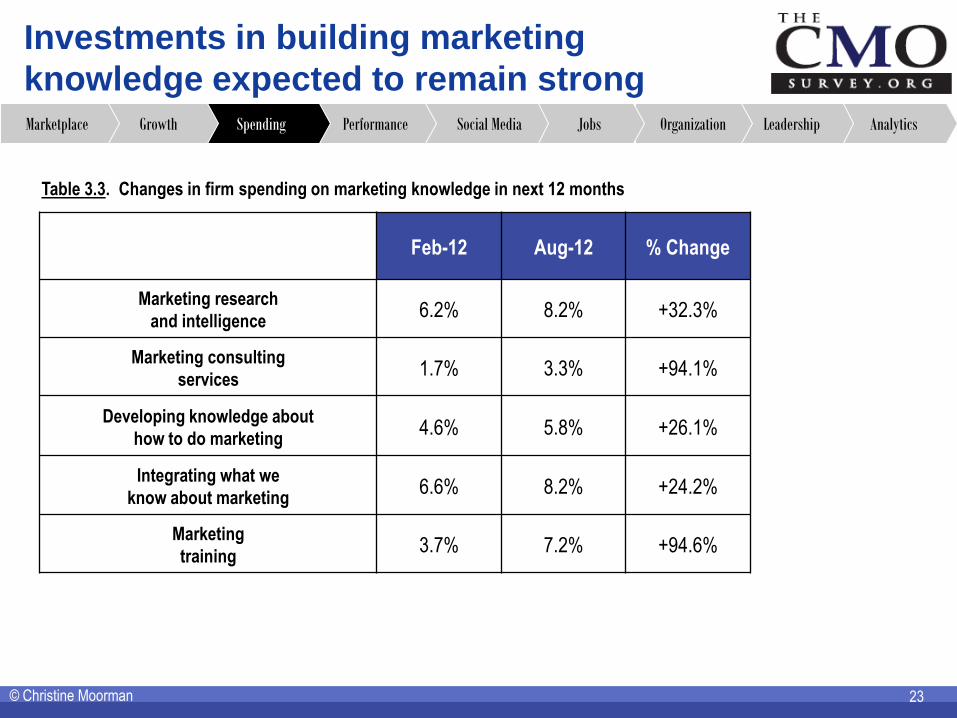
Investments in building marketing
knowledge expected to remain strong
Table 3.3. Changes in firm spending on marketing knowledge in next 12 months
23 © Christine Moorman
Feb-12 Aug-12 % Change
Marketing research
and intelligence 6.2% 8.2% +32.3%
Marketing consulting
services 1.7% 3.3% +94.1%
Developing knowledge about
how to do marketing 4.6% 5.8% +26.1%
Integrating what we
know about marketing 6.6% 8.2% +24.2%
Marketing
training 3.7% 7.2% +94.6%
Analytics Leadership Organization Jobs Social Media Performance Spending Growth Marketplace
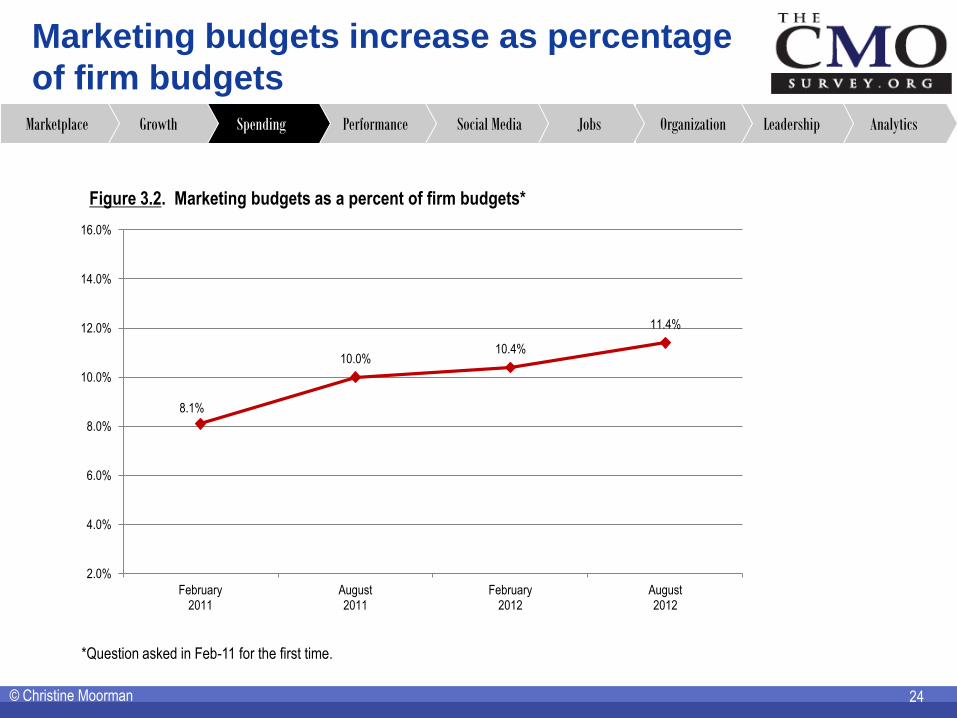
Marketing budgets increase as percentage
of firm budgets
24
Figure 3.2. Marketing budgets as a percent of firm budgets*
© Christine Moorman
Analytics Leadership Organization Jobs Social Media Performance Spending Growth Marketplace
*Question asked in Feb-11 for the first time.
8.1%
10.0% 10.4%
11.4%
2.0%
4.0%
6.0%
8.0%
10.0%
12.0%
14.0%
16.0%
February 2011
August 2011
February 2012
August 2012
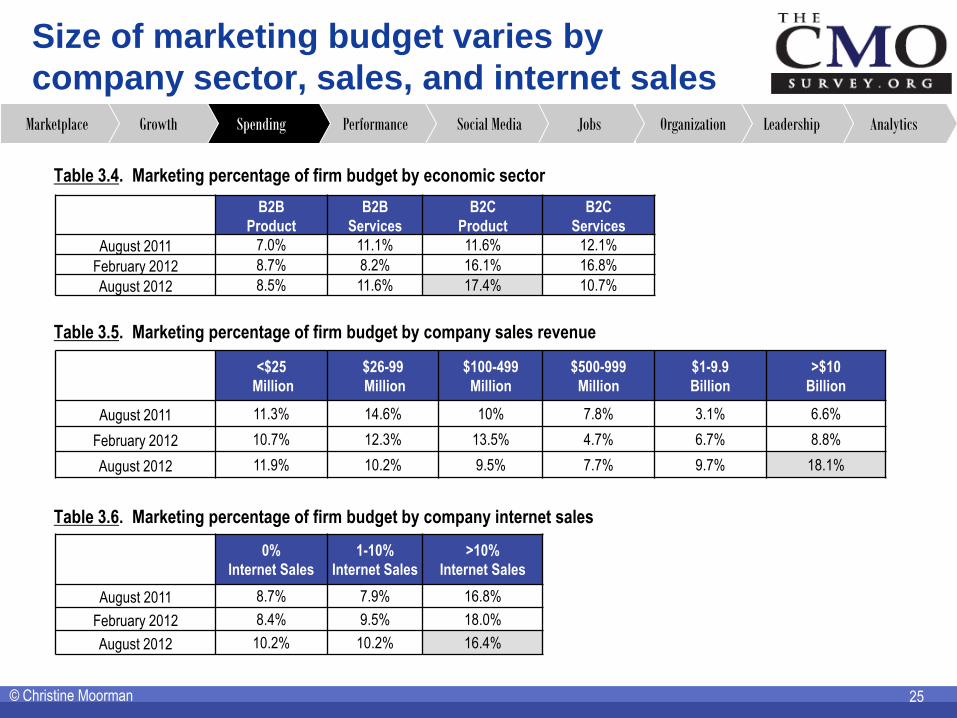
Size of marketing budget varies by
company sector, sales, and internet sales
25
Table 3.4. Marketing percentage of firm budget by economic sector
B2B
Product
B2B
Services
B2C
Product
B2C
Services
August 2011 7.0% 11.1% 11.6% 12.1%
February 2012 8.7% 8.2% 16.1% 16.8%
August 2012 8.5% 11.6% 17.4% 10.7%
<$25
Million
$26-99
Million
$100-499
Million
$500-999
Million
$1-9.9
Billion
>$10
Billion
August 2011 11.3% 14.6% 10% 7.8% 3.1% 6.6%
February 2012 10.7% 12.3% 13.5% 4.7% 6.7% 8.8%
August 2012 11.9% 10.2% 9.5% 7.7% 9.7% 18.1%
0%
Internet Sales
1-10%
Internet Sales
>10%
Internet Sales
August 2011 8.7% 7.9% 16.8%
February 2012 8.4% 9.5% 18.0%
August 2012 10.2% 10.2% 16.4%
Table 3.5. Marketing percentage of firm budget by company sales revenue
Table 3.6. Marketing percentage of firm budget by company internet sales
© Christine Moorman
Analytics Leadership Organization Jobs Social Media Performance Spending Growth Marketplace

Marketing spending as a percentage
of firm revenues
26 © Christine Moorman
• Mean percentage: 11.0% (August-2012) vs. 8.5% (February-2012)
• 95 percent confidence interval: 9.3%-14.4%
Table 3.7. Marketing spending as a percentage of firm revenues by economic sector*
B2B
Product
B2B
Services
B2C
Product
B2C
Services
February 2012 7.3% 4.8% 13.8% 16.6%
August 2012 11.4% 11.9% 9.8% 16.1%
<$25
Million
$26-99
Million
$100-499
Million
$500-999
Million
$1-9.9
Billion
>$10
Billion
February 2012 11.8% 9.0% 14.7% 1.7% 2.8% 5.2%
August 2012 17.8% 10.7% 10.6% 9.4% 6.1% 13.1%
0%
Internet Sales
1-10%
Internet Sales
>10%
Internet Sales
February 2012 6.3% 9.0% 14.4%
August 2012 11.0% 9.3% 18.3%
Table 3.8. Marketing spending as a percentage of firm revenues by company sales revenue*
Table 3.9. Marketing spending as a percentage of firm revenues by company internet sales*
Analytics Leadership Organization Jobs Social Media Performance Spending Growth Marketplace
*Question asked in Feb-12 for the first time.

27
Topic 4:
Financial and Marketing
Performance
27
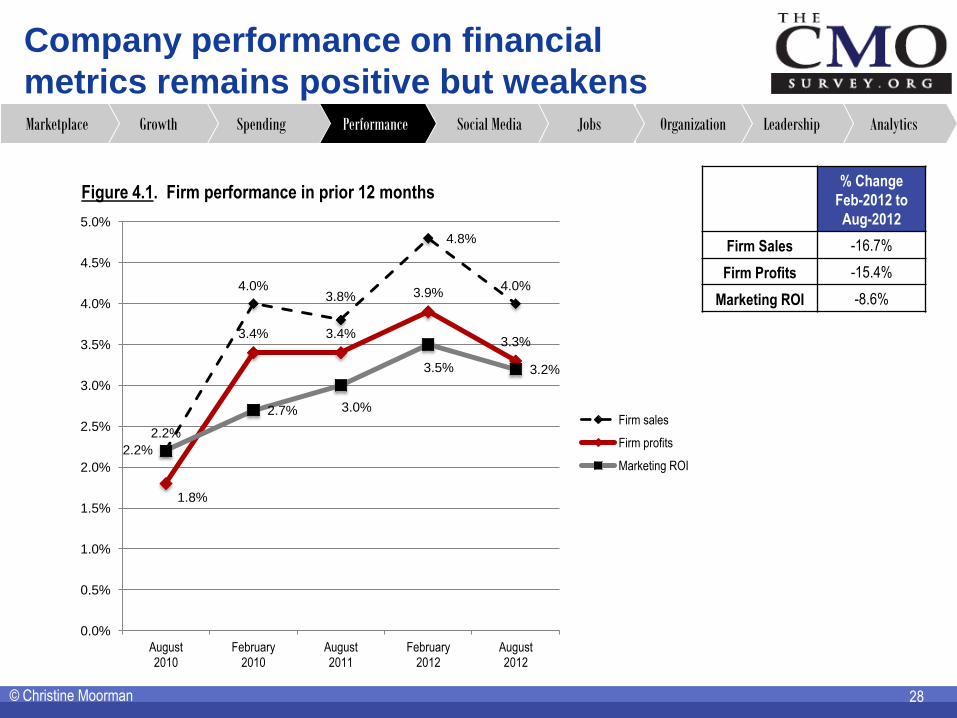
Company performance on financial
metrics remains positive but weakens
28 © Christine Moorman
Figure 4.1. Firm performance in prior 12 months % Change
Feb-2012 to
Aug-2012
Firm Sales -16.7%
Firm Profits -15.4%
Marketing ROI -8.6%
Analytics Leadership Organization Jobs Social Media Performance Spending Growth Marketplace
2.2%
4.0% 3.8%
4.8%
4.0%
1.8%
3.4% 3.4%
3.9%
3.3%
2.2%
2.7% 3.0%
3.5% 3.2%
0.0%
0.5%
1.0%
1.5%
2.0%
2.5%
3.0%
3.5%
4.0%
4.5%
5.0%
August 2010
February 2010
August 2011
February 2012
August 2012
Firm sales
Firm profits
Marketing ROI
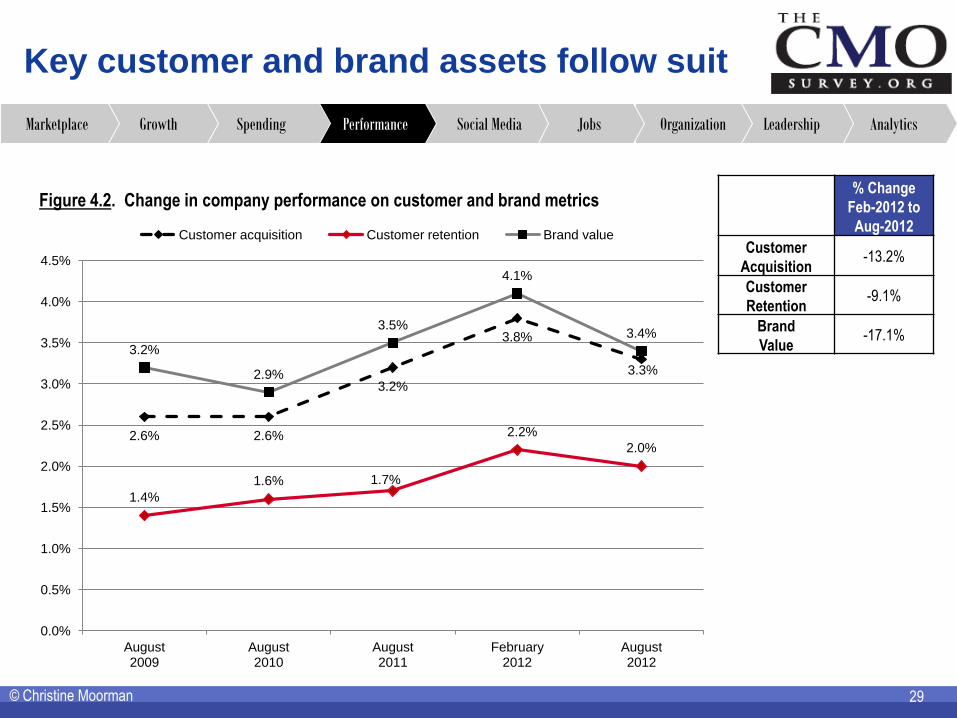
Key customer and brand assets follow suit
29 © Christine Moorman
Figure 4.2. Change in company performance on customer and brand metrics % Change
Feb-2012 to
Aug-2012
Customer
Acquisition -13.2%
Customer
Retention -9.1%
Brand
Value -17.1%
Analytics Leadership Organization Jobs Social Media Performance Spending Growth Marketplace
2.6% 2.6%
3.2%
3.8%
3.3%
1.4%
1.6% 1.7%
2.2%
2.0%
3.2%
2.9%
3.5%
4.1%
3.4%
0.0%
0.5%
1.0%
1.5%
2.0%
2.5%
3.0%
3.5%
4.0%
4.5%
August 2009
August 2010
August 2011
February 2012
August 2012
Customer acquisition Customer retention Brand value
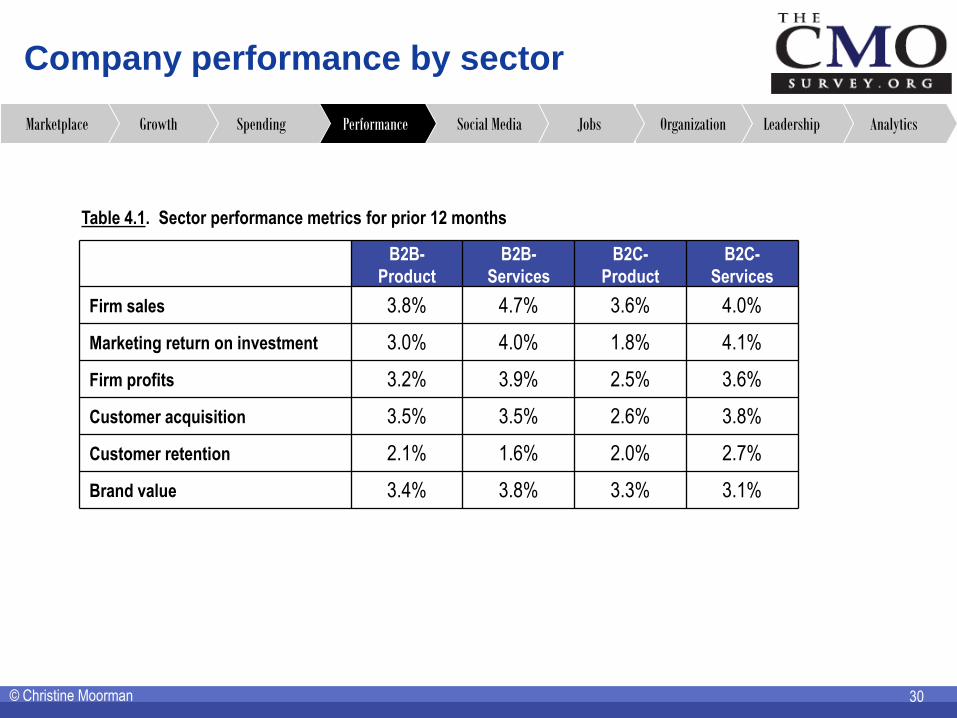
Company performance by sector
30 © Christine Moorman
B2B-
Product
B2B-
Services
B2C-
Product
B2C-
Services
Firm sales 3.8% 4.7% 3.6% 4.0%
Marketing return on investment 3.0% 4.0% 1.8% 4.1%
Firm profits 3.2% 3.9% 2.5% 3.6%
Customer acquisition 3.5% 3.5% 2.6% 3.8%
Customer retention 2.1% 1.6% 2.0% 2.7%
Brand value 3.4% 3.8% 3.3% 3.1%
Table 4.1. Sector performance metrics for prior 12 months
Analytics Leadership Organization Jobs Social Media Performance Spending Growth Marketplace
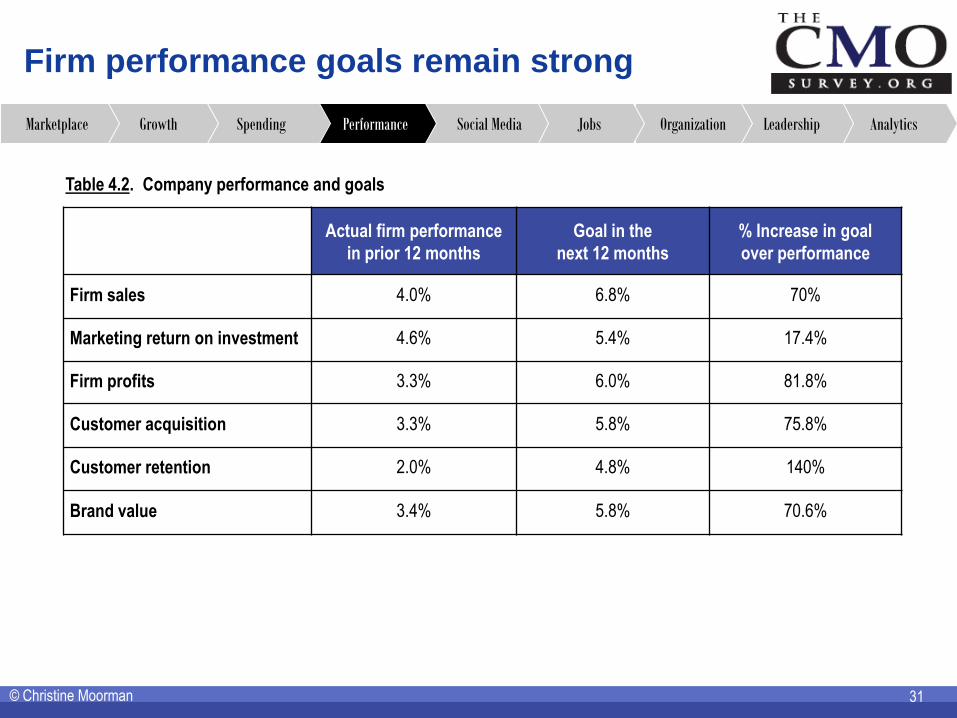
Firm performance goals remain strong
Table 4.2. Company performance and goals
Actual firm performance
in prior 12 months
Goal in the
next 12 months
% Increase in goal
over performance
Firm sales 4.0% 6.8% 70%
Marketing return on investment 4.6% 5.4% 17.4%
Firm profits 3.3% 6.0% 81.8%
Customer acquisition 3.3% 5.8% 75.8%
Customer retention 2.0% 4.8% 140%
Brand value 3.4% 5.8% 70.6%
31 © Christine Moorman
Analytics Leadership Organization Jobs Social Media Performance Spending Growth Marketplace
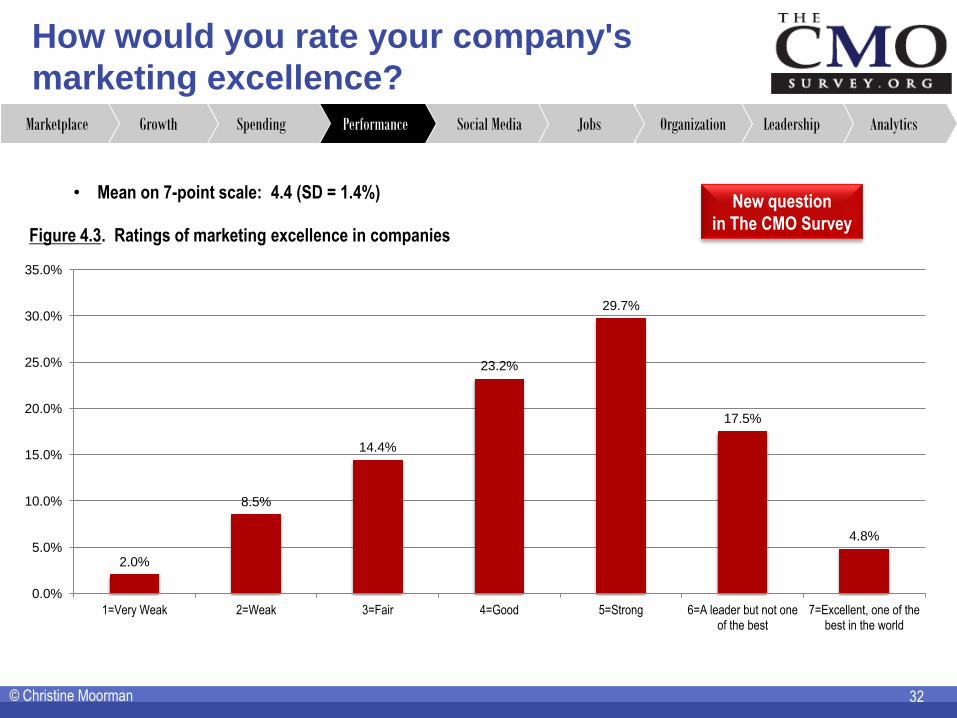
How would you rate your company's
marketing excellence?
32 © Christine Moorman
• Mean on 7-point scale: 4.4 (SD = 1.4%)
Figure 4.3. Ratings of marketing excellence in companies
New question
in The CMO Survey
Analytics Leadership Organization Jobs Social Media Performance Spending Growth Marketplace
2.0%
8.5%
14.4%
23.2%
29.7%
17.5%
4.8%
0.0%
5.0%
10.0%
15.0%
20.0%
25.0%
30.0%
35.0%
1=Very Weak 2=Weak 3=Fair 4=Good 5=Strong 6=A leader but not one of the best
7=Excellent, one of the best in the world
33 33
Topic 5:
Marketing and Social Media
33

Social media spending growth continues: Expected to be 18.8% of marketing budgets in five years
34 © Christine Moorman
Figure 5.1. Social media spending as a percentage of marketing budgets over time
Analytics Leadership Organization Jobs Social Media Performance Spending Growth Marketplace
7.6%
10.7%
18.8%
0.0%
5.0%
10.0%
15.0%
20.0%
Current Levels Over Next 12 Months In Next 5 Years
Per
cen
tag
e o
f To
tal M
arke
tin
g B
ud
get
(%
)
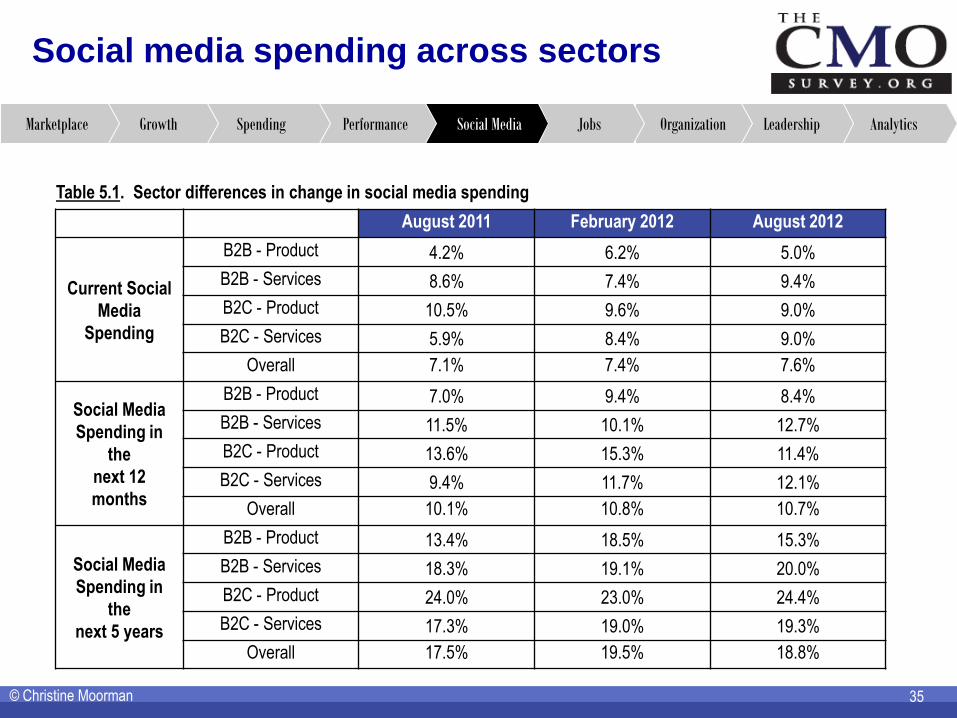
Social media spending across sectors
35 © Christine Moorman
August 2011 February 2012 August 2012
Current Social
Media
Spending
B2B - Product 4.2% 6.2% 5.0%
B2B - Services 8.6% 7.4% 9.4%
B2C - Product 10.5% 9.6% 9.0%
B2C - Services 5.9% 8.4% 9.0%
Overall 7.1% 7.4% 7.6%
Social Media
Spending in
the
next 12
months
B2B - Product 7.0% 9.4% 8.4%
B2B - Services 11.5% 10.1% 12.7%
B2C - Product 13.6% 15.3% 11.4%
B2C - Services 9.4% 11.7% 12.1%
Overall 10.1% 10.8% 10.7%
Social Media
Spending in
the
next 5 years
B2B - Product 13.4% 18.5% 15.3%
B2B - Services 18.3% 19.1% 20.0%
B2C - Product 24.0% 23.0% 24.4%
B2C - Services 17.3% 19.0% 19.3%
Overall 17.5% 19.5% 18.8%
Table 5.1. Sector differences in change in social media spending
Analytics Leadership Organization Jobs Social Media Performance Spending Growth Marketplace
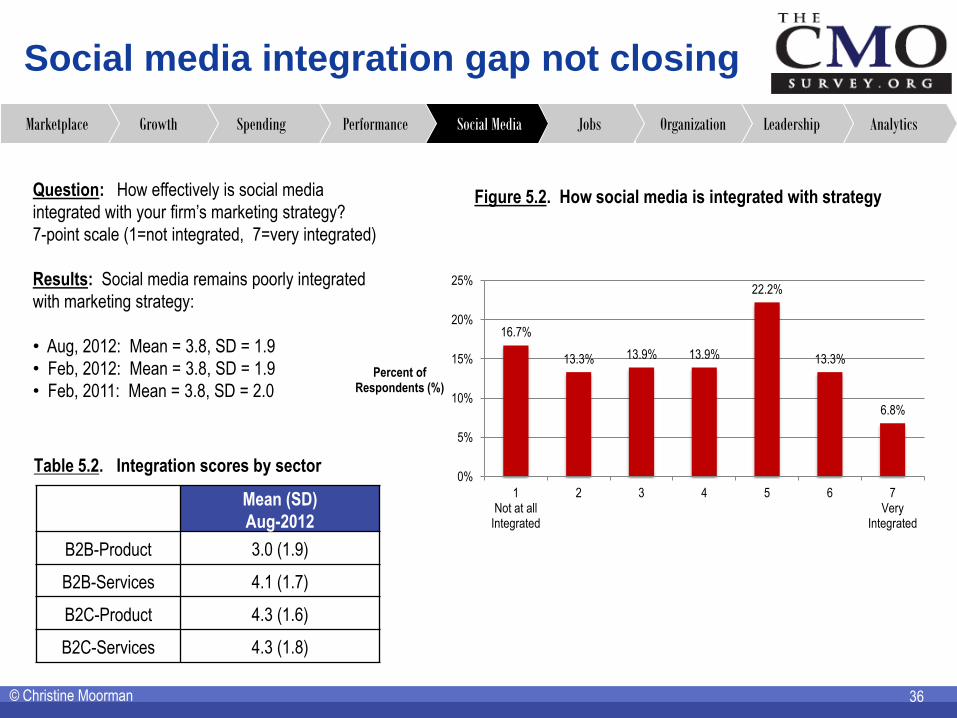
Social media integration gap not closing
36 © Christine Moorman
Question: How effectively is social media
integrated with your firm’s marketing strategy?
7-point scale (1=not integrated, 7=very integrated)
Results: Social media remains poorly integrated
with marketing strategy:
• Aug, 2012: Mean = 3.8, SD = 1.9
• Feb, 2012: Mean = 3.8, SD = 1.9
• Feb, 2011: Mean = 3.8, SD = 2.0
Mean (SD)
Aug-2012
B2B-Product 3.0 (1.9)
B2B-Services 4.1 (1.7)
B2C-Product 4.3 (1.6)
B2C-Services 4.3 (1.8)
Table 5.2. Integration scores by sector
Figure 5.2. How social media is integrated with strategy
Analytics Leadership Organization Jobs Social Media Performance Spending Growth Marketplace
16.7%
13.3% 13.9% 13.9%
22.2%
13.3%
6.8%
0%
5%
10%
15%
20%
25%
1 Not at all
Integrated
2 3 4 5 6 7 Very
Integrated
Percent of Respondents (%)
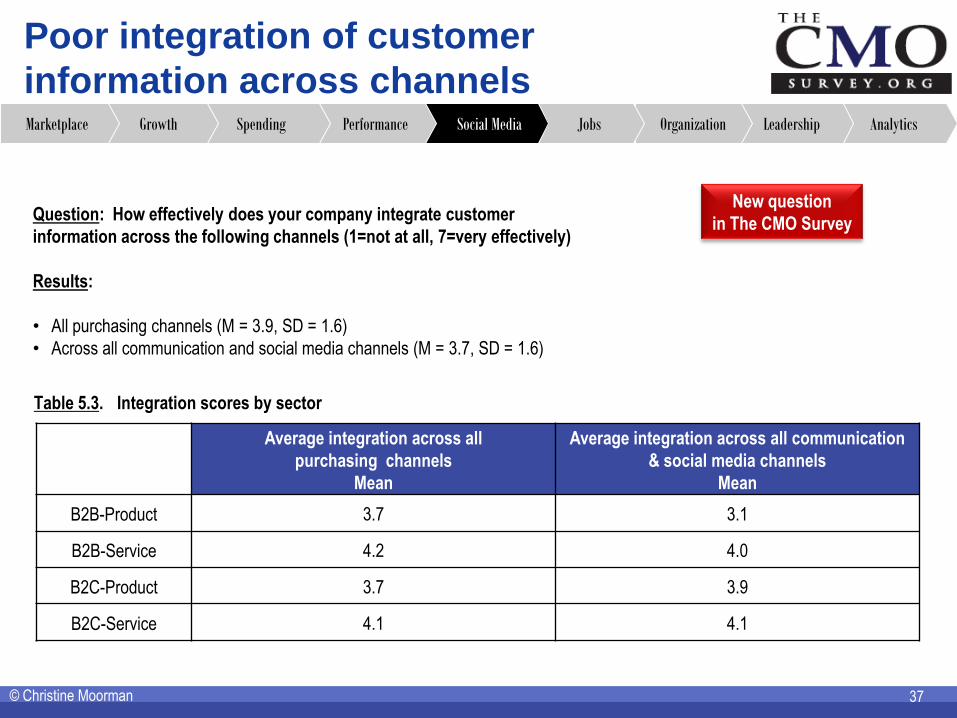
Poor integration of customer
information across channels
37 © Christine Moorman
Question:. How effectively does your company integrate customer
information across the following channels (1=not at all, 7=very effectively)
Results:
• All purchasing channels (M = 3.9, SD = 1.6)
• Across all communication and social media channels (M = 3.7, SD = 1.6)
Average integration across all
purchasing channels
Mean
Average integration across all communication
& social media channels
Mean
B2B-Product 3.7 3.1
B2B-Service 4.2 4.0
B2C-Product 3.7 3.9
B2C-Service 4.1 4.1
Table 5.3. Integration scores by sector
Analytics Leadership Organization Jobs Social Media Performance Spending Growth Marketplace
New question
in The CMO Survey
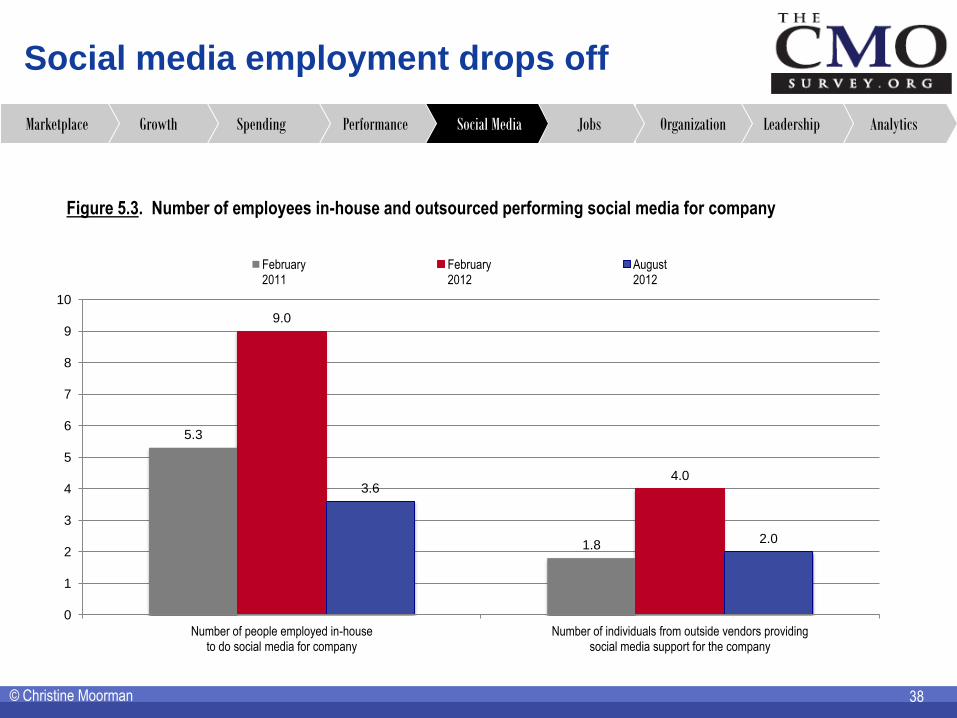
Social media employment drops off
38 © Christine Moorman
Analytics Leadership Organization Jobs Social Media Performance Spending Growth Marketplace
Figure 5.3. Number of employees in-house and outsourced performing social media for company
5.3
1.8
9.0
4.0 3.6
2.0
0
1
2
3
4
5
6
7
8
9
10
Number of people employed in-house to do social media for company
Number of individuals from outside vendors providing social media support for the company
February 2011
February 2012
August 2012
39
Topic 6: Marketing Jobs
39

Marketing employment on the rise: B2B-Service companies biggest percentage increase
Figure 6.1. Percentage change in marketing hires planned
in next 12 months
40 © Christine Moorman
B2B
Product
B2B
Service
B2C
Product
B2C
Service
February
2012 2.1% 4.5% 1.9% 4.5%
August
2012 4.0% 11.3% 4.1% 5.9%
Table 6.1. Percentage increase in marketing
hires by sector
Analytics Leadership Organization Jobs Social Media Performance Spending Growth Marketplace
4.0%
6.2%
7.2%
5.2%
6.5%
0%
1%
2%
3%
4%
5%
6%
7%
8%
August 2010
February 2011
August 2011
February 2012
August 2012
Per
cen
tag
e In
crea
se in
Mar
keti
ng
Hir
es in
Nex
t 12
Mo
nth
s
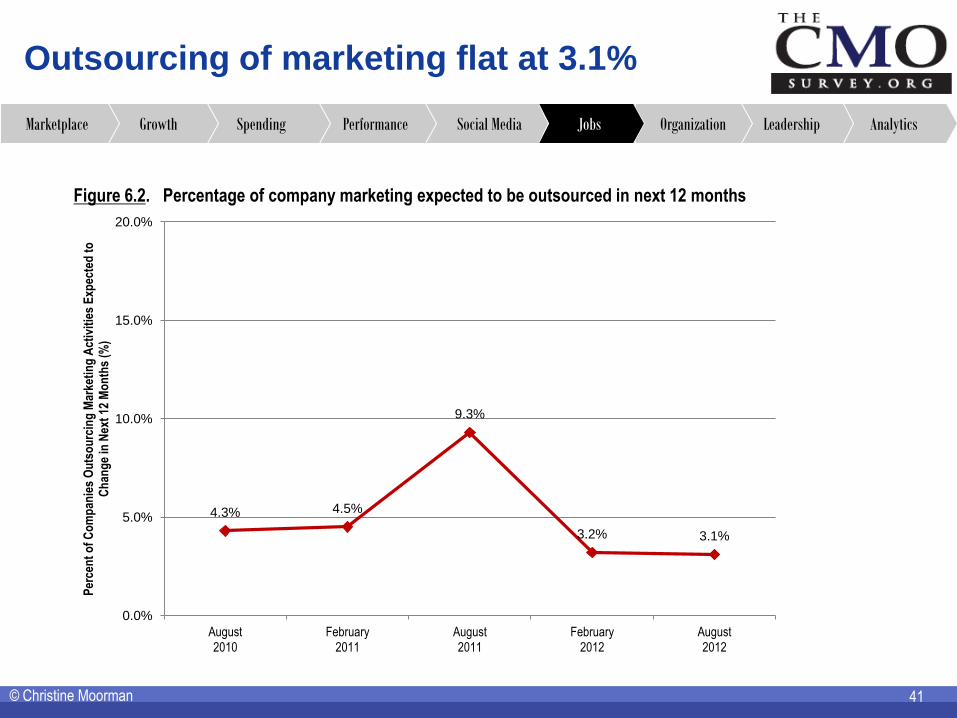
41 © Christine Moorman
Figure 6.2. Percentage of company marketing expected to be outsourced in next 12 months
Analytics Leadership Organization Jobs Social Media Performance Spending Growth Marketplace
Outsourcing of marketing flat at 3.1%
4.3% 4.5%
9.3%
3.2% 3.1%
0.0%
5.0%
10.0%
15.0%
20.0%
August 2010
February 2011
August 2011
February 2012
August 2012
Per
cen
t o
f C
om
pan
ies
Ou
tso
urc
ing
Mar
keti
ng
Act
ivit
ies
Exp
ecte
d t
o
Ch
ang
e in
Nex
t 12
Mo
nth
s (%
)
42
Topic 7:
Marketing Organization
42
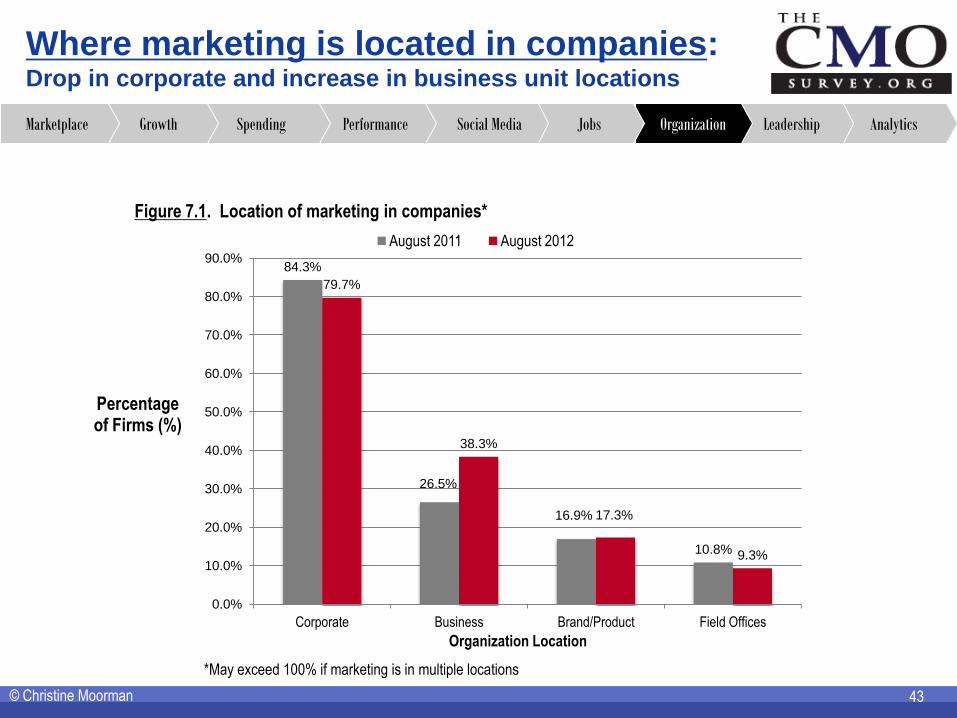
Where marketing is located in companies: Drop in corporate and increase in business unit locations
43 © Christine Moorman
Figure 7.1. Location of marketing in companies*
Analytics Leadership Organization Jobs Social Media Performance Spending Growth Marketplace
84.3%
26.5%
16.9%
10.8%
79.7%
38.3%
17.3%
9.3%
0.0%
10.0%
20.0%
30.0%
40.0%
50.0%
60.0%
70.0%
80.0%
90.0%
Corporate Business Brand/Product Field Offices
Organization Location
Percentage of Firms (%)
August 2011 August 2012
*May exceed 100% if marketing is in multiple locations
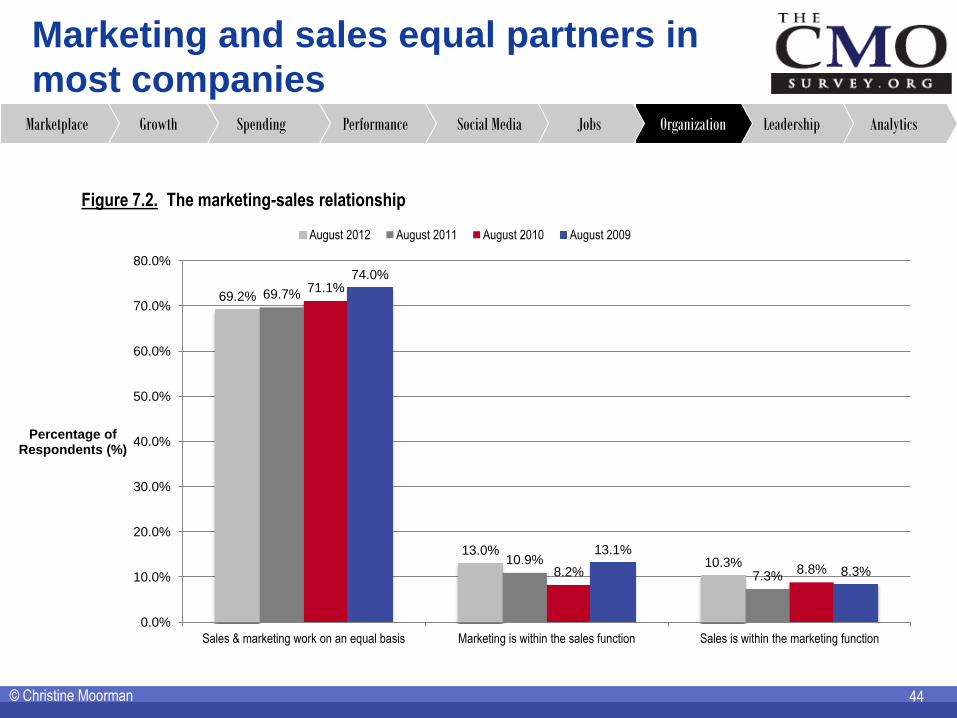
Marketing and sales equal partners in
most companies
44 © Christine Moorman
Figure 7.2. The marketing-sales relationship
Analytics Leadership Organization Jobs Social Media Performance Spending Growth Marketplace
69.2%
13.0% 10.3%
69.7%
10.9%
7.3%
71.1%
8.2% 8.8%
74.0%
13.1%
8.3%
0.0%
10.0%
20.0%
30.0%
40.0%
50.0%
60.0%
70.0%
80.0%
Sales & marketing work on an equal basis Marketing is within the sales function Sales is within the marketing function
Percentage of Respondents (%)
August 2012 August 2011 August 2010 August 2009

45
Topic 8:
Marketing Leadership
45
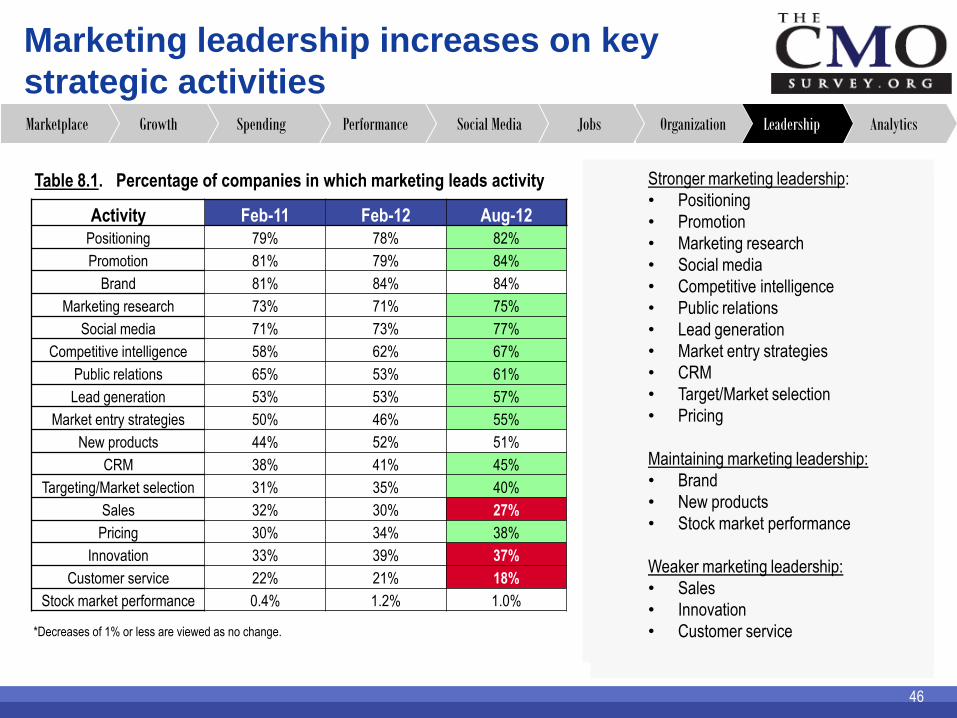
Marketing leadership increases on key
strategic activities
Table 8.1. Percentage of companies in which marketing leads activity
46
Stronger marketing leadership:
• Positioning
• Promotion
• Marketing research
• Social media
• Competitive intelligence
• Public relations
• Lead generation
• Market entry strategies
• CRM
• Target/Market selection
• Pricing
Maintaining marketing leadership:
• Brand
• New products
• Stock market performance
Weaker marketing leadership:
• Sales
• Innovation
• Customer service
Activity Feb-11 Feb-12 Aug-12
Positioning 79% 78% 82%
Promotion 81% 79% 84%
Brand 81% 84% 84%
Marketing research 73% 71% 75%
Social media 71% 73% 77%
Competitive intelligence 58% 62% 67%
Public relations 65% 53% 61%
Lead generation 53% 53% 57%
Market entry strategies 50% 46% 55%
New products 44% 52% 51%
CRM 38% 41% 45%
Targeting/Market selection 31% 35% 40%
Sales 32% 30% 27%
Pricing 30% 34% 38%
Innovation 33% 39% 37%
Customer service 22% 21% 18%
Stock market performance 0.4% 1.2% 1.0%
Analytics Leadership Organization Jobs Social Media Performance Spending Growth Marketplace
*Decreases of 1% or less are viewed as no change.
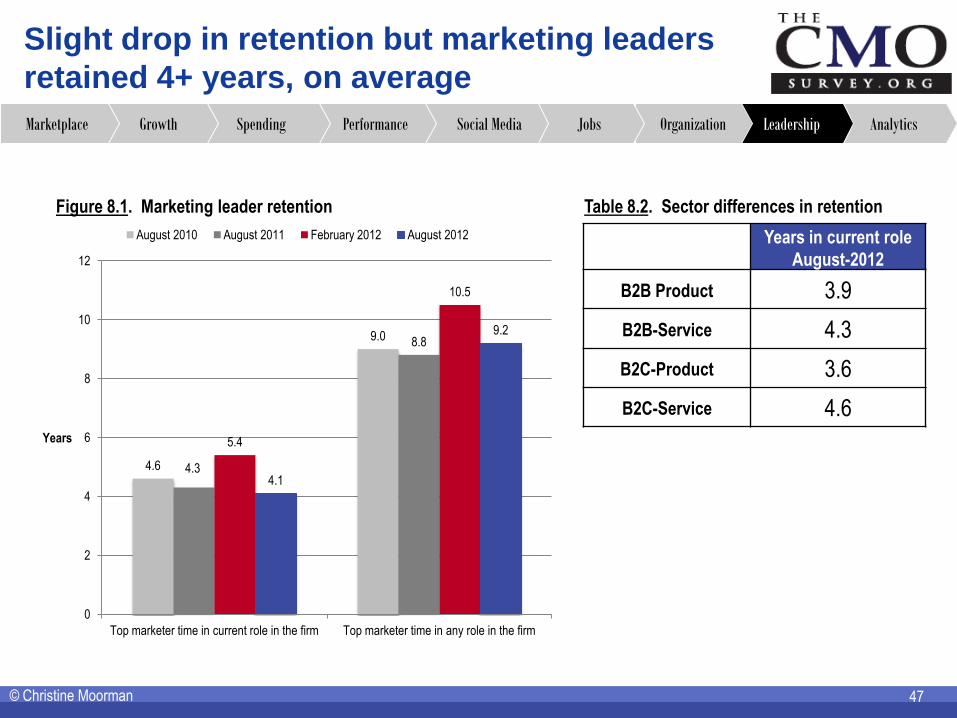
Slight drop in retention but marketing leaders
retained 4+ years, on average
47 © Christine Moorman
Figure 8.1. Marketing leader retention ), and 2009 (34.7 months).
Table 8.2. Sector differences in retention
Years in current role
August-2012
B2B Product 3.9
B2B-Service 4.3
B2C-Product 3.6
B2C-Service 4.6
Analytics Leadership Organization Jobs Social Media Performance Spending Growth Marketplace
4.6
9.0
4.3
8.8
5.4
10.5
4.1
9.2
0
2
4
6
8
10
12
Top marketer time in current role in the firm Top marketer time in any role in the firm
Years
August 2010 August 2011 February 2012 August 2012
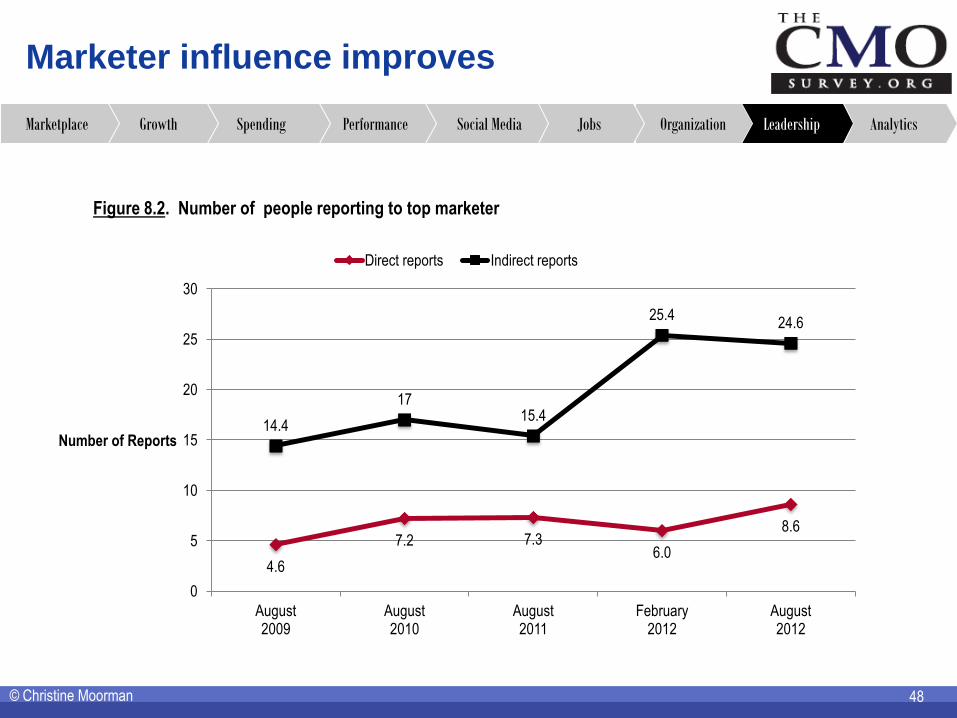
Marketer influence improves
48 © Christine Moorman
Figure 8.2. Number of people reporting to top marketer
Analytics Leadership Organization Jobs Social Media Performance Spending Growth Marketplace
4.6
7.2 7.3 6.0
8.6
14.4
17 15.4
25.4 24.6
0
5
10
15
20
25
30
August 2009
August 2010
August 2011
February 2012
August 2012
Number of Reports
Direct reports Indirect reports
49 © Christine Moorman
Best Practice from Marketing Leaders: See full interviews at www.cmosurvey.org/cmo-insights/
Analytics Leadership Organization Jobs Social Media Performance Spending Growth Marketplace
Chief Marketing Officer Kim Feil discusses how she built a marketing function. From insights to
accountability, she describes the organization, processes, metrics, and talent management strategies
important to this effort.
Executive Vice President and Chief Marketing Officer Geert van Kuyck shares ideas on building the
essential skill set for CMOs and the importance of defining the CMO’s mission. He discusses the use of
the Net Promoter Score and other metrics to evaluate business results at Philips, touching on Philips’
engagement with LinkedIn and social media metrics.
Executive Vice President and Chief Marketing Officer Stephen Quinn describes how Walmart rebuilt its
customer focus. Key steps involved harnessing internal support, generating market insight, using
customer-focused metrics, living the brand internally, and building marketing talent.
Global Marketing Officer Marc Pritchard shares his viewpoints on how marketing contributes to P&G’s
performance. He talks about how P&G learns about customers and how it is relentless in its attention to
building loyal customers and strong brands in the store, on the web, and around the world.

50
Topic 9:
Marketing Analytics
50
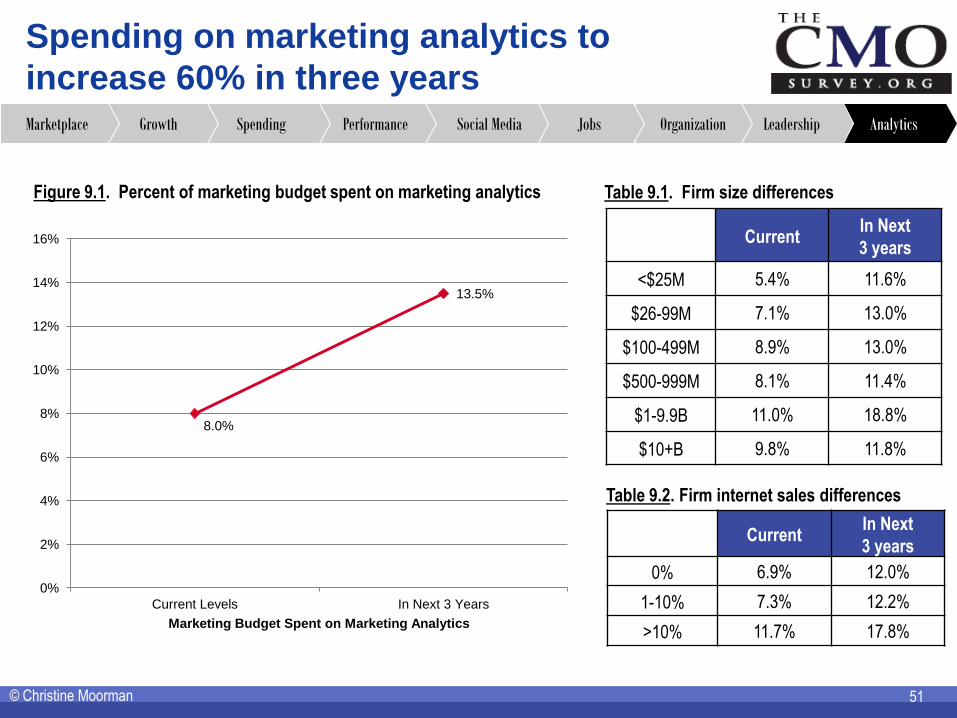
Spending on marketing analytics to
increase 60% in three years
51 © Christine Moorman
Figure 9.1. Percent of marketing budget spent on marketing analytics
Analytics Leadership Organization Jobs Social Media Performance Spending Growth Marketplace
Current In Next
3 years
<$25M 5.4% 11.6%
$26-99M 7.1% 13.0%
$100-499M 8.9% 13.0%
$500-999M 8.1% 11.4%
$1-9.9B 11.0% 18.8%
$10+B 9.8% 11.8%
Table 9.1. Firm size differences
8.0%
13.5%
0%
2%
4%
6%
8%
10%
12%
14%
16%
Current Levels In Next 3 Years
Marketing Budget Spent on Marketing Analytics
Table 9.2. Firm internet sales differences
Current In Next
3 years
0% 6.9% 12.0%
1-10% 7.3% 12.2%
>10% 11.7% 17.8%
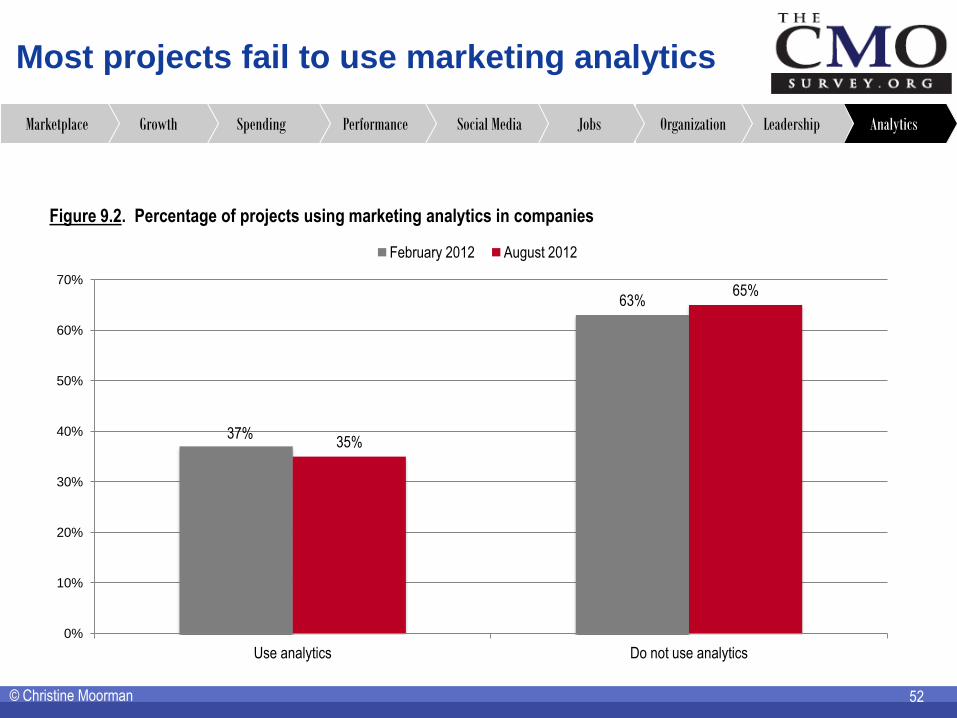
Most projects fail to use marketing analytics
52 © Christine Moorman
Figure 9.2. Percentage of projects using marketing analytics in companies
Analytics Leadership Organization Jobs Social Media Performance Spending Growth Marketplace
37%
63%
35%
65%
0%
10%
20%
30%
40%
50%
60%
70%
Use analytics Do not use analytics
February 2012 August 2012
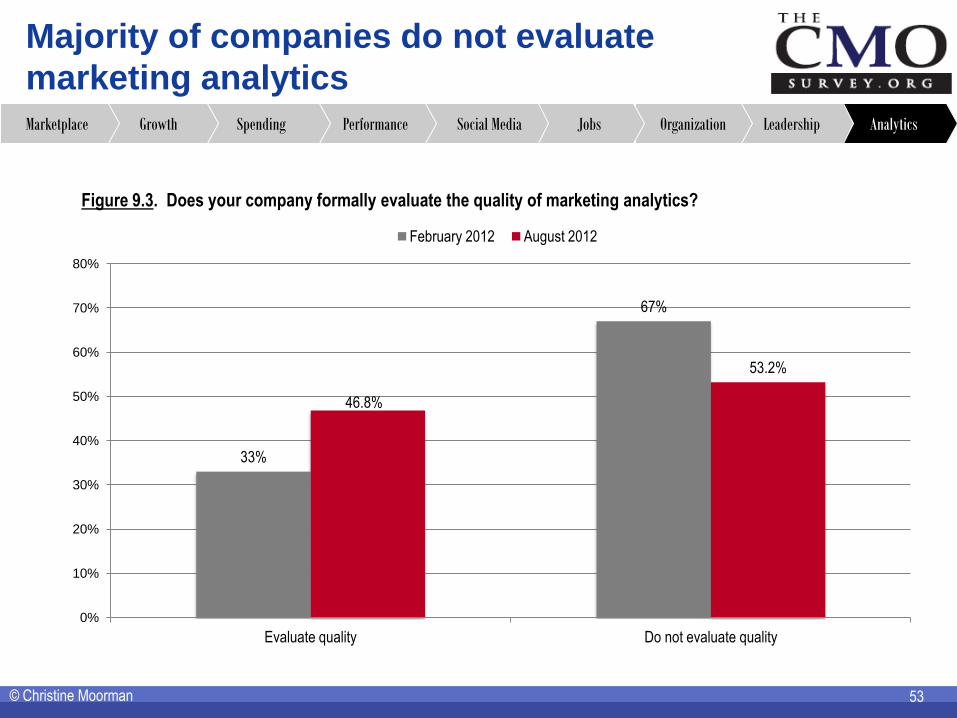
Majority of companies do not evaluate
marketing analytics
53 © Christine Moorman
Figure 9.3. Does your company formally evaluate the quality of marketing analytics?
Analytics Leadership Organization Jobs Social Media Performance Spending Growth Marketplace
33%
67%
46.8%
53.2%
0%
10%
20%
30%
40%
50%
60%
70%
80%
Evaluate quality Do not evaluate quality
February 2012 August 2012
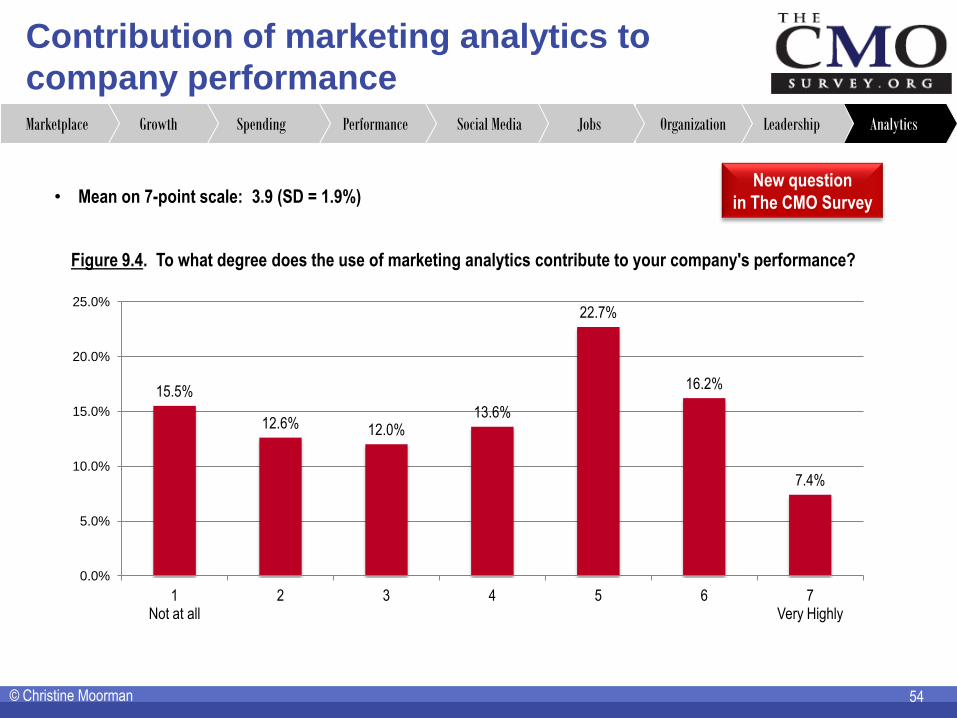
Contribution of marketing analytics to
company performance
54 © Christine Moorman
Figure 9.4. To what degree does the use of marketing analytics contribute to your company's performance?
Analytics Leadership Organization Jobs Social Media Performance Spending Growth Marketplace
• Mean on 7-point scale: 3.9 (SD = 1.9%) New question
in The CMO Survey
15.5%
12.6% 12.0% 13.6%
22.7%
16.2%
7.4%
0.0%
5.0%
10.0%
15.0%
20.0%
25.0%
1 Not at all
2 3 4 5 6 7 Very Highly
Preview
55
Next survey: The CMO Survey will be administered in February 2013
To participate: Sign up at http://www.cmosurvey.org/participate/
Media: Press releases and coverage will be posted to http://www.cmosurvey.org/category/news/
Feedback: Send comments to [email protected]
© Christine Moorman