highland floating rate opportunities fund · term loan b-2, 1-month libor + 3.250% 08/12/2023........
TRANSCRIPT

Highland Floating Rate Opportunities Fund
Semi-Annual ReportDecember 31, 2017
Highland Floating Rate Opportunities Fund
TABLE OF CONTENTS
Fund Profile . . . . . . . . . . . . . . . . . . . . . . . . . . . . . . . . . . . . . . . . . . . . . . . . . . . . . . . . . . . . . . . . . . . . . . . . . . . . . . . . . . . . . . . . . . . . . . . . . . . 1Financial Statements. . . . . . . . . . . . . . . . . . . . . . . . . . . . . . . . . . . . . . . . . . . . . . . . . . . . . . . . . . . . . . . . . . . . . . . . . . . . . . . . . . . . . . . . . 2
Investment Portfolio . . . . . . . . . . . . . . . . . . . . . . . . . . . . . . . . . . . . . . . . . . . . . . . . . . . . . . . . . . . . . . . . . . . . . . . . . . . . . . . . . . . . . . . 3Statements of Assets and Liabilities . . . . . . . . . . . . . . . . . . . . . . . . . . . . . . . . . . . . . . . . . . . . . . . . . . . . . . . . . . . . . . . . . . . . . . 11Statements of Operations . . . . . . . . . . . . . . . . . . . . . . . . . . . . . . . . . . . . . . . . . . . . . . . . . . . . . . . . . . . . . . . . . . . . . . . . . . . . . . . . . 12Statements of Changes in Net Assets . . . . . . . . . . . . . . . . . . . . . . . . . . . . . . . . . . . . . . . . . . . . . . . . . . . . . . . . . . . . . . . . . . . . 13Financial Highlights. . . . . . . . . . . . . . . . . . . . . . . . . . . . . . . . . . . . . . . . . . . . . . . . . . . . . . . . . . . . . . . . . . . . . . . . . . . . . . . . . . . . . . . . 15
Notes to Financial Statements. . . . . . . . . . . . . . . . . . . . . . . . . . . . . . . . . . . . . . . . . . . . . . . . . . . . . . . . . . . . . . . . . . . . . . . . . . . . . . . 16Additional Information . . . . . . . . . . . . . . . . . . . . . . . . . . . . . . . . . . . . . . . . . . . . . . . . . . . . . . . . . . . . . . . . . . . . . . . . . . . . . . . . . . . . . . . 31Important Information About This Report . . . . . . . . . . . . . . . . . . . . . . . . . . . . . . . . . . . . . . . . . . . . . . . . . . . . . . . . . . . . . . . . . . . 34
Economic and market conditions change frequently.There is no assurance that the trends described in this report will continue or commence.
A prospectus must precede or accompany this report. Please read the prospectus carefully before you invest.

FUND PROFILE (unaudited)
As of December 31, 2017 Highland Floating Rate Opportunities Fund
Objective
Highland Floating Rate Opportunities Fund seeks to provide a high level of current income, consistentwith preservation of capital. In November 2017, the fund converted from an open-end fund to aclosed-end fund (as further discussed in Note 1 of the financial statements).
Net Assets as of December 31, 2017
$1,082.6 million
Portfolio Data as of December 31, 2017
The information below provides a snapshot of Highland Floating Rate Opportunities Fund at the endof the reporting period. Highland Floating Rate Opportunities Fund is actively managed and thecomposition of its portfolio will change over time. Current and future holdings are subject to risk.
Quality Breakdown as of 12/31/2017 (%)(1)
A (0.5)
BBB 1.2
BB 14.2
B 37.6
CCC or Lower 11.1
Not Rated 20.1
Top 5 Sectors as of 12/31/2017 (%)(2)(3)
Financial 18.2(4)
Energy 10.7
Healthcare 10.4
Retail 8.0
Service 7.0
Top 10 Holdings as of 12/31/2017 (%)(2)(3)
Metro-Goldwyn-Mayer, Inc. (Common Stocks) 4.8
CCS Medical, Inc. 11.50%, 03/31/18 (U.S. Senior Loans) 2.4
Vistra Energy Corp. (Common Stocks) 1.9
Enterprise Products Partners LP (Master Limited Partnerships) 1.9
Intelsat Jackson Holdings SA 5.21%, 11/27/23 (Foreign Denominated orDomiciled Senior Loans) 1.6
Weight Watchers International, Inc. 6.23%, 11/29/24 (U.S. Senior Loans) 1.4
Lightstone Holdco LLC 6.07%, 01/30/24 (U.S. Senior Loans) 1.3
Dynegy Inc. 4.25%, 02/07/24 (U.S. Senior Loans) 1.3
USI, Inc. 4.69%, 05/16/24 (U.S. Senior Loans) 1.3
Jo-Ann Stores, Inc. 6.55%, 10/20/23 (U.S. Senior Loans) 1.3
(1) Quality is calculated as a percentage of total bonds & notes. Sectors and holdings are calculated as a percentage of total netassets. The quality ratings reflected were issued by Standard & Poors, a nationally recognized statistical rating organization.Ratings are measured on a scale that generally ranges from AAA (highest) to D (lowest). Quality ratings reflect the credit qual-ity of the underlying bonds in the Fund’s portfolio and not that of the Fund itself. Quality Ratings are subject to change.
(2) Sectors and holdings are calculated as a percentage of total net assets.
(3) Excludes the Fund’s investment in an investment company purchased with cash collateral from securities lending and cashequivalent investments.
(4) Includes Collateralized Loan Obligations.
Semi-Annual Report 1

FINANCIAL STATEMENTS
December 31, 2017 Highland Floating Rate Opportunities Fund
A guide to understanding the Fund’s financial statements
Investment Portfolio The Investment Portfolio details all of the Fund’s holdings and their value asof the last day of the reporting period. Portfolio holdings are organized bytype of asset and industry to demonstrate areas of concentration anddiversification.
Statement of Assets and Liabilities This statement details the Fund’s assets, liabilities, net assets and commonshare price as of the last day of the reporting period. Net assets arecalculated by subtracting all the Fund’s liabilities (including any unpaidexpenses) from the total of the Fund’s investment and non-investmentassets. The net asset value per common share is calculated by dividing netassets by the number of common shares outstanding as of the last day ofthe reporting period.
Statement of Operations This statement reports income earned by the Fund and the expensesaccrued by the Fund during the reporting period. The Statement ofOperations also shows any net gain or loss the Fund realized on the salesof its holdings during the period as well as any unrealized gains or lossesrecognized over the period. The total of these results represents the Fund’snet increase or decrease in net assets from operations applicable tocommon shareholders.
Statement of Changes in Net Assets This statement detail how the Fund’s net assets were affected by itsoperating results, distributions to common shareholders and shareholdertransactions from common shares (e.g., subscriptions, redemptions anddistribution reinvestments) during the reporting period. The Statement ofChanges in Net Assets also detail changes in the number of commonshares outstanding.
Statement of Cash Flows(if applicable)
This statement reports net cash and foreign currency provided or used byoperating, investing and financing activities and the net effect of thoseflows on cash and foreign currency during the period.
Financial Highlights The Financial Highlights demonstrate how the Fund’s net asset value percommon share was affected by the Fund’s operating results. The FinancialHighlights also disclose the Fund’s performance and certain key ratios (e.g.,net expenses and net investment income as a percentage of average netassets).
Notes to Financial Statements These notes disclose the organizational background of the Fund, itssignificant accounting policies (including those surrounding securityvaluation, income recognition and distributions to shareholders), federal taxinformation, fees and compensation paid to affiliates and significant risksand contingencies.
2 Semi-Annual Report

INVESTMENT PORTFOLIO (unaudited)
As of December 31, 2017 Highland Floating Rate Opportunities Fund
Principal Amount ($) Value ($)
U.S. Senior Loans (a) - 62.3%AEROSPACE - 1.3%
5,204,589
Engility CorporationTerm Loan B-2, 1-month LIBOR +3.250% 08/12/2023 . . . . . . . . . . . . . . . . . . . . . 5,262,334
1,970,063
TransDigm, Inc.Term Loan F, 1-month LIBOR +2.750% 06/09/2023 . . . . . . . . . . . . . . . . . . . . . 1,975,253
3,932,480Term Loan E, 1-month LIBOR +2.750% 05/14/2022 . . . . . . . . . . . . . . . . . . . . . 3,948,347
2,992,481Term Loan G3.00%, 08/22/2024 . . . . . . . . . . . . . . . . . . . . . . 3,010,152
14,196,086
CHEMICALS - 0.1%
1,375,000
Minerals Technologies, Inc.Fixed Rate Term Loan4.75%, 05/09/2021 . . . . . . . . . . . . . . . . . . . . . . 1,397,344
1,397,344
CONSUMER DISCRETIONARY - 2.3%
10,823,613
Truck Hero, Inc.First Lien Term Loan, 3-month LIBOR +4.000% 04/21/2024 . . . . . . . . . . . . . . . . . . . . . 10,838,874
1,666,667Second Lien Term Loan, 3-monthLIBOR + 8.250% 04/21/2025. . . . . . . . . . . . 1,679,166
12,552,623
USS Ultimate Holdings, Inc.First Lien Term Loan, 1-month LIBOR +3.750% 08/25/2024 . . . . . . . . . . . . . . . . . . . . . 12,652,040
25,170,080
CONSUMER PRODUCTS - 2.1%
3,402,505
Dayco Products, LLCTerm Loan B, 3-month LIBOR +5.000% 05/19/2023 . . . . . . . . . . . . . . . . . . . . . 3,440,784
8,000,000
KIK Custom Products, Inc.Term Loan B, 3-month LIBOR +4.500% 08/26/2022 . . . . . . . . . . . . . . . . . . . . . 8,064,000
11,355,784
Laureate Education, Inc.Term Loan B, 3-month LIBOR +4.500% 04/26/2024 . . . . . . . . . . . . . . . . . . . . . 11,471,726
22,976,510
ENERGY - 4.9%
12,583,568
Azure Midstream Energy LLCTerm Loan B, 3-month LIBOR +6.500% 11/15/2018 . . . . . . . . . . . . . . . . . . . . . 11,391,904
11,946,657
Chief Exploration & Development LLCSecond Lien Term Loan, 3-monthLIBOR + 6.500% 05/16/2021. . . . . . . . . . . . 11,777,433
10,000,000
Fairmount Santrol, Inc.Term Loan B, 3-month LIBOR +6.000% 11/01/2022 . . . . . . . . . . . . . . . . . . . . . 10,140,000
1,726,689
Fieldwood Energy LLCFirst Lien Term Loan, 3-month LIBOR +7.000% 08/31/2020 . . . . . . . . . . . . . . . . . . . . . 1,573,445
10,349,097First Lien Last Out Term Loan, 3-monthLIBOR + 7.125% 09/30/2020. . . . . . . . . . . . 7,261,651
Principal Amount ($) Value ($)
ENERGY (continued)
10,754,221
Traverse Midstream Partners LLCTerm Loan, 6-month LIBOR +4.000% 09/27/2024 . . . . . . . . . . . . . . . . . . . . . 10,911,502
53,055,935
FINANCIAL - 5.9%
6,956,751
AssuredPartners, Inc.First Lien Term Loan, 1-monthLIBOR + 3.500% 10/22/2024. . . . . . . . . . . . 7,010,387
2,020,202
Duff & Phelps CorporationFirst Lien Term Loan, 3-month LIBOR +3.250% 10/14/2024 . . . . . . . . . . . . . . . . . . . . . 2,028,253
8,744,867
GTCR Valor Companies, Inc.Term Loan B1, 3-month LIBOR +4.250% 06/16/2023 . . . . . . . . . . . . . . . . . . . . . 8,861,480
3,601,086
LBM Borrower, LLCFirst Lien Term Loan, 2-month LIBOR +4.500% 08/19/2022 . . . . . . . . . . . . . . . . . . . . . 3,652,473
11,405,983
NFP Corp.Term Loan B, 1-month LIBOR +3.500% 01/08/2024 . . . . . . . . . . . . . . . . . . . . . 11,480,122
8,981,872
Ocwen Loan Servicing LLCTerm Loan B, 1-month LIBOR +5.000% 12/05/2020 . . . . . . . . . . . . . . . . . . . . . 9,025,389
11,109,845
Russell Investment GroupTerm Loan B, 3-month LIBOR +4.250% 06/01/2023 . . . . . . . . . . . . . . . . . . . . . 11,189,670
10,915,704
Walter Investment Management Corp.Tranche B Term Loan B, 1-monthLIBOR + 3.750% 12/18/2020. . . . . . . . . . . . 10,468,870
63,716,644
FOOD & DRUG - 0.9%
6,201,209
Supervalu, Inc.Term Loan B, 1-month LIBOR +3.500%06/08/2024 . . . . . . . . . . . . . . . . . . . . . 6,077,185
3,720,726Delayed Draw Term Loan, 1-month
LIBOR + 3.500% 06/08/2024. . . . . . . . . . . . 3,646,311
9,723,496
GAMING & LEISURE - 1.3%
49,138,954Ginn-LA CS Borrower LLC
First Lien Tranche B Term Loan (l)(c) . . . . 1
22,925,890First Lien Tranche A Credit-LinkedDeposit (l)(c) . . . . . . . . . . . . . . . . . . . . . . . . . . . . . . —
11,940,100LLV Holdco LLC
Exit Revolver (g)(l)(c). . . . . . . . . . . . . . . . . . . . . . 9,136,565
4,981,140
Scientific Games International, Inc.Term Loan B, 2-month LIBOR +3.250% 08/14/2024 . . . . . . . . . . . . . . . . . . . . . 5,027,489
14,164,055
HEALTHCARE - 7.6%
2,000,000
Akorn, Inc.Term Loan B, 1-month LIBOR +4.250% 04/16/2021 . . . . . . . . . . . . . . . . . . . . . 2,010,000
46,236,114
CCS Medical, Inc.First Lien Term Loan, PRIME +7.000% 03/31/2018 (c)(g) . . . . . . . . . . . . . . . 25,568,571
See Glossary on page 10 for abbreviations along with accompanying Notes to Financial Statements. 3

INVESTMENT PORTFOLIO (unaudited) (continued)
As of December 31, 2017 Highland Floating Rate Opportunities Fund
Principal Amount ($) Value ($)
U.S. Senior Loans (continued)HEALTHCARE (continued)
9,384,443
Quorum Health CorporationTerm Loan B, 1-month LIBOR +6.750% 04/29/2022 . . . . . . . . . . . . . . . . . . . . . 9,501,748
9,718,472
RadNet, Inc.Reprice Term Loan, 3-month LIBOR +3.750% 06/30/2023 . . . . . . . . . . . . . . . . . . . . . 9,867,311
11,053,216
Surgery Center Holdings, Inc.Term Loan B, 1-month LIBOR +3.250% 09/02/2024 (j). . . . . . . . . . . . . . . . . . . 10,956,500
13,410,448
U.S. Renal Care, Inc.Term Loan B, 3-month LIBOR +4.250% 12/31/2022 . . . . . . . . . . . . . . . . . . . . . 13,242,818
10,808,937
Valeant Pharmaceuticals International,Inc.Term Loan B, 1-month LIBOR +3.500% 04/01/2022 . . . . . . . . . . . . . . . . . . . . . 10,975,340
82,122,288
HOUSING - 2.8%
5,663,298
84 Lumber CompanyTerm Loan B, 1-month LIBOR +5.250% 10/25/2023 . . . . . . . . . . . . . . . . . . . . . 5,730,550
9,513,367
Builders FirstSource, Inc.Term Loan B, 3-month LIBOR +3.000% 02/29/2024 . . . . . . . . . . . . . . . . . . . . . 9,563,170
3,634,079
Capital Automotive LPFirst Lien Term Loan, 1-month LIBOR +2.500% 03/24/2024 . . . . . . . . . . . . . . . . . . . . . 3,648,616
2,296,581Second Lien Term Loan, 1-monthLIBOR + 6.000%03/24/2025 . . . . . . . . . . . . 2,365,478
8,000,000EH/Transeastern LLC/TE TOUSA
Term Loan (c)(l) . . . . . . . . . . . . . . . . . . . . . . . . . . 4,286,400
1,743,503Nevada Land Group LLC
First Lien Initial Term Loan (c)(g)(l) . . . . . . —
4,187,365
Quikrete Holdings, Inc.First Lien Term Loan, 1-month LIBOR +2.750% 11/15/2023 . . . . . . . . . . . . . . . . . . . . . 4,200,932
29,795,146
INDUSTRIALS - 3.4%
7,067,138
Aquilex Holdings LLCFirst Lien Term Loan 3-month LIBOR +4.250% 10/03/2024 . . . . . . . . . . . . . . . . . . . . . 7,173,145
4,000,000Second Lien Term Loan 3-monthLIBOR + 8.500%10/03/2025 . . . . . . . . . . . . 3,945,000
4,639,344
Core & Main LPTerm Loan B 6-month LIBOR +3.000% 08/01/2024 . . . . . . . . . . . . . . . . . . . . . 4,681,400
7,304,253
Omnimax International, Inc.Unsecured Term Loan 2.000% Cash,14.000% PIK 02/06/2021 (c) . . . . . . . . . . . . 7,260,428
7,980,000
Hayward Industries, Inc.First Lien Term Loan 1-month LIBOR +3.500% 08/05/2024 . . . . . . . . . . . . . . . . . . . . . 8,009,925
5,992,366
SRS Distribution Inc.Term Loan B 1-week LIBOR +3.250% 08/25/2022 . . . . . . . . . . . . . . . . . . . . . 6,031,706
37,101,604
Principal Amount ($) Value ($)
INFORMATION TECHNOLOGY - 3.2%
4,362,692
CCC Information Services, Inc.First Lien Term Loan, 1-month LIBOR +3.000% 04/27/2024 . . . . . . . . . . . . . . . . . . . . . 4,375,235
9,660,201
Kronos IncorporatedTerm Loan B, 3-month LIBOR +3.500% 11/01/2023 . . . . . . . . . . . . . . . . . . . . . 9,735,696
4,800,000Second Lien Term Loan, 3-monthLIBOR + 8.250%11/01/2024 . . . . . . . . . . . . 4,993,200
5,857,802
LANDesk Group, Inc.Term Loan B, 1-month LIBOR +4.250% 01/20/2024 . . . . . . . . . . . . . . . . . . . . . 5,586,879
9,677,529
NeuStar, Inc.Term Loan B2, 3-month LIBOR +3.750% 08/08/2024 . . . . . . . . . . . . . . . . . . . . . 9,785,192
34,476,202
MANUFACTURING - 2.6%
5,145,316
Doncasters U.S. Finance LLCTerm Loan B, 3-month LIBOR +3.500% 04/09/2020 . . . . . . . . . . . . . . . . . . . . . 4,994,635
1,440,290Second Lien Term Loan, 3-monthLIBOR + 8.250% 10/09/2020. . . . . . . . . . . . 1,362,515
6,671,662
Filtration Group Corp.First Lien Term Loan, 3-month LIBOR +3.000% 11/21/2020 . . . . . . . . . . . . . . . . . . . . . 6,737,344
5,733,333
VC GB Holdings, Inc.Second Lien Term Loan, 1-monthLIBOR + 8.000% 02/28/2025. . . . . . . . . . . . 5,797,833
8,701,281First Lien Term Loan, 1-month LIBOR +3.250% 02/28/2024 . . . . . . . . . . . . . . . . . . . . . 8,761,103
27,653,430
MATERIALS - 0.4%
3,979,792
Kraton Polymers, LLCTerm Loan, 1-month LIBOR +3.000% 01/06/2022 . . . . . . . . . . . . . . . . . . . . . 4,026,833
4,026,833
MEDIA & TELECOMMUNICATIONS - 2.2%
8,696,426
Fort Dearborn CompanyFirst Lien Term Loan, 3-month LIBOR +4.000% 10/19/2023 . . . . . . . . . . . . . . . . . . . . . 8,715,471
13,571,429
iHeartCommunications, Inc.Term Loan D, 3-month LIBOR +6.750% 01/30/2019 . . . . . . . . . . . . . . . . . . . . . 10,218,132
4,970,074
Univision Communications, Inc.Term Loan C-5, 1-month LIBOR +2.750% 03/15/2024 . . . . . . . . . . . . . . . . . . . . . 4,961,103
23,894,706
METALS & MINERALS - 1.7%
10,297,054
MacDermid, Inc.Term Loan B-6, 1-month LIBOR +3.000% 06/07/2023 . . . . . . . . . . . . . . . . . . . . . 10,362,698
8,272,782
Peabody Energy CorporationExit Term Loan, 1 Week LIBOR +3.500% 03/31/2022 . . . . . . . . . . . . . . . . . . . . . 8,396,873
18,759,571
4 See Glossary on page 10 for abbreviations along with accompanying Notes to Financial Statements.

INVESTMENT PORTFOLIO (unaudited) (continued)
As of December 31, 2017 Highland Floating Rate Opportunities Fund
Principal Amount ($) Value ($)
U.S. Senior Loans (continued)RETAIL - 6.9%
17,145,274
Academy, Ltd.Term Loan B, 3-month LIBOR +4.000% 07/01/2022 . . . . . . . . . . . . . . . . . . . . . 13,576,914
10,941,314
Harbor Freight Tools USA, Inc.Term Loan B, 1-month LIBOR +3.250% 08/18/2023 . . . . . . . . . . . . . . . . . . . . . 11,028,954
7,879,085
J.C. Penney Corporation, Inc.Term Loan B, 3-month LIBOR +4.250% 06/23/2023 . . . . . . . . . . . . . . . . . . . . . 7,388,612
14,078,797
Jo-Ann Stores, Inc.Term Loan, 3-month LIBOR +5.000% 10/20/2023 . . . . . . . . . . . . . . . . . . . . . 13,621,237
7,967,286
Leslie’s Poolmart, Inc.Tranche B Term Loan, 2-monthLIBOR + 3.750% 08/16/2023. . . . . . . . . . . . 7,958,044
9,001,502Men’s Wearhouse, Inc. (The)
2015 Term Loan 5.00%, 06/18/2021 . . . 8,950,868
14,988,683Toys ‘R’ Us-Delaware, Inc.
Term Loan B-4 (e)(l) . . . . . . . . . . . . . . . . . . . . . . 7,419,398
4,329,245Term Loan B4, 1-month LIBOR +8.750% 01/18/2019 . . . . . . . . . . . . . . . . . . . . . 4,446,134
74,390,161
SERVICE - 7.0%
6,790,878
Advantage Sales & Marketing, Inc.First Lien Term Loan, 3-month LIBOR +3.250% 07/23/2021 . . . . . . . . . . . . . . . . . . . . . 6,638,083
13,710,000Second Lien Term Loan, 3-monthLIBOR + 6.500% 07/25/2022. . . . . . . . . . . . 12,887,400
450,395
EnergySolutions LLCTerm Loan, 3-month LIBOR +4.750% 05/29/2020 . . . . . . . . . . . . . . . . . . . . . 457,151
11,769,065
Parexel International CorporationTerm Loan B, 1-month LIBOR +3.000% 09/27/2024 . . . . . . . . . . . . . . . . . . . . . 11,835,266
9,193,901
Spin Holdco Inc.Term Loan B, 2-monthLIBOR + 3.750% 11/14/2022. . . . . . . . . . . . 9,274,347
13,786,384
USI, Inc.Repriced Term Loan, 3-month LIBOR +3.000% 05/16/2024 . . . . . . . . . . . . . . . . . . . . . 13,786,384
4,736,331
WASH Multifamily Laundry Systems LLCFirst Lien Term Loan, 1-month LIBOR +3.250% 05/14/2022 . . . . . . . . . . . . . . . . . . . . . 4,748,172
759,924First Lien Term Loan, 1-month LIBOR +3.250% 05/14/2022 . . . . . . . . . . . . . . . . . . . . . 761,824
15,400,000
Weight Watchers International, Inc.1-month LIBOR +4.750% 11/29/2024 . . . . . . . . . . . . . . . . . . . . . 15,521,968
75,910,595
TRANSPORTATION - 0.9%
9,500,169
Gruden Acquisition, Inc.Term Loan, 3-month LIBOR +5.500% 08/18/2022 . . . . . . . . . . . . . . . . . . . . . 9,539,785
9,539,785
Principal Amount ($) Value ($)
UTILITIES - 4.8%
13,946,989Dynegy Inc.
Term Loan C2 4.25%, 02/07/2024. . . . . . 14,030,322
9,596,075
Granite Acquisition, Inc.Term Loan B, 3-month LIBOR +3.500% 12/19/2021 . . . . . . . . . . . . . . . . . . . . . 9,713,051
383,266Term Loan C, 3-month LIBOR +3.500% 12/19/2021 . . . . . . . . . . . . . . . . . . . . . 387,938
2,319,304Second Lien Term Loan B, 3-monthLIBOR + 7.250% 12/19/2022. . . . . . . . . . . . 2,335,539
14,472,689
Lightstone Holdco LLCInitial Term Loan B, 1-month LIBOR +4.500% 01/30/2024 . . . . . . . . . . . . . . . . . . . . . 14,559,380
918,974Initial Term Loan C, 1-month LIBOR +4.500% 01/30/2024 . . . . . . . . . . . . . . . . . . . . . 924,478
59,127,210
Texas Competitive Electric Holdings Co.,LLCNon Extended Escrow Loan (b) . . . . . . . . . 153,731
9,941,694
Vistra Operations Company LLCTerm Loan B-2, 1-month LIBOR +2.750% 12/14/2023 (j). . . . . . . . . . . . . . . . . . . 10,024,260
52,128,699
Total U.S. Senior Loans(Cost $791,333,494) . . . . . . . . . . . . . . . . . . 674,199,170
Foreign Denominated or Domiciled Senior Loans - 6.3%CANADA - 2.0%
10,191,862
Husky Injection Molding Systems, Ltd.and Yukon Acquisition, Inc.New Term Loan, 1-month LIBOR +3.250% 06/30/2021 . . . . . . . . . . . . . . . . . . . . . 10,254,847
7,980,000
Sandvine CorporationTerm Loan B, 3-month LIBOR +5.750% 09/21/2022 . . . . . . . . . . . . . . . . . . . . . 7,730,625
3,910,351
Telesat CanadaTerm Loan B4, 3-month LIBOR +3.000% 11/17/2023 . . . . . . . . . . . . . . . . . . . . . 3,932,953
21,918,425
LUXEMBOURG - 4.3%
1,934,740
Auris Luxembourg III S.a.r.l.Term Loan B-7, 3-month LIBOR +3.000% 01/17/2022 . . . . . . . . . . . . . . . . . . . . . 1,953,187
12,958,795
Endo Luxembourg Finance Company IS.a r.l.Term Loan B, 1-month LIBOR +4.250% 04/29/2024 . . . . . . . . . . . . . . . . . . . . . 13,060,068
10,545,526
Evergreen Skills Lux S.a.r.l.First Lien Initial Term Loan, 1-monthLIBOR + 4.750%04/28/2021 . . . . . . . . . . . . 10,182,075
4,000,000
Second Lien Initial Term Loan,1-month LIBOR +8.250% 04/28/2022 . . . . . . . . . . . . . . . . . . . . . 3,568,340
17,593,583
Intelsat Jackson Holdings SATerm Loan B3, 3-month LIBOR +3.750% 11/27/2023 . . . . . . . . . . . . . . . . . . . . . 17,263,703
46,027,373
Total Foreign Denominated orDomiciled Senior Loans(Cost $67,727,132) . . . . . . . . . . . . . . . . . . . . 67,945,798
See Glossary on page 10 for abbreviations along with accompanying Notes to Financial Statements. 5

INVESTMENT PORTFOLIO (unaudited) (continued)
As of December 31, 2017 Highland Floating Rate Opportunities Fund
Principal Amount ($) Value ($)
Collateralized Loan Obligations (d)(i) - 12.3%
750,000
Acis CLO, Ltd.Series 2014-4A, Class D, 3M USD LIBOR+ 3.100%, FRN 05/01/2026 (p) . . . . . . . . . . . 746,250
3,000,000Series 2014-3A, Class D, 3M USD LIBOR+ 3.120%, FRN 02/01/2026 (p) . . . . . . . . . . . 3,001,689
1,000,000Series 2015-6A, Class D, 3M USD LIBOR+ 3.770%, FRN 05/01/2027 (p) . . . . . . . . . . . 1,000,200
7,000,000Series 2014-5A, Class D, 3M USD LIBOR+ 4.340%, FRN 11/01/2026 (p) . . . . . . . . . . . 7,003,500
2,250,000Series 2014-4A, Class E, 3M USD LIBOR+ 4.800%, FRN 05/01/2026 (p) . . . . . . . . . . . 2,216,250
2,000,000Series 2015-6A, Class E, 3M USD LIBOR+ 5.490%, FRN 05/01/2027 (p) . . . . . . . . . . . 1,940,000
3,000,000Series 2013-1A, Class E, 3M USD LIBOR+ 5.600%, FRN 04/18/2024 (p) . . . . . . . . . . . 3,003,375
1,000,000
Apidos CLOSeries 2013-12A, Class F, 3M USD LIBOR+ 4.900%, FRN 04/15/2025. . . . . . . . . . . . . . . 973,500
3,125,000
Ares XXIX CLO, Ltd.Series 2014-1A, Class D, 3M USD LIBOR+ 4.800%, FRN 04/17/2026. . . . . . . . . . . . . . . 3,107,422
6,500,000
Ares XXVIII CLO, Ltd.Series 2013-3A, Class E, 3M USD LIBOR+ 4.900%, FRN 10/17/2024. . . . . . . . . . . . . . . 6,499,350
2,752,500
Atlas Senior Loan Fund III, Ltd.Series 2013-1A, Class ER, FRN7.42%, 11/17/2027 . . . . . . . . . . . . . . . . . . . . . . . 2,759,381
3,500,000
Babson CLO, Ltd.Series 2014-IIA, Class E, 3M USD LIBOR+ 5.000%, FRN 10/17/2026. . . . . . . . . . . . . . . 3,430,000
2,000,000
Birchwood Park CLO, Ltd.Series 2014-1A, Class E1, 3M USD LIBOR+ 5.100%, FRN 07/15/2026. . . . . . . . . . . . . . . 1,970,000
2,500,000
Carlyle Global Market Strategies CLO, Ltd.Series 2029-1 Class 1, FRN6.60%, 01/18/2029 . . . . . . . . . . . . . . . . . . . . . . . 2,500,000
1,000,000
Cathedral Lake CLO, Ltd.Series 2015-3A, Class DR, 3M USD LIBOR+ 4.100%, FRN 07/16/2029. . . . . . . . . . . . . . . 1,015,000
1,500,000
CFIP CLO, Ltd.Series 2017-1A, Class E, FRN7.60%, 01/18/2030 . . . . . . . . . . . . . . . . . . . . . . . 1,496,250
5,250,000
CIFC Funding, Ltd.Series 2013-4A, Class E, 3M USD LIBOR+ 4.750%, FRN 11/27/2024. . . . . . . . . . . . . . . 5,243,700
1,500,000
Covenant Credit Partners CLO III, Ltd.Series 2017-1A, Class E, FRN7.83%, 10/15/2029 . . . . . . . . . . . . . . . . . . . . . . . 1,496,340
2,500,000
Dryden XXV Senior Loan FundSeries 2012-25A, Class ERR, FRN7.18%, 10/15/2027 . . . . . . . . . . . . . . . . . . . . . . . 2,500,000
3,100,000
Eaton Vance Clo 2015-1, Ltd.Series 2015-1A, Class FR, FRN9.45%, 01/20/2030 . . . . . . . . . . . . . . . . . . . . . . . 3,000,089
7,500,000
Figueroa CLO, Ltd.Series 2014-1A, Class E, 3M USD LIBOR+ 5.700%, FRN 01/15/2027. . . . . . . . . . . . . . . 7,474,687
1,500,000Series 2014-1A, Class F, 3M USD LIBOR+ 6.500%, FRN 01/15/2027. . . . . . . . . . . . . . . 1,303,125
Principal Amount ($) Value ($)
3,350,000
Greywolf CLO, Ltd.Series 2014-1A, Class D, 3M USD LIBOR+ 5.100%, FRN 04/22/2026. . . . . . . . . . . . . . . 3,366,750
3,000,000
KVK CLO, Ltd.Series 2015-1A, Class D, 3M USD LIBOR+ 4.000%, FRN 05/20/2027. . . . . . . . . . . . . . . 3,015,000
1,250,000
Mountain View CLO, Ltd.Series 2013-1A, Class ER, FRN9.06%, 10/12/2030 . . . . . . . . . . . . . . . . . . . . . . . 1,248,000
2,600,000
MP CLO VIII, Ltd.Series 2015-2A, Class E, 3M USD LIBOR+ 5.900%, FRN 10/28/2027. . . . . . . . . . . . . . . 2,606,500
7,400,000
Neuberger Berman CLO XX, Ltd.Series 2015-20A, Class FR, FRN9.17%, 01/15/2028 . . . . . . . . . . . . . . . . . . . . . . . 7,400,000
750,000
Oaktree CLO 2015-1, Ltd.Series 2015-1A, Class DR, FRN1.00%, 10/20/2027 . . . . . . . . . . . . . . . . . . . . . . . 750,000
5,000,000
Octagon Loan Funding, Ltd.Series 2014-1A, Class E, 3M USD LIBOR+ 5.200%, FRN 11/18/2026. . . . . . . . . . . . . . . 5,000,000
2,000,000
OFSI Fund VII, Ltd.Series 2014-7A, Class ER, FRN7.60%, 10/18/2026 . . . . . . . . . . . . . . . . . . . . . . . 2,000,000
4,000,000
OHA Credit Partners VIII, Ltd.Series 2013-8A, Class E, 3M USD LIBOR+ 4.400%, FRN 04/20/2025. . . . . . . . . . . . . . . 4,000,000
1,000,000
Palmer Square CLO, Ltd.Series 2015-1A, Class DR, 3M USDLIBOR + 6.200%, FRN 05/21/2029 . . . . . . . 1,001,300
4,550,000Series 2013-1A, Class DR, 3M USD LIBOR+ 5.000%, FRN 05/15/2025. . . . . . . . . . . . . . . 4,552,730
1,000,000
Parallel, Ltd.Series 2015-1A, Class E, 3M USD LIBOR+ 5.150%, FRN 07/20/2027. . . . . . . . . . . . . . . 990,000
1,800,000
Silver Spring CLO, Ltd.Series 2014-1A, Class F, 3M USD LIBOR+ 5.200%, FRN 10/15/2026. . . . . . . . . . . . . . . 1,408,500
1,000,000
Sound Harbor Loan Fund, Ltd.Series 2014-1A, Class D, 3M USD LIBOR+ 7.000%, FRN 10/30/2026. . . . . . . . . . . . . . . 1,001,900
2,000,000
Symphony CLO XIV, Ltd.Series 2014-14A, Class E, 3M USD LIBOR+ 4.600%, FRN 07/14/2026. . . . . . . . . . . . . . . 1,976,800
5,000,000
Thacher Park CLO, Ltd.Series 2014-1A, Class E1, 3M USD LIBOR+ 4.950%, FRN 10/20/2026. . . . . . . . . . . . . . . 4,972,812
5,500,000
TICP CLO I, Ltd.Series 2015-1A, Class E, 3M USD LIBOR+ 5.500%, FRN 07/20/2027. . . . . . . . . . . . . . . 5,527,500
3,250,000
TICP CLO II, Ltd.Series 2014-2A, Class D, 3M USD LIBOR+ 4.750%, FRN 07/20/2026. . . . . . . . . . . . . . . 3,183,375
3,000,000
TICP CLO III, Ltd.Series 2014-3A, Class E1, 3M USDLIBOR + 5.550%, FRN 01/20/2027 . . . . . . . 3,000,000
1,000,000
Tralee CLO III, Ltd.Series 2014-3A, Class ER, FRN7.76%, 10/20/2027 . . . . . . . . . . . . . . . . . . . . . . . 997,500
2,500,000
Wellfleet CLO, Ltd.Series 2017-1A, Class D, 3M USD LIBOR+ 6.050%, FRN 04/20/2029. . . . . . . . . . . . . . . 2,522,750
6 See Glossary on page 10 for abbreviations along with accompanying Notes to Financial Statements.

INVESTMENT PORTFOLIO (unaudited) (continued)
As of December 31, 2017 Highland Floating Rate Opportunities Fund
Principal Amount ($) Value ($)
Collateralized Loan Obligations (continued)
7,000,000Series 2015-1A, Class F, 3M USD LIBOR+ 7.350%, FRN 10/20/2027 . . . . . . . . . . . . . 6,965,000
1,871,937
Westchester CLO, Ltd.Series 2007-1A, Class E, 3M USDLIBOR + 4.300%, FRN 08/01/2022 (p) . . . 1,841,518
Total Collateralized Loan Obligations(Cost $131,053,955) . . . . . . . . . . . . . . . . . . 133,008,043
Corporate Bonds & Notes - 3.4%ENERGY (d) - 0.3%
3,000,000Chesapeake Energy Corp.
8.00%, 06/15/2027 . . . . . . . . . . . . . . . . . . . . . . 2,887,50015,600,000 Ocean Rig UDW, Inc. (c)(d)(l). . . . . . . . . . . . . . . 1,076,400
3,963,900
HEALTHCARE (d) - 1.6%
7,750,000
Ortho-Clinical Diagnostics, Inc./Ortho-Clinical Diagnostics SA6.63%, 05/15/2022 (j)(n) . . . . . . . . . . . . . . . . . 7,827,500
3,364,000Quorum Health Corp.
11.63%, 04/15/2023 (j) . . . . . . . . . . . . . . . . . . 3,300,925
6,201,000Surgery Center Holdings, Inc.
6.75%, 07/01/2025 . . . . . . . . . . . . . . . . . . . . . . 5,890,950
17,019,375
INFORMATION TECHNOLOGY - 0.2%4,571,000 Avaya, Inc. (c)(l) . . . . . . . . . . . . . . . . . . . . . . . . . . . . —
2,259,000Intelsat Jackson Holdings SA
9.75%, 07/15/2025 (d)(n) . . . . . . . . . . . . . . . . 2,179,935
2,179,935
RETAIL (d) - 1.1%
6,973,000Guitar Center, Inc.
6.50%, 04/15/2019 (j) . . . . . . . . . . . . . . . . . . . 6,484,890
4,546,000Neiman Marcus Group, Ltd. LLC
8.00%, 10/15/2021 . . . . . . . . . . . . . . . . . . . . . . 2,637,589
4,000,000PetSmart, Inc.
7.13%, 03/15/2023 . . . . . . . . . . . . . . . . . . . . . . 2,390,000666,000 8.88%, 06/01/2025 . . . . . . . . . . . . . . . . . . . . . . 404,595
11,917,074
TELECOMMUNICATIONS - 0.1%10,939,879 iHeartCommunications, Inc., (l) . . . . . . . . . . . 957,240
UTILITIES - 0.1%
20,000,000Texas Competitive Electric Holdings Co.,
LLC (b) 70,0008,000,000 80,000
150,000
Total Corporate Bonds & Notes(Cost $54,917,009) . . . . . . . . . . . . . . . . . . . . 36,187,524
Shares Value ($)
Claims - 0.0%TELECOMMUNICATIONS (c)(e) - 0.0%
3,791,858Lehman Brothers Commercial Paper LCPI
Claim Facility. . . . . . . . . . . . . . . . . . . . . . . . . . . . . . 52,138
Total Claims(Cost $1,819,529) . . . . . . . . . . . . . . . . . . . . . . . 52,138
Common Stocks - 9.4%ENERGY - 1.8%
20,317 Arch Coal, Inc., Class A (j)(o) . . . . . . . . . . . . . . . . 1,892,732441,000 Kinder Morgan, Inc.. . . . . . . . . . . . . . . . . . . . . . . . . 7,968,870137,025 Targa Resources Corp. . . . . . . . . . . . . . . . . . . . . . 6,634,750
1,118,286 Value Creation, Inc. (c) . . . . . . . . . . . . . . . . . . . . . . 188,000 Williams Cos., Inc. (The). . . . . . . . . . . . . . . . . . . . . 2,683,120
19,179,473
FINANCIAL - 0.0%3,143 Venoco LLA Unit . . . . . . . . . . . . . . . . . . . . . . . . . . . . —
220 Venoco LLC Units . . . . . . . . . . . . . . . . . . . . . . . . . . . —
—
GAMING & LEISURE (c)(f)(g) - 0.0%44 LLV Holdco LLC - Litigation Trust Units . . . . —
34,512LLV Holdco LLC - Series A, Membership
Interest . . . . . . . . . . . . . . . . . . . . . . . . . . . . . . . . . . . . —
436LLV Holdco LLC - Series B, Membership
Interest . . . . . . . . . . . . . . . . . . . . . . . . . . . . . . . . . . . . —
—
HEALTHCARE (c)(f)(g) - 0.0%207,031 CCS Medical, Inc. . . . . . . . . . . . . . . . . . . . . . . . . . . . —
HOUSING (c) - 0.3%1,648,350 Westgate Investments LLC . . . . . . . . . . . . . . . . 3,428,568
INFORMATION TECHNOLOGY (j)(f) - 0.1%80,141 Avaya Holdings Corp. . . . . . . . . . . . . . . . . . . . . . . 1,406,475
MEDIA & TELECOMMUNICATIONS (f)(h) - 4.8%501,736 Metro-Goldwyn-Mayer, Inc., Class A . . . . . . 51,804,242
METALS & MINERALS (c) - 0.5%14,621 Omnimax International, Inc. . . . . . . . . . . . . . . . 5,601,502
REAL ESTATE (c)(f)(g) - 0.0%1,125,433 Allenby . . . . . . . . . . . . . . . . . . . . . . . . . . . . . . . . . . . . . . 17,591,418 Claymore . . . . . . . . . . . . . . . . . . . . . . . . . . . . . . . . . . . 8
9
UTILITIES - 1.9%10,378 Entegra TC LLC, Class A (c) . . . . . . . . . . . . . . . . . 162,623
1,117,865 Vistra Energy Corp. (f)(j)(o) . . . . . . . . . . . . . . . . . . 20,479,287
20,641,910
Total Common Stocks(Cost $387,160,076) . . . . . . . . . . . . . . . . . . . . 102,062,179
See Glossary on page 10 for abbreviations along with accompanying Notes to Financial Statements. 7

INVESTMENT PORTFOLIO (unaudited) (continued)
As of December 31, 2017 Highland Floating Rate Opportunities Fund
Units Value ($)
Rights - 0.1%UTILITIES (f) - 0.1%
1,117,866Texas Competitive Electric Holdings Co.,
LLC . . . . . . . . . . . . . . . . . . . . . . . . . . . . . . . . . . . . . . . 1,089,919
Total Rights(Cost $3,925,049) . . . . . . . . . . . . . . . . . . . . . 1,089,919
Warrants - 0.0%ENERGY (f) - 0.0%
5,801 Arch Coal, Inc., expires 10/05/2023 . . . . . . 249,443
GAMING & LEISURE (c)(f)(g) - 0.0%
1,834LLV Holdco LLC - Series C, Membership
Interest. . . . . . . . . . . . . . . . . . . . . . . . . . . . . . . . . . . —
2,522LLV Holdco LLC - Series D, Membership
Interest. . . . . . . . . . . . . . . . . . . . . . . . . . . . . . . . . . . —
2,819LLV Holdco LLC - Series E, Membership
Interest. . . . . . . . . . . . . . . . . . . . . . . . . . . . . . . . . . . —
3,172LLV Holdco LLC - Series F, Membership
Interest. . . . . . . . . . . . . . . . . . . . . . . . . . . . . . . . . . . —
3,594LLV Holdco LLC - Series G, Membership
Interest. . . . . . . . . . . . . . . . . . . . . . . . . . . . . . . . . . . —
—
INDUSTRIALS (c) - 0.0%453 Omnimax Holdings, Inc . . . . . . . . . . . . . . . . . . . 173,385
INFORMATION TECHNOLOGY (c)(f) - 0.0%18,641 Avaya Holdings Corp. . . . . . . . . . . . . . . . . . . . . . 44,925
Total Warrants(Cost $26,166) . . . . . . . . . . . . . . . . . . . . . . . . . 467,753
Shares
Master Limited Partnerships - 3.6%ENERGY - 3.6%
26,729 Andeavor Logistics LP . . . . . . . . . . . . . . . . . . . . 1,234,613378,000 Boardwalk Pipeline Partners LP . . . . . . . . . . 4,879,980762,000 Enterprise Products Partners LP . . . . . . . . . 20,200,620215,233 MPLX LP . . . . . . . . . . . . . . . . . . . . . . . . . . . . . . . . . . . 7,634,314
21,000 Phillips 66 Partners LP . . . . . . . . . . . . . . . . . . . . 1,099,350112,000 Williams Partners LP . . . . . . . . . . . . . . . . . . . . . . 4,343,360
Total Master Limited Partnerships(Cost $37,946,800) . . . . . . . . . . . . . . . . . . . . 39,392,237
Registered Investment Companies (k) – 1.1%
12,434,110State Street Navigator Prime Securities
Lending Portfolio . . . . . . . . . . . . . . . . . . . . . . . . 12,434,111
Total Registered InvestmentCompanies(Cost $12,434,110) . . . . . . . . . . . . . . . . . . . . 12,434,111
Cash Equivalents – 5.3%Money Market Funds – 5.3%
57,539,393
State Street Institutional U.S.Government Money Market Fund,Premier Class . . . . . . . . . . . . . . . . . . . . . . . . . . . . 57,539,393
Total Cash Equivalents(Cost $57,539,393) . . . . . . . . . . . . . . . . . . . . 57,539,393
Total Investments - 103.8% . . . . . . . . . . . . . . . . . . . . . . . . . . . . 1,124,378,264(Cost $1,545,882,713)
Shares Value ($)
Securities Sold Short - (0.5)%
Corporate Bonds - (0.5)%INDUSTRIALS - (0.5)%
(5,000,000)Intel Corp.
4.10%, 05/11/2047 . . . . . . . . . . . . . . . . . . . . . . (5,523,427)
Total Corporate Bonds(Cost $5,398,750) . . . . . . . . . . . . . . . . . . . . . . . . (5,523,427)
Total Securities Sold Short(Proceeds $5,398,750) . . . . . . . . . . . . . . . . . . . (5,523,427)
Other Assets & Liabilities, Net - (3.3)% . . . . . . . . . . . . . . . . (36,304,605)
Net Assets - 100.0% . . . . . . . . . . . . . . . . . . . . . . . . . . . . . . . . . . . . 1,082,550,232
(a) Senior loans (also called bank loans, leveraged loans, or floating rate loans) inwhich the Fund invests generally pay interest at rates which are periodicallydetermined by reference to a base lending rate plus a spread (unlessotherwise identified, all senior loans carry a variable rate of interest). Thesebase lending rates are generally (k) the Prime Rate offered by one or moremajor United States banks, (ii) the lending rate offered by one or moreEuropean banks such as the London Interbank Offered Rate (“LIBOR”) or (iii) theCertificate of Deposit rate. Rate shown represents the weighted average rateat December 31, 2017. Senior loans, while exempt from registration under theSecurities Act of 1933, as amended (the “1933 Act”), contain certain restrictionson resale and cannot be sold publicly. Senior secured floating rate loans oftenrequire prepayments from excess cash flow or permit the borrower to repayat its election. The degree to which borrowers repay, whether as a contractualrequirement or at their election, cannot be predicted with accuracy. As aresult, the actual remaining maturity may be substantially less than the statedmaturity shown. Current LIBOR rates include 1 month which is equal to 1.56%and 3 months equal to 1.69%. The current Prime Rate is 4.50%.
(b) Represents value held in escrow pending future events. No interest is beingaccrued.
(c) Represents fair value as determined by the Fund’s Board of Trustees (the“Board”), or its designee in good faith, pursuant to the policies and proceduresapproved by the Board. Securities with a total aggregate value of $56,791,515,or 5.2% of net assets, were fair valued under the Fund’s valuation proceduresas of December 31, 2017. See Note 2.
(d) Securities exempt from registration under Rule 144A of the 1933 Act. Thesesecurities may only be resold in transaction exempt from registration toqualified institutional buyers. At December 31, 2017, these securitiesamounted to $168,088,327 or 15.5% of net assets.
(e) These positions represent claims that have been filed with the United StatesBankruptcy Court Southern District of New York against Lehman CommercialPaper, Inc. UK Branch.
(f) Non-income producing security.(g) Affiliated issuer. Assets with a total aggregate market value of $34,705,135, or
3.2% of net assets, were affiliated with the Fund as of December 31, 2017.(h) Restricted Securities. These securities are not registered and may not be sold
to the public. There are legal and/or contractual restrictions on resale. TheFund does not have the right to demand that such securities be registered. Thevalues of these securities are determined by valuations provided by pricingservices, brokers, dealers, market makers, or in good faith under the
8 See Glossary on page 10 for abbreviations along with accompanying Notes to Financial Statements.

INVESTMENT PORTFOLIO (unaudited) (concluded)
As of December 31, 2017 Highland Floating Rate Opportunities Fund
procedures established by the Fund’s Board of Trustees. AdditionalInformation regarding such securities follows:
RestrictedSecurity
SecurityType
AcquisitionDate
Cost ofSecurity
MarketValue at
Period End
Percentof NetAssets
Metro-Goldwyn-Mayer, Inc.
CommonStocks 12/20/2010 $21,845,688 $51,804,242 4.8%
(i) Variable or floating rate security. The base lending rates are generally thelending rate offered by one or more European banks such as the LIBOR. Theinterest rate shown reflects the rate in effect December 31, 2017.
(j) Securities (or a portion of securities) on loan. As of December 31, 2017, themarket value of securities loaned was $14,256,230. The loaned securities weresecured with cash and securities collateral of $14,573,021. Collateral iscalculated based on prior day’s prices. See Note 4.
(k) Represents investments of cash collateral received in connection withsecurities lending.
(l) The issuer is in default of its payment obligation.(n) As described in the Fund’s prospectus, a company is considered to be a
non-U.S. issuer if the company’s securities principally trade on a marketoutside of the United States, the company derives a majority of its revenues orprofits outside of the United States, the company is not organized in the UnitedStates, or the company is significantly exposed to the economic fortunes andrisks of regions outside the United States.
(o) All or part of this security is pledged as collateral for short sales and writtenoptions contracts. The market value of the securities pledged as collateral was$20,447,639.
(p) Securities of collateralized loan obligations where an affiliate of the InvestmentAdviser serves as collateral manager.
Foreign Denominated or Domiciled Senior LoansIndustry Concentration Table:
(% of Net Assets)
Healthcare 1.3%
Industrials 0.9%
Information Technology 2.0%
Telecommunications 2.1%
Total 6.3%
Remaining Contractual Maturity of the Agreements
Overnight andContinuous Total
Securities Lending Transactions1
Common Stocks $12,434,111 $12,434,111Total Borrowings $12,434,111 $12,434,111Gross amount of recognized liabilities for
securities lending transactions $12,434,111
1 Amounts represent the payable for cash collateral received on securities onloan. This will generally be in “Overnight and Continuous” column as thesecurities are typically callable on demand.
See Glossary on page 10 for abbreviations along with accompanying Notes to Financial Statements. 9

GLOSSARY: (abbreviations that may be used in the preceding statements) (unaudited)
Other Abbreviations:CLO Collateralized Loan ObligationPIK Payment-in-Kind
10 Semi-Annual Report

STATEMENT OF ASSETS AND LIABILITIES
As of December 31, 2017 (unaudited) Highland Floating Rate Opportunities Fund($)
AssetsInvestments from unaffiliated issuers, at value (a) . . . . . . . . . . . . . . . . . . . . . . . . . . . . . . . . . . . . . . . . . . . . . . . . . . . . . . . . . . . . . . . . . . . 1,032,133,726Affiliated issuers, at value (Note 7) . . . . . . . . . . . . . . . . . . . . . . . . . . . . . . . . . . . . . . . . . . . . . . . . . . . . . . . . . . . . . . . . . . . . . . . . . . . . . . . . . . . . 34,705,145
Total Investments, at value . . . . . . . . . . . . . . . . . . . . . . . . . . . . . . . . . . . . . . . . . . . . . . . . . . . . . . . . . . . . . . . . . . . . . . . . . . . . . . . . . . . . . . . . . . . . 1,066,838,871Cash equivalents (Note 2) . . . . . . . . . . . . . . . . . . . . . . . . . . . . . . . . . . . . . . . . . . . . . . . . . . . . . . . . . . . . . . . . . . . . . . . . . . . . . . . . . . . . . . . . . . . . . 57,539,393Cash . . . . . . . . . . . . . . . . . . . . . . . . . . . . . . . . . . . . . . . . . . . . . . . . . . . . . . . . . . . . . . . . . . . . . . . . . . . . . . . . . . . . . . . . . . . . . . . . . . . . . . . . . . . . . . . . . . . . 227,400Restricted Cash (Note 2) . . . . . . . . . . . . . . . . . . . . . . . . . . . . . . . . . . . . . . . . . . . . . . . . . . . . . . . . . . . . . . . . . . . . . . . . . . . . . . . . . . . . . . . . . . . . . . . 5,719,157Receivable for:
Investments sold . . . . . . . . . . . . . . . . . . . . . . . . . . . . . . . . . . . . . . . . . . . . . . . . . . . . . . . . . . . . . . . . . . . . . . . . . . . . . . . . . . . . . . . . . . . . . . . . . . . . 18,789,995Interest . . . . . . . . . . . . . . . . . . . . . . . . . . . . . . . . . . . . . . . . . . . . . . . . . . . . . . . . . . . . . . . . . . . . . . . . . . . . . . . . . . . . . . . . . . . . . . . . . . . . . . . . . . . . . . 7,450,662Due from broker . . . . . . . . . . . . . . . . . . . . . . . . . . . . . . . . . . . . . . . . . . . . . . . . . . . . . . . . . . . . . . . . . . . . . . . . . . . . . . . . . . . . . . . . . . . . . . . . . . . . . 1,901,884
Prepaid expenses and other assets . . . . . . . . . . . . . . . . . . . . . . . . . . . . . . . . . . . . . . . . . . . . . . . . . . . . . . . . . . . . . . . . . . . . . . . . . . . . . . . . . . . 485,426
Total assets . . . . . . . . . . . . . . . . . . . . . . . . . . . . . . . . . . . . . . . . . . . . . . . . . . . . . . . . . . . . . . . . . . . . . . . . . . . . . . . . . . . . . . . . . . . . . . . . . . . . 1,158,952,788
LiabilitiesDue to custodian. . . . . . . . . . . . . . . . . . . . . . . . . . . . . . . . . . . . . . . . . . . . . . . . . . . . . . . . . . . . . . . . . . . . . . . . . . . . . . . . . . . . . . . . . . . . . . . . . . . . . . . 5,837Securities sold short, at value (Note 8) . . . . . . . . . . . . . . . . . . . . . . . . . . . . . . . . . . . . . . . . . . . . . . . . . . . . . . . . . . . . . . . . . . . . . . . . . . . . . . . . 5,523,427
Payable for:Upon receipt of securities loaned (Note 4) . . . . . . . . . . . . . . . . . . . . . . . . . . . . . . . . . . . . . . . . . . . . . . . . . . . . . . . . . . . . . . . . . . . . . . . . . 12,434,111Investments purchased . . . . . . . . . . . . . . . . . . . . . . . . . . . . . . . . . . . . . . . . . . . . . . . . . . . . . . . . . . . . . . . . . . . . . . . . . . . . . . . . . . . . . . . . . . . . . 56,967,070Interest expense and commitment fees (Note 6) . . . . . . . . . . . . . . . . . . . . . . . . . . . . . . . . . . . . . . . . . . . . . . . . . . . . . . . . . . . . . . . . . . 728,783Accrued expenses and other liabilities . . . . . . . . . . . . . . . . . . . . . . . . . . . . . . . . . . . . . . . . . . . . . . . . . . . . . . . . . . . . . . . . . . . . . . . . . . . . . 743,328
Total liabilities . . . . . . . . . . . . . . . . . . . . . . . . . . . . . . . . . . . . . . . . . . . . . . . . . . . . . . . . . . . . . . . . . . . . . . . . . . . . . . . . . . . . . . . . . . . . . . . . . . 76,402,556
Commitments and Contingencies (Note 7)
Net Assets . . . . . . . . . . . . . . . . . . . . . . . . . . . . . . . . . . . . . . . . . . . . . . . . . . . . . . . . . . . . . . . . . . . . . . . . . . . . . . . . . . . . . . . . . . . . . . . . . . . . . . . . . . . . . . . . 1,082,550,232
Net Assets Consist of:Par value (Note 1) . . . . . . . . . . . . . . . . . . . . . . . . . . . . . . . . . . . . . . . . . . . . . . . . . . . . . . . . . . . . . . . . . . . . . . . . . . . . . . . . . . . . . . . . . . . . . . . . . . . . . . 71,736Paid-in capital . . . . . . . . . . . . . . . . . . . . . . . . . . . . . . . . . . . . . . . . . . . . . . . . . . . . . . . . . . . . . . . . . . . . . . . . . . . . . . . . . . . . . . . . . . . . . . . . . . . . . . . . . . 1,778,926,414Accumulated net investment loss. . . . . . . . . . . . . . . . . . . . . . . . . . . . . . . . . . . . . . . . . . . . . . . . . . . . . . . . . . . . . . . . . . . . . . . . . . . . . . . . . . . . . (19,932,394)Accumulated net realized gain (loss) from investments, securities sold short, and foreign currency
transactions . . . . . . . . . . . . . . . . . . . . . . . . . . . . . . . . . . . . . . . . . . . . . . . . . . . . . . . . . . . . . . . . . . . . . . . . . . . . . . . . . . . . . . . . . . . . . . . . . . . . . . . . . (270,076,522)Net unrealized appreciation (depreciation) on investments, securities sold short, and foreign currency
translations . . . . . . . . . . . . . . . . . . . . . . . . . . . . . . . . . . . . . . . . . . . . . . . . . . . . . . . . . . . . . . . . . . . . . . . . . . . . . . . . . . . . . . . . . . . . . . . . . . . . . . . . . . (406,439,002)
Net Assets . . . . . . . . . . . . . . . . . . . . . . . . . . . . . . . . . . . . . . . . . . . . . . . . . . . . . . . . . . . . . . . . . . . . . . . . . . . . . . . . . . . . . . . . . . . . . . . . . . . . . . . . . . . . . . . . 1,082,550,232
Investments, at cost . . . . . . . . . . . . . . . . . . . . . . . . . . . . . . . . . . . . . . . . . . . . . . . . . . . . . . . . . . . . . . . . . . . . . . . . . . . . . . . . . . . . . . . . . . . . . . . . . . . 1,146,949,076Affiliated investments, at cost (Note 10) . . . . . . . . . . . . . . . . . . . . . . . . . . . . . . . . . . . . . . . . . . . . . . . . . . . . . . . . . . . . . . . . . . . . . . . . . . . . . . 341,394,244Cash equivalents, at cost (Note 2) . . . . . . . . . . . . . . . . . . . . . . . . . . . . . . . . . . . . . . . . . . . . . . . . . . . . . . . . . . . . . . . . . . . . . . . . . . . . . . . . . . . . . 57,539,393Foreign currency, at cost . . . . . . . . . . . . . . . . . . . . . . . . . . . . . . . . . . . . . . . . . . . . . . . . . . . . . . . . . . . . . . . . . . . . . . . . . . . . . . . . . . . . . . . . . . . . . . (5,820)Proceeds from securities sold short. . . . . . . . . . . . . . . . . . . . . . . . . . . . . . . . . . . . . . . . . . . . . . . . . . . . . . . . . . . . . . . . . . . . . . . . . . . . . . . . . . . 5,398,750(a) Includes market value of securities on loan: . . . . . . . . . . . . . . . . . . . . . . . . . . . . . . . . . . . . . . . . . . . . . . . . . . . . . . . . . . . . . . . . . . . . . . 14,256,230
Common SharesShares outstanding (unlimited authorization) . . . . . . . . . . . . . . . . . . . . . . . . . . . . . . . . . . . . . . . . . . . . . . . . . . . . . . . . . . . . . . . . . . . . . . . . 71,735,900Net asset value per share (Net assets/shares outstanding) . . . . . . . . . . . . . . . . . . . . . . . . . . . . . . . . . . . . . . . . . . . . . . . . . . . . . . . . . 15.09
See accompanying Notes to Financial Statements. 11

STATEMENT OF OPERATIONS
For the Six Months Ended December 31, 2017 (unaudited) Highland Floating Rate Opportunities Fund($)
Investment IncomeIncome:
Dividends . . . . . . . . . . . . . . . . . . . . . . . . . . . . . . . . . . . . . . . . . . . . . . . . . . . . . . . . . . . . . . . . . . . . . . . . . . . . . . . . . . . . . . . . . . . . . . . . . . . . . . . . . . . . . . . . . . 40,622Securities lending income (Note 4). . . . . . . . . . . . . . . . . . . . . . . . . . . . . . . . . . . . . . . . . . . . . . . . . . . . . . . . . . . . . . . . . . . . . . . . . . . . . . . . . . . . . . . . 57,887Interest from unaffiliated issuers . . . . . . . . . . . . . . . . . . . . . . . . . . . . . . . . . . . . . . . . . . . . . . . . . . . . . . . . . . . . . . . . . . . . . . . . . . . . . . . . . . . . . . . . . 24,074,590Interest from affiliated issuers . . . . . . . . . . . . . . . . . . . . . . . . . . . . . . . . . . . . . . . . . . . . . . . . . . . . . . . . . . . . . . . . . . . . . . . . . . . . . . . . . . . . . . . . . . . . 2,437,821Other income . . . . . . . . . . . . . . . . . . . . . . . . . . . . . . . . . . . . . . . . . . . . . . . . . . . . . . . . . . . . . . . . . . . . . . . . . . . . . . . . . . . . . . . . . . . . . . . . . . . . . . . . . . . . . . 477,491
Total Income . . . . . . . . . . . . . . . . . . . . . . . . . . . . . . . . . . . . . . . . . . . . . . . . . . . . . . . . . . . . . . . . . . . . . . . . . . . . . . . . . . . . . . . . . . . . . . . . . . . . . . . 27,088,411
Expenses:Investment advisory (Note 7) . . . . . . . . . . . . . . . . . . . . . . . . . . . . . . . . . . . . . . . . . . . . . . . . . . . . . . . . . . . . . . . . . . . . . . . . . . . . . . . . . . . . . . . . . . . . . 3,214,405Administration fees (Note 7). . . . . . . . . . . . . . . . . . . . . . . . . . . . . . . . . . . . . . . . . . . . . . . . . . . . . . . . . . . . . . . . . . . . . . . . . . . . . . . . . . . . . . . . . . . . . . . 992,318Distribution and shareholder service fees: (Note 7)
Class A. . . . . . . . . . . . . . . . . . . . . . . . . . . . . . . . . . . . . . . . . . . . . . . . . . . . . . . . . . . . . . . . . . . . . . . . . . . . . . . . . . . . . . . . . . . . . . . . . . . . . . . . . . . . . . . . . . . 318,546Class C. . . . . . . . . . . . . . . . . . . . . . . . . . . . . . . . . . . . . . . . . . . . . . . . . . . . . . . . . . . . . . . . . . . . . . . . . . . . . . . . . . . . . . . . . . . . . . . . . . . . . . . . . . . . . . . . . . . 706,459
Transfer agent fees. . . . . . . . . . . . . . . . . . . . . . . . . . . . . . . . . . . . . . . . . . . . . . . . . . . . . . . . . . . . . . . . . . . . . . . . . . . . . . . . . . . . . . . . . . . . . . . . . . . . . . . . 251,298Trustees fees (Note 7) . . . . . . . . . . . . . . . . . . . . . . . . . . . . . . . . . . . . . . . . . . . . . . . . . . . . . . . . . . . . . . . . . . . . . . . . . . . . . . . . . . . . . . . . . . . . . . . . . . . . . 87,281Accounting services fees . . . . . . . . . . . . . . . . . . . . . . . . . . . . . . . . . . . . . . . . . . . . . . . . . . . . . . . . . . . . . . . . . . . . . . . . . . . . . . . . . . . . . . . . . . . . . . . . . . 131,409Audit fees . . . . . . . . . . . . . . . . . . . . . . . . . . . . . . . . . . . . . . . . . . . . . . . . . . . . . . . . . . . . . . . . . . . . . . . . . . . . . . . . . . . . . . . . . . . . . . . . . . . . . . . . . . . . . . . . . . 94,336Legal fees . . . . . . . . . . . . . . . . . . . . . . . . . . . . . . . . . . . . . . . . . . . . . . . . . . . . . . . . . . . . . . . . . . . . . . . . . . . . . . . . . . . . . . . . . . . . . . . . . . . . . . . . . . . . . . . . . . 200,079Registration fees. . . . . . . . . . . . . . . . . . . . . . . . . . . . . . . . . . . . . . . . . . . . . . . . . . . . . . . . . . . . . . . . . . . . . . . . . . . . . . . . . . . . . . . . . . . . . . . . . . . . . . . . . . . 48,301Insurance . . . . . . . . . . . . . . . . . . . . . . . . . . . . . . . . . . . . . . . . . . . . . . . . . . . . . . . . . . . . . . . . . . . . . . . . . . . . . . . . . . . . . . . . . . . . . . . . . . . . . . . . . . . . . . . . . . 51,063Reports to shareholders. . . . . . . . . . . . . . . . . . . . . . . . . . . . . . . . . . . . . . . . . . . . . . . . . . . . . . . . . . . . . . . . . . . . . . . . . . . . . . . . . . . . . . . . . . . . . . . . . . . 51,315Tax expense . . . . . . . . . . . . . . . . . . . . . . . . . . . . . . . . . . . . . . . . . . . . . . . . . . . . . . . . . . . . . . . . . . . . . . . . . . . . . . . . . . . . . . . . . . . . . . . . . . . . . . . . . . . . . . . 3,511Reorganization expense (Note 1) . . . . . . . . . . . . . . . . . . . . . . . . . . . . . . . . . . . . . . . . . . . . . . . . . . . . . . . . . . . . . . . . . . . . . . . . . . . . . . . . . . . . . . . . . 1,076,274Other . . . . . . . . . . . . . . . . . . . . . . . . . . . . . . . . . . . . . . . . . . . . . . . . . . . . . . . . . . . . . . . . . . . . . . . . . . . . . . . . . . . . . . . . . . . . . . . . . . . . . . . . . . . . . . . . . . . . . . . 59,586
Total operating expenses (Note 7) . . . . . . . . . . . . . . . . . . . . . . . . . . . . . . . . . . . . . . . . . . . . . . . . . . . . . . . . . . . . . . . . . . . . . . . . . . . . . . . . 7,286,181
Net operating expenses . . . . . . . . . . . . . . . . . . . . . . . . . . . . . . . . . . . . . . . . . . . . . . . . . . . . . . . . . . . . . . . . . . . . . . . . . . . . . . . . . . . . . . . . . . . 7,286,181
Net investment income . . . . . . . . . . . . . . . . . . . . . . . . . . . . . . . . . . . . . . . . . . . . . . . . . . . . . . . . . . . . . . . . . . . . . . . . . . . . . . . . . . . . . . . . . . . 19,802,230
Net Realized and Unrealized Gain (Loss) on InvestmentsRealized gain (loss) on:
Investments from unaffiliated issuers . . . . . . . . . . . . . . . . . . . . . . . . . . . . . . . . . . . . . . . . . . . . . . . . . . . . . . . . . . . . . . . . . . . . . . . . . . . . . . . . . . . . (8,470,089)Securities sold short (Note 2) . . . . . . . . . . . . . . . . . . . . . . . . . . . . . . . . . . . . . . . . . . . . . . . . . . . . . . . . . . . . . . . . . . . . . . . . . . . . . . . . . . . . . . . . . . . . . . (25,410)Foreign currency related transactions . . . . . . . . . . . . . . . . . . . . . . . . . . . . . . . . . . . . . . . . . . . . . . . . . . . . . . . . . . . . . . . . . . . . . . . . . . . . . . . . . . . (357)
Change in unrealized appreciation (depreciation) on:Investments from unaffiliated issuers . . . . . . . . . . . . . . . . . . . . . . . . . . . . . . . . . . . . . . . . . . . . . . . . . . . . . . . . . . . . . . . . . . . . . . . . . . . . . . . . . . . . 12,809,277Investments in affiliated issuers . . . . . . . . . . . . . . . . . . . . . . . . . . . . . . . . . . . . . . . . . . . . . . . . . . . . . . . . . . . . . . . . . . . . . . . . . . . . . . . . . . . . . . . . . . 4,888,539Securities sold short (Note 2) . . . . . . . . . . . . . . . . . . . . . . . . . . . . . . . . . . . . . . . . . . . . . . . . . . . . . . . . . . . . . . . . . . . . . . . . . . . . . . . . . . . . . . . . . . . . . . (119,302)Foreign currency related translations . . . . . . . . . . . . . . . . . . . . . . . . . . . . . . . . . . . . . . . . . . . . . . . . . . . . . . . . . . . . . . . . . . . . . . . . . . . . . . . . . . . . 125
Net realized and unrealized gain (loss) on investments. . . . . . . . . . . . . . . . . . . . . . . . . . . . . . . . . . . . . . . . . . . . . . . . . . . . . . . . . . 9,082,783
Total increase in net assets resulting from operations . . . . . . . . . . . . . . . . . . . . . . . . . . . . . . . . . . . . . . . . . . . . . . . . . . . . . . . . . . 28,885,013
12 See accompanying Notes to Financial Statements.

STATEMENT OF CHANGES IN NET ASSETS
Highland Floating Rate Opportunities Fund
Six Months EndedDecember 31, 2017
(unaudited)($)
Year EndedJune 30, 2017
($)
Increase (Decrease) in Net AssetsOperations:
Net investment income . . . . . . . . . . . . . . . . . . . . . . . . . . . . . . . . . . . . . . . . . . . . . . . . . . . . . . . . . . . . . . . . . . . . . . 19,802,230 32,624,898Net realized loss on investments, securities sold short and foreign currency
transactions . . . . . . . . . . . . . . . . . . . . . . . . . . . . . . . . . . . . . . . . . . . . . . . . . . . . . . . . . . . . . . . . . . . . . . . . . . . . . . . (8,495,856) (22,692,673)Net increase in unrealized appreciation (depreciation) on investments, securities sold
short and foreign currency transactions . . . . . . . . . . . . . . . . . . . . . . . . . . . . . . . . . . . . . . . . . . . . . . . . 17,578,639 54,072,481
Net increase from operations . . . . . . . . . . . . . . . . . . . . . . . . . . . . . . . . . . . . . . . . . . . . . . . . . . . . . . . . . . . . . . . 28,885,013 64,004,706
Distributions to shareholders from:Net investment income
Class A . . . . . . . . . . . . . . . . . . . . . . . . . . . . . . . . . . . . . . . . . . . . . . . . . . . . . . . . . . . . . . . . . . . . . . . . . . . . . . . . . . . . . (3,380,302) (10,631,649)Class C . . . . . . . . . . . . . . . . . . . . . . . . . . . . . . . . . . . . . . . . . . . . . . . . . . . . . . . . . . . . . . . . . . . . . . . . . . . . . . . . . . . . . (2,697,014) (9,518,520)Class Z . . . . . . . . . . . . . . . . . . . . . . . . . . . . . . . . . . . . . . . . . . . . . . . . . . . . . . . . . . . . . . . . . . . . . . . . . . . . . . . . . . . . . (17,345,874) (13,676,642)
Total distributions . . . . . . . . . . . . . . . . . . . . . . . . . . . . . . . . . . . . . . . . . . . . . . . . . . . . . . . . . . . . . . . . . . . . . . . . . . . . . (23,423,190) (33,826,811)
Increase in net assets from operations and distributions. . . . . . . . . . . . . . . . . . . . . . . . . . . . . . . . . . 5,461,823 30,177,895
Share transactions:Proceeds from sale of shares
Class A . . . . . . . . . . . . . . . . . . . . . . . . . . . . . . . . . . . . . . . . . . . . . . . . . . . . . . . . . . . . . . . . . . . . . . . . . . . . . . . . . . . . . 75,507,963 132,080,772Class C . . . . . . . . . . . . . . . . . . . . . . . . . . . . . . . . . . . . . . . . . . . . . . . . . . . . . . . . . . . . . . . . . . . . . . . . . . . . . . . . . . . . . 49,282,371 46,111,952Class Z . . . . . . . . . . . . . . . . . . . . . . . . . . . . . . . . . . . . . . . . . . . . . . . . . . . . . . . . . . . . . . . . . . . . . . . . . . . . . . . . . . . . . 252,257,435 279,887,069
Value of distributions reinvestedClass A . . . . . . . . . . . . . . . . . . . . . . . . . . . . . . . . . . . . . . . . . . . . . . . . . . . . . . . . . . . . . . . . . . . . . . . . . . . . . . . . . . . . . 3,008,894 9,827,945Class C . . . . . . . . . . . . . . . . . . . . . . . . . . . . . . . . . . . . . . . . . . . . . . . . . . . . . . . . . . . . . . . . . . . . . . . . . . . . . . . . . . . . . 2,470,570 8,078,025Class Z . . . . . . . . . . . . . . . . . . . . . . . . . . . . . . . . . . . . . . . . . . . . . . . . . . . . . . . . . . . . . . . . . . . . . . . . . . . . . . . . . . . . . 5,841,184 12,750,180
Cost of shares redeemedClass A . . . . . . . . . . . . . . . . . . . . . . . . . . . . . . . . . . . . . . . . . . . . . . . . . . . . . . . . . . . . . . . . . . . . . . . . . . . . . . . . . . . . . (61,916,334) (86,388,361)Class C . . . . . . . . . . . . . . . . . . . . . . . . . . . . . . . . . . . . . . . . . . . . . . . . . . . . . . . . . . . . . . . . . . . . . . . . . . . . . . . . . . . . . (26,700,962) (68,154,841)Class Z . . . . . . . . . . . . . . . . . . . . . . . . . . . . . . . . . . . . . . . . . . . . . . . . . . . . . . . . . . . . . . . . . . . . . . . . . . . . . . . . . . . . . (109,971,065) (154,569,756)
Net increase from shares transactions . . . . . . . . . . . . . . . . . . . . . . . . . . . . . . . . . . . . . . . . . . . . . . . . . . . . . 189,780,056 179,622,985
Total increase in net assets. . . . . . . . . . . . . . . . . . . . . . . . . . . . . . . . . . . . . . . . . . . . . . . . . . . . . . . . . . . . . . . . . . . 195,241,879 209,800,880
Net AssetsBeginning of period . . . . . . . . . . . . . . . . . . . . . . . . . . . . . . . . . . . . . . . . . . . . . . . . . . . . . . . . . . . . . . . . . . . . . . . . . . 887,308,353 677,507,473
End of period . . . . . . . . . . . . . . . . . . . . . . . . . . . . . . . . . . . . . . . . . . . . . . . . . . . . . . . . . . . . . . . . . . . . . . . . . . . . . . . . . 1,082,550,232 887,308,353
Accumulated net investment loss . . . . . . . . . . . . . . . . . . . . . . . . . . . . . . . . . . . . . . . . . . . . . . . . . . . . . . . . . . . . . . (19,932,394) (16,311,434)
See accompanying Notes to Financial Statements. 13

STATEMENT OF CHANGES IN NET ASSETS (continued)
Highland Floating Rate Opportunities Fund
Six Months EndedDecember 31, 2017
(unaudited)($)
Year EndedJune 30, 2017
($)
CAPITAL STOCK ACTIVITY - SHARES*
Class A:Impact of reverse stock split on opening shares (Note 1) . . . . . . . . . . . . . . . . . . . . . . . . . . . . . . . . . . . . . . . . (19,032,283) —Shares sold . . . . . . . . . . . . . . . . . . . . . . . . . . . . . . . . . . . . . . . . . . . . . . . . . . . . . . . . . . . . . . . . . . . . . . . . . . . . . . . . . . . . . . . . . 5,028,824 8,806,400Issued for distribution reinvested . . . . . . . . . . . . . . . . . . . . . . . . . . . . . . . . . . . . . . . . . . . . . . . . . . . . . . . . . . . . . . . . . . 200,393 660,235Shares redeemed . . . . . . . . . . . . . . . . . . . . . . . . . . . . . . . . . . . . . . . . . . . . . . . . . . . . . . . . . . . . . . . . . . . . . . . . . . . . . . . . . . (4,126,129) (5,773,565)Shares converted in conversion (Note 1) . . . . . . . . . . . . . . . . . . . . . . . . . . . . . . . . . . . . . . . . . . . . . . . . . . . . . . . . . . (19,014,516) —
Net decrease in fund shares . . . . . . . . . . . . . . . . . . . . . . . . . . . . . . . . . . . . . . . . . . . . . . . . . . . . . . . . . . . . . . . . . . . . . . . (36,943,711) 3,693,070
Class C:Impact of reverse stock split on opening shares (Note 1) . . . . . . . . . . . . . . . . . . . . . . . . . . . . . . . . . . . . . . . . (16,228,407)Shares sold . . . . . . . . . . . . . . . . . . . . . . . . . . . . . . . . . . . . . . . . . . . . . . . . . . . . . . . . . . . . . . . . . . . . . . . . . . . . . . . . . . . . . . . . . 3,282,455 3,068,658Issued for distribution reinvested . . . . . . . . . . . . . . . . . . . . . . . . . . . . . . . . . . . . . . . . . . . . . . . . . . . . . . . . . . . . . . . . . . 164,623 543,706Shares redeemed . . . . . . . . . . . . . . . . . . . . . . . . . . . . . . . . . . . . . . . . . . . . . . . . . . . . . . . . . . . . . . . . . . . . . . . . . . . . . . . . . . (1,779,278) (4,567,646)Shares converted in conversion (Note 1) . . . . . . . . . . . . . . . . . . . . . . . . . . . . . . . . . . . . . . . . . . . . . . . . . . . . . . . . . . (16,925,308) —
Net decrease in fund shares . . . . . . . . . . . . . . . . . . . . . . . . . . . . . . . . . . . . . . . . . . . . . . . . . . . . . . . . . . . . . . . . . . . . . . . (31,485,915) (955,282)
Class Z:Impact of reverse stock split on opening shares (Note 1) . . . . . . . . . . . . . . . . . . . . . . . . . . . . . . . . . . . . . . . . (27,598,215)Shares sold . . . . . . . . . . . . . . . . . . . . . . . . . . . . . . . . . . . . . . . . . . . . . . . . . . . . . . . . . . . . . . . . . . . . . . . . . . . . . . . . . . . . . . . . . 15,755,812 18,662,515Issued for distribution reinvested . . . . . . . . . . . . . . . . . . . . . . . . . . . . . . . . . . . . . . . . . . . . . . . . . . . . . . . . . . . . . . . . . . 389,052 855,841Shares redeemed . . . . . . . . . . . . . . . . . . . . . . . . . . . . . . . . . . . . . . . . . . . . . . . . . . . . . . . . . . . . . . . . . . . . . . . . . . . . . . . . . . (6,280,016) (10,417,085)Shares converted in conversion (Note 1) . . . . . . . . . . . . . . . . . . . . . . . . . . . . . . . . . . . . . . . . . . . . . . . . . . . . . . . . . . (35,789,642) —
Net decrease in fund shares . . . . . . . . . . . . . . . . . . . . . . . . . . . . . . . . . . . . . . . . . . . . . . . . . . . . . . . . . . . . . . . . . . . . . . . (53,523,009) 9,101,271
New Common Shares Of Closed-end Fund:Shares converted in conversion . . . . . . . . . . . . . . . . . . . . . . . . . . . . . . . . . . . . . . . . . . . . . . . . . . . . . . . . . . . . . . . . . . . 71,729,466Issued for distribution reinvested . . . . . . . . . . . . . . . . . . . . . . . . . . . . . . . . . . . . . . . . . . . . . . . . . . . . . . . . . . . . . . . . . . 6,434
Net increase in fund shares . . . . . . . . . . . . . . . . . . . . . . . . . . . . . . . . . . . . . . . . . . . . . . . . . . . . . . . . . . . . . . . . . . . . . . . . 71,735,900
* Capital stock activity prior to November 3, 2017 has been adjusted to give effect to an approximately 2 to 1 reverse stock split as part of the conversion to a closed-endfund. (Note 1)
14 See accompanying Notes to Financial Statements.

FINANCIAL HIGHLIGHTS
Highland Floating Rate Opportunities Fund
Selected data for a share outstanding throughout each period is as follows:For the
Six MonthsEnded
December 31,2017*
(unaudited)
For the Years Ended June 30,
2017(m)* 2016(m)* 2015(m)* 2014(m)* 2013(m)*
Net Asset Value, Beginning of Period $ 15.01 $ 14.33 $ 16.17 $ 16.91 $ 15.98 $ 14.12
Income from Investment Operations:(a)
Net investment income 0.32 0.68 0.89 0.74 0.74 0.60Redemption fees added to paid-in capital — — — — —(b) —(b)
Net realized and unrealized gain/(loss) 0.12 0.74 (1.84) (0.74) 0.93 2.13
Total from investment operations 0.44 1.42 (0.95) —(b) 1.67 2.73
Less Distributions Declared to Shareholders:From net investment income (0.36) (0.74) (0.89) (0.74) (0.72) (0.68)(c)
From return of capital — — — — (0.02) (0.19)(c)
Total distributions declared to shareholders (0.36) (0.74) (0.89) (0.74) (0.74) (0.87)
Net Asset Value, End of Period(d) $ 15.09 $ 15.01 $ 14.33 $ 16.17 $ 16.91 $ 15.98Market Value, End of Period $ 15.50 — — — — —Total return 5.76%(e)(K) 10.05%(d)(f) (5.77)%(d)(f) 0.11%(d)(f) 10.68%(d)(f) 19.77%(d)(f)
Ratios to Average Net Assets(g)(h)/Supplemental Data:Net assets, end of period (in 000’s) $1,082,550 $389,278 $241,197 $283,673 $340,089 $170,170Gross operating expenses(h)(i)(l) 1.26% 1.20%(j) 1.38% 1.03% 1.25% 1.31%Net investment income(l) 4.19% 4.61% 5.65% 4.55% 4.49% 3.88%Portfolio turnover rate 59%(k) 63% 53% 55% 69% 71%
* Per share data prior to November 3, 2017 has been adjusted to give effect to an approximately 2 to 1 reverse stock split as part of the conversion to a closed-end fund.(Note 1)
(a) Per share data was calculated using average shares outstanding during the period.(b) Represents less than $0.005 per share.(c) Changed from previously reported amounts of $(0.34) and $(0.08), respectively. See Note 5.(d) The Net Asset Value per share and total return have been calculated based on net assets which include adjustments made in accordance with U.S. Generally Accepted
Accounting Principles required at period end for financial reporting purposes. These figures do not necessarily reflect the Net Asset Value per share or total return experiencedby the shareholder at period end.
(e) Based on market value per share. Distributions, if any, are assumed for purposes of this calculation to be reinvested at prices obtained under the Fund’s DividendReinvestment Plan.
(f) Total return is at net asset value assuming all distributions are reinvested and no initial sales charge or CDSC. For periods with waivers/reimbursements, had the Fund’sinvestment adviser not waived or reimbursed a portion of expenses, total return would have been lower.
(g) All ratios for the period have been annualized, unless otherwise indicated.(h) Supplemental expense ratios are shown below:(i) Includes dividends and fees on securities sold short.(j) Refer to Note 7 in the Notes to the Financial Statements for discussion of prior period custodian out-of-pocket expenses that were communicated to the Fund in the current
period. The amount of the reimbursement was immaterial on a per share basis and did not impact the total return of the Fund. The Ratios of Gross Operating Expenses andNet Operating Expenses to Average Net Assets would be unchanged as the reimbursement of custodian fees was offset against current period expense waivers/reimbursements with no impact to net expenses or net investment income.
(k) Not annualized.(l) Excludes 12b-1 fees from partial period operating as an open-end fund.(m) Reflects the financial highlights of Class Z of the open-end fund prior to the conversion.
For theSix Months
EndedDecember 31,
2017(unaudited)
For the Years Ended June 30,
2017 2016 2015 2014 2013
Net operating expenses (net of waiver/reimbursement, ifapplicable, but gross of all other operating expenses) 1.47% 1.12% 1.11% 1.04% 0.99% 1.04%
Interest expense and commitment fees — 0.01% 0.15% 0.04% 0.08% 0.10%Dividends and fees on securities sold short — 0.01% 0.01% 0.05% 0.04% —
See accompanying Notes to Financial Statements. 15

NOTES TO FINANCIAL STATEMENTS (unaudited)
December 31, 2017 Highland Floating Rate Opportunities Fund
Note 1. OrganizationHighland Floating Rate Opportunities Fund (the “Fund”) isorganized as an unincorporated business trust under thelaws of The Commonwealth of Massachusetts. The Fund isregistered with the U.S. Securities and Exchange Commis-sion (the “SEC”) under the Investment Company Act of 1940,as amended (the “1940 Act”), as a non-diversified,closed-end management investment company. On Sep-tember 25, 2017, the Fund acquired the assets of HighlandFloating Rate Opportunities Fund (the “Predecessor Fund”), aseries of Highland Funds I, a Delaware statutory trust. TheFund is the successor to the accounting and performanceinformation of the Predecessor Fund. This report includesinformation for the period ended December 31, 2017.
On November 3, 2017, shareholders of the Fund approveda proposal authorizing the Board of Trustees (the “Board”)of the Fund to convert the fund from an open-end fund toa closed-end fund at a special meeting of shareholders.The Board took action to convert the Fund to a closed-endfund effective shortly after 4:00 p.m. Eastern Time onNovember 3, 2017 (the “Conversion Date”). The Fund alsoeffected an approximately 1-for-2 reverse stock split of theFund’s issued and outstanding shares on November 3,2017, thereby reducing the number of shares outstanding.Shareholders were paid cash for any fractional sharesresulting from the reverse stock split. The Fund began list-ing its shares for trading on the New York Stock Exchange(the “NYSE”) on November 6, 2017 under the ticker symbol“HFRO”. The Fund may issue an unlimited number ofcommon shares, par value $0.001 per share (“CommonShares”). Prior to the Conversion Date, the Fund issuedClass A, Class C, and Class Z shares. The Fund incurred$1,076,274 in Conversion costs related to the fund con-version to a closed-end fund.
Note 2. Significant Accounting PoliciesThe following summarizes the significant accounting poli-cies consistently followed by the Fund in the preparation ofits financial statements.
Use of EstimatesThe Fund is an investment company that applies theaccounting and reporting guidance of Accounting Stan-dards Codification Topic 946 applicable to investmentcompanies. The Fund’s financial statements have beenprepared in conformity with accounting principles gen-erally accepted in the United States of America (“GAAP”),which require the Highland Capital Management FundAdvisors, L.P. (the “Investment Adviser”) to make estimatesand assumptions that affect the reported amounts ofassets and liabilities, the disclosure of contingent assetsand liabilities at the date of the financial statements and
the reported amounts of revenue and expenses during thereporting period. Changes in the economic environment,financial markets and any other parameters used indetermining these estimates could cause actual results todiffer materially.
Fund ValuationThe net asset value (“NAV”) of the Fund’s common shares iscalculated daily on each day that the NYSE is open forbusiness as of the close of the regular trading session onthe NYSE, usually 4:00 PM, Eastern Time. The NAV is calcu-lated by dividing the value of the Fund’s net assetsattributable to common shares by the numbers of com-mon shares outstanding.
Valuation of InvestmentsIn computing the Fund’s net assets attributable to shares,securities with readily available market quotations on theNYSE, National Association of Securities Dealers Auto-mated Quotation (“NASDAQ”), or other nationally recog-nized exchange, use the closing quotations on therespective exchange for valuation of those securities.Securities for which there are no readily available marketquotations will be valued pursuant to policies adopted bythe Fund’s Board of Trustees (the “Board”). Typically, suchsecurities will be valued at the mean between the mostrecently quoted bid and ask prices provided by the princi-pal market makers. If there is more than one such principalmarket maker, the value shall be the average of suchmeans. Securities without a sale price or quotations fromprincipal market makers on the valuation day may bepriced by an independent pricing service. Generally, theFund’s loan and bond positions are not traded onexchanges and consequently are valued based on a meanof the bid and ask price from the third-party pricing serv-ices or broker-dealer sources that the Investment Adviserhas determined to have the capability to provide appro-priate pricing services which have been approved by theBoard.
Securities for which market quotations are not readilyavailable, or for which the Fund has determined that theprice received from a pricing service or broker-dealer is“stale” or otherwise does not represent fair value (such aswhen events materially affecting the value of securitiesoccur between the time when market price is determinedand calculation of the Fund’s NAV), will be valued by theFund at fair value, as determined by the Board or itsdesignee in good faith in accordance with proceduresapproved by the Board, taking into account factorsreasonably determined to be relevant, including, but notlimited to: (i) the fundamental analytical data relating tothe investment; (ii) the nature and duration of restrictions
16 Semi-Annual Report

NOTES TO FINANCIAL STATEMENTS (unaudited) (continued)
December 31, 2017 Highland Floating Rate Opportunities Fund
on disposition of the securities; and (iii) an evaluation of theforces that influence the market in which these securitiesare purchased and sold. In these cases, the Fund’s NAV willreflect the affected portfolio securities’ fair valueas determined in the judgment of the Board or its desig-nee instead of being determined by the market. Using afair value pricing methodology to value securities mayresult in a value that is different from a security’s mostrecent sale price and from the prices used by otherinvestment companies to calculate their NAVs. Determi-nation of fair value is uncertain because it involves sub-jective judgments and estimates.
There can be no assurance that the Fund’s valuation of asecurity will not differ from the amount that it realizesupon the sale of such security. Those differences couldhave a material impact to the Fund. The NAV shown in theFund’s financial statements may vary from the NAV pub-lished by the Fund as of its period end because portfoliosecurities transactions are accounted for on the trade date(rather than the day following the trade date) for financialstatement purposes.
Fair Value MeasurementsThe Fund has performed an analysis of all existing invest-ments and derivative instruments to determine the sig-nificance and character of inputs to their fair valuedetermination. The levels of fair value inputs used tomeasure the Fund’s investments are characterized into afair value hierarchy. Where inputs for an asset or liabilityfall into more than one level in the fair value hierarchy, theinvestment is classified in its entirety based on the lowestlevel input that is significant to that investment’s valuation.The three levels of the fair value hierarchy are describedbelow:
Level 1 — Quoted unadjusted prices for identical instru-ments in active markets to which the Fund hasaccess at the date of measurement;
Level 2 — Quoted prices for similar instruments in activemarkets; quoted prices for identical or similarinstruments in markets that are not active, butare valued based on executed trades; brokerquotations that constitute an executable price;and alternative pricing sources supported byobservable inputs are classified within Level 2.Level 2 inputs are either directly or indirectlyobservable for the asset in connection withmarket data at the measurement date; and
Level 3 — Model derived valuations in which one or moresignificant inputs or significant value drivers areunobservable. In certain cases, investmentsclassified within Level 3 may include securities
for which the Fund has obtained indicativequotes from broker-dealers that do notnecessarily represent prices the broker may bewilling to trade on, as such quotes can be sub-ject to material management judgment.Unobservable inputs are those inputs thatreflect the Fund’s own assumptions that marketparticipants would use to price the asset orliability based on the best available information.
The Investment Adviser has established policies and proce-dures, as described above and approved by the Board, toensure that valuation methodologies for investments andfinancial instruments that are categorized within all levelsof the fair value hierarchy are fair and consistent. A PricingCommittee has been established to provide oversight ofthe valuation policies, processes and procedures, and iscomprised of personnel from the Investment Adviser andits affiliates. The Pricing Committee meets monthly toreview the proposed valuations for investments and finan-cial instruments and is responsible for evaluating theoverall fairness and consistent application of establishedpolicies.
As of December 31, 2017, the Fund’s investments consistedof senior loans, foreign denominated or domiciled seniorloans, collateralized loan obligations, corporate bonds andnotes, U.S. asset-backed securities, non-U.S. asset-backedsecurities, claims, common stocks, registered investmentcompanies, cash equivalents, rights and warrants. The fairvalue of the Fund’s senior loans and bonds are generallybased on quotes received from brokers or independentpricing services. Loans, bonds and asset-backed securitieswith quotes that are based on actual trades with a suffi-cient level of activity on or near the measurement date areclassified as Level 2 assets. Loans and bonds that arepriced using quotes derived from implied values, indicativebids, or a limited number of actual trades are classified asLevel 3 assets because the inputs used by the brokers andpricing services to derive the values are not readilyobservable.
The fair value of the Fund’s common stocks, registeredinvestment companies, rights and warrants that are notactively traded on national exchanges are generally pricedusing quotes derived from implied values, indicative bids,or a limited amount of actual trades and are classified asLevel 3 assets because the inputs used by the brokers andpricing services to derive the values are not readilyobservable. Exchange-traded options are valued based onthe last trade price on the primary exchange on whichthey trade. If an option does not trade, the mid-price,which is the mean of the bid and ask price, is utilized tovalue the option.
Semi-Annual Report 17

NOTES TO FINANCIAL STATEMENTS (unaudited) (continued)
December 31, 2017 Highland Floating Rate Opportunities Fund
At the end of each calendar quarter, the InvestmentAdviser evaluates the Level 2 and 3 assets and liabilities forchanges in liquidity, including but not limited to: whether abroker is willing to execute at the quoted price, the depthand consistency of prices from third party services, andthe existence of contemporaneous, observable trades inthe market. Additionally, the Investment Adviser evaluatesthe Level 1 and 2 assets and liabilities on a quarterly basisfor changes in listings or delistings on national exchanges.
Due to the inherent uncertainty of determining the fairvalue of investments that do not have a readily available
market value, the fair value of the Fund’s investments mayfluctuate from period to period. Additionally, the fair valueof investments may differ significantly from the values thatwould have been used had a ready market existed forsuch investments and may differ materially from the val-ues the Fund may ultimately realize. Further, such invest-ments may be subject to legal and other restrictionson resale or otherwise less liquid than publicly tradedsecurities.
The inputs or methodology used for valuing securities are not necessarily an indication of the risk associated with investing inthose securities. Transfers in and out of the levels are recognized at the value at the end of the period. A summary of the inputsused to value the Fund’s assets as of December 31, 2017 is as follows:
Totalvalue at
December 31, 2017
Level 1Quoted
Price
Level 2SignificantObservable
Inputs
Level 3Significant
UnobservableInputs
Floating Rate Opportunities Fund
AssetsU.S. Senior Loans
Aerospace $ 14,196,086 $— $ 14,196,086 $ —
Chemicals 1,397,344 — 1,397,344 —
Consumer Discretionary 25,170,080 — 25,170,080 —
Consumer Products 22,976,510 — 22,976,510 —
Energy 53,055,935 — 53,055,935 —
Financial 63,716,644 — 63,716,644 —
Food & Drug 9,723,496 — 9,723,496 —
Gaming & Leisure 14,164,055 — 5,027,489 9,136,566
Healthcare 82,122,288 — 56,553,717 25,568,571
Housing 29,795,146 — 25,508,746 4,286,400
Industrials 37,101,604 — 29,841,176 7,260,428
Information Technology 34,476,202 — 34,476,202 —
Manufacturing 27,653,430 — 27,653,430 —
Materials 4,026,833 — 4,026,833 —
Media & Telecommunications 23,894,706 — 23,894,706 —
Metals & Minerals 18,759,571 — 18,759,571 —
Retail 74,390,161 — 74,390,161 —
Service 75,910,595 — 75,910,595 —
Transportation 9,539,785 — 9,539,785 —
Utilities 52,128,699 — 52,128,699 —
Foreign Denominated or Domiciled Senior Loans
Canada 21,918,425 — 21,918,425 —
Luxembourg 46,027,373 — 46,027,373 —
Collateralized Loan Obligations 133,008,043 — 133,008,043 —
Corporate Bonds & Notes
Energy 3,963,900 — 2,887,500 1,076,400
Healthcare 17,019,375 — 17,019,375 —
Information Technology 2,179,935 — 2,179,935 —
Retail 11,917,074 — 11,917,074 —
Telecommunications 957,240 — 957,240 —
Utilities 150,000 — 150,000 —
18 Semi-Annual Report

NOTES TO FINANCIAL STATEMENTS (unaudited) (continued)
December 31, 2017 Highland Floating Rate Opportunities Fund
Totalvalue at
December 31, 2017
Level 1Quoted
Price
Level 2SignificantObservable
Inputs
Level 3Significant
UnobservableInputs
Claims $ 52,138 $ — $ — $ 52,138
Common Stocks
Energy 19,179,473 19,179,472 — 1
Financial —(2) —(2) — —
Gaming & Leisure —(2) — — —(2)
Healthcare —(2) — — —(2)
Housing 3,428,568 — — 3,428,568
Information Technology 1,406,475 1,406,475 — —
Media & Telecommunications 51,804,242 — 51,804,242 —
Materials 5,601,502 — — 5,601,502
Real Estate 9 — — 9
Utilities 20,641,909 20,479,286 — 162,623
Rights 1,089,919 — 1,089,919 —
Warrants
Energy 249,443 249,443 — —
Gaming & Leisure —(2) — — —(2)
Industrials 173,385 — — 173,385
Information Technology 44,925 — — 44,925
Master Limited Partnerships(1) 39,392,237 39,392,237 — —
Registered Investment Companies 12,434,111 12,434,111 — —
Cash Equivalents 57,539,393 57,539,393 — —
Total Assets 1,124,378,264 150,680,417 916,906,331 56,791,516
LiabilitiesSecurities Sold Short(1) (5,523,427) — (5,523,427) —
Total Liabilities (5,523,427) — (5,523,427) —
Total $1,118,854,837 $150,680,417 $911,382,904 $56,791,516
(1) See Investment Portfolio detail for industry breakout.(2) This category includes securities with a value of zero.
The table below set forth a summary of changes in the Fund’s assets measured at fair value using significant unobservableinputs (Level 3) for the period ended December 31, 2017.
Balanceas of
June 30,2017
Transfersinto
Level 3
TransfersOut
of Level 3
NetAmortization
(Accretion)of Premium/
(Discount)
NetRealized
Gain/(Losses)
NetUnrealized
Gains/(Losses)
NetPurchases
Net(Sales)
Balanceas of
December 31,2017
Change inUnrealized
Gain/(Loss)
on Level 3securities
still held atperiod end
Highland Floating Rate Opportunities Fund
U.S. Senior LoansGaming & Leisure $ 9,552,080 $ — $ — $ — $— $ (415,514) $ — $ — $ 9,136,566 $ (415,514)
Healthcare 24,146,282 — — — — 3,712,834 — (2,290,545) 25,568,571 3,712,834
Housing 4,000,000 — — — — 286,400 — — 4,286,400 286,400
Metals & Minerals — — — 43,658 — 1,148,875 6,067,895 — 7,260,428 1,148,875
Corporate Bonds & NotesUtilities — 1,076,400 — — — — — — 1,076,400 —
Claims 52,138 — — — — 115,221 — (115,221) 52,138 115,221
Semi-Annual Report 19

NOTES TO FINANCIAL STATEMENTS (unaudited) (continued)
December 31, 2017 Highland Floating Rate Opportunities Fund
Balanceas of
June 30,2017
Transfersinto
Level 3
TransfersOut
of Level 3
NetAmortization
(Accretion)of Premium/
(Discount)
NetRealized
Gain/(Losses)
NetUnrealized
Gains/(Losses)
NetPurchases
Net(Sales)
Balanceas of
December 31,2017
Change inUnrealizedGain/(Loss)on Level 3securities
still held atperiod end
Common StocksEnergy $ 1 $ — $ — $ — $ — $ — $ — $ — $ 1 $ —
Housing 3,675,821 — — — — (247,253) — — 3,428,568 (247,253)
Metals & Minerals — — — — — 4,154,048 1,447,454 — 5,601,502 4,154,048
Real Estate 10 — — — — 1,591,220 876,356 (2,467,577) 9 1,591,220
Utilities 242,015 — — — (14,308) 49,441 — (114,525) 162,623 49,441
WarrantsInformation Technology — — — — — 18,760 26,165 — 44,925 18,760
Industrials — — — — — 173,385 — — 173,385 173,385
Total $41,668,347 $1,076,400 $ — $43,658 $(14,308) $10,587,417 $8,417,870 $(4,987,868) $56,791,516 $10,587,417
Investments designated as Level 3 may include assetsvalued using quotes or indications furnished by brokerswhich are based on models or estimates and may not beexecutable prices. In light of the developing market con-ditions, the Investment Adviser continues to search forobservable data points and evaluate broker quotes andindications received for portfolio investments. As a result,for the six months ended December 31, 2017, a net
amount of $1,076,400 of the Fund’s portfolio investmentswere transferred from Level 2 to Level 3. Determination offair values is uncertain because it involves subjectivejudgments and estimates that are unobservable. Transfersfrom Level 2 to 3 were due to a decline in market activity(e.g. frequency of trades), which resulted in a reduction ofavailable market inputs to determine price.
The following is a summary of significant unobservable inputs used in the fair valuations of assets and liabilities categorizedwithin Level 3 of the fair value hierarchy:
Category
MarketValue at
12/31/2017 Valuation Technique Unobservable Inputs Input Value(s)
Highland Floating Rate Opportunities Fund
U.S. Senior Loans $46,251,965 Adjusted Appraisal Liquidity Discount 10%
Asset Specific Discount 10%
Liquidation Analysis Settlement Discount 54%
Multiples Analysis Multiple of Revenue 0.4x - 0.5x
Multiple of EBITDA 3.0x - 5.0x
Discounted Cash Flow Discount Rate 16.2%
Corporate Bonds & Notes 1,076,400 Liquidation Analysis Claim Amount: Percent of Par 6.9%
Claims 52,138 N/A N/A N/A
Common Stocks 9,192,703 Multiples Analysis Multiple of Revenue 0.4x - 0.5x
Multiple of EBITDA 3.0x - 8.25x
Discounted Cash Flow Scenario Probabilities 15% - 70%
Illiquidity Discount 10%
Discount Rate 12%
Minority Discount 20%
Terminal Multiple 7.0x
Discount for Lack of Marketability 15%
Multiples Analysis Capitalization Rate 6.50%
Discount 37%
Warrants 218,310 Black-Scholes Volatility 28%
Total $56,791,516
20 Semi-Annual Report

NOTES TO FINANCIAL STATEMENTS (unaudited) (continued)
December 31, 2017 Highland Floating Rate Opportunities Fund
Security TransactionsSecurity transactions are accounted for on the trade date.Realized gains/(losses) on investments sold are recordedon the basis of the specific identification method for bothfinancial statement and U.S. federal income tax purposestaking into account any foreign taxes withheld.
Income RecognitionCorporate actions (including cash dividends) are recordedon the ex-dividend date, net of applicable withholdingtaxes, except for certain foreign corporate actions, whichare recorded as soon after ex-dividend date as suchinformation becomes available and is verified. Interestincome is recorded on the accrual basis.
Accretion of discount and amortization of premium ontaxable bonds and loans are computed to the call ormaturity date, whichever is shorter, using the effectiveyield method. Withholding taxes on foreign dividends havebeen provided for in accordance with the Fund’s under-standing of the applicable country’s tax rules and rates.
U.S. Federal Income Tax StatusThe Fund is treated as a separate taxpayer for U.S. federalincome tax purposes. The Fund intends to qualify eachyear as a “regulated investment company” under Sub-chapter M of the Internal Revenue Code of 1986, asamended, and will distribute substantially all of their tax-able income and gains, if any, for the tax year, and as suchwill not be subject to U.S. federal income taxes. In addition,the Fund intends to distribute, in each calendar year, all oftheir net investment income, capital gains and certainother amounts, if any, such that the Fund should not besubject to U.S. federal excise tax. Therefore, no U.S. federalincome or excise tax provisions are recorded.
The Investment Adviser has analyzed the Fund’s tax posi-tions taken on U.S. federal income tax returns for all opentax years (current and prior three tax years), and has con-cluded that no provision for U.S. federal income tax isrequired in the Fund’s financial statements. The Fund’s U.S.federal and state income and U.S. federal excise tax returnsfor tax years for which the applicable statutes of limitationshave not expired are subject to examination by the InternalRevenue Service and state departments of revenue. Fur-thermore, the Investment Adviser of the Fund is also notaware of any tax positions for which it is reasonably possi-ble that the total amounts of unrecognized tax benefits willsignificantly change in the next 12 months.
Distributions to ShareholdersThe Fund plans to pay distributions from net investmentincome monthly and net realized capital gains annually tocommon shareholders. To permit the Fund to maintain
more stable monthly distributions and annual distributions,the Fund may from time to time distribute less than theentire amount of income and gains earned in the relevantmonth or year, respectively. The undistributed income andgains would be available to supplement future dis-tributions. In certain years, this practice may result in theFund distributing, during a particular taxable year,amounts in excess of the amount of income and gainsearned therein. Such distributions would result in a portionof each distribution occurring in that year to be treated asa return of capital to shareholders. Shareholders of theFund who have elected to have distributions reinvested willreceive common shares of the Fund issued in accordancewith the Fund’s Dividend Reinvestment Plan (the “Plan”).The number of newly issued common shares to be creditedto each participant’s account will be determined by divid-ing the dollar amount of the dividend by the lesser of (i) theNAV per Common Share determined on the DeclarationDate and (ii) the market price per Common Share as of theclose of regular trading on the NYSE on the DeclarationDate. Participants in the Plan requesting a sale of securitiesthrough the plan agent of the Plan are subject to a salesfee and a brokerage commission.
Cash & Cash EquivalentsThe Fund consider liquid assets deposited with a bank andcertain short-term debt instruments of sufficient creditquality with original maturities of three months or less tobe cash equivalents. The Fund also considers moneymarket instruments that invest in cash equivalents to becash equivalents. These investments represent amountsheld with financial institutions that are readily accessible topay Fund expenses or purchase investments. Cash andcash equivalents are valued at cost plus accrued interest,which approximates market value. The value of cashequivalents denominated in foreign currencies isdetermined by converting to U.S. dollars on the date of theStatement of Assets and Liabilities.
Foreign CurrencyAccounting records of the Fund are maintained in U.S. dol-lars. Foreign currencies, investments and other assets andliabilities denominated in foreign currencies are translatedinto U.S. dollars at exchange rates using the current 4:00 PMLondon Time Spot Rate. Fluctuations in the value of the for-eign currencies and other assets and liabilities resulting fromchanges in exchange rates, between trade and settlementdates on securities transactions and between the accrualand payment dates on dividends, interest income and for-eign withholding taxes, are recorded as unrealized foreigncurrency gains/(losses). Realized gains/(losses) and unreal-ized appreciation/(depreciation) on investment securities andincome and expenses are translated on the respective dates
Semi-Annual Report 21

NOTES TO FINANCIAL STATEMENTS (unaudited) (continued)
December 31, 2017 Highland Floating Rate Opportunities Fund
of such transactions. The effects of changes in foreign cur-rency exchange rates on investments in securities are notsegregated in the Statement of Operations from the effectsof changes in market prices of those securities, but areincluded with the net realized and unrealized gain or loss oninvestment securities.
Securities Sold ShortThe Fund may sell securities short. A security sold short is atransaction in which the Fund sells a security it does notown in anticipation that the market price of that securitywill decline. When the Fund sells a security short, it mustborrow the security sold short from a broker-dealer anddeliver it to the buyer upon conclusion of the transaction.The Fund may have to pay a fee to borrow particularsecurities and is often obligated to pay over any dividendsor other payments received on such borrowed securities.In some circumstances, the Fund may be allowed by itsprime broker to utilize proceeds from securities sold shortto purchase additional investments, resulting in leverage.Cash held as collateral for securities sold short is classifiedas restricted cash on the Statement of Assets andLiabilities, as applicable. Restricted cash in the amount of$5,719,157 was held with the broker for the Fund.Additionally, securities valued at $20,447,639 was postedin the Fund’s segregated account as collateral.
Other Fee IncomeFee income may consist of origination/closing fees,amendment fees, administrative agent fees, transactionbreak-up fees and other miscellaneous fees. Originationfees, amendment fees, and other similar fees arenon-recurring fee sources. Such fees are received on atransaction by transaction basis and do not constitute aregular stream of income and are recognized whenincurred.
Note 3. Derivative TransactionsThe Fund is subject to equity securities risk, interest raterisk and currency risk in the normal course of pursuingtheir investment objectives. The Fund enters into derivativetransactions for the purpose of hedging against the effectsof changes in the value of portfolio securities due toanticipated changes in market conditions, to gain marketexposure for residual and accumulating cash positions andfor managing the duration of fixed income investments.
OptionsThe Fund may utilize options on securities or indices tovarying degrees as part of their principal investment strat-egy. An option on a security is a contract that gives theholder of the option, in return for a premium, the right tobuy from (in the case of a call) or sell to (in the case of a
put) the writer of the option the security underlying theoption at a specified exercise or “strike” price. The writer ofan option on a security has the obligation upon exercise ofthe option to deliver the underlying security upon paymentof the exercise price or to pay the exercise price upondelivery of the underlying security. The Fund may holdoptions, write option contracts, or both.
If an option written by a Fund expires unexercised, a Fundrealizes on the expiration date a capital gain equal to thepremium received by a Fund at the time the option waswritten. If an option purchased by a Fund expiresunexercised, a Fund realizes a capital loss equal to thepremium paid. Prior to the earlier of exercise or expiration,an exchange-traded option may be closed out by an off-setting purchase or sale of an option of the same series(type, underlying security, exercise price and expiration).There can be no assurance, however, that a closing pur-chase or sale transaction can be effected when a Funddesires. A Fund will realize a capital gain from a closingpurchase transaction if the cost of the closing option is lessthan the premium received from writing the option, or, ifthe cost of the closing option is more than the premiumreceived from writing the option, a capital loss. A Fund willrealize a capital gain from a closing sale transaction if thepremium received from the sale is more than the originalpremium paid when the option position was opened, or acapital loss, if the premium received from a sale is less thanthe original premium paid.
For the period ended December 31, 2017, the Fund did notinvest in or write any options.
Note 4. Securities LendingThe Fund may seek additional income by making securedloans of its portfolio securities through its custodian, StateStreet Bank and Trust Company (“State Street”). Such loanswill be in an amount not greater than one-third of thevalue of the Fund’s total assets. State Street will charge aFund fees based on a percentage of the securities lendingincome.
The Fund will receive collateral consisting of cash (U.S. andforeign currency), securities issued or guaranteed by theU.S. government or its agencies or instrumentalities,sovereign debt, convertible bonds, irrevocable bank lettersof credit or such other collateral as may be agreed on bythe parties to a securities lending arrangement, initiallywith a value of 102% or 105% of the market value of theloaned securities and thereafter maintained at a value of100% of the market value of the loaned securities. If thecollateral consists of non-cash collateral, the borrower willpay the Fund a loan premium fee. If the collateral consistsof cash, State Street will reinvest the cash. Although voting
22 Semi-Annual Report
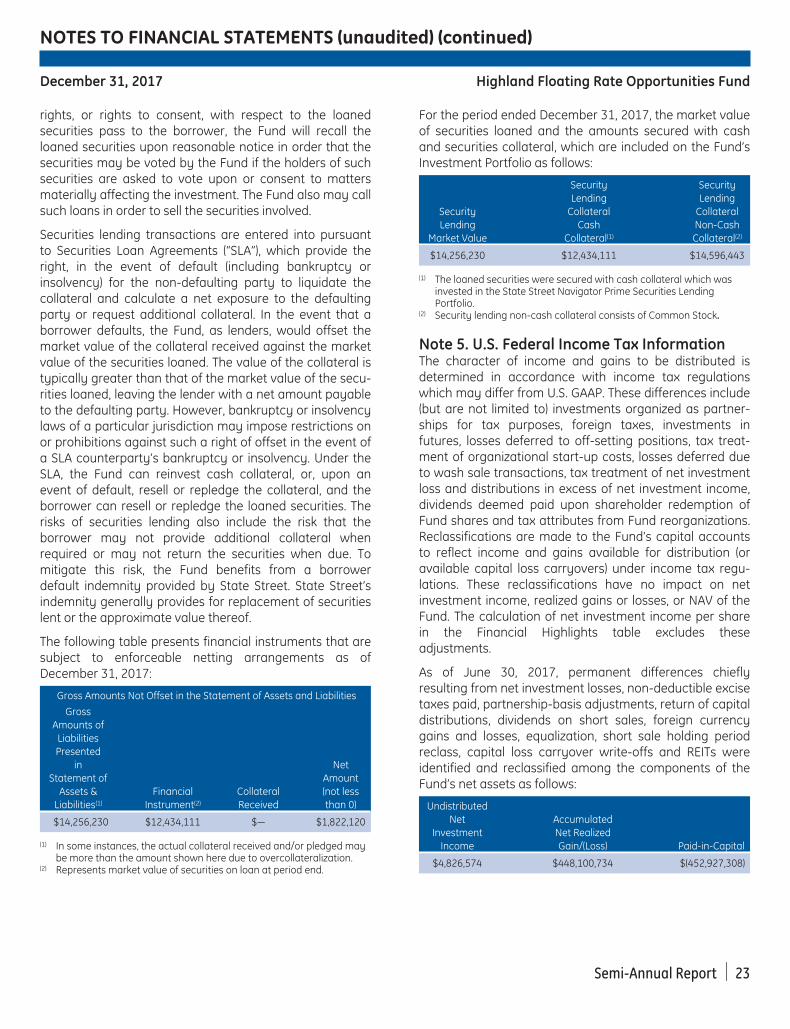
NOTES TO FINANCIAL STATEMENTS (unaudited) (continued)
December 31, 2017 Highland Floating Rate Opportunities Fund
rights, or rights to consent, with respect to the loanedsecurities pass to the borrower, the Fund will recall theloaned securities upon reasonable notice in order that thesecurities may be voted by the Fund if the holders of suchsecurities are asked to vote upon or consent to mattersmaterially affecting the investment. The Fund also may callsuch loans in order to sell the securities involved.
Securities lending transactions are entered into pursuantto Securities Loan Agreements (“SLA”), which provide theright, in the event of default (including bankruptcy orinsolvency) for the non-defaulting party to liquidate thecollateral and calculate a net exposure to the defaultingparty or request additional collateral. In the event that aborrower defaults, the Fund, as lenders, would offset themarket value of the collateral received against the marketvalue of the securities loaned. The value of the collateral istypically greater than that of the market value of the secu-rities loaned, leaving the lender with a net amount payableto the defaulting party. However, bankruptcy or insolvencylaws of a particular jurisdiction may impose restrictions onor prohibitions against such a right of offset in the event ofa SLA counterparty’s bankruptcy or insolvency. Under theSLA, the Fund can reinvest cash collateral, or, upon anevent of default, resell or repledge the collateral, and theborrower can resell or repledge the loaned securities. Therisks of securities lending also include the risk that theborrower may not provide additional collateral whenrequired or may not return the securities when due. Tomitigate this risk, the Fund benefits from a borrowerdefault indemnity provided by State Street. State Street’sindemnity generally provides for replacement of securitieslent or the approximate value thereof.
The following table presents financial instruments that aresubject to enforceable netting arrangements as ofDecember 31, 2017:
Gross Amounts Not Offset in the Statement of Assets and Liabilities
GrossAmounts of
LiabilitiesPresented
inStatement of
Assets &Liabilities(1)
FinancialInstrument(2)
CollateralReceived
NetAmount(not lessthan 0)
$14,256,230 $12,434,111 $— $1,822,120
(1) In some instances, the actual collateral received and/or pledged maybe more than the amount shown here due to overcollateralization.
(2) Represents market value of securities on loan at period end.
For the period ended December 31, 2017, the market valueof securities loaned and the amounts secured with cashand securities collateral, which are included on the Fund’sInvestment Portfolio as follows:
SecurityLending
Market Value
SecurityLending
CollateralCash
Collateral(1)
SecurityLending
CollateralNon-CashCollateral(2)
$14,256,230 $12,434,111 $14,596,443
(1) The loaned securities were secured with cash collateral which wasinvested in the State Street Navigator Prime Securities LendingPortfolio.
(2) Security lending non-cash collateral consists of Common Stock.
Note 5. U.S. Federal Income Tax InformationThe character of income and gains to be distributed isdetermined in accordance with income tax regulationswhich may differ from U.S. GAAP. These differences include(but are not limited to) investments organized as partner-ships for tax purposes, foreign taxes, investments infutures, losses deferred to off-setting positions, tax treat-ment of organizational start-up costs, losses deferred dueto wash sale transactions, tax treatment of net investmentloss and distributions in excess of net investment income,dividends deemed paid upon shareholder redemption ofFund shares and tax attributes from Fund reorganizations.Reclassifications are made to the Fund’s capital accountsto reflect income and gains available for distribution (oravailable capital loss carryovers) under income tax regu-lations. These reclassifications have no impact on netinvestment income, realized gains or losses, or NAV of theFund. The calculation of net investment income per sharein the Financial Highlights table excludes theseadjustments.
As of June 30, 2017, permanent differences chieflyresulting from net investment losses, non-deductible excisetaxes paid, partnership-basis adjustments, return of capitaldistributions, dividends on short sales, foreign currencygains and losses, equalization, short sale holding periodreclass, capital loss carryover write-offs and REITs wereidentified and reclassified among the components of theFund’s net assets as follows:
UndistributedNet
InvestmentIncome
AccumulatedNet RealizedGain/(Loss) Paid-in-Capital
$4,826,574 $448,100,734 $(452,927,308)
Semi-Annual Report 23

NOTES TO FINANCIAL STATEMENTS (unaudited) (continued)
December 31, 2017 Highland Floating Rate Opportunities Fund
At June 30, 2017, the Fund’s most recent tax year end,components of distributable earnings on a tax basis is asfollows:
UndistributedIncome
OtherTemporary
Differences(1)
AccumulatedCapital and
Other Losses
Net TaxAppreciation/
(Depreciation)(2)
$— $(295,816) $(266,492,893) $(435,121,032)
(1) Other temporary differences are comprised of dividends payable,organizational expenses, partnership adjustments and default loanmarket discounts.
(2) Any differences between book-basis and tax-basis net unrealizedappreciation/(depreciation) are primarily due to deferral of losses fromwash sales and other adjustments.
As of June 30, 2017, the Fund has capital loss carryoversas indicated below. The capital loss carryovers are avail-able to offset future realized capital gains to the extentprovided in the Code and regulations promulgated there-under. To the extent that these carryover losses are usedto offset future capital gains, it is probable that the gainsso offset will not be distributed to shareholders becausethey would be taxable as ordinary income.
2018
NoExpiration
Short-Term(1)
NoExpiration
Long-Term(1) Total
$143,999,490(2) $1,898,408 $99,790,222 $245,688,120
(1) On December 22, 2010, the Regulated Investment Company Modern-ization Act of 2010 (the “Modernization Act”) was signed into law. TheModernization Act modifies several of the Federal income and excisetax provisions related to RICs. Under the Modernization Act, new capi-tal losses may now be carried forward indefinitely, and retain thecharacter of the original loss as compared with pre-enactment lawwhere capital losses could be carried forward for eight years, andcarried forward as short-term capital losses, irrespective of thecharacter of the original loss.
(2) These capital loss carryforward amounts were acquired in areorganization and are available to offset future capital gains of Float-ing Rate Opportunities Fund. The Fund’s ability to utilize the capitalloss carryforwards is limited under Internal Revenue Serviceregulations.
The tax character of distributions paid during the yearsended June 30, 2017 and June 30, 2016 (unless otherwiseindicated) is as follows:
Distributions Paid From:
OrdinaryIncome(1)
Long-Term
CapitalGains
Return ofCapital
2017 $31,812,190 $— $2,014,621
2016 36,245,131 — —
(1) For tax purposes, short-term capital gains distributions, if any, areconsidered ordinary income distributions.
Unrealized appreciation and depreciation at December 31,2017, based on cost of investments for U.S. federal incometax purposes was:
GrossAppreciation
GrossDepreciation
NetAppreciation/(Depreciation) Cost
$48,322,598 $(466,211,250) $(417,888,652) $1,536,743,489
Qualified Late Year Ordinary and Post OctoberLossesUnder current laws, certain capital losses realized afterOctober 31 may be deferred (and certain ordinary lossesafter January 1st may be deferred) and treated as occur-ring on the first day of the following fiscal year. For thefiscal year ended June 30, 2017, the Fund elected to deferthe following losses incurred from November 1, 2016through June 30, 2017:
Realized CapitalLosses Ordinary Losses
$(20,046,942) $(757,831)
Note 6. Advisory, Administration, Service andDistribution, Trustee, and Other FeesInvestment Advisory Fees and Sub-AdvisoryFeesFor its investment advisory and sub-advisory services, theFund pays the Investment Adviser a monthly fee, com-puted and accrued daily, based on an annual rate of theFund’s Average Daily Managed Assets. Average DailyManaged Assets of a Fund means the average daily valueof the total assets of a Fund less all accrued liabilities of aFund (other than the aggregate amount of any out-standing borrowings constituting financial leverage).
The table below shows the Fund’s contractual advisory feewith the Investment Adviser for the period endedDecember 31, 2017:
Annual FeeRate to theInvestment
Adviser > 1 Billion > 2 Billion
0.65% 0.60% 0.55%
Administration FeesThe Investment Adviser provides administrative services tothe Fund. For its services, the Investment Adviser receivesan annual fee, payable monthly, in an amount equal to0.20% of the Fund’s Average Daily Managed Assets. Undera separate sub-administration agreement, the InvestmentAdviser has delegated certain administrative functions toState Street. The Investment Adviser pays State Streetdirectly for these sub-administration services.
24 Semi-Annual Report
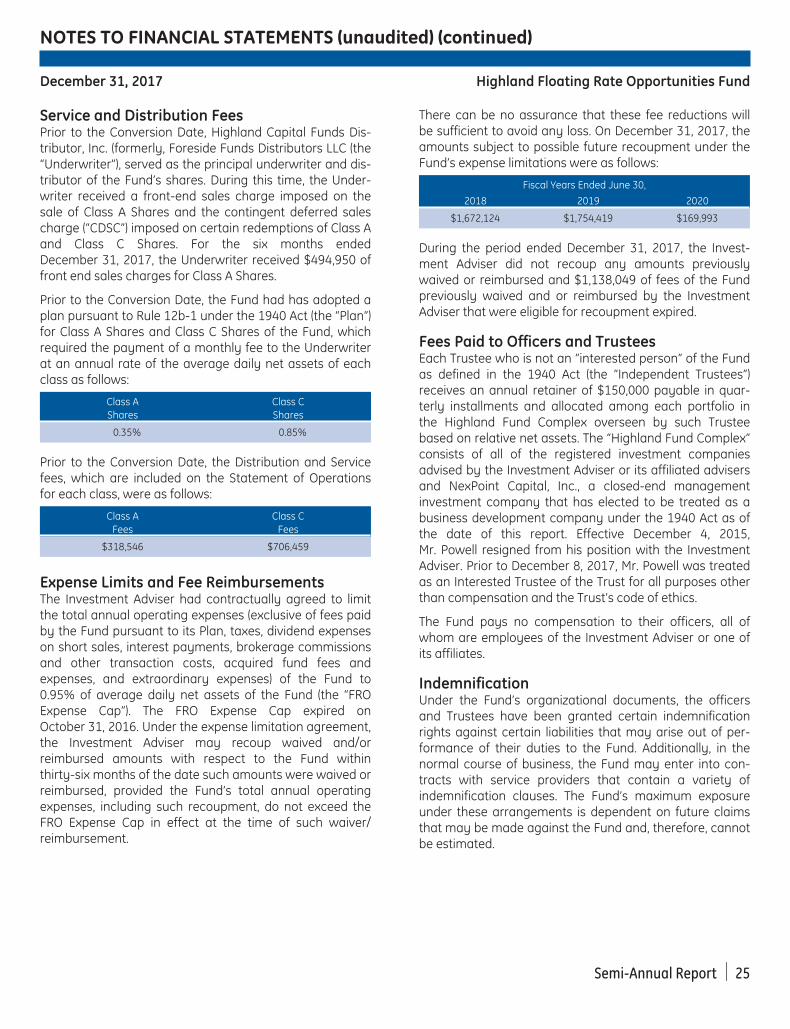
NOTES TO FINANCIAL STATEMENTS (unaudited) (continued)
December 31, 2017 Highland Floating Rate Opportunities Fund
Service and Distribution FeesPrior to the Conversion Date, Highland Capital Funds Dis-tributor, Inc. (formerly, Foreside Funds Distributors LLC (the“Underwriter”), served as the principal underwriter and dis-tributor of the Fund’s shares. During this time, the Under-writer received a front-end sales charge imposed on thesale of Class A Shares and the contingent deferred salescharge (“CDSC”) imposed on certain redemptions of Class Aand Class C Shares. For the six months endedDecember 31, 2017, the Underwriter received $494,950 offront end sales charges for Class A Shares.
Prior to the Conversion Date, the Fund had has adopted aplan pursuant to Rule 12b-1 under the 1940 Act (the “Plan”)for Class A Shares and Class C Shares of the Fund, whichrequired the payment of a monthly fee to the Underwriterat an annual rate of the average daily net assets of eachclass as follows:
Class AShares
Class CShares
0.35% 0.85%
Prior to the Conversion Date, the Distribution and Servicefees, which are included on the Statement of Operationsfor each class, were as follows:
Class AFees
Class CFees
$318,546 $706,459
Expense Limits and Fee ReimbursementsThe Investment Adviser had contractually agreed to limitthe total annual operating expenses (exclusive of fees paidby the Fund pursuant to its Plan, taxes, dividend expenseson short sales, interest payments, brokerage commissionsand other transaction costs, acquired fund fees andexpenses, and extraordinary expenses) of the Fund to0.95% of average daily net assets of the Fund (the “FROExpense Cap”). The FRO Expense Cap expired onOctober 31, 2016. Under the expense limitation agreement,the Investment Adviser may recoup waived and/orreimbursed amounts with respect to the Fund withinthirty-six months of the date such amounts were waived orreimbursed, provided the Fund’s total annual operatingexpenses, including such recoupment, do not exceed theFRO Expense Cap in effect at the time of such waiver/reimbursement.
There can be no assurance that these fee reductions willbe sufficient to avoid any loss. On December 31, 2017, theamounts subject to possible future recoupment under theFund’s expense limitations were as follows:
Fiscal Years Ended June 30,
2018 2019 2020
$1,672,124 $1,754,419 $169,993
During the period ended December 31, 2017, the Invest-ment Adviser did not recoup any amounts previouslywaived or reimbursed and $1,138,049 of fees of the Fundpreviously waived and or reimbursed by the InvestmentAdviser that were eligible for recoupment expired.
Fees Paid to Officers and TrusteesEach Trustee who is not an “interested person” of the Fundas defined in the 1940 Act (the “Independent Trustees”)receives an annual retainer of $150,000 payable in quar-terly installments and allocated among each portfolio inthe Highland Fund Complex overseen by such Trusteebased on relative net assets. The “Highland Fund Complex”consists of all of the registered investment companiesadvised by the Investment Adviser or its affiliated advisersand NexPoint Capital, Inc., a closed-end managementinvestment company that has elected to be treated as abusiness development company under the 1940 Act as ofthe date of this report. Effective December 4, 2015,Mr. Powell resigned from his position with the InvestmentAdviser. Prior to December 8, 2017, Mr. Powell was treatedas an Interested Trustee of the Trust for all purposes otherthan compensation and the Trust’s code of ethics.
The Fund pays no compensation to their officers, all ofwhom are employees of the Investment Adviser or one ofits affiliates.
IndemnificationUnder the Fund’s organizational documents, the officersand Trustees have been granted certain indemnificationrights against certain liabilities that may arise out of per-formance of their duties to the Fund. Additionally, in thenormal course of business, the Fund may enter into con-tracts with service providers that contain a variety ofindemnification clauses. The Fund’s maximum exposureunder these arrangements is dependent on future claimsthat may be made against the Fund and, therefore, cannotbe estimated.
Semi-Annual Report 25

NOTES TO FINANCIAL STATEMENTS (unaudited) (continued)
December 31, 2017 Highland Floating Rate Opportunities Fund
Note 7. Disclosure of Significant Risks andContingenciesThe primary risks of investing in the Fund are describedbelow in alphabetical order:
Counterparty RiskCounterparty risk is the potential loss the Fund may incuras a result of the failure of a counterparty or an issuer tomake payments according to the terms of a contract.Counterparty risk is measured as the loss the Fund wouldrecord if its counterparties failed to perform pursuant tothe terms of their obligations to the Fund. Because theFund may enter into over-the-counter forwards, options,swaps and other derivative financial instruments, the Fundmay be exposed to the credit risk of their counterparties.To limit the counterparty risk associated with such trans-actions, the Fund conduct business only with financialinstitutions judged by the Investment Adviser to presentacceptable credit risk.
Credit RiskInvestments rated below investment grade are commonlyreferred to as high-yield, high risk or “junk debt.” They areregarded as predominantly speculative with respect to theissuing company’s continuing ability to meet principal and/or interest payments. Investments in high yield debt andhigh yield Senior Loans may result in greater NAV fluctua-tion than if the Fund did not make such investments.
Corporate debt obligations, including Senior Loans, aresubject to the risk of non-payment of scheduled interestand/or principal. Non-payment would result in a reductionof income to the Fund, a reduction in the value of thecorporate debt obligation experiencing non-payment anda potential decrease in the NAV of the Fund.
Currency RiskA portion of the Fund’s assets may be quoted or denomi-nated in non-U.S. currencies. These securities may beadversely affected by fluctuations in relative currencyexchange rates and by exchange control regulations. TheFund’s investment performance may be negativelyaffected by a devaluation of a currency in which theFund’s investments are quoted or denominated. Further,the Fund’s investment performance may be significantlyaffected, either positively or negatively, by currencyexchange rates because the U.S. dollar value of securitiesquoted or denominated in another currency will increaseor decrease in response to changes in the value of suchcurrency in relation to the U.S. dollar.
Derivatives RiskDerivatives risk is a combination of several risks, includingthe risks that: (1) an investment in a derivative instrument
may not correlate well with the performance of the secu-rities or asset class to which the Fund seeks exposure,(2) derivative contracts, including options, may expireworthless and the use of derivatives may result in losses tothe Fund, (3) a derivative instrument entailing leveragemay result in a loss greater than the principal amountinvested, (4) derivatives not traded on an exchange may besubject to credit risk, for example, if the counterparty doesnot meet its obligations (see also “Counterparty Risk”), and(5) derivatives not traded on an exchange may be subjectto liquidity risk and the related risk that the instrument isdifficult or impossible to value accurately. As a generalmatter, when the Fund establishes certain derivativeinstrument positions, such as certain futures, options andforward contract positions, it will segregate liquid assets(such as cash, U.S. Treasury bonds or commercial paper)equivalent to the Fund’s outstanding obligations under thecontract or in connection with the position. In addition,changes in laws or regulations may make the use ofderivatives more costly, may limit the availability ofderivatives, or may otherwise adversely affect the use,value or performance of derivatives. A Fund’s ability topursue its investment strategy, including its strategy ofinvesting in certain derivative instruments, may be limitedto or adversely affected by the Fund’s intention to qualifyas a regulated investment company, and its strategy maybear adversely on its ability to so qualify.
Distressed and Defaulted Securities RiskThe Fund may invest in companies that are troubled, indistress or bankrupt. As such, they are subject to a multi-tude of legal, industry, market, environmental and gov-ernmental forces that make analysis of these companiesinherently difficult. Further, the Investment Adviser relieson company management, outside experts, market partic-ipants and personal experience to analyze potentialinvestments for the Fund. There can be no assurance thatany of these sources will prove credible, or that the result-ing analysis will produce accurate conclusions.
Hedging RiskThe Fund may engage in “hedging,” the practice of attempt-ing to offset a potential loss in one position by establishingan opposite position in another investment. Hedging strat-egies in general are usually intended to limit or reduceinvestment risk, but can also be expected to limit or reducethe potential for profit. For example, if the Fund has taken adefensive posture by hedging its portfolio, and stock pricesadvance, the return to investors will be lower than if theportfolio had not been hedged. No assurance can be giventhat any particular hedging strategy will be successful, orthat the Investment Adviser will elect to use a hedgingstrategy at a time when it is advisable.
26 Semi-Annual Report

NOTES TO FINANCIAL STATEMENTS (unaudited) (continued)
December 31, 2017 Highland Floating Rate Opportunities Fund
Illiquid and Restricted Securities RiskThe investments made by the Fund may be illiquid, andconsequently the Fund may not be able to sell suchinvestments at prices that reflect the Investment Adviser’sassessment of their value or the amount originally paid forsuch investments by the Fund. Illiquidity may result fromthe absence of an established market for the investmentsas well as legal, contractual or other restrictions on theirresale and other factors. Furthermore, the nature of theFund’s investments, especially those in financially dis-tressed companies, may require a long holding period priorto profitability.
Restricted securities (i.e., securities acquired in privateplacement transactions) and illiquid securities may offerhigher yields than comparable publicly traded securities.The Fund, however, may not be able to sell these securitieswhen the Investment Adviser considers it desirable to do soor, to the extent they are sold privately, may have to sellthem at less than the price of otherwise comparable secu-rities. Restricted securities are subject to limitations onresale which can have an adverse effect on the priceobtainable for such securities. Also, if in order to permitresale the securities are registered under the Securities Actat the Fund’s expense, the Fund’s expenses would beincreased.
Leverage RiskThe Fund may use leverage in its investment program,including the use of borrowed funds and investments incertain types of options, such as puts, calls and warrants,which may be purchased for a fraction of the price of theunderlying securities. While such strategies and techniquesincrease the opportunity to achieve higher returns on theamounts invested, they also increase the risk of loss. To theextent the Fund purchase securities with borrowed funds,their net assets will tend to increase or decrease at agreater rate than if borrowed funds are not used. If theinterest expense on borrowings were to exceed the netreturn on the portfolio securities purchased with borrowedfunds, the Fund’s use of leverage would result in a lowerrate of return than if the Fund were not leveraged.
Non-U.S. Securities RiskThe Fund may invest in non-U.S. securities. Investing innon-U.S. securities involves certain risks not involved indomestic investments, including, but not limited to: fluctua-tions in foreign exchange rates; future foreign economic,financial, political and social developments; different legalsystems; the possible imposition of exchange controls orother foreign governmental laws or restrictions; lower trad-ing volume; much greater price volatility and illiquidity ofcertain non-U.S. securities markets; different trading andsettlement practices; less governmental supervision;
changes in currency exchange rates; high and volatilerates of inflation; fluctuating interest rates; less publiclyavailable information; and different accounting, auditingand financial recordkeeping standards and requirements.
Options RiskThere are several risks associated with transactions inoptions on securities. For example, there are significantdifferences between the securities and options marketsthat could result in an imperfect correlation between thesemarkets, causing a given transaction not to achieve itsobjectives. A transaction in options or securities may beunsuccessful to some degree because of market behavioror unexpected events.
When the Fund writes a covered call option, the Fund for-goes, during the option’s life, the opportunity to profit fromincreases in the market value of the security covering thecall option above the sum of the premium and the strikeprice of the call, but retains the risk of loss should the priceof the underlying security decline. The writer of an optionhas no control over the time when it may be required tofulfill its obligation and once an option writer has receivedan exercise notice, it must deliver the underlying securityin exchange for the strike price.
When the Fund writes a covered put option, the Fundbears the risk of loss if the value of the underlying stockdeclines below the exercise price minus the put premium. Ifthe option is exercised, the Fund could incur a loss if it isrequired to purchase the stock underlying the put option ata price greater than the market price of the stock at thetime of exercise plus the put premium the Fund receivedwhen it wrote the option. While the Fund’s potential gain inwriting covered put option is limited to distributions earnedon the liquid assets securing the put option plus the pre-mium received from the purchaser of the put option, theFund risks a loss equal to the entire exercise price of theoption minus the put premium.
Senior Loans RiskThe risk that the issuer of a senior may fail to pay interestor principal when due, and changes in market interest ratesmay reduce the value of the senior loan or reduce theFund’s returns. The risks associated with senior loans aresimilar to the risks of high yield debt securities. Senior loansand other debt securities are also subject to the risk of pricedeclines and to increases in interest rates, particularlylong-term rates. Senior loans are also subject to the riskthat, as interest rates rise, the cost of borrowing increases,which may increase the risk of default. In addition, theinterest rates of floating rate loans typically only adjust tochanges in short-term interest rates; long-term interestrates can vary dramatically from short-term interest rates.
Semi-Annual Report 27

NOTES TO FINANCIAL STATEMENTS (unaudited) (continued)
December 31, 2017 Highland Floating Rate Opportunities Fund
Therefore, senior loans may not mitigate price declines in along-term interest rate environment. The Fund’s invest-ments in senior loans are typically below investment gradeand are considered speculative because of the credit risk oftheir issuers.
Short Sales RiskShort sales by the Fund that are not made where there is anoffsetting long position in the asset that it is being sold shorttheoretically involve unlimited loss potential since the mar-ket price of securities sold short may continuously increase.Short selling allows the Fund to profit from declines in mar-ket prices to the extent such decline exceeds the transactioncosts and costs of borrowing the securities. However, sincethe borrowed securities must be replaced by purchases atmarket prices in order to close out the short position, anyappreciation in the price of the borrowed securities wouldresult in a loss. Purchasing securities to close out the shortposition can itself cause the price of securities to rise further,thereby exacerbating the loss. The Fund may mitigate suchlosses by replacing the securities sold short before themarket price has increased significantly. Under adversemarket conditions, a Fund might have difficulty purchasingsecurities to meet margin calls on its short sale deliveryobligations, and might have to sell portfolio securities to
raise the capital necessary to meet its short sale obligationsat a time when fundamental investment considerationswould not favor such sales.
Gain ContingencyClaymore Holdings, LLC, a partially-owned affiliate of theFund, is engaged in ongoing litigation that could result in apossible gain contingency to the Fund. The probability, tim-ing, and potential amount of recovery, if any, are unknown.
Note 8. Investment Transactions Purchasesand Sales of Securities
Purchases & Sales of SecuritiesThe cost of purchases and the proceeds from sales ofinvestments, other than short-term securities and short-term options, for the period ended December 31, 2017,were as follows:
U.S GovernmentSecurities(1) Other Securities
Purchases Sales Purchases Sales
$— $— $694,227,165 $511,111,649
(1) The Fund did not have any purchases or sales of U.S. GovernmentSecurities for the period ended December 31, 2017.
Note 9. Affiliated IssuersUnder Section 2 (a) (3) of the Investment Company Act of 1940, as amended, a portfolio company is defined as “affiliated” if afund owns five percent or more of its outstanding voting securities or if the portfolio company is under common control. Thetables below show affiliated issuers of the Fund as of the period ended December 31, 2017:
Issuer
Shares atJune 30,
2017
BeginningValue as of
June 30,2017
Purchasesat Cost
Proceedsfrom Sales
Net RealizedGain/(Loss)on Sales ofAffiliatedIssuers
Change inUnrealized
Appreciation/Depreciation
EndingValue as of
December 31,2017
Shares atDecember 31,
2017AffiliatedIncome
Majority Owned NotConsolidated
Allenby (Common Stocks) 1,323,961 $ 1 $115,110 $ (313,638) $— $ 198,528 $ 1 1,125,433 $ —Claymore (Common Stocks) 8,984,111 9 761,246 (2,153,939) — 1,392,692 8 7,591,418 —
Other AffiliatesCCS Medical, Inc. (U.S. Senior
Loans & Common Stocks) 46,240,843 24,146,282 — (2,290,545) — 3,712,834 25,568,571 46,443,145 2,437,821LLV Holdco, LLC (U.S. Senior
Loans, Common Stocks andWarrants 11,989,033 9,552,080 — — — (415,515) 9,136,565 11,989,033 —
Nevada Land Group LLC (U.S.Senior Loans & CommonStocks) 1,743,503 — — — — — — 1,743,503 —
Total 70,281,451 $33,698,372 $876,356 $(4,758,122) $— $4,888,539 $34,705,145 68,892,532 $2,437,821
28 Semi-Annual Report

NOTES TO FINANCIAL STATEMENTS (unaudited) (continued)
December 31, 2017 Highland Floating Rate Opportunities Fund
Note 10. Legal MattersMatters Relating to FRO’s Investment in TOUSA, Inc.
Floating Rate Opportunities Fund (“FRO”) is one of numerousdefendants (“Lenders”) named in an adversary proceedingpending in the Bankruptcy Court of the Southern District ofFlorida (the “Court”). The action, entitled In re Tousa Inc., etal., was filed on July 15, 2008, by the Official Committee ofUnsecured Creditors of TOUSA, Inc. and its affiliates (the“Plaintiff”), which are home building companies to which theLenders loaned money through different lending facilities.Plaintiff alleged that monies used to repay the Lendersshould be voided as fraudulent and preferential transfersunder the bankruptcy laws. More specifically, Plaintiffalleges that subsidiaries of the home building companieswere forced to become co-borrowers and guarantors of themonies used to repay the Lenders, and that the subsidiariesdid not receive fair consideration or reasonably equivalentvalue when they transferred the proceeds to repay theLenders. Plaintiff sought to void the transfers and otherequitable relief. FRO and other Funds and accounts man-aged by the Investment Adviser and the other Lenders werenamed as defendants in two separate lending capacities;first, as lenders in a credit agreement (the “Credit Lenders”);and second, as lenders in a term loan (the “Term LoanLenders”). On October 13, 2009, the Bankruptcy Court ruledfor the Plaintiff in the action and ordered the Defendants toreturn the proceeds received from the payoff of the termloan at par on July 31, 2007. The proceeds received by FROtotaled $8,000,000. Additionally, the court ordered theDefendants to pay simple interest on the amount returnedat an annual rate of 9% through October 13, 2009. InNovember 2009, FRO and other Defendants appealed thedecision from the Bankruptcy Court to the District Court. OnDecember 22, 2009, FRO posted $10,620,958 (“Security”)with the Court. On February 11, 2011, the District Courtentered an order quashing all liability of the Lenders anddeclaring the remedies against the Lenders null and void. OnMay 15, 2012, the Eleventh Circuit Court of Appeal (“EleventhCircuit”) issued its decision reversing the judgment of theDistrict Court, affirming the liability findings of the Bank-ruptcy Court, and remanding to the District Court for furtherproceedings consistent with their opinion. On June 23, 2015,the District Court remanded a portion of the case to theBankruptcy Court for a report and recommendationsregarding the effects of certain settlements on the Plaintiff’savailable damages. On April 1, 2016, the Bankruptcy Courtissued its Report and Recommendations to the DistrictCourt. On March 8, 2017, the District Court substantiallyadopted the Bankruptcy Court Report and Recom-mendations, which affirmed the Defendants’ liability. Theappeal was set to be heard before the Eleventh Circuit onDecember 12, 2017. On or about December 1, 2017, the
parties reached a settlement in principal. Final settlementand dismissal was approved by the court on January 12,2018. Prior to settlement, the Fund’s Security has accrued$183,808 in deposit interest. The Fund paid $6,312,767.10 insettlement, representing its pro rata share of total$160,000,000 settlement amount. As a result, the Fund willreceive a return of $4,491,999.34 in previously-posted Secu-rity, such amount expected to be received by the Fund nolater than the close of the Q1 2018.
Note 11. New Accounting PronouncementsIn October 2016, the U.S. Securities and Exchange Commis-sion adopted new rules and amended existing rules(together, “final rules”) intended to modernize the reportingand disclosure of information by registered investmentcompanies. In part, the final rules amend Regulation S-Xand require standardized, enhanced disclosure aboutderivatives in investment company financial statements,as well as other amendments. The compliance date for theamendments to Regulation S-X is August 1, 2017, and theInvestment Adviser has implemented the applicablerequirements into this report.
In November, 2016, the FASB issued Accounting StandardsUpdate 2016-18, Statement of Cash Flows (Topic 230):Restricted Cash. The amendments in this update requirethe statement of cash flows explain the change during theperiod in the total of cash, cash equivalents. Amountsgenerally described as restricted cash or restricted cashequivalents should be included with cash and cash equiv-alents when reconciling the beginning-of-period andend-of-period total amounts shown on the statement ofcash flows. For public entities this update will be effectivefor fiscal years beginning after December 15, 2017, and forinterim periods within those fiscal years. For all other enti-ties, this update is effective for fiscal years beginning afterDecember 15, 2018, and interim periods within fiscal yearsbeginning after December 15, 2019. The InvestmentAdviser is currently evaluating the impact of this newguidance on the Fund’s financial statements.
In December 2016, the FASB issued Accounting StandardsUpdate 2016-19, Technical Corrections and Improvements.The amendments in this update include an amendment toFASB ASC Topic 820, Fair Value Measurement and Dis-closures to clarify the difference between a valuationapproach and a valuation technique. The amendment alsorequires an entity to disclose when there has been achange in either or both a valuation approach and/or avaluation technique. For public entities, this update will beeffective for fiscal years beginning after December 15,2017, and for interim periods within those fiscal years. Forall other entities, this update is effective for fiscal years
Semi-Annual Report 29

NOTES TO FINANCIAL STATEMENTS (unaudited) (concluded)
December 31, 2017 Highland Floating Rate Opportunities Fund
beginning after December 15, 2018, and interim periodswithin fiscal years beginning after December 15, 2019. TheInvestment Adviser is currently evaluating the impact ofthis new guidance on the Fund’s financial statements.
In March 2017, the FASB issued Accounting Standards Update2017-08, Receivables — Nonrefundable Fees and Other Costs(Subtopic 310-20). The amendments in this update shortenthe amortization period for certain callable debt securitiesheld at premium. Specifically, the amendments require thepremium to be amortized to the earliest call date. Theamendments do not require an accounting change for secu-rities held at a discount; the discount continues to be amor-tized to maturity. For public entities this update will beeffective for fiscal years beginning after December 15, 2018,and for interim periods within those fiscal years. The Invest-ment Adviser is currently evaluating the impact of this newguidance on the Fund’s financial statements.
Note 12. Subsequent EventsManagement has evaluated the impact of all subsequentevents on the Fund through the date the financial state-ments were issued. Other than the matters below, no suchsubsequent events were identified.
Final settlement and dismissal of the matter relating to theFund’s investment in Tousa, Inc. was approved by the courton January 12, 2018. The Fund paid $6,312,767.10 insettlement, representing its pro rata share of the total$160,000,000 settlement amount. The Fund expects toreceive a return of $4,491,999.34 in previously-postedSecurity, such amount expected to be received by theFund during Q1 2018. See Note 10 for additionalinformation.
On February 2, 2018, HFRO Sub, LLC a wholly-owned sub-sidiary of the Fund entered into a financing arrangement(the “Financing Arrangement”) with Bank of America MerrillLynch and Bank of America, N.A.
Pursuant to the terms of the Financing Arrangement, andsubject to certain customary conditions, HFRO Sub, LLCmay borrow on a revolving basis a maximum of$500 million. In connection with the Financing Arrange-ment, HFRO Sub, LLC and the Fund have made representa-tions and warranties regarding the loans and underlyingcollateral and are required to comply with various cove-nants, reporting requirements and other customaryrequirements. The Facility also limits the recourse of thelender to the assets of HFRO Sub, LLC and includes usualand customary events of default for senior secured revolv-ing facilities of this nature. As discussed in Note 7, Clay-more Holdings, LLC, a partially-owned affiliate of the Fund,is engaged in ongoing litigation that could result in apossible gain contingency to the Fund. On February 20,
2018, the Texas Court of Appeals confirmed an aggregate$351 million award in favor of Claymore Holdings, LLC. Ofthis aggregate award, the Fund would receive a total of$289 million ($236.5 million in damages together with anadditional $52.5 million in post-judgment interest). Each ofthese amounts remains subject to deduction for applicableattorneys’ fees and other litigation related expenses. Thisjudgment is still subject to appeal to the Texas SupremeCourt, and the probability, timing and potential amount ofultimate recovery, if any, are unknown.
30 Semi-Annual Report

ADDITIONAL INFORMATION (unaudited)
December 31, 2017 Highland Floating Rate Opportunities Fund
Additional Portfolio InformationThe Investment Adviser and its affiliates manage otheraccounts, including registered and private funds andindividual accounts. Although investment decisions for theFund are made independently from those of such otheraccounts, the Investment Adviser may, consistent withapplicable law, make investment recommendations toother clients or accounts that may be the same or differentfrom those made to the Fund, including investments indifferent levels of the capital structure of a company, suchas equity versus senior loans, or that involve takingcontradictory positions in multiple levels of the capitalstructure. The Investment Adviser has adopted policies andprocedures that address the allocation of investmentopportunities, execution of portfolio transactions, personaltrading by employees and other potential conflicts ofinterest that are designed to ensure that all client accountsare treated equitably over time. Nevertheless, this maycreate situations where a client could be disadvantagedbecause of the investment activities conducted by theInvestment Adviser for other client accounts. When theFund and one or more of such other accounts are pre-pared to invest in, or desire to dispose of, the same secu-rity, available investments or opportunities for each will beallocated in a manner believed by the Investment Adviserto be equitable to the Fund and such other accounts. TheInvestment Adviser also may aggregate orders to pur-chase and sell securities for the Fund and such otheraccounts. Although the Investment Adviser believes that,over time, the potential benefits of participating in volumetransactions and negotiating lower transaction costsshould benefit all accounts including the Fund, in somecases these activities may adversely affect the price paidor received by the Fund or the size of the position obtainedor disposed of by the Fund.
Dividend Reinvestment PlanUnless the registered owner of Common Shares elects toreceive cash by contacting American Stock Transfer &Trust Company, LLC (“AST” or the “Plan Agent”), as agentfor shareholders in administering the Plan, a registeredowner will receive newly issued Common Shares for alldividends declared for Common Shares of the Fund. If aregistered owner of Common Shares elects not to partic-ipate in the Plan, they will receive all dividends in cash paidby check mailed directly to them (or, if the shares are heldin street or other nominee name, then to such nominee) byAST, as dividend disbursing agent. Shareholders may electnot to participate in the Plan and to receive all dividends incash by sending written instructions or by contacting AST,as dividend disbursing agent, at the address set forthbelow.
Participation in the Plan is completely voluntary and maybe terminated or resumed at any time without penalty bycontacting the Plan Agent before the dividend record date;otherwise such termination or resumption will be effectivewith respect to any subsequently declared dividend. Somebrokers may automatically elect to receive cash on theshareholders’ behalf and may reinvest that cash in addi-tional Common Shares of the Fund for them. The PlanAgent will open an account for each shareholder under thePlan in the same name in which such shareholder’sCommon Shares are registered.
Whenever the Fund declares a dividend payable in cash,non-participants in the Plan will receive cash and partic-ipants in the Plan will receive the equivalent in CommonShares. The Common Shares will be acquired by the PlanAgent through receipt of additional unissued butauthorized Common Shares from the Fund (“newly issuedCommon Shares”). The number of newly issued CommonShares to be credited to each participant’s account will bedetermined by dividing the dollar amount of the dividendby the lesser of (i) the net asset value per Common Sharedetermined on the Declaration Date and (ii) the marketprice per Common Share as of the close of regular tradingon the New York Stock Exchange (the “NYSE”) on the Decla-ration Date. The Plan Agent maintains all shareholders’accounts in the Plan and furnishes written confirmation ofall transactions in the accounts, including informationneeded by shareholders for tax records. Common Sharesin the account of each Plan participant will be held by thePlan Agent on behalf of the Plan participant, and eachshareholder proxy will include those shares purchased orreceived pursuant to the Plan. The Plan Agent will forwardall proxy solicitation materials to participants and voteproxies for shares held under the Plan in accordance withthe instructions of the participants. In the case of share-holders such as banks, brokers or nominees which holdshares for others who are the beneficial owners, the PlanAgent will administer the Plan on the basis of the numberof Common Shares certified from time to time by therecord shareholder’s name and held for the account ofbeneficial owners who participate in the Plan. There will beno brokerage charges with respect to Common Sharesissued directly by the Fund.
The automatic reinvestment of dividends will not relieveparticipants of any federal, state or local income tax thatmay be payable (or required to be withheld) on such divi-dends. Accordingly, any taxable dividend received by aparticipant that is reinvested in additional Common Shareswill be subject to federal (and possibly state and local)income tax even though such participant will not receive acorresponding amount of cash with which to pay suchtaxes. Participants who request a sale of shares through
Semi-Annual Report 31

ADDITIONAL INFORMATION (unaudited) (continued)
December 31, 2017 Highland Floating Rate Opportunities Fund
the Plan Agent are subject to a $2.50 sales fee and pay abrokerage commission of $0.05 per share sold. The Fundreserves the right to amend or terminate the Plan. There isno direct service charge to participants in the Plan; how-ever, the Fund reserves the right to amend the Plan toinclude a service charge payable by the participants. Allcorrespondence concerning the Plan should be directed tothe Plan Agent at American Stock Transfer & Trust Com-pany, LLC 6201 15th Avenue Brooklyn, NY 11219; tele-phone (718) 921-8200.
Approval of Highland Floating RateOpportunities Fund Investment AdvisoryAgreementAt an in-person meeting held on August 17, 2017, theBoard of Trustees (the “Board”), including the Boardmembers who are not “interested persons” (as defined inthe Investment Company Act of 1940, as amended) of theFund (collectively, the “Independent Trustees”), consideredand approved the advisory agreement between HighlandFloating Rate Opportunities Fund (formerly, Highland Float-ing Rate Opportunities Fund II) (the “Fund”) and HighlandCapital Management Fund Advisors, L.P. (the “InvestmentAdviser”) (the “Advisory Agreement”) for an initial two-yearperiod. The Board considered that the Fund was formed toeffect the redomiciling of Highland Floating Rate Oppor-tunities Fund, a series of Highland Funds I (the “ExistingFund”), as a standalone Massachusetts business trust, andthat the contractual arrangements of the Fund, includingthe Advisory Agreement, would not differ materially fromthat of the existing Fund.
As part of its review process, the Board requested, throughits independent legal counsel, and received from theInvestment Adviser, various information and writtenmaterials in connection with the meeting of the Board heldon August 17, 2017, including: (1) information regarding thefinancial soundness of the Investment Adviser and on theanticipated profitability of the Advisory Agreement to theInvestment Adviser; (2) information on the advisory andcompliance personnel of the Investment Adviser, includingcompensation arrangements for portfolio managers;(3) information on internal compliance procedures of theInvestment Adviser; (4) comparative information showinghow the Fund’s proposed fees and anticipated operatingexpenses compare to those of other registered investmentcompanies and comparable funds that follow investmentstrategies similar to those of the Fund; (5) informationregarding the investment performance of other accountsmanaged by the Investment Adviser that follow investmentstrategies similar to the Fund; and (6) information on anylegal proceedings or regulatory audits or investigationsaffecting the Investment Adviser or its respective affiliates.The Trustees also recalled information relating to the
Existing Fund’s performance and fees compared to that ofsimilarly situated investment companies deemed to becomparable to the Existing Fund. The Trustees reviewedvarious factors that were discussed in independent coun-sel’s legal memoranda regarding their responsibilities inconsidering the Advisory Agreement, the detailedinformation provided by the Investment Adviser and otherrelevant information and factors. The Trustees’ conclusionsas to the approval of the Advisory Agreement were basedon a comprehensive consideration of all information pro-vided to the Trustees without any single factor being dis-positive in and of itself. Some of the factors that figuredparticularly in the Trustees’ deliberations are describedbelow, although individual Trustees may have evaluatedthe information presented differently from one another,giving different weights to various factors.
The nature, extent, and quality of the servicesto be provided by the Investment Adviser.The Board considered the portfolio management servicesto be provided by the Investment Adviser under the Advi-sory Agreement and the activities related to portfoliomanagement, including use of technology, researchcapabilities and investment management staff. The Boarddiscussed the relevant experience and qualifications of thepersonnel who would provide advisory services, includingthe background and experience of the members of theFund’s portfolio management team, and noted that thesame portfolio management team had managed the Exist-ing Fund. The Trustees reviewed the management struc-ture, assets under management and investmentphilosophies and processes of the Investment Adviser. TheBoard also reviewed and discussed information regardingthe Investment Adviser’s compliance policies, proceduresand personnel, including compensation arrangements. TheBoard took into account the Investment Adviser’s riskassessment, monitoring process and regulatory history.The Board concluded that the Investment Adviser had thequality and depth of personnel and investment methodsessential to performing its duties under the AdvisoryAgreement, and that the nature and the quality of suchadvisory services supported the approval of the AdvisoryAgreement.
The Investment Adviser’s historicalperformance.As the Fund did not yet have a performance record, theBoard considered the historical performance of theInvestment Adviser and the Existing Fund’s portfoliomanagement teams in managing the Existing Fund overvarious time periods and reflected on previous discussionsregarding matters bearing on the Investment Adviser’sperformance at their meetings throughout the year. TheBoard also considered the historical performance of a peer
32 Semi-Annual Report

ADDITIONAL INFORMATION (unaudited) (concluded)
December 31, 2017 Highland Floating Rate Opportunities Fund
group of funds based on the Fund’s strategy. The Boardnoted that the Existing Fund outperformed its Morningstarpeer group median, category median and/or benchmarkfor the one-year period and underperformed its Morning-star peer group median, category median and/or bench-mark for the three-year period.
The costs of the services to be provided by theInvestment Adviser and the profits to berealized by the Investment Adviser and itsaffiliates from the relationship with the Fund.The Board gave consideration to the advisory fees paid bythe Existing Fund and the advisory fees to be paid by theFund under the Advisory Agreement. The Board consideredthe financial condition of the Investment Adviser. TheBoard also examined the fees to be paid by the Fund inlight of fees paid by the Existing Fund to the InvestmentAdviser and to other investment managers by comparablefunds, as well as the fees charged to manage other com-parable funds. The Board considered the Fund’s proposedtotal expenses as compared to the Existing Fund as well assimilarly situated investment companies deemed to becomparable to the Fund. The Board noted that comparablefunds were selected by Morningstar and the Adviser basedon the Fund’s strategies.
The Board considered the profitability of the Existing Fundand projected profitability of the Fund to the InvestmentAdviser. The Board also considered the so-called “fall-outbenefits” to the Investment Adviser with respect to theFund, such as the reputational value of serving as theInvestment Adviser to the Fund, potential fees paid to theInvestment Adviser’s affiliates by the Fund or portfoliocompanies for services provided and the benefits ofresearch made available to the Investment Adviser byreason of brokerage commissions, if any, generated by theFund’s securities transactions.
After such review, the Trustees determined that the antici-pated profitability to the Investment Adviser of the Advi-sory Agreement was reasonable.
The extent to which economies of scale wouldbe realized as the Fund grows and whether feelevels reflect these economies of scale for thebenefit of shareholders.The Board considered the effective fee under the AdvisoryAgreement for the Fund as a percentage of assets atdifferent asset levels and possible economies of scale that
may be realized if the assets of the Fund grow. The Boardnoted that, while the Investment Adviser anticipates thatthe assets of the Fund may grow in size following thereceipt of proceeds from a possible litigation settlement, itis difficult to generalize as to when economies of scaledevelop and are achievable. The Board determined to con-tinue to review ways, and the extent to which, economiesof scale might be shared between the Investment Adviseron the one hand and shareholders of the Fund on theother.
Conclusion.Following a further discussion of the factors above and themerits of the Advisory Agreement and its various provi-sions, it was noted that in considering the approval of theAdvisory Agreement, no single factor was determinative tothe decision of the Board. Rather, after weighing all of thefactors and reasons discussed above, the Trustees, includ-ing the Independent Trustees, unanimously agreed thatthe Advisory Agreement, including the advisory fee to bepaid to the Investment Adviser, is fair and reasonable tothe Fund in light of the services that the Investment Adviserproposes to provide, the expenses that it incurs and thereasonably foreseeable asset levels of the Fund.
Submission of Proposals to a Vote ofShareholdersA special meeting of shareholders of Highland FloatingRate Opportunities Fund (the “Fund”) was held onNovember 3, 2017. The following is a summary of theproposal submitted to shareholders for a vote at the meet-ing and the votes cast.
Proposal Votes ForVotes
AgainstVotes
Abstained
To authorize the Fund’s Board ofTrustees to amend the Fund’sAgreement and Declaration ofTrust to convert the Fund’sstructure from an open-endfund to a closed-end fund. 66,456,176 7,499,199 1,242,994
Semi-Annual Report 33

IMPORTANT INFORMATION ABOUT THIS REPORT
Investment AdviserHighland Capital Management Fund Advisors, L.P.300 Crescent Court, Suite 700Dallas, TX 75201
Transfer AgentAmerican Stock Transfer & Trust Company, LLC6201 15th AvenueBrooklyn, NY 11219
CustodianState Street Bank and Trust CompanyOne Lincoln StreetBoston, Massachusetts 02111
Independent Registered PublicAccounting FirmKPMG LLPTwo Financial Center60 South StreetBoston, MA 02111
Fund CounselStradley Ronon Stevens & Young, LLP1250 Connecticut Avenue, N.W.Washington, DC 20036-2652
This report has been prepared for shareholders of Highland Floating RateOpportunities Fund (the “Fund”). The Fund mails one shareholder report toeach shareholder address. If you would like more than one report, pleasecall shareholder services at 1-800-357-9167 to request that additionalreports be sent to you.
A description of the policies and procedures that the Fund use to determinehow to vote proxies relating to their portfolio securities, and the Fund’sproxy voting records for the most recent 12-month period ended June 30,are available (i) without charge, upon request, by calling 1-800-357-9167and (ii) on the Securities and Exchange Commission’s website athttp://www.sec.gov.
The Fund files its complete schedule of portfolio holdings with the Securitiesand Exchange Commission for the first and third quarters of each fiscalyear on Form N-Q. The Fund’s Form N-Q is available on the Commission’swebsite at http://www.sec.gov and also may be reviewed and copied at theCommission’s Public Reference Room in Washington, DC. Information onthe Public Reference Room may be obtained by calling 1-800-SEC-0330.Shareholders may also obtain the Form N-Q by visiting the Fund’s websiteat www.highlandfunds.com.
The Statement of Additional Information includes additional informationabout the Fund’s Trustees and is available upon request without charge bycalling 1-800-357-9167.
34 Semi-Annual Report

THIS PAGE LEFT BLANK INTENTIONALLY

THIS PAGE LEFT BLANK INTENTIONALLY


Highland Fundsc/o American Stock Transfer & Trust Company, LLC6201 15th AvenueBrooklyn, NY 11219
Highland Floating Rate Opportunities Fund Semi-Annual Report, December 31, 2017
www.highlandfunds.com FRO-SAR-1217