higher tier biology 1 - physics & maths...
TRANSCRIPT

4461
0200
01
ADDITIONAL MATERIALS
In addition to this paper you may require a calculator and a ruler.
INSTRUCTIONS TO CANDIDATES
Use black ink or black ball-point pen.Write your name, centre number and candidate number in the spaces at the top of this page.Answer all questions.Write your answers in the spaces provided in this booklet.
INFORMATION FOR CANDIDATES
The number of marks is given in brackets at the end of each question or part-question.You are reminded that assessment will take into account the quality of written communication used in your answer to questions 5 and 10.
JD*(W13-4461-02)
Surname
Other Names
CandidateNumber
0
CentreNumber
© WJEC CBAC Ltd.
New GCSE
4461/02
SCIENCE AHIGHER TIERBIOLOGY 1
A.M. WEDNESDAY, 9 January 2013
1 hour
For Examiner’s use only
Question MaximumMark
MarkAwarded
1 6
2 6
3 3
4 3
5 6
6 6
7 7
8 7
9 10
10 6
Total 60
PMT

2
(4461-02)
Examineronly
Answer all questions.
1. A grey-bodied fruit fly was mated with a black-bodied fruit fly. All the F1 offspring were grey-bodied.
© WJEC CBAC Ltd.
All the F1 offspring are grey-bodied
(a) Using the letters A and a to represent the alleles for the two different body colours, complete the Punnett square below to show the offspring produced from the mating between the grey-bodied and black-bodied fruit flies. [2]
Gametes
F1
Grey-bodied fly Black-bodied fly
×
PMT

(4461-02) Turn over.
3Examiner
only
(ii) What is the ratio of the different phenotypes in the F2 offspring? [1]
. . . . . . . . . . . . . . . . . . . . . . . . . . . . . . . . . . . . . . . . . . . . . . . . . . . . . . . . . . . . . . . . . . . . . . : . . . . . . . . . . . . . . . . . . . . . . . . . . . . . . . . . . . . . . . . . . . . . . . . . . . . . . . . . . . . . . . . . . . . . .
(c) Name the 19th Century scientist whose work on garden pea plants led to the understanding of the mechanism of inheritance. [1]
. . . . . . . . . . . . . . . . . . . . . . . . . . . . . . . . . . . . . . . . . . . . . . . . . . . . . . . . . . . . . . . . . . . . . . . . . . . . . . . . . . . . . . . . . . . . . . . .
© WJEC CBAC Ltd.
(b) (i) Complete the Punnett square below to show the offspring produced when two of the F1 offspring are selfed (bred together). [2]
Gametes
F2
6
4461
0200
03
PMT
4
(4461-02)
Examineronly
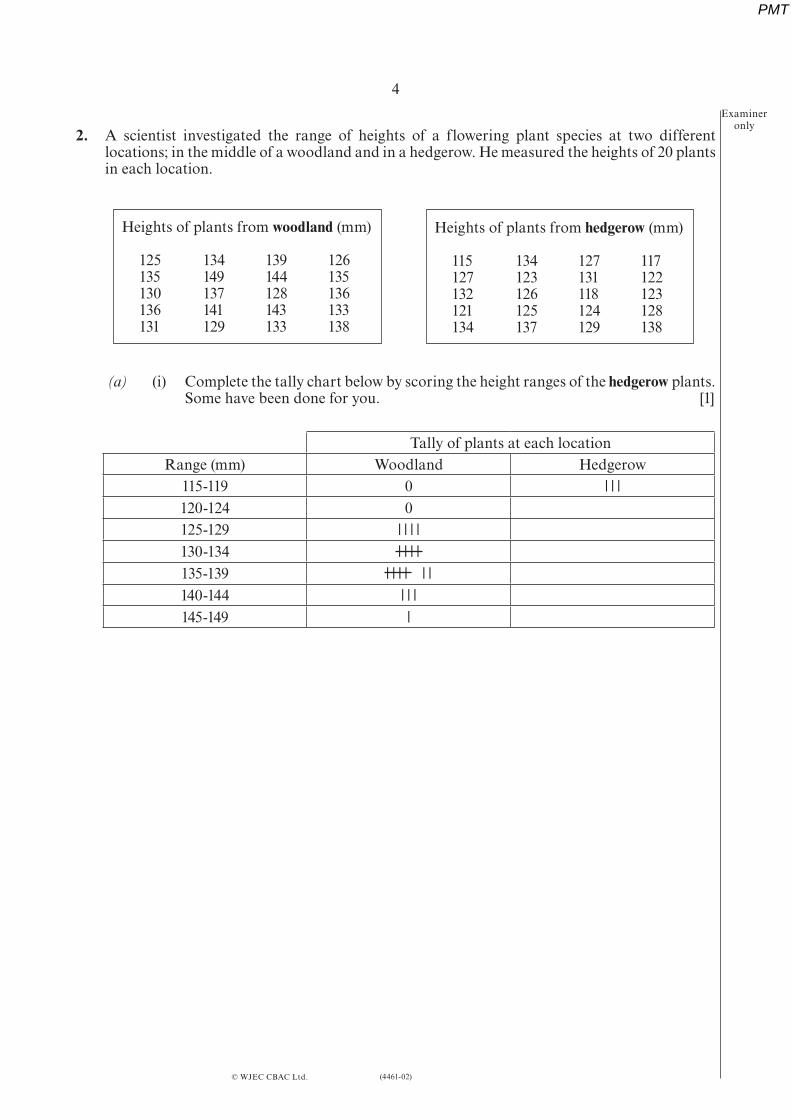
2. A scientist investigated the range of heights of a flowering plant species at two different locations; in the middle of a woodland and in a hedgerow. He measured the heights of 20 plants in each location.
© WJEC CBAC Ltd.
Heights of plants from woodland (mm)
125 134 139 126 135 149 144 135 130 137 128 136 136 141 143 133 131 129 133 138
Heights of plants from hedgerow (mm)
115 134 127 117 127 123 131 122 132 126 118 123 121 125 124 128 134 137 129 138
(a) (i) Complete the tally chart below by scoring the height ranges of the hedgerow plants. Some have been done for you. [1]
Tally of plants at each locationRange (mm) Woodland Hedgerow
115-119 0 HHH
120-124 0125-129 HHHH
130-134 HHHH
135-139 HHHH HH
140-144 HHH
145-149 H
PMT
(4461-02) Turn over.
5Examiner
only
© WJEC CBAC Ltd.
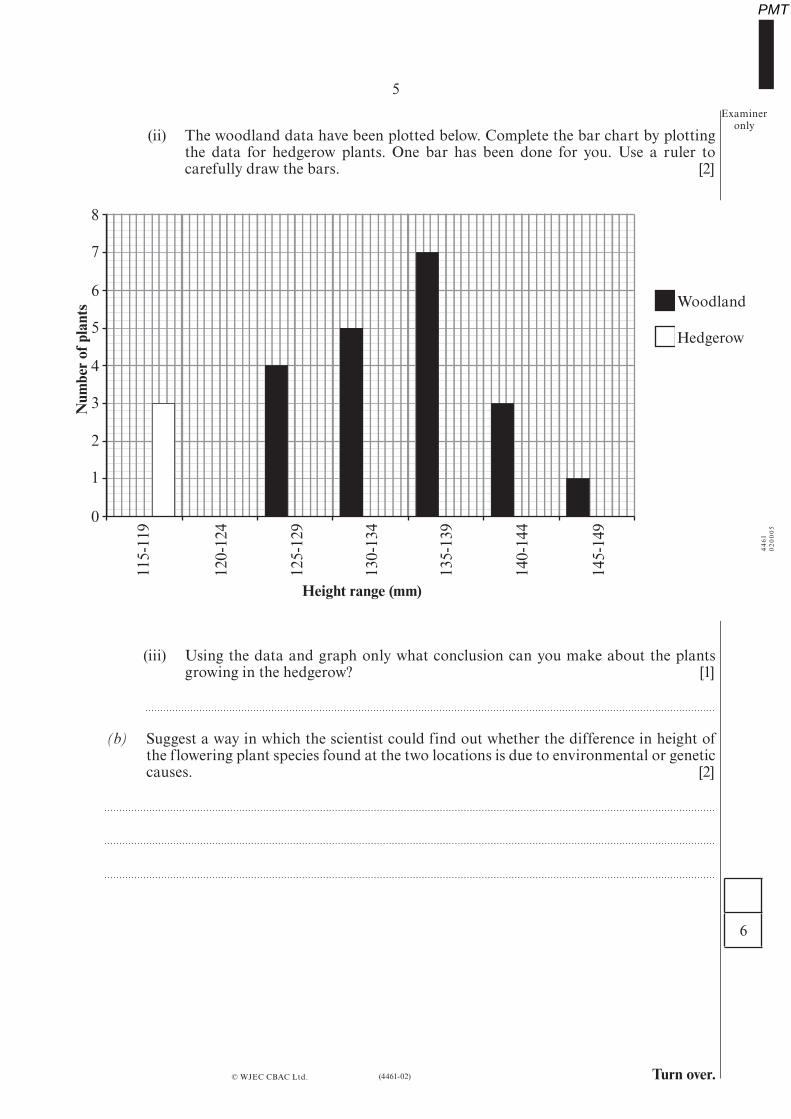
(ii) The woodland data have been plotted below. Complete the bar chart by plotting the data for hedgerow plants. One bar has been done for you. Use a ruler to carefully draw the bars. [2]
0
2
4
6
8
1
3
5
7
115-119
120-124
125-129
130-134
135-139
140-144
145-149
Num
ber o
f pla
nts
Height range (mm)
Woodland
Hedgerow
(iii) Using the data and graph only what conclusion can you make about the plants growing in the hedgerow? [1]
(b) Suggest a way in which the scientist could find out whether the difference in height of the flowering plant species found at the two locations is due to environmental or genetic causes. [2]
6
4461
0200
05
PMT

6
(4461-02)
Examineronly
3. (a) Explain what is meant by the term genetic profiling. [1]
(b) State two uses of genetic profiling. [2]
(i) . . . . . . . . . . . . . . . . . . . . . . . . . . . . . . . . . . . . . . . . . . . . . . . . . . . . . . . . . . . . . . . . . . . . . . . . . . . . . . . . . . . . . . . . . . . . . . . . . . . . . . . . . . . . . . . . . . . . . . . . . . . . . . . . . . . . . . . . . . . . . . . . . . . . . . . . . . . . . . . . . . . . . . . . . . . . . . . . . . . . . . . . . . . . . . . . . . . . .
(ii) . . . . . . . . . . . . . . . . . . . . . . . . . . . . . . . . . . . . . . . . . . . . . . . . . . . . . . . . . . . . . . . . . . . . . . . . . . . . . . . . . . . . . . . . . . . . . . . . . . . . . . . . . . . . . . . . . . . . . . . . . . . . . . . . . . . . . . . . . . . . . . . . . . . . . . . . . . . . . . . . . . . . . . . . . . . . . . . . . . . . . . . . . . . . . . . . . . . . .
4. A scientist carried out an investigation into the body temperature of a man. The changes in the man’s body temperature were measured by a clinical thermometer in his mouth. The graph below shows his body temperature over a 35 minute period. Between 7 and 10 minutes he immersed his legs, from the knees downwards, in a bath of warm water at 40°C. He then stepped out of the bath and dried his legs.
© WJEC CBAC Ltd.
3
036.7
36.8
36.9
37.0
37.1
5 10 15 20 25 30 35
Legs immersed in warm water at 40°C
Time (minutes)
Bod
y te
mpe
ratu
re (°
C)
(a) Explain why the body temperature increased even though it was only the legs which were immersed in the warm water. [1]
PMT

(4461-02) Turn over.
7Examiner
only (b) The experiment was repeated. After 20 minutes an electric fan was directed onto the
man’s legs. The results are shown in the graph below.
© WJEC CBAC Ltd.
036.7
36.8
36.9
37.0
37.1
5 10 15 20 25 30 35
Legs immersed in warm water at 40°C
Electric fan directed onto legs
Time (minutes)
Bod
y te
mpe
ratu
re (°
C)
Explain why the body temperature of the man dropped more quickly between 20 and 25 minutes when the fan was used. [2]
3
4461
0200
07
PMT

8
(4461-02)
Examineronly
5. Describe how the following apparatus and materials could be used to compare the energy content of two different food samples A and B. [6 QWC]
© WJEC CBAC Ltd.
stand and boiling tube
lit Bunsen burner digital balancebeaker of water
0
10
30
50
20
40
50 cm3 measuring cylinder
mounted needle with wooden handle
thermometer
PMT

9
(4461-02)
Examineronly
© WJEC CBAC Ltd.
6
Turn over.
PMT

10
6. John designed a model to represent a predator-prey relationship.
This is part of his design:
• Hemarkedouta1m2 area of well mown lawn. • Inabeakerhemixedtogether50greencolouredbeadsand50redcolouredbeads. • Heshookthebeakerandscatteredthebeadsrandomlyoverthelm2 of lawn.
The diagram below shows part of the marked out area of the lawn.
© WJEC CBAC Ltd.
lawn
Green beads
Red beads
• JohnaskedanotherstudentSusantopickoutasmanybeadsaspossiblefromthe1m2 of lawn in one minute.
• Johnthencalculatedthenumberofgreenandredbeadsthatwereleftinthe1m2 of lawn. • Johnaddedmorebeadstothe1m2 of lawn to make the total up to 100 again. An equal
number of each coloured bead was added to make up the 100. • Susanthenrepeatedtheexerciseanothertwotimes.
(4461-02)
PMT

(4461-02) Turn over.
11Examiner
only The results are shown in the table below:
© WJEC CBAC Ltd.
Number of beads remaining in l m2 of lawn
Number of beads added to l m2 of lawn
Green Red Green RedAt start 50 50After 1 pick 46 26 14 14After 2 picks 52 22 13 13After 3 picks 54 16 15 15
(a) In this predator-prey relationship model what do the following represent:
(i) the coloured beads; . . . . . . . . . . . . . . . . . . . . . . . . . . . . . . . . . . . . . . . . . . . . . . . . . . . . . . . . [1]
(ii) Susan; . . . . . . . . . . . . . . . . . . . . . . . . . . . . . . . . . . . . . . . . . . . . . . . . . . . . . . . . [1]
(iii) the process of adding beads to the l m2 of lawn? [1]
(b) After 10 picks the number of red beads had fallen to zero. [1]
Use the term that would best describe this process in nature.
(c) Why are fewer green beads removed from l m2 of lawn at each pick than red? [1]
(d) Suggest one way in which this model is not a true representation of what happens in nature. [1]
6
PMT
12
(4461-02)
Examineronly
7. In 2011 a contact lens was invented with a sensor that can measure the concentration of glucose in tears. It can be used to detect diabetes.
(a) Name two body fluids, other than tears, which can be tested to detect diabetes. [2]
(b) State three methods which are used to treat diabetes. [3]
(i) . . . . . . . . . . . . . . . . . . . . . . . . . . . . . . . . . . . . . . . . . . . . . . . . . . . . . . . . . . . . . . . . . . . . . . . . . . . . . . . . . . . . . . . . . . . . . . . . . . . . . . . . . . . . . . . . . . . . . . . . . . . . . . . . . . . . . . . . . . . . . . . . . . . . . . . . . . . . . . . . . . . . . . . . . . . . . . . . . . . . . . . . . . . . . . . . . . . . .
(ii) . . . . . . . . . . . . . . . . . . . . . . . . . . . . . . . . . . . . . . . . . . . . . . . . . . . . . . . . . . . . . . . . . . . . . . . . . . . . . . . . . . . . . . . . . . . . . . . . . . . . . . . . . . . . . . . . . . . . . . . . . . . . . . . . . . . . . . . . . . . . . . . . . . . . . . . . . . . . . . . . . . . . . . . . . . . . . . . . . . . . . . . . . . . . . . . . . . . . .
(iii) . . . . . . . . . . . . . . . . . . . . . . . . . . . . . . . . . . . . . . . . . . . . . . . . . . . . . . . . . . . . . . . . . . . . . . . . . . . . . . . . . . . . . . . . . . . . . . . . . . . . . . . . . . . . . . . . . . . . . . . . . . . . . . . . . . . . . . . . . . . . . . . . . . . . . . . . . . . . . . . . . . . . . . . . . . . . . . . . . . . . . . . . . . . . . . . . . . . . .
(c) A poor diet in pregnant women increases the risk of their children developing diabetes. These children show abnormal development of cells in the pancreas. State two reasons why this could prevent the control of glucose concentration. [2]
(i) . . . . . . . . . . . . . . . . . . . . . . . . . . . . . . . . . . . . . . . . . . . . . . . . . . . . . . . . . . . . . . . . . . . . . . . . . . . . . . . . . . . . . . . . . . . . . . . . . . . . . . . . . . . . . . . . . . . . . . . . . . . . . . . . . . . . . . . . . . . . . . . . . . . . . . . . . . . . . . . . . . . . . . . . . . . . . . . . . . . . . . . . . . . . . . . . . . . . .
(ii) . . . . . . . . . . . . . . . . . . . . . . . . . . . . . . . . . . . . . . . . . . . . . . . . . . . . . . . . . . . . . . . . . . . . . . . . . . . . . . . . . . . . . . . . . . . . . . . . . . . . . . . . . . . . . . . . . . . . . . . . . . . . . . . . . . . . . . . . . . . . . . . . . . . . . . . . . . . . . . . . . . . . . . . . . . . . . . . . . . . . . . . . . . . . . . . . . . . . .
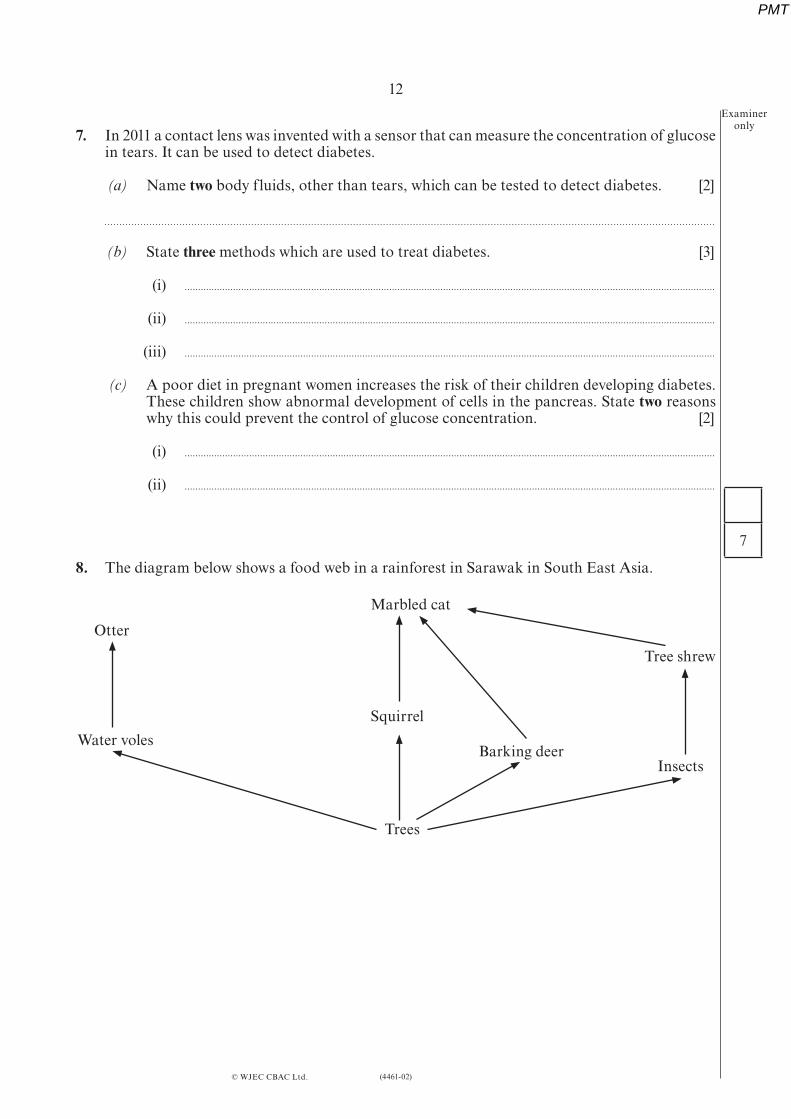
8. The diagram below shows a food web in a rainforest in Sarawak in South East Asia.
© WJEC CBAC Ltd.
7
Trees
Insects
Tree shrew
Squirrel
Barking deerWater voles
Otter
Marbled cat
PMT

(4461-02) Turn over.
13Examiner
only
(a) Use the food web opposite and the data in the table above to give reasons for the results for
(i) the otter; [1]
(ii) the squirrel. [3]
(b) Some insects feed on healthy living trees. Others feed on decaying remains of trees. Use all the given information to explain the data for tree shrews over the four years. [3]
© WJEC CBAC Ltd.
The removal of trees by logging has been allowed in the forest in a part of Sarawak. A study was carried out to investigate the effect of logging on the animals living in the forest. Numbers of six different mammals per km2 were estimated before logging and regularly for four years after logging. The table below shows the results.
MammalMean number of animals per km2
Before logging 1 year after logging
2 years after logging
4 years after logging
Marbled cat 1 0 0 0Otter 1 0 0 0Water vole 5 0 0 0Squirrel 16 24 104 19Tree shrew 10 5 10 38Barking deer 3 1 10 1
7
PMT

14
(4461-02)
Examineronly
9. Computer modelling was used to predict the effects of environmental factors on nitrate production by bacteria and the mass of nitrate taken up by wheat. The results are shown as a bar chart below.
© WJEC CBAC Ltd.
0
20
10
40
60
80
100
30
50
70
90
Sep Oct Nov Dec Jan Mar Apr May Jun Jul AugFeb
mas
s of n
itrat
e (k
g)
Month
mass of nitrate taken up by wheat
mass of nitrate produced in the soil by bacteria
The wheat is planted in September and harvested in August of the following year.
(a) Suggest reasons for the following observations.
(i) The mass of nitrate taken up by the wheat is greater in May than in March. [1]
(ii) The mass of nitrate produced in the soil by bacteria is much greater in September than in January. [1]
(b) Some bacteria use an enzyme to break down the urea in natural fertilizer which may be added to the soil. Name this enzyme. [1]
. . . . . . . . . . . . . . . . . . . . . . . . . . . . . . . . . . . . . . . . . . . . . . . . . . . . . . . . . . . . . . . . . . . . . . . . . . . . . . . . . . . . . . . . . . . . . . . . . . . . . . . . . . . . . . . . . . . .
PMT

(4461-02)
15Examiner
only (c) (i) An investigation was carried out to determine how bacteria in soil break down
urea. The following apparatus was used and left for one hour at 20°C.
© WJEC CBAC Ltd.
cork
cork
Specimentube
Specimentube
Paper clip hook
Paper clip hook
Moist indicator paper showing pH7
20 cm3 urea (1 mol/dm3)+
5 cm3 enzyme (1%)
After one hour the indicator paper showed that the pH had changed to 9. Explain this observation. [2]
(ii) Complete the diagram below and label it to show the contents of the specimen tube in a control that you would set up to show that the change in pH was due to the enzyme. [3]
(iii) State two other factors that would be necessary for the control. [2]
PLEASE TURN OVER FOR QUESTION 10 10
PMT

16
(4461-02)
Examineronly
10. Anopheles gambiae is a species of mosquito which is responsible for the spread of a disease, malaria, in West Africa.
In the 1990s a pesticide, dieldrin, was used to kill mosquitoes. In areas which were sprayed with dieldrin for the first time, only 10% of mosquitoes were
resistant to it. After spraying areas with dieldrin, for 2 months, 99% of mosquitoes were resistant to it. Explain these results. [6 QWC]
END OF PAPER
© WJEC CBAC Ltd.
6
PMT