higher quality peptide separations using hybrid particle
TRANSCRIPT

Charged Surface Hybrid C18 for
High Resolution LC and LC/MS Peptide
Separations
©2013 Waters Corporation 1
Higher Quality Peptide Separations Using
Hybrid Particle-Based Reversed-Phase Columns and CSH Technology

Reversed Phase Peptide SeparationsReversed Phase Peptide Separations
� Peptide separations – critically important– peptide mapping, bottom-up proteomics …– reversed phase– challenges remain
Peptide
TFA
TFA
LC performance
MS performance
� Ionic analytes – peptides– Secondary interactions - Poor peak shape
– Overloading at very low loads (<< neutrals)
©2013 Waters Corporation 2
� Still needed:– high resolution, high sensitivity peptide
separations regardless of eluent additive
– i.e. formic acid (FA) separations for LC-MS
– Overloading at very low loads (<< neutrals)
– MS signal suppressing ion pairing agents needed

Charged Surface
Hybrid
©2013 Waters Corporation 3

AgendaAgenda
� The Peak Shape Problem – Column Chemistries– CSH Technology– Peak Capacity
� CSH130 C18 and separations without TFA– LC-MS of protein digests– Small protein separations
©2013 Waters Corporation 4
– Small protein separations
� Peptide Mapping a Therapeutic mAb– CSH130 C18 for LC-UV-MS – Disulfides and Deamidation
� Peptide Separation Technology (PST) Columns – Quality control - QC tested with digests
� Analytical Standards and Reagents (ASR)

The Peak Shape Problem
©2013 Waters Corporation 5
The Peak Shape Problem

Competitor’s “Industry Standard” Competitor’s “Industry Standard” 5 µm Porous Silica C18 5 µm Porous Silica C18
©2013 Waters Corporation 6
Competitor’s “Industry Standard” C18 2.1 x 250 mm, Porous 5 µm, 300Å ACQUITY UPLC® H-Class Bio
2% ACN for 1 min, then to 50% ACN over 60 min0.3 mL/min40°CUV @ 214 nm / Xevo® G2 QTOF5.6 µg MassPREP Peptide Mixture
Peptide Sequence
1 RASG-1 RGDSPASSKP
2 Angiotensin 1-7 DRVYIHP
3 Bradykinin RPPGFSPFR
4 Angiotensin II DRVYIHPF
5 Angiotensin I DRVYIHPFHL
6 Renin Substrate DRVYIHPFHLLVYS
7 Enolase T35 WLTGPQLADLYHSLMK
8 Enolase T37 YPIVSIEDPFAEDDWEAWSHFFK
9 Melittin GIGAVLKVLTTGLPALISWIKRKRQQ
MassPREP™ Peptide Mixture

Bridged Ethanes
In Silica Matrix
U.S. Patent No. 6,686,035 B2
and others patent pending
Organo Silica Hybrid Particles
Ethylene Bridged Hybrid - BEH Technology™
©2013 Waters Corporation 7Anal. Chem. 2003, 75, 6781-6788
Tetraethoxysilane Bis(triethoxysilyl)ethane
+4
Polyethoxysilane
Si
EtO
EtO OEtEtO
Si
EtO
EtOCH2
EtO
CH2Si
OEt
OEt
OEtSi
EtO
O
CH2 CH2
SiO
Si
EtO
OEt
Si O
O
OEt
O
Si
O
Si
OEt
O
O
OEt
Et
Et
n
Organo Silica Hybrid Particles– pH stability
– Reduced ionic interactions
– Basis of Peptide Separation Technology

Small Particle SizeSmall Particle Size
Porous
Particle
Peptides
Mobile Phase
1500 Da Peptide
23.5 µm
©2013 Waters Corporation 8
� Diffusion distances decrease– Reduced Eddy diffusion– Improved mass transfer kinetics
� Column efficiency� Narrower peaks
Adsorption Equilibria
Diffusion-related band broadening
0
1
0 0.2 0.4 0.6 0.8 1 1.2 1.4 1.6 1.8 2
Velocity (mm/sec)
H (mm)
1.7 µm
2.1 mm ID40
µL/min400 µL/min
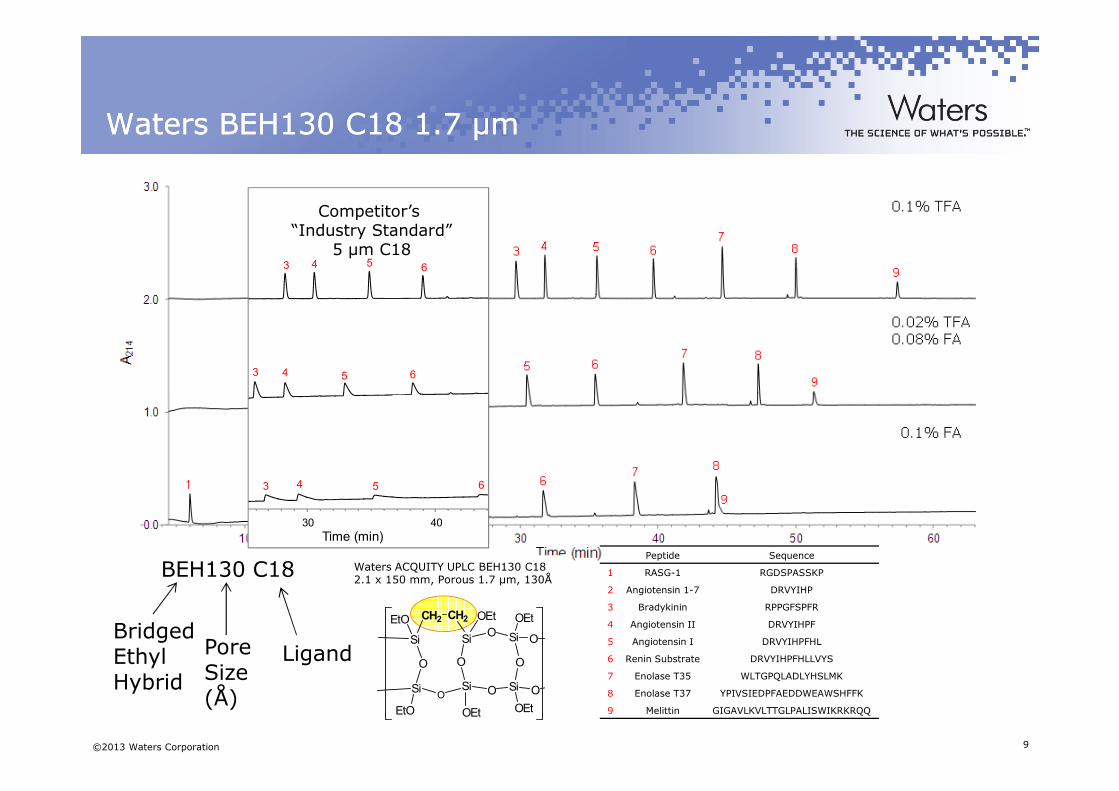
Waters BEH130 C18 1.7 µm Waters BEH130 C18 1.7 µm
3 4 5 6
3 4 5 6
Competitor’s “Industry Standard”
5 µm C18
©2013 Waters Corporation 9
Waters ACQUITY UPLC BEH130 C182.1 x 150 mm, Porous 1.7 µm, 130Å
Peptide Sequence
1 RASG-1 RGDSPASSKP
2 Angiotensin 1-7 DRVYIHP
3 Bradykinin RPPGFSPFR
4 Angiotensin II DRVYIHPF
5 Angiotensin I DRVYIHPFHL
6 Renin Substrate DRVYIHPFHLLVYS
7 Enolase T35 WLTGPQLADLYHSLMK
8 Enolase T37 YPIVSIEDPFAEDDWEAWSHFFK
9 Melittin GIGAVLKVLTTGLPALISWIKRKRQQ
Si
EtO
O
CH2 CH2
SiO
Si
EtO
OEt
Si O
O
OEt
O
Si
O
Si
OEt
O
O
OEt
BEH130 C18
Bridged Ethyl Hybrid
PoreSize(Å)
Ligand
30 40
Time (min)
3 4 5 6

A New Column Chemistry A New Column Chemistry –– CSH130 C18 CSH130 C18
©2013 Waters Corporation 10
Waters ACQUITY UPLC CSH130 C182.1 x 150 mm, Porous 1.7 µm, 130Å
Peptide Sequence
1 RASG-1 RGDSPASSKP
2 Angiotensin 1-7 DRVYIHP
3 Bradykinin RPPGFSPFR
4 Angiotensin II DRVYIHPF
5 Angiotensin I DRVYIHPFHL
6 Renin Substrate DRVYIHPFHLLVYS
7 Enolase T35 WLTGPQLADLYHSLMK
8 Enolase T37 YPIVSIEDPFAEDDWEAWSHFFK
9 Melittin GIGAVLKVLTTGLPALISWIKRKRQQ

A New Column A New Column Chemistry Chemistry –– CSH130 C18 CSH130 C18
©2013 Waters Corporation 11

Charged Surface Hybrid (CSH) TechnologyCharged Surface Hybrid (CSH) Technology
Charged Surface Hybrid (CSH) Technology and Its Use in Liquid Chromatography.
P.C. Iraneta, K.D. Wyndham, D.R. McCabe, and T.H. WalterWaters White Paper 720003929EN 2011
� Expands upon the robust BEH particle technology
patent pending
©2013 Waters Corporation 12
Peptide
� Expands upon the robust BEH particle technology
� CSH130 C18 = BEH130 base particle + low level of basic moieties+ trifunctional C18/end cap
� Acidic pH
Positive Surface Charge

100%
Peak CapacityPeak Capacity
� Peak Capacity =– The number of peaks that can be separated within a retention window
Neue, U. D., J Chromatogr A 2005, 1079 (1-2), 153-61.
– The best metric for determining the quality of gradient separations
©2013 Waters Corporation 13
0%
50%
Peak Height
tgradient
wh
2.35σ
4σw4σ13.4%
9 peakscould resolve ~300-400
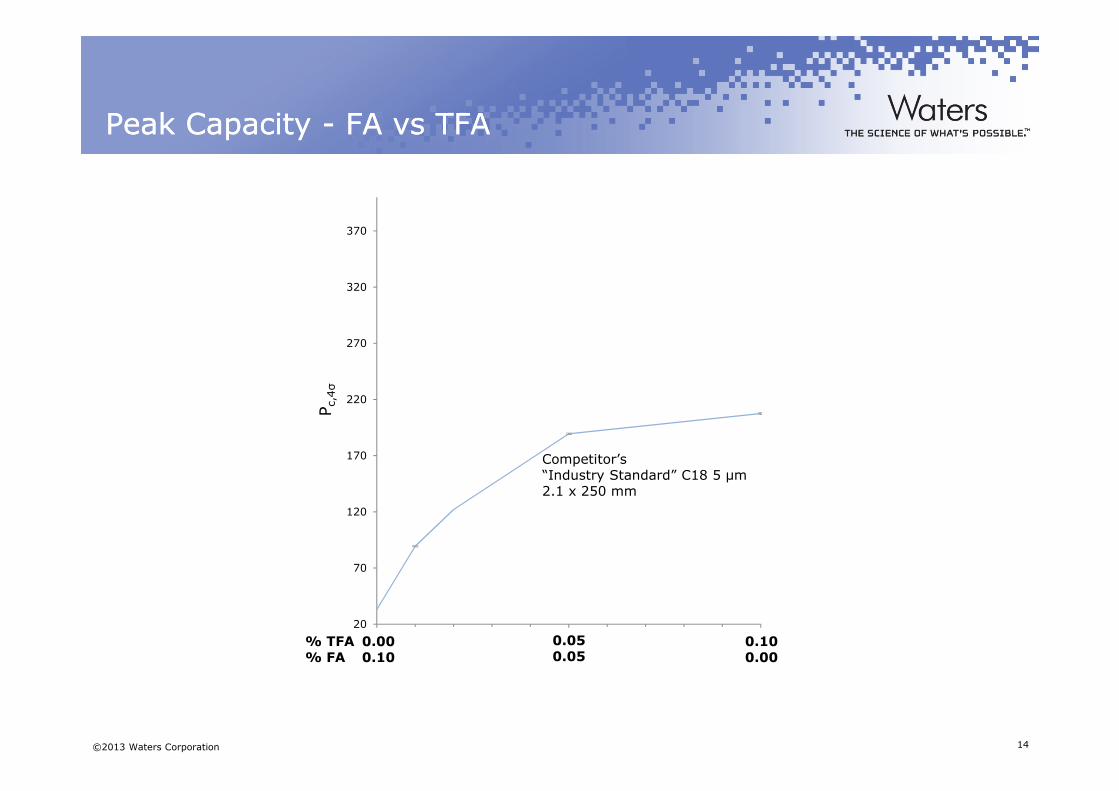
Peak Capacity Peak Capacity -- FA FA vsvs TFATFA
220
270
320
370
c,4σ
©2013 Waters Corporation 14
20
70
120
170
220
0,00 0,05 0,10
P c,4
Percent TFA0.050.05
0.100.00
0.000.10
% TFA% FA
Competitor’s “Industry Standard” C18 5 µm2.1 x 250 mm

Peak Capacity Peak Capacity -- FA FA vsvs TFATFA
220
270
320
370
c,4σ
BEH130 C18 1.7 µm2.1 x 150 mm
©2013 Waters Corporation 15
20
70
120
170
220
0,00 0,05 0,10
P c,4
Percent TFA
Competitor’s “Industry Standard” C18 5 µm2.1 x 250 mm
0.050.05
0.100.00
0.000.10
% TFA% FA

220
270
320
370
c,4σ
Peak Capacity Peak Capacity -- FA FA vsvs TFATFA
BEH130 C18 1.7 µm2.1 x 150 mm
Competitor’s SPP “Peptide” C18 1.7 µm2.1 x 150 mm
©2013 Waters Corporation 16
20
70
120
170
220
0,00 0,05 0,10
P c,4
Percent TFA
Competitor’s “Industry Standard” C18 5 µm2.1 x 250 mm
0.050.05
0.100.00
0.000.10
% TFA% FA

Peak Capacity Peak Capacity -- FA FA vsvs TFATFA
220
270
320
370
c,4σ
Competitor’s SPP “Peptide” C18 1.7 µm2.1 x 150 mm
BEH130 C18 1.7 µm2.1 x 150 mm
CSH130 C18 1.7 µm2.1 x 150 mm
20%
90%
©2013 Waters Corporation 17
20
70
120
170
220
0,00 0,05 0,10
P c,4
Percent TFA0.050.05
0.100.00
0.000.10
% TFA% FA
Competitor’s “Industry Standard” C18 5 µm2.1 x 250 mm

270
320
370
MS Signal MS Signal -- FA FA vsvs TFATFA
CSH130 C18 1.7 µm
Competitor’s SPP “Peptide” C18 1.7µm
BEH130 C18 1.7 µm
4
2
Fold Decrease in MS Peak Area
Peak Capacity MS Signal
©2013 Waters Corporation 18
20
70
120
170
220
0,00 0,05 0,10
P c,4σ
Percent TFA0.050.05
0.100.00
0.000.10
% TFA% FA
Competitor’s “Industry Standard” C18 5 µm
12
10
8
6
0,00 0,05 0,10
Fold Decrease in MS Peak
Percent TFA0.050.05
0.100.00
0.000.10
% TFA% FA

350
400
450High Mass Load
CSH C18
BEH C18
A 6 µg of mixture
LoadabilityLoadability
Attribute – how much analyte can be loaded before peak shape deteriorates
CSH130 C18 1.7 µm
Typical Mass Load
350
400
450Low Mass Load
CSH C18
BEH C18
BCSH C18
BEH C18
0.6 µg of mixture
CSH130 C18 1.7 µm
BEH130 C18 1.7 µm
Low Mass Load*Previously shown
©2013 Waters Corporation 19
Pc,4σ
150
200
250
300
0.00 0.01 0.02 0.03 0.04 0.05 0.06 0.07 0.08 0.09 0.10
Pc,4σ
Percent TFA0.05
0.05
0.00
0.10
0.10
0.00
% TFA
% FA
BEH130 C18 1.7 µm
150
200
250
300
0.00 0.01 0.02 0.03 0.04 0.05 0.06 0.07 0.08 0.09 0.10
Pc,4σ
Percent TFA
0.100.10
0.000.05
0.05
0.00
0.10
0.10
0.00
BEH130 C18 1.7 µm

CSH130 C18 and Separations without TFA
©2013 Waters Corporation 20
CSH130 C18 and Separations without TFA

LCLC--MSMS
©2013 Waters Corporation 21
0.1% TFA
10x drop in sensitivityWaters ACQUITY UPLC CSH130 C18
2.1 x 150 mm, 1.7 µm, 130Å 2% ACN for 1 min,then to 50% ACN over 60 min0.3 mL/min40°C
ACQUITY UPLC H-Class BioXevo G2 QTof500 pmol MassPREP Enolase Digestp/n 186002337

CSH130 C18 CSH130 C18 vsvs Other ChemistriesOther Chemistries
0.1% FA
©2013 Waters Corporation 22
Improvement for both optical and MS detection

LCLC--MS MS Retention and SelectivityRetention and Selectivity
©2013 Waters Corporation 23

Large Peptides/Small ProteinsLarge Peptides/Small Proteins0.1% FA0.1% FA
130 Å
Peptide/Protein kDa
1 Bradykinin 1.1
2 Renin Substrate 1.8
3 Ubiquitin 8.6
4 Cytochrome C (Equine) 12.4
5 Insulin(Bovine) 5.7
6 Melittin 2.8
©2013 Waters Corporation 24
300 ÅACQUITY UPLC H-Class BioUV @ 214 nm / Xevo G2 QTOF 1 µg each component
2.1 x 150 mm columns2% ACN for 1 min,then to 50% ACN over 60 min0.3 mL/min40°C

Peptide Mapping of a Therapeutic mAb
©2013 Waters Corporation 25
Peptide Mapping of a Therapeutic mAb

Peptide Mapping a Therapeutic Peptide Mapping a Therapeutic mAbmAb
� Trastuzumab (Herceptin; Genentech) – Breast Cancer, Anti-HER2– One of the highest grossing therapeutic mAbs (~5 billion $/yr)
– Biosimilars
– Basis for a new ADC (Trastuzumab emantansine)
o Phase III clinical trials completed
� High peak capacity at mass loads to detect trace modifications and
©2013 Waters Corporation 26
� High peak capacity at mass loads to detect trace modifications and thoroughly characterize
o Disulfide linkages
o Deamidation
o Oxidation
o Glycosylation
o Conjugation in ADCs
JCO 2010;28:2698-2704

NonNon--Reduced LysReduced Lys--C Peptide MappingC Peptide Mapping
Anal Biochem 2011, 411 (2), 284-91.
A recent Amgen protocol:
� Non-Reduced Lys-C Digests– Minimal complexity + disulfides preserved
– 27 different linear peptides
– 8 different disulfide linked peptides
– 150 to 11,000 Da
©2013 Waters Corporation 27
Heavy Chain
Light Chain
1-30 31-43 44-65 66-76 77-124 125-136 137-150 151-213 214-216 217 218-221 222-225 226-251 252-277 278-291 292-320 321-323 324-325 326-329 330-337 338-341 342-343 344-363 364-373 374-395 396-412 413-417 418-442 443-449
1-42 43-45 46-103 104-107 108-126 127-145 146-149 150-169 170-183 184-188 189-190 191-207 208-214
S-S S-S
S-SS-S S-S
S-S S-S
S-S S-S
S-S S-S
S-SS-S
S-S
S-S
S-S
L:
H:
H:
L:
1-42 43-45 46-103 104-107 108-126 127-145 146-149 150-169 170-183 184-188 189-190 191-207 208-214
1-30 31-43 44-65 66-76 77-124 125-136 137-150 151-213 214-216 217 218-221 222-225 226-251 252-277 278-291 292-320 321-323 324-325 326-329 330-337 338-341 342-343 344-363 364-373 374-395 396-412 413-417 418-442 443-449
1-30 31-43 44-65 66-76 77-124 125-136 137-150 151-213 214-216 217 218-221 222-225 226-251 252-277 278-291 292-320 321-323 324-325 326-329 330-337 338-341 342-343 344-363 364-373 374-395 396-412 413-417 418-442 443-449
1-42 43-45 46-103 104-107 108-126 127-145 146-149 150-169 170-183 184-188 189-190 191-207 208-214Disulfide Bond
Lys-C Cleavage(C-terminal Side of Lys)

400
Method ConsiderationsMethod Considerations
ACQUITY UPLC BEH130 C18 1.7µm
ACQUITY UPLC CSH130 C18 1.7µm 2.1 x 150 mm
1.2
0.02% TFA0.08% FA
CSH130 C18
Elevated Temperature (60°C)� Optimize peak capacity
� Small compromise to MS Sensitivity
� Improved peak shape and recovery
� 5-11 kDa species
©2013 Waters Corporation 28
12
10
8
6
4
2
150
200
250
300
350
0.00 0.02 0.04 0.06 0.08 0.10
Peak Capacity
Percent TFA
0.0
0.2
0.4
0.6
0.8
1.0
92.5 95 97.5 100 102.5 105 107.5 110 112.5
A210
Time (min)
40°C
60°C
5-11 kDa Species BEH130 C18
Anal Chem 2011, 83 (15), 5912-9.Anal Biochem 2011, 411 (2), 284-91.MAbs 2010, 2 (4)J Biol Chem 2009, 284 (51), 35390-402.
CSH130 C18
BEH130 C18
MS Signal

NonNon--Reduced LysReduced Lys--C Peptide MapsC Peptide MapsTrastuzumabTrastuzumab
©2013 Waters Corporation 29
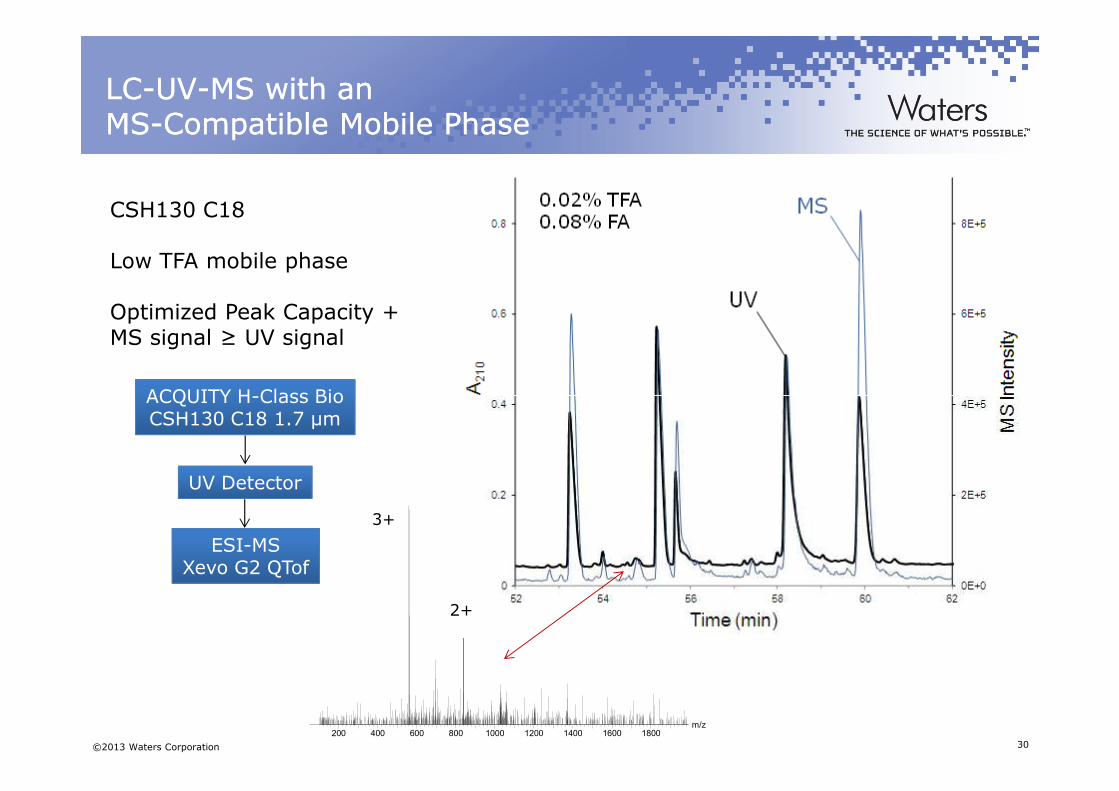
LCLC--UVUV--MS with an MS with an MSMS--Compatible Mobile PhaseCompatible Mobile Phase
CSH130 C18
Low TFA mobile phase
Optimized Peak Capacity +MS signal ≥ UV signal
ACQUITY H-Class Bio
©2013 Waters Corporation 30
m/z200 400 600 800 1000 1200 1400 1600 1800
ACQUITY H-Class BioCSH130 C18 1.7 µm
UV Detector
ESI-MSXevo G2 QTof
3+
2+

0.3
0.5
0.7
0.9
1.1
A210
L:208-214 x H
:222-225
H364-373 x H:418-442
H:252-277 x H:324-325
L:127-145 x L:191-207
H:1-30 x H:77-124
H:226-251 x H:226-251
L:1-42 x L:46-103
H:137-150 x H:151-213
Disulfide CharacterizationDisulfide Characterization
CSH130 C18 - Optimized Gradient
Non-Reduced
©2013 Waters Corporation 31
-1.1
-0.9
-0.7
-0.5
-0.3
-0.1
0 10 20 30 40 50 60 70 80 90 100 110 120 130
A210
Time (min)
0.1
L:208-214
L:191-207
H:137-150
H364-373
H:418-442
H:252-277
H:1-30
L:127-145
H:226-251
L:46-103
H:151-213
H:77-124
L:1-42
Reduced
Blank
1-42 43-45 46-103 104-107 108-126 127-145 146-149 150-169 170-183 184-188 189-190 191-207 208-214
S-S S-S
S-SS-S S-S S-SS-S
S-S
S-S
1-42 43-45 46-103 104-107 108-126 127-145 146-149 150-169 170-183 184-188 189-190 191-207 208-2141-42 43-45 46-103 104-107 108-126 127-145 146-149 150-169 170-183 184-188 189-190 191-207 208-214
222-225 226-251 252-277
1-30 31-43 44-65 66-76 77-124 125-136 137-150 151-213 214-216 217 218-221 222-225 226-251 252-277 278-291 292-320 321-323 324-325 326-329 330-337 338-341 342-343 344-363 364-373 374-395 396-412 413-417 418-442 443-449
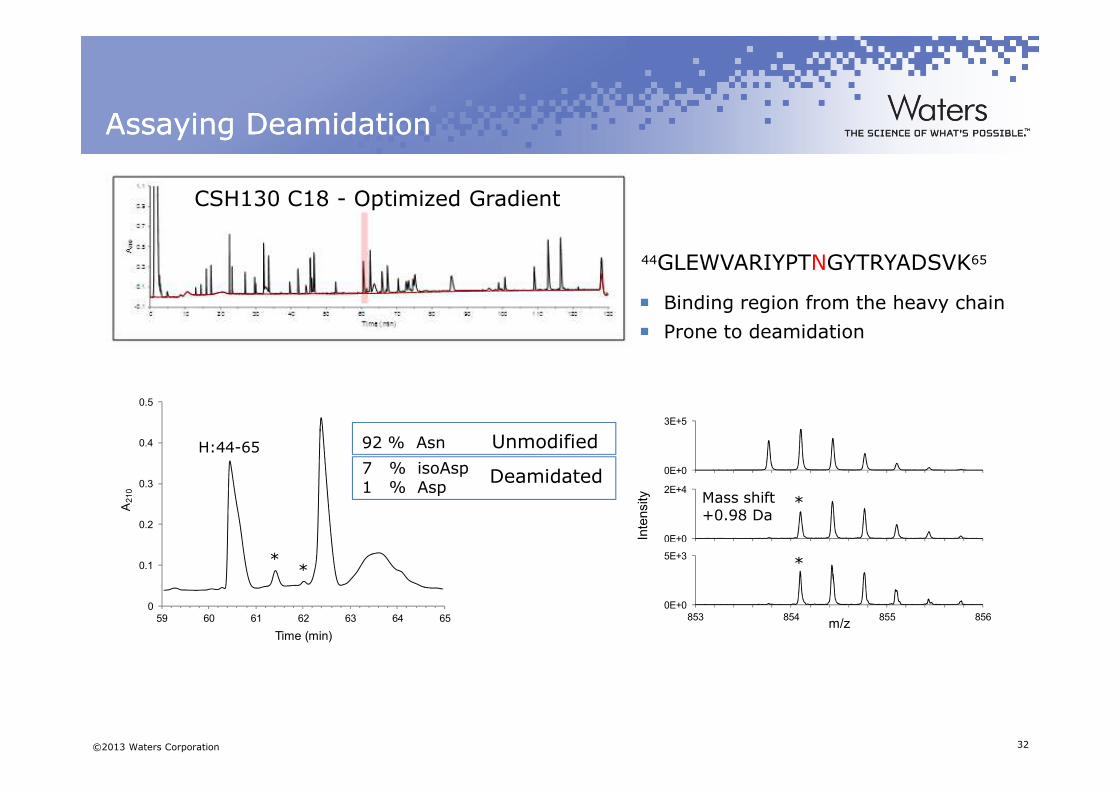
Assaying Assaying DeamidationDeamidation
44GLEWVARIYPTNGYTRYADSVK65
CSH130 C18 - Optimized Gradient
� Binding region from the heavy chain
� Prone to deamidation
©2013 Waters Corporation 32
0
0.1
0.2
0.3
0.4
0.5
59 60 61 62 63 64 65
A210
Time (min)
0E+0
3E+5
853 854 855 856
H:44-65
**
92 % Asn
7 % isoAsp1 % Asp
Intensity
0E+0
2E+4
853 854 855 856
0E+0
5E+3
853 854 855 856m/z
Mass shift+0.98 Da
*
*
Deamidated
Unmodified

ConclusionsConclusions
� CSH130 C18 Peptide Separations– Improved loadability and greater peak capacity vs. other C18 columns
– Excellent peak shape with both TFA and FA mobile phases (highly compatible with MS)
– 130Å pore size optimal for species up to 8-10 kDa
©2013 Waters Corporation 33
– Unique selectivity (basic residues)
o Less retentive
� Exceptional chemistry for peptide separations– Peptide mapping
... proteomics and peptide isolation

Peptide Separation Technology Columns
©2013 Waters Corporation 34
Peptide Separation Technology Columns

New Addition to the Suite of New Addition to the Suite of Waters Peptide Separation Technology Waters Peptide Separation Technology
� Peptide Separation Technology– Peptide C18 Columns– QC Tested with Digests
� BEH Technology– BEH130 C18 and BEH300 C18– Industry Leading Performance for Most Applications
©2013 Waters Corporation 35
– Industry Leading Performance for Most Applications– Two Pore Sizes– Particle Sizes: 1.7 µm, 3.5 µm, 5 µm– Analytical, Nano and Prep Columns
� Now even more tools in the toolbox … CSH Technology– CSH130 C18– Best columns for formic acid separations– Unique selectivity

UPLC UPLC andand HPLCHPLC
0.2
0.4
0.6
0.8
1.0A214
0.2
0.4
0.6
0.8
1.0
A214
0.1 % FA
1.7 µm
CSH130 C182.1 x150 mm
0.1 % TFA
~8000 psi
High peak capacity separations not limited to UPLC
CSH130 C18 Peptide Separation Technology Columns
Available Now: Upcoming:
©2013 Waters Corporation 36
0.0
10 20 30 40 50
Time (min)
0.0
0.2
0.4
0.6
0.8
1.0
14.5 24.5 34.5 44.5 54.5 64.5 74.5
A214
Time (min)
0.0
10 20 30 40 50
Time (min)
0.0
0.2
0.4
0.6
0.8
1.0
13.5 23.5 33.5 43.5 53.5 63.5 73.5
A214
Time (min)
2.5 µm XP~3000 psi
Longer Run Time
LowerPressure
Method Transfer
Available Now: Upcoming:Analytical Columns Nano (75, 150, 300 µm ID)1.7 µm Prep Columns (5 µm) 2.5 µm XP3.5 µm

Quality ControlQuality Control
CSH130 C180.1 % Formic Acid
©2013 Waters Corporation 37

Quality ControlQuality Control
AU
0.00
0.20
0.40
0.60
0.80
1.00
1.20
Minutes2.00 3.00 4.00 5.00 6.00 7.00 8.00 9.00
AU
0.40
0.60
0.80
1.00
1.20Batch 108
T1
T13-T14
T14
T4
T9-T10
T10
T8
T15
T19C
T19
Batch 110
T12-T13 T12
� CSH130 C18
� Batch-to-Batch Reproducibility
� Cytochrome C Digest, 0.1% Formic Acid
©2013 Waters Corporation 38
0.00
0.20
0.40
Minutes2.00 4.00 6.00 8.00
AU
0.00
0.20
0.40
0.60
0.80
1.00
1.20
Minutes2.00 4.00 6.00 8.00
Batch 116
AU
0.00
0.20
0.40
0.60
0.80
1.00
1.20
Minutes2.00 4.00 6.00 8.00
Batch 102
*Data provided by S. McCall/P. Iraneta
Formic Acid
� Each new column will perform comparably toone previously used

Analytical Standards and Reagents (ASR)Analytical Standards and Reagents (ASR)
Digestion Standards
MassPREP Peptide Mixture
Cytochrome C Digestion StandardPart Number: 186006371
©2013 Waters Corporation 39
Rapigest SF
Amgen Digestion ProtocolAnal Chem. 2009 81(4):1686-92

Useful LiteratureUseful Literature
� Charged Surface Hybrid (CSH) Technology and Its Use in Liquid Chromatography– P.C. Iraneta, K.D. Wyndham, D.R. McCabe, and T.H. Walter
– Waters White Paper 720003929EN 2011
� Increasing Peak Capacity in Reversed Phase Peptide Separations with Charged Surface Hybrid (CSH) C18 Columns– M.A. Lauber, S.M. Koza, K.J. Fountain
– Waters Application Note 720004568EN 2013
©2013 Waters Corporation 40
� Peptide Mapping and Small Protein Separations with Charged Surface Hybrid (CSH) C18 and TFA-Free Mobile Phases– M.A. Lauber, S.M. Koza, K.J. Fountain
– Waters Application Note 720004571EN 2013
� High Resolution Peptide Separations with a Charged Surface C18 Stationary Phase– M.A. Lauber, S.M. Koza, S.A. McCall, B.A. Alden, P.C. Iraneta, and K.J. Fountain
– Manuscript in Preparation 2013