higher education talk chris fuller
DESCRIPTION
Parental talkTRANSCRIPT

Challenging minds in challenging times.
A brief overview of some key issues with Higher Education applications and admissions
Chris Fuller, Learn with US Lecturer February 2011

2
Challenging minds in challenging times
• Application and admission figures
• The globalization of HE and Russell Group universities
• League tables
• Fees
• State verses independent intake

3
UCAS Applications and Acceptances 1996 - 2010
Source: UCAS
7
6
5
4
3
2
1
0
1996 1997 1998 1999 2000 2001 2002 2003 2004 2005 2006 2007 2008 2009
Year of Entry
Acceptances
334,594
479,057
44%
HEFCE adding places year on year
until capped in 2008 – 2009.
2010
Hundreds of
thousands

4
UCAS Applications and Acceptances 1996 - 2010
Source: UCAS
7
6
5
4
3
2
1
0
1996 1997 1998 1999 2000 2001 2002 2003 2004 2005 2006 2007 2008 2009
Year of Entry
Acceptances
2010
Hundreds of
thousands
Applications
23%
77.6%
75.3%
69.6%
633,592
688,310
582,657
5
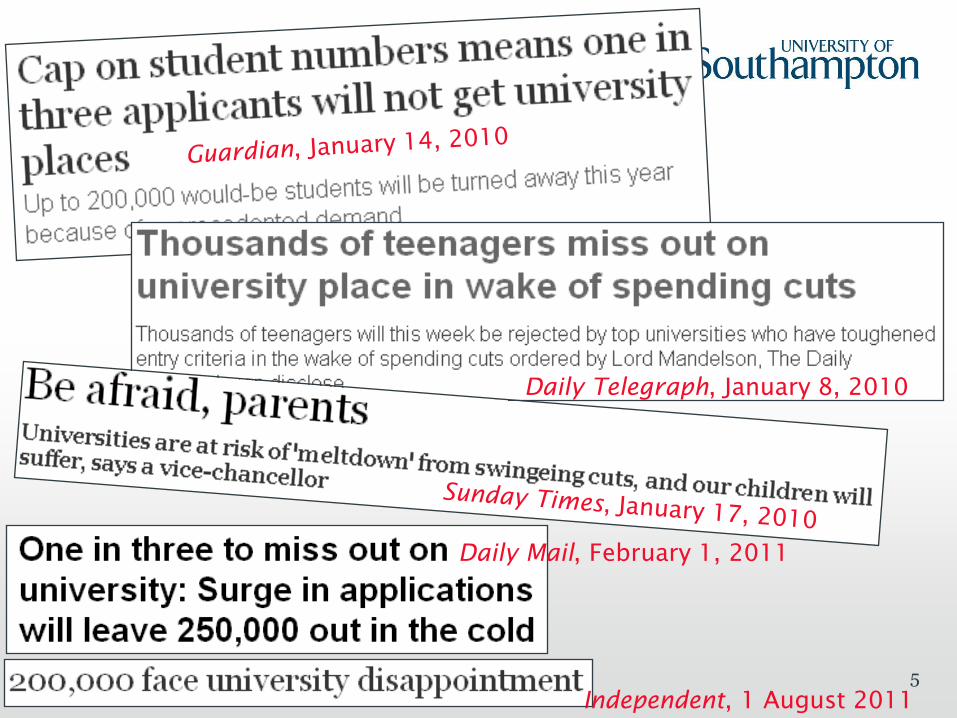
Daily Telegraph, January 8, 2010
Daily Mail, February 1, 2011
Independent, 1 August 2011

6
Russell Group applications per places 2011-12 Applications Places / Offers Ratio
London School of Economics 18,693 1,290 14.5
University of Bristol 39,420 3,849 10.2
The University of Edinburgh 45,868 3,868 11.9
King's College London 37,046 4,059 9.1
The University of Warwick 34,868 4,178 8.3
University College London 34,559 4,031 8.6
The University of Manchester 58,252 8,942 6.5
The University of Liverpool 32,022 4,431 7.2
University of Leeds 52,823 7,462 7.1
The University of Birmingham 43,383 5,480 7.9
Cardiff University 33,054 4,892 6.8
The University of Sheffield 39,920 5,048 7.9
University of Southampton 38,410 5,404 7.1
The University of Nottingham 48,904 6,898 7.1
Newcastle University 28,639 4,678 6.1
Imperial College London 14,935 2,477 6.1
University of Glasgow 29,851 4,432 6.7
Queen's University Belfast 21,195 3,733 5,7
University of Oxford 17,895 3,214 5.6
University of Cambridge 16,225 3,378 4.8
AVERAGE 34,298 4,587 7.5
Sources: Russell Group, Sunday Times University Guide 2012

7
Russell Group applications per places 2011-12 Applications Places / Offers Ratio
London School of Economics 18,693 1,290 14.5
University of Bristol 39,420 3,849 10.2
The University of Edinburgh 45,868 3,868 11.9
King's College London 37,046 4,059 9.1
The University of Warwick 34,868 4,178 8.3
University College London 34,559 4,031 8.6
The University of Manchester 58,252 8,942 6.5
The University of Liverpool 32,022 4,431 7.2
University of Leeds 52,823 7,462 7.1
The University of Birmingham 43,383 5,480 7.9
Cardiff University 33,054 4,892 6.8
The University of Sheffield 39,920 5,048 7.9
University of Southampton 38,410 5,404 7.1
The University of Nottingham 48,904 6,898 7.1
Newcastle University 28,639 4,678 6.1
Imperial College London 14,935 2,477 6.1
University of Glasgow 29,851 4,432 6.7
Queen's University Belfast 21,195 3,733 5,7
University of Oxford 17,895 3,214 5.6
University of Cambridge 16,225 3,378 4.8
AVERAGE 34,298 4,587 7.5
Sources: Russell Group, Sunday Times University Guide 2012
AAB 2% 11%
09-10
15%
08-09

8
Reduction in clearance places
10.2 % of the University of
Southampton’s 2006/07
intake came through
clearing
1 % of the University’s 2010/11 intake
came through clearing

9
UCAS Applications and Acceptances 1996 - 2010
Source: UCAS
7
6
5
4
3
2
1
0
1996 1997 1998 1999 2000 2001 2002 2003 2004 2005 2006 2007 2008 2009
Year of Entry
Acceptances
2010
Hundreds of
thousands
Applications
2011-12 8.7%

10
Challenging minds in challenging times
• Application and admission figures
• The globalization of HE and Russell Group universities
11
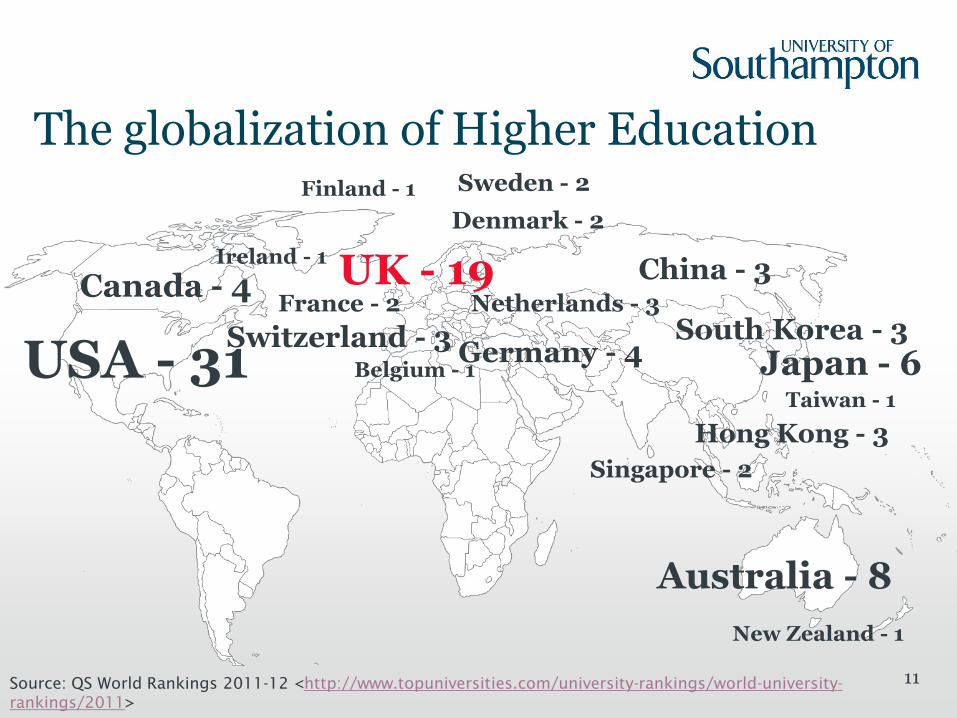
The globalization of Higher Education
USA - 31
UK - 19
Australia - 8
Canada - 4
Switzerland - 3 Japan - 6
Hong Kong - 3
France - 2
Singapore - 2
Ireland - 1
South Korea - 3 Netherlands - 3
China - 3
Denmark - 2
New Zealand - 1
Belgium - 1
Sweden - 2
Taiwan - 1
Germany - 4
Source: QS World Rankings 2011-12 <http://www.topuniversities.com/university-rankings/world-university-
rankings/2011>
Finland - 1

12
Global graduates
UK universities in the
World Top 100
QS World University Ranking 2010-11
Cambridge
UCL
Imperial
Oxford
Edinburgh
Manchester
Kings
Bristol
Warwick
LSE
Birmingham
St. Andrews
Sheffield
Glasgow York
Southampton
Leeds
Nottingham
Durham

13
Global graduates
Cambridge
UCL
Imperial
Oxford
Edinburgh
Manchester
Kings
Bristol
Warwick
LSE
Birmingham
Sheffield
Glasgow
Southampton
Leeds
Nottingham
RG universities in
World Top 100
QS World University Ranking 2010 - 11

14
•University of Birmingham
•University of Bristol
•University of Cambridge
•Cardiff University
•University of Edinburgh
•University of Glasgow
•Imperial College London
•King’s College London
•University of Leeds
•University of Liverpool
•London School of Economics (LSE)
•University of Manchester
•Newcastle University
•University of Nottingham
•Queen’s University Belfast
•University of Oxford
•University of Sheffield
•University of Southampton
•University College London (UCL)
•University of Warwick
www.russellgroup.ac.uk
Research intensive universities

15
Research
Education Enterprise

16
Problems
Solutions Jobs
17
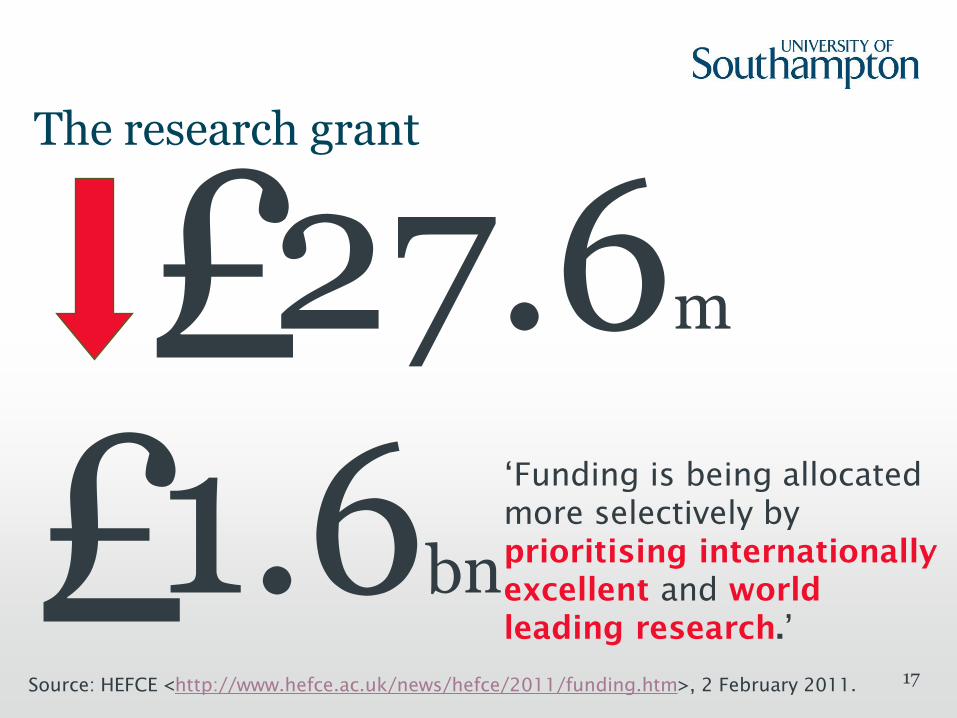
The research grant
27.6m £ 1.6bn £
‘Funding is being allocated
more selectively by
prioritising internationally
excellent and world
leading research.’
Source: HEFCE <http://www.hefce.ac.uk/news/hefce/2011/funding.htm>, 2 February 2011.

18
Research intensive education

19
Challenging minds in challenging times
• Application and admission figures
• The globalization of HE and Russell Group universities
• League tables

20

21
Graduate employability

22 Source: The Sunday Times League
Table, 2010-2011
Percentage of
students in full time
graduate
employment within
six months of
leaving university.
Score awarded by
students for quality
of education,
facilities, support
and social life.

23
Employability – Destination of Leavers from Higher Education Survey
85% of our graduates were
employed or
undertaking further
study six months after
graduation
Source: Destination of Leavers from Higher Education Survey 2009-10 <http://www.southampton.ac.uk/careers/DLHE/>

24
95%
95%
86%
79%
53%
74%
Electronic and Electrical Engineering
Birmingham City University
Electronic and Electrical Engineering
University of Southampton
Source: <www.unistats.direct.gov.uk>

25
52%
86%
95%
History
University of Southampton
• Large numbers
going on to
postgraduate study
due to high levels
of satisfaction
• Non-vocational
focus provides
flexibility and
choice, but less
direction
• Ability to carve out
specific career
paths

26
Overlap and interdisciplinary study History Politics International
Relations America’s War
on Terror
The Rise of
Islam
The First
Crusade
American Power
and World
Order
International
Security
From Empire to
Globalisation
Issues in Third
World Politics
Year 3
Specialist Subject and dissertation of 10,000 words
Language – Beginners A
rabic
Iran and the
West

27
Sources for checking on university performance
The Good University Guide, The Times (paysite)
http://www.thetimes.co.uk/tto/public/gug/?CMP=KNGvccp1-sunday+times+university+guide
Guardian University Guide
http://www.guardian.co.uk/education/universityguide
The Complete University Guide (with Independent)
http://www.thecompleteuniversityguide.co.uk
QS Top Universities
http://www.topuniversities.com/
Times Higher Education World University Rankings
http://www.timeshighereducation.co.uk/world-university-rankings/2010-2011/top-200.html
Unistats
http://unistats.direct.gov.uk/

28
Challenging minds in challenging times
• Application and admission figures
• The globalization of HE and Russell Group universities
• League tables
• Fees

29
Budget cuts and fee increases
%
reduction in
teaching budget
. bn £
cut in government funding, replaced by
graduate contributions (loan repayments)

30
Average graduate earnings, 2000 - 2010
Source: Office of National Statistics, <http://www.ons.gov.uk/ons/dcp171776_233872.pdf>

31
Comprehensive support package
Fee waivers
Southampton Entitlement
Bursary support
Those institutions asking for full fees are required to provide the most generous financial support packages

32
University of Southampton fee waiver
5 10 15 20 25 30 35 40 45 50 55 60 70 0
1
2
3
4
5
6
7 8
9
10
Household income (£k)
Gra
du
ate
co
ntr
ibu
tio
n (
£k
)
21%* 15%* 64%*
* predicted numbers of students that will fall into each bracket
Source:
http://www.soton.ac.uk/study/feesandfundin
g/undergradfees_2012.html

33
95%
95%
86%
79%
53%
74%
£25,000 £15,000
Electronic and Electrical Engineering
Birmingham City University
2012 fees - £7,500 – £8,200
Electronic and Electrical Engineering
University of Southampton
2012 fees - £6,000 – £9,000
Sources: <www.unistats.gov.uk>, <www.bcu.ac.uk/student-info/finance-and-money-matters/undergraduate-fees-and-funding/2012-13-fees>,
<http://www.soton.ac.uk/study/feesandfunding/undergradfees_2012.html>
34
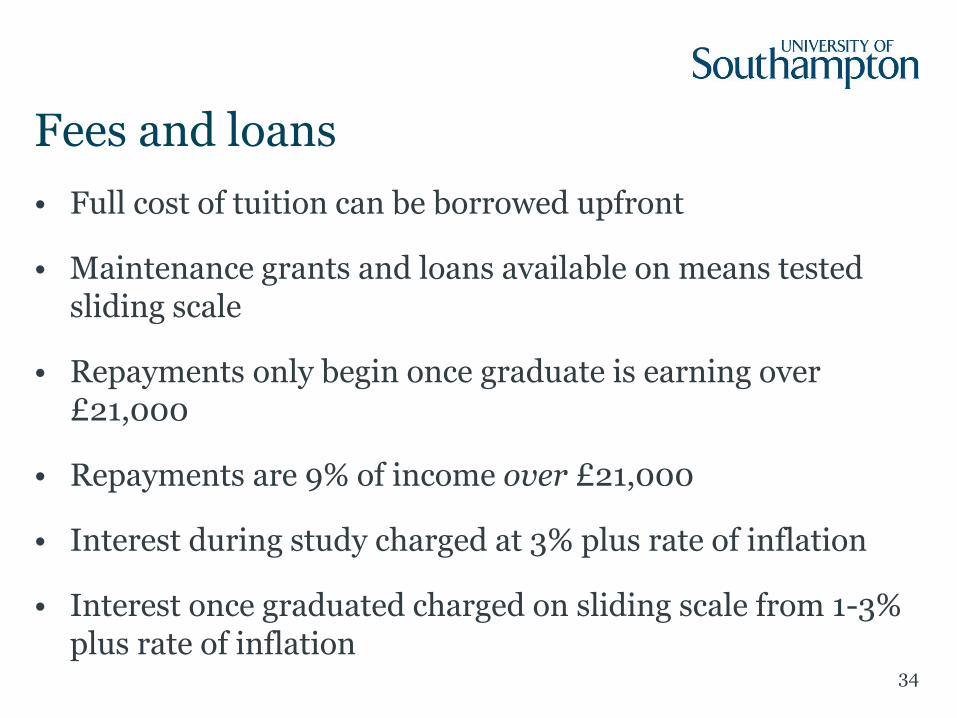
Fees and loans
• Full cost of tuition can be borrowed upfront
• Maintenance grants and loans available on means tested sliding scale
• Repayments only begin once graduate is earning over £21,000
• Repayments are 9% of income over £21,000
• Interest during study charged at 3% plus rate of inflation
• Interest once graduated charged on sliding scale from 1-3% plus rate of inflation

35
Researching fees and finances
• Government website <http://studentfinance-yourfuture.direct.gov.uk/?> • Martin Lewis, heading independent “fees taskforce” <http://www.moneysavingexpert.com/students/student-loans-tuition-fees-changes> • Individual institutions own sites e.g. ‘University of
Southampton Student Finance Calculator’ <http://www.soton.ac.uk/calculator/index_2012.html>

36
Challenging minds in challenging times
• Application and admission figures
• The globalization of HE and Russell Group universities
• League tables
• Fees
• State verses independent intake

37
State and independent sectors
Jeevan Vasagar, Guardian, 7 January 2011

38
State and independent sectors
18%
State
Independent
82%

39
Intake 2010-11* State
Independent
47%
53%
43%
57%
38%
62%
35%
65%
35%
65%
34%
66%
31%
69%
30%
70%
28%
72%
27%
73%
24%
76%
21%
79%
Oxford
Cam
bridge
Bristol
UC
L
Im
perial
LSE
Nottingham
Edinburgh
King’s C
ollege
Leeds
Warw
ick
Manchester
Source: HESA *Russell Group Universities

40
The reasons for independent school success
1) Less state school students apply to Russell Group
universities
‘Low aspirations, lack of guidance and, most
important, under-achievement […] remain significant
barriers.’
Dr Wendy Piatt, Director General of the Russell Group, quoted in Rowenna Davis,
‘Working-class revolution not reaching ‘posh’ universities’,
Guardian, 28 September, 2010
<http://www.guardian.co.uk/education/2010/sep/28/working-class-students-
posh-universities> [accessed 30 September, 2010].
41
The reasons for independent school success
2) Subject choice at GCSE and sixth-form
‘Non-selective state school students are far more
likely to take non-traditional A-levels […].’
‘The hard truth about “soft” subjects’, Fazackerley and Chant,
Policy Exchange, December 2008

42
‘Hard’ A-levels verses ‘soft’ A-levels

43
Google “Russell Group Informed Choices”
Source:
<http://www.russellgroup.ac.
uk/informed-choices.aspx>

44 Source: <http://www.russellgroup.ac.uk/informed-choices.aspx>
45
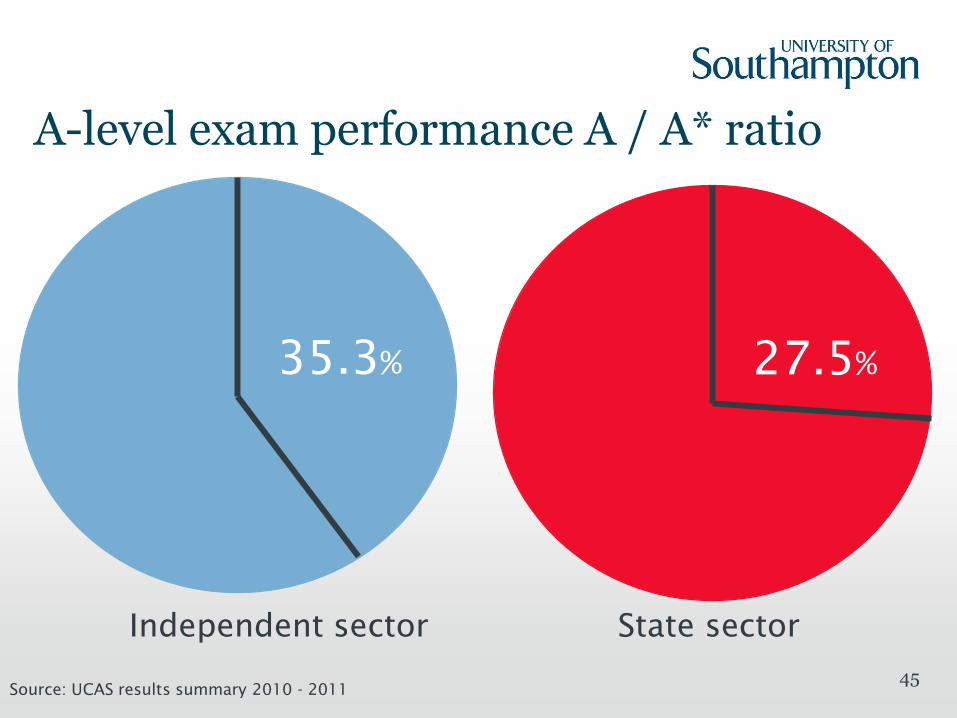
A-level exam performance A / A* ratio
Independent sector State sector
35.3% 27.5%
Source: UCAS results summary 2010 - 2011

46
Degree performance 1 / 2:1 ratio
Independent sector State sector
64% 68%
Source: London School of Economics’ Centre for Economic Performance, 2010

47
Degree performance 1 / 2:1 ratio
‘In the state sector there's more independent learning. Students are more used to working things out on their own
rather than having a teacher giving them individual attention. When they get to university, where the
classes are much larger than at school, they're better equipped to cope than those from private schools.’
Richard Murphy, Research Economist, LSE, Friday 23 July, 2010
<http://www.guardian.co.uk/education/2010/jul/23/state-school-pupils-better-university>
[accessed 16 September 2010].

48
Widening Participation Programmes
Access to Southampton (A2S)
http://www.soton.ac.uk/schoolsandcolleges/post16/a2s/
Pathways to Law
http://www.soton.ac.uk/law/outreach/pathways_to_law.page
BM6 Medicine degree
http://www.soton.ac.uk/study/undergraduate/courses/2012/medicine.s
html
Programmes that offer different entry routes, lower
grade offers, summer school support etc. for
applicants.

49
•Be in receipt of an Educational Maintenance Allowance (EMA) of £20 or £30 a week (to be replaced)
•Be in the first generation of immediate family to apply to Higher Education •Have attended a secondary school which achieved less than 48% 5 A to C passes (including English and Maths) at GCSE
•Only option is to attend a local University
•Studies disrupted by circumstances in their personal, social or domestic life
•Living or grew up in public care

50
Summary • More places available than ever before, for those that achieve
the grades
• UK students have access to world-class institutions
• Careful use of league tables, in particular the combination of student satisfaction and employability, is vital
• A degree from a good university will recoup its costs, which can be reduced or subsidised depending upon circumstances
• Take full advantage of Access programmes
• One of the biggest obstacles to progression into RG universities is a lack of confidence – work hard and apply!