higher education remuneration trends · higher education remuneration trends ... quarter of 2016...
TRANSCRIPT
Higher EducationRemuneration Trends
August 2015
www.pwc.com
PwC
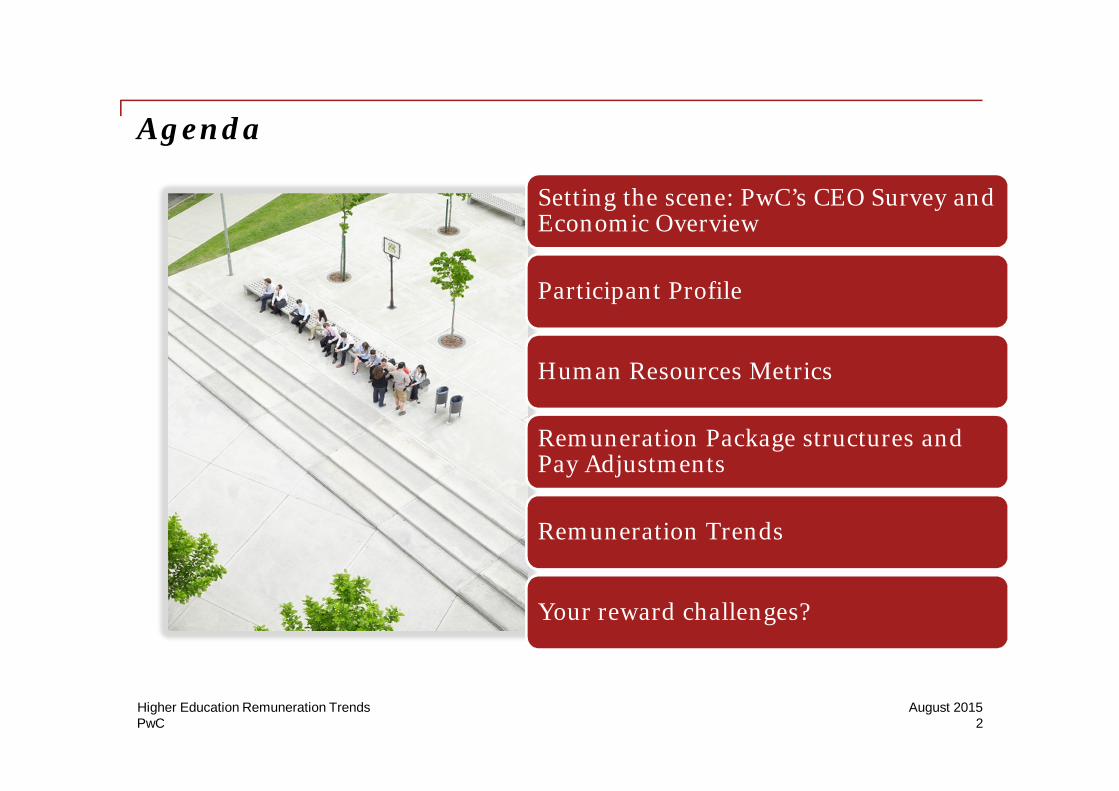
Agenda
Setting the scene: PwC’s CEO Survey andEconomic Overview
Participant Profile
Human Resources Metrics
Remuneration Package structures andPay Adjustments
Remuneration Trends
Your reward challenges?
2August 2015Higher Education Remuneration Trends
PwC
Setting the Scene: Extracts from the 18th AnnualGlobal CEO Survey and Economic Trends
3August 2015Higher Education Remuneration Trends
PwC
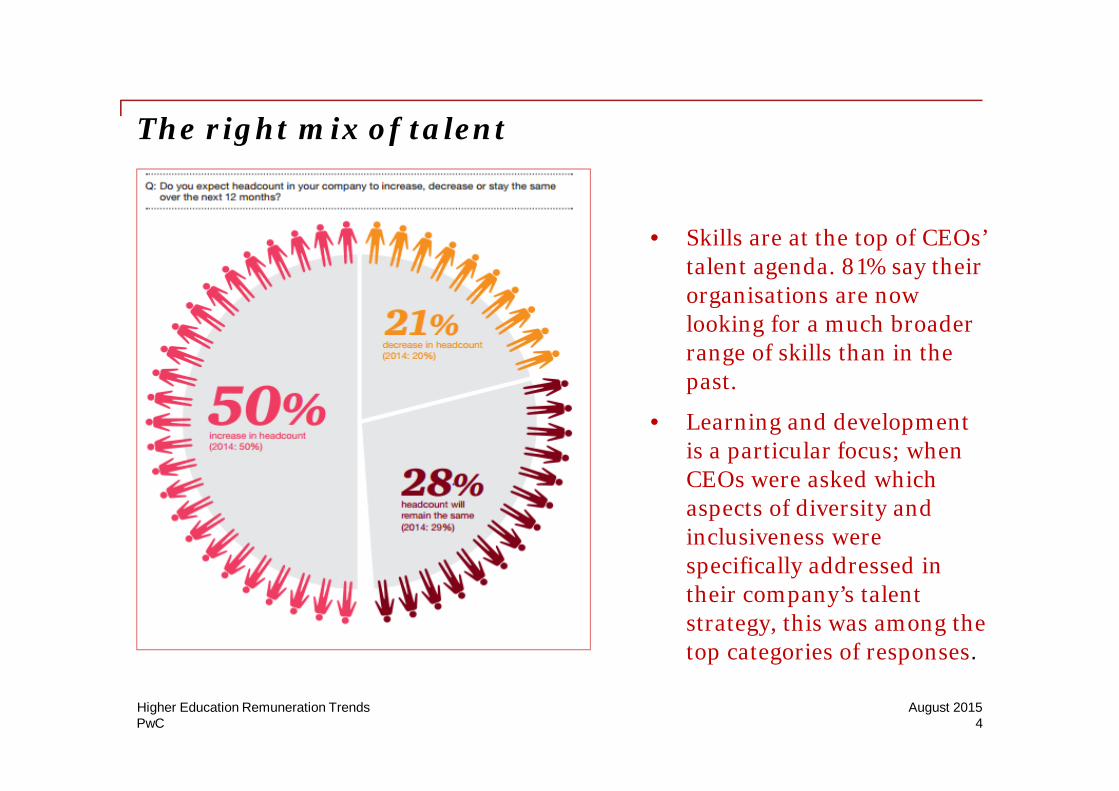
The right mix of talent
• Skills are at the top of CEOs’talent agenda. 81% say theirorganisations are nowlooking for a much broaderrange of skills than in thepast.
• Learning and developmentis a particular focus; whenCEOs were asked whichaspects of diversity andinclusiveness werespecifically addressed intheir company’s talentstrategy, this was among thetop categories of responses.
4August 2015Higher Education Remuneration Trends
PwC
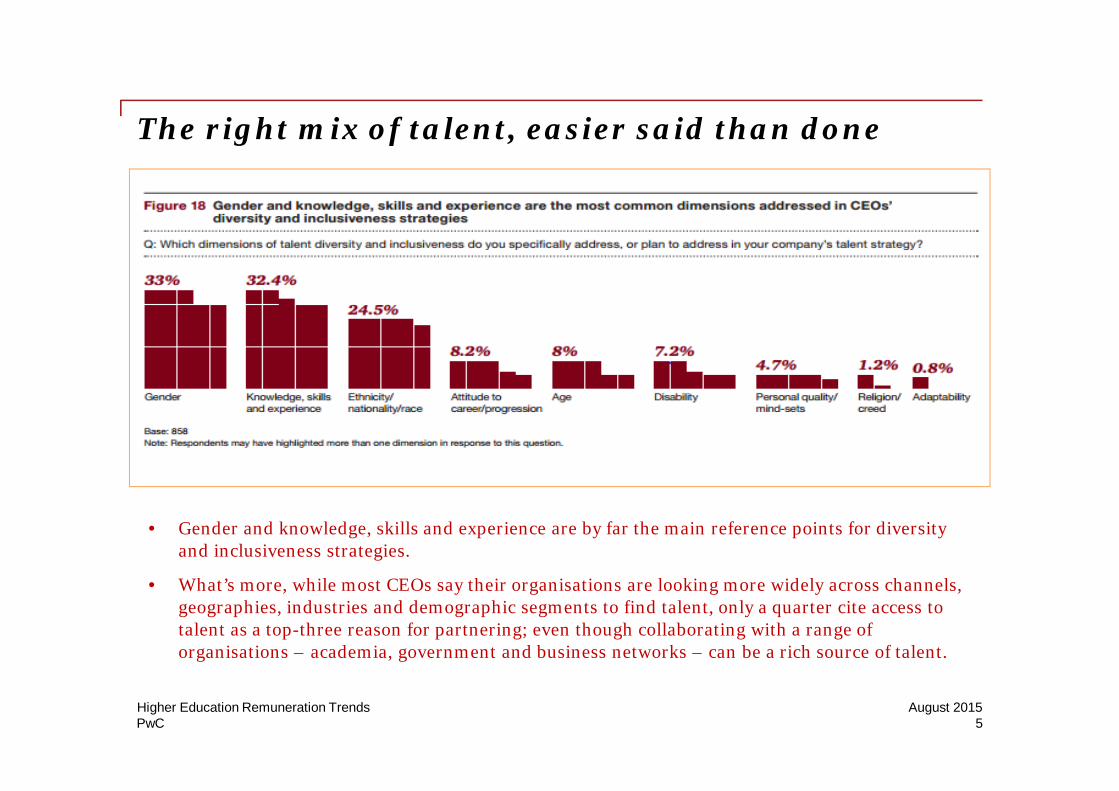
The right mix of talent, easier said than done
• Gender and knowledge, skills and experience are by far the main reference points for diversityand inclusiveness strategies.
• What’s more, while most CEOs say their organisations are looking more widely across channels,geographies, industries and demographic segments to find talent, only a quarter cite access totalent as a top-three reason for partnering; even though collaborating with a range oforganisations – academia, government and business networks – can be a rich source of talent.
5August 2015Higher Education Remuneration Trends
PwC
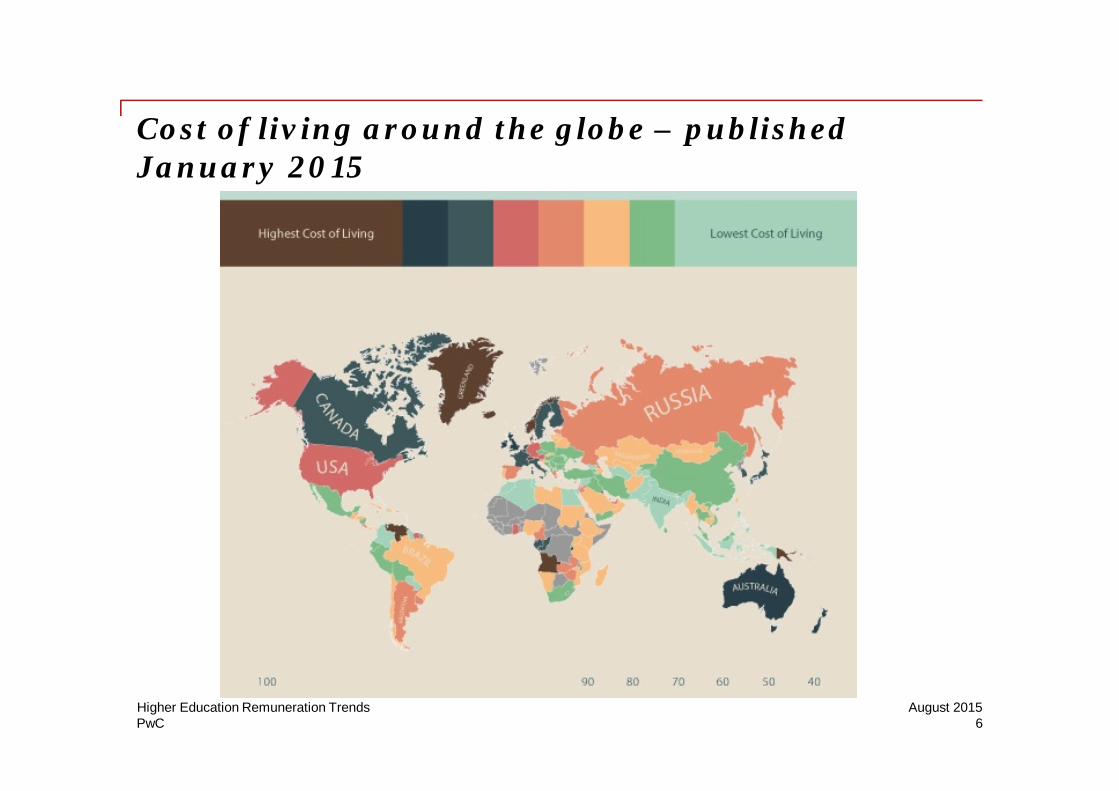
Cost of living around the globe – publishedJanuary 2015
6August 2015Higher Education Remuneration Trends
PwC
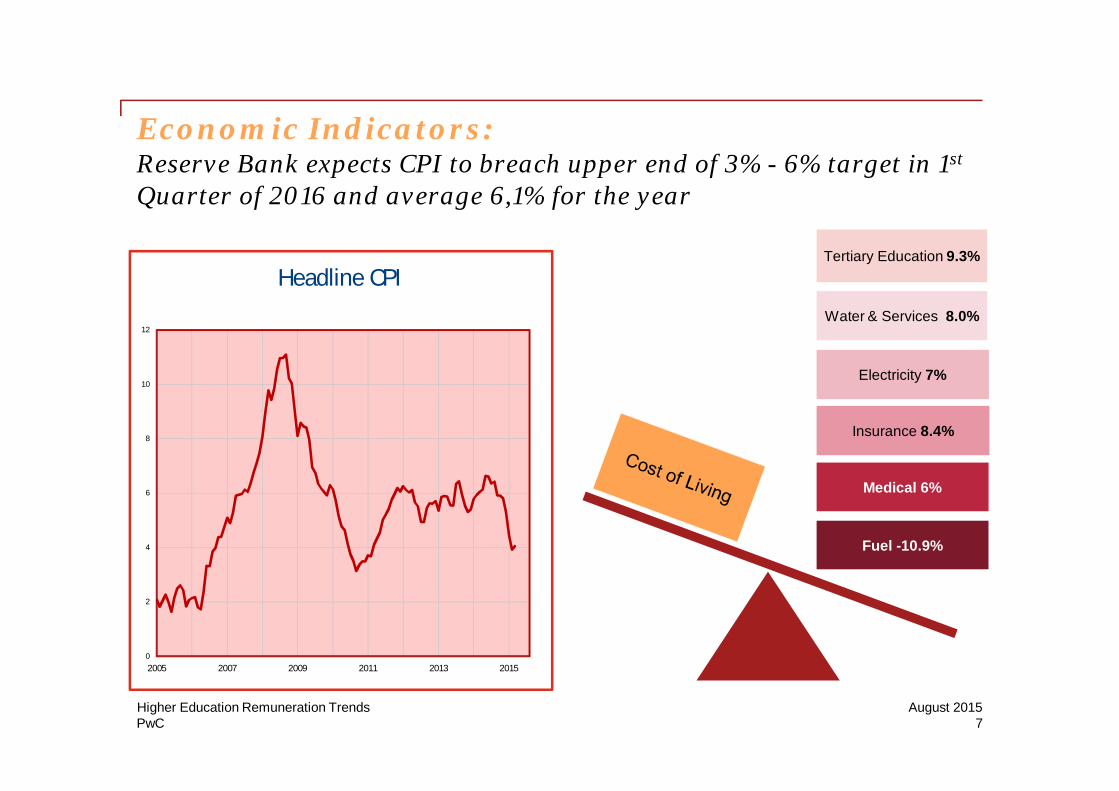
Economic Indicators:Reserve Bank expects CPI to breach upper end of 3% - 6% target in 1st
Quarter of 2016 and average 6,1% for the year
0
2
4
6
8
10
12
2005 2007 2009 2011 2013 2015
Headline CPITertiary Education 9.3%
Water & Services 8.0%
Fuel -10.9%
Medical 6%
Insurance 8.4%
Electricity 7%
7August 2015Higher Education Remuneration Trends
PwC
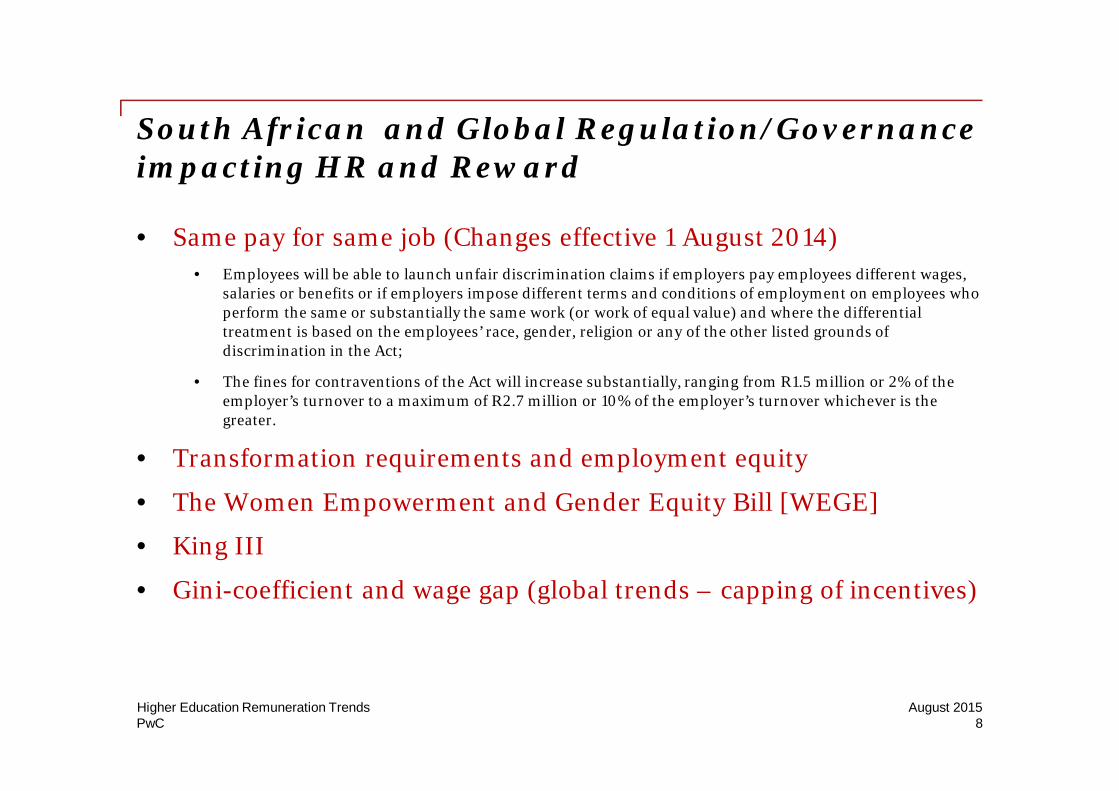
South African and Global Regulation/Governanceimpacting HR and Reward
• Same pay for same job (Changes effective 1 August 2014)
• Employees will be able to launch unfair discrimination claims if employers pay employees different wages,salaries or benefits or if employers impose different terms and conditions of employment on employees whoperform the same or substantially the same work (or work of equal value) and where the differentialtreatment is based on the employees’ race, gender, religion or any of the other listed grounds ofdiscrimination in the Act;
• The fines for contraventions of the Act will increase substantially, ranging from R1.5 million or 2% of theemployer’s turnover to a maximum of R2.7 million or 10% of the employer’s turnover whichever is thegreater.
• Transformation requirements and employment equity
• The Women Empowerment and Gender Equity Bill [WEGE]
• King III
• Gini-coefficient and wage gap (global trends – capping of incentives)
8August 2015Higher Education Remuneration Trends
PwC
Participant Profile
9August 2015Higher Education Remuneration Trends
PwC
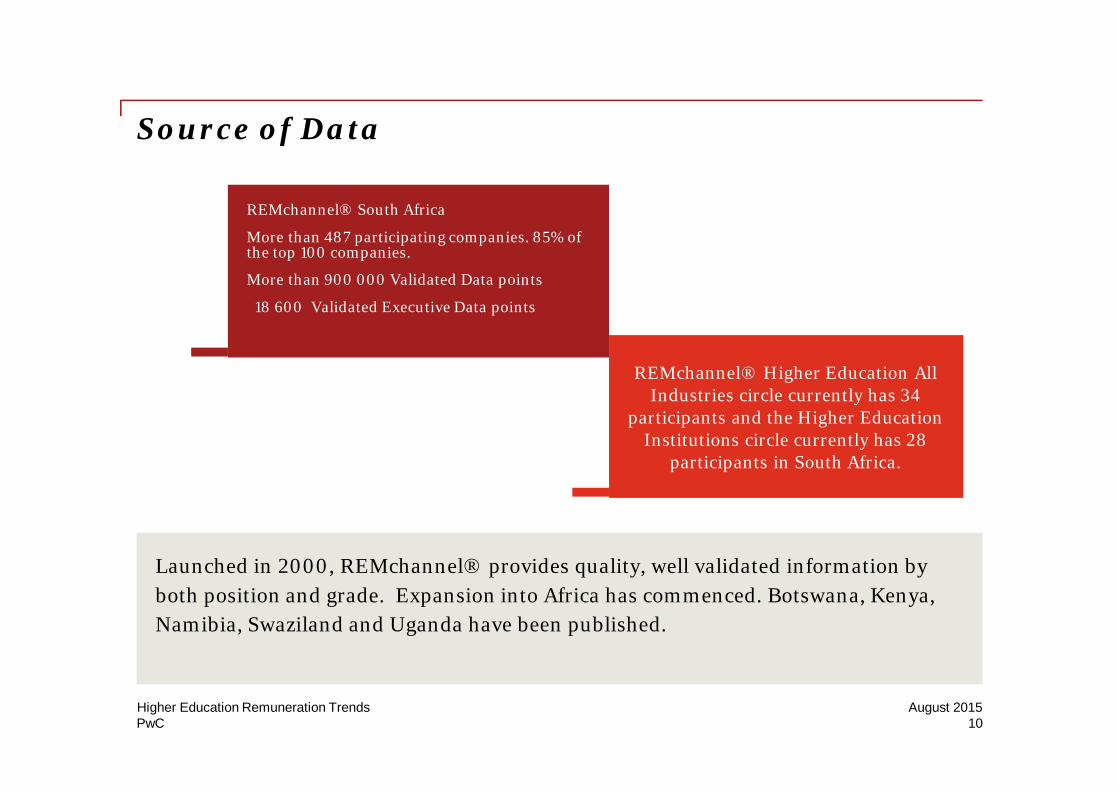
Source of Data
Launched in 2000, REMchannel® provides quality, well validated information by
both position and grade. Expansion into Africa has commenced. Botswana, Kenya,
Namibia, Swaziland and Uganda have been published.
REMchannel® South Africa
More than 487 participating companies. 85% ofthe top 100 companies.
More than 900 000 Validated Data points
18 600 Validated Executive Data points
REMchannel® Higher Education AllIndustries circle currently has 34
participants and the Higher EducationInstitutions circle currently has 28
participants in South Africa.
10August 2015Higher Education Remuneration Trends
PwC
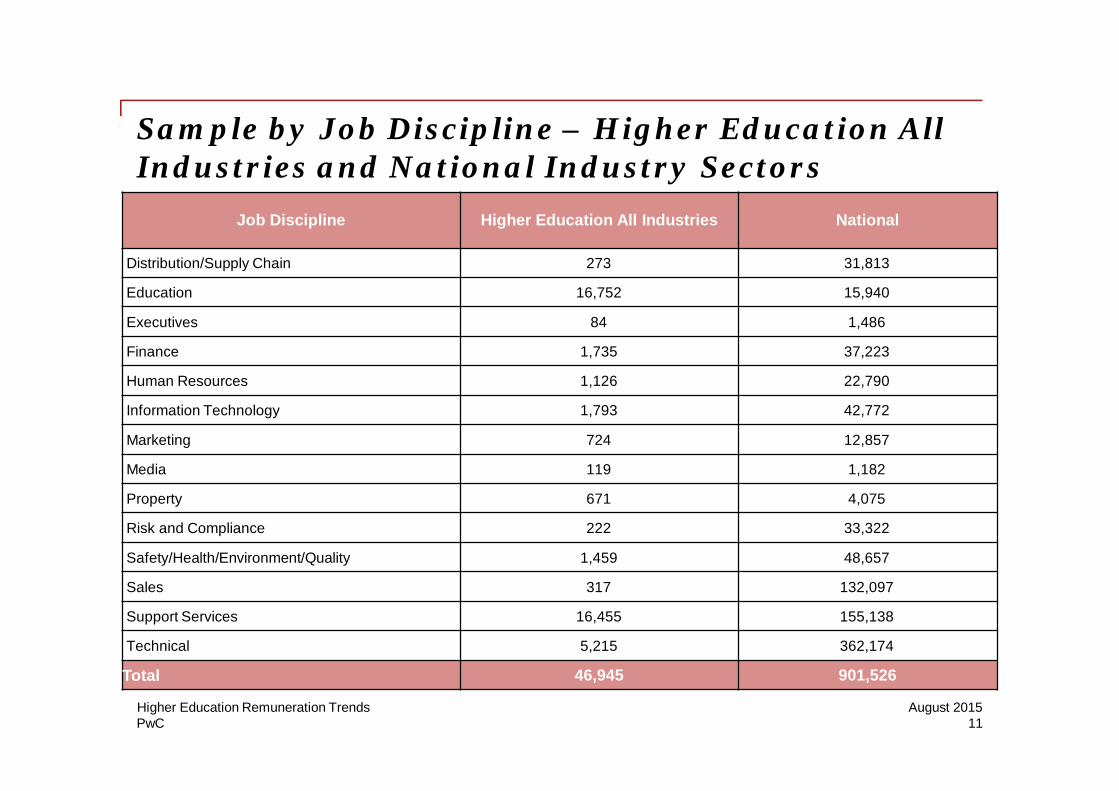
Sample by Job Discipline – Higher Education AllIndustries and National Industry Sectors
Job Discipline Higher Education All Industries National
Distribution/Supply Chain 273 31,813
Education 16,752 15,940
Executives 84 1,486
Finance 1,735 37,223
Human Resources 1,126 22,790
Information Technology 1,793 42,772
Marketing 724 12,857
Media 119 1,182
Property 671 4,075
Risk and Compliance 222 33,322
Safety/Health/Environment/Quality 1,459 48,657
Sales 317 132,097
Support Services 16,455 155,138
Technical 5,215 362,174
Total 46,945 901,526
11August 2015Higher Education Remuneration Trends
PwC
Human Resources Metrics
12August 2015Higher Education Remuneration Trends
PwC
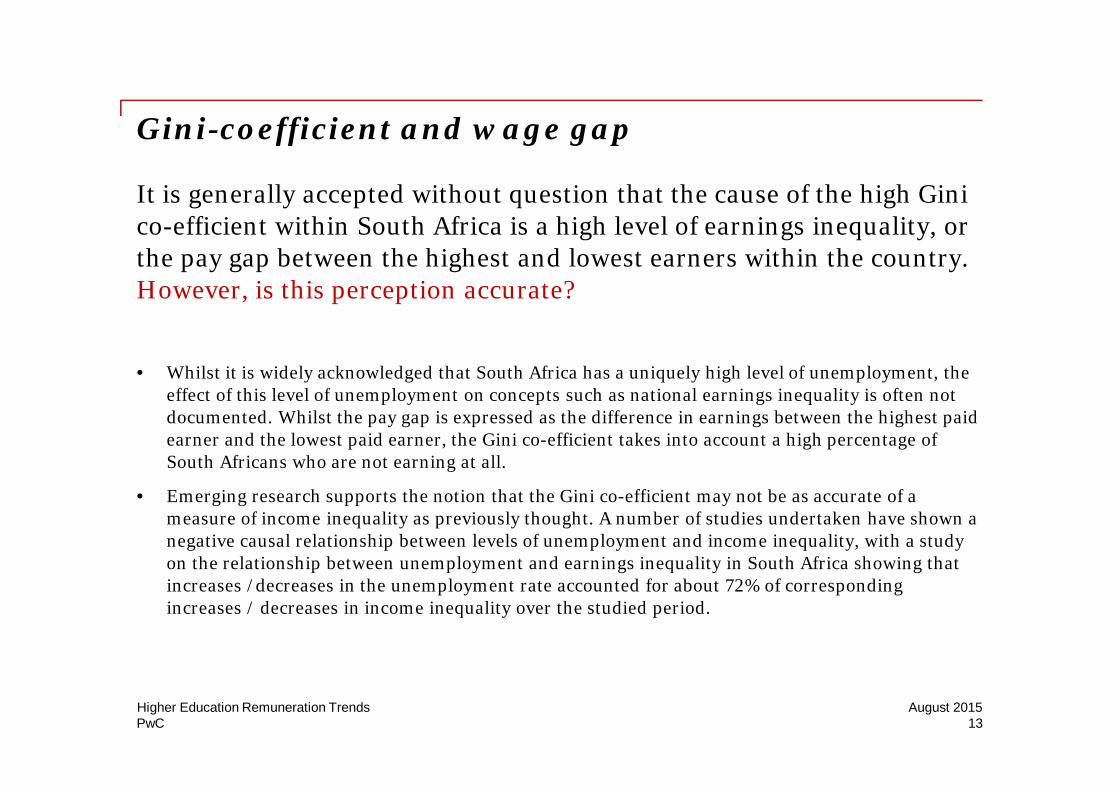
Gini-coefficient and wage gap
It is generally accepted without question that the cause of the high Ginico-efficient within South Africa is a high level of earnings inequality, orthe pay gap between the highest and lowest earners within the country.However, is this perception accurate?
• Whilst it is widely acknowledged that South Africa has a uniquely high level of unemployment, theeffect of this level of unemployment on concepts such as national earnings inequality is often notdocumented. Whilst the pay gap is expressed as the difference in earnings between the highest paidearner and the lowest paid earner, the Gini co-efficient takes into account a high percentage ofSouth Africans who are not earning at all.
• Emerging research supports the notion that the Gini co-efficient may not be as accurate of ameasure of income inequality as previously thought. A number of studies undertaken have shown anegative causal relationship between levels of unemployment and income inequality, with a studyon the relationship between unemployment and earnings inequality in South Africa showing thatincreases /decreases in the unemployment rate accounted for about 72% of correspondingincreases / decreases in income inequality over the studied period.
13August 2015Higher Education Remuneration Trends
PwC
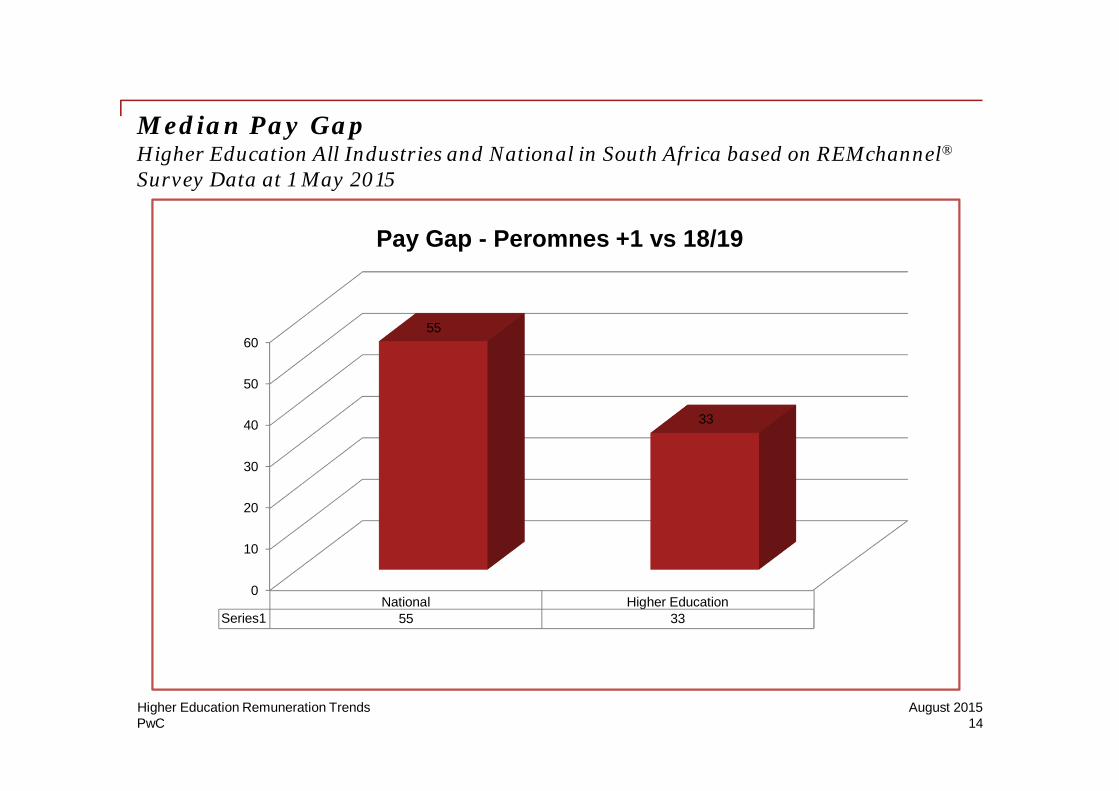
Median Pay GapHigher Education All Industries and National in South Africa based on REMchannel®
Survey Data at 1 May 2015
0
10
20
30
40
50
60
National Higher EducationSeries1 55 33
55
33
Pay Gap - Peromnes +1 vs 18/19
14August 2015Higher Education Remuneration Trends
PwC
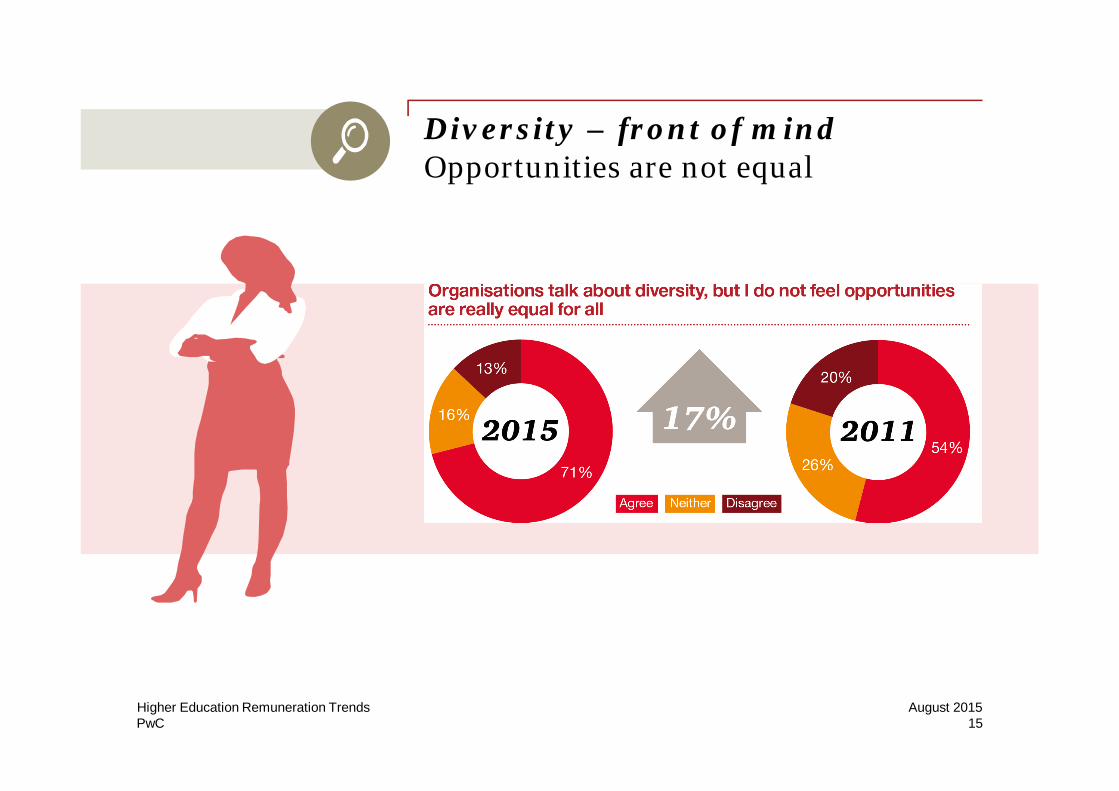
Diversity – front of mindOpportunities are not equal
15August 2015Higher Education Remuneration Trends
PwC
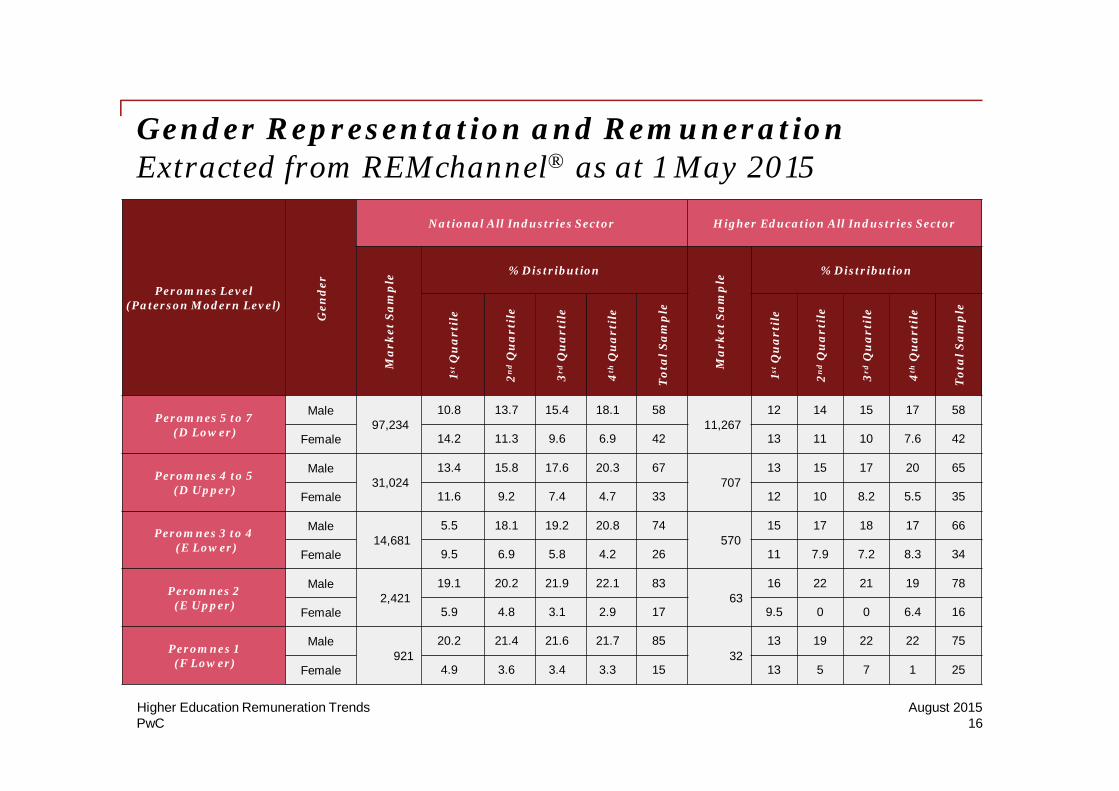
Gender Representation and RemunerationExtracted from REMchannel® as at 1 May 2015
Peromnes Level(Paterson Modern Level)
Ge
nd
er
National All Industries Sector Higher Education All Industries Sector
Ma
rk
et
Sa
mp
le
% Distribution
Ma
rk
et
Sa
mp
le
% Distribution
1stQ
ua
rti
le
2n
dQ
ua
rti
le
3r
dQ
ua
rti
le
4th
Qu
ar
tile
To
tal
Sa
mp
le
1stQ
ua
rti
le
2n
dQ
ua
rti
le
3r
dQ
ua
rti
le
4th
Qu
ar
tile
To
tal
Sa
mp
le
Peromnes 5 to 7(D Lower)
Male97,234
10.8 13.7 15.4 18.1 5811,267
12 14 15 17 58
Female 14.2 11.3 9.6 6.9 42 13 11 10 7.6 42
Peromnes 4 to 5(D Upper)
Male31,024
13.4 15.8 17.6 20.3 67707
13 15 17 20 65
Female 11.6 9.2 7.4 4.7 33 12 10 8.2 5.5 35
Peromnes 3 to 4(E Lower)
Male14,681
5.5 18.1 19.2 20.8 74570
15 17 18 17 66
Female 9.5 6.9 5.8 4.2 26 11 7.9 7.2 8.3 34
Peromnes 2(E Upper)
Male2,421
19.1 20.2 21.9 22.1 8363
16 22 21 19 78
Female 5.9 4.8 3.1 2.9 17 9.5 0 0 6.4 16
Peromnes 1(F Lower)
Male921
20.2 21.4 21.6 21.7 85
32
13 19 22 22 75
Female 4.9 3.6 3.4 3.3 15 13 5 7 1 25
16August 2015Higher Education Remuneration Trends
PwC
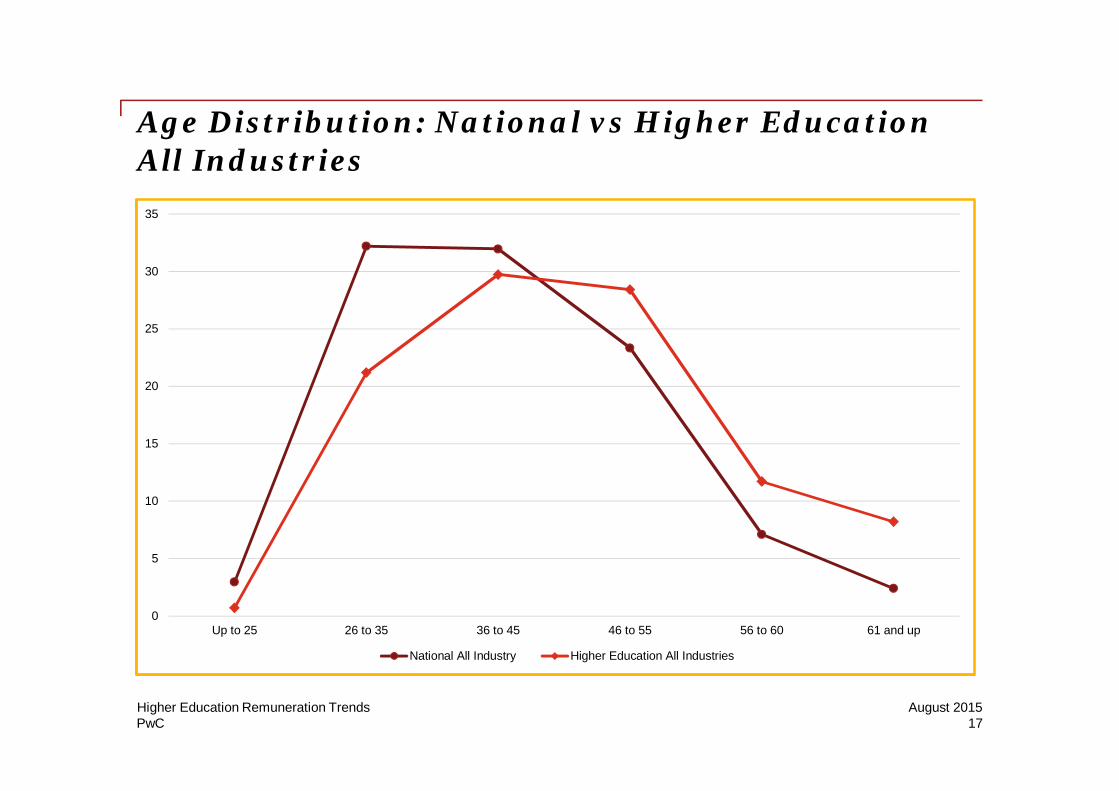
Age Distribution: National vs Higher EducationAll Industries
0
5
10
15
20
25
30
35
Up to 25 26 to 35 36 to 45 46 to 55 56 to 60 61 and up
National All Industry Higher Education All Industries
17August 2015Higher Education Remuneration Trends
PwC
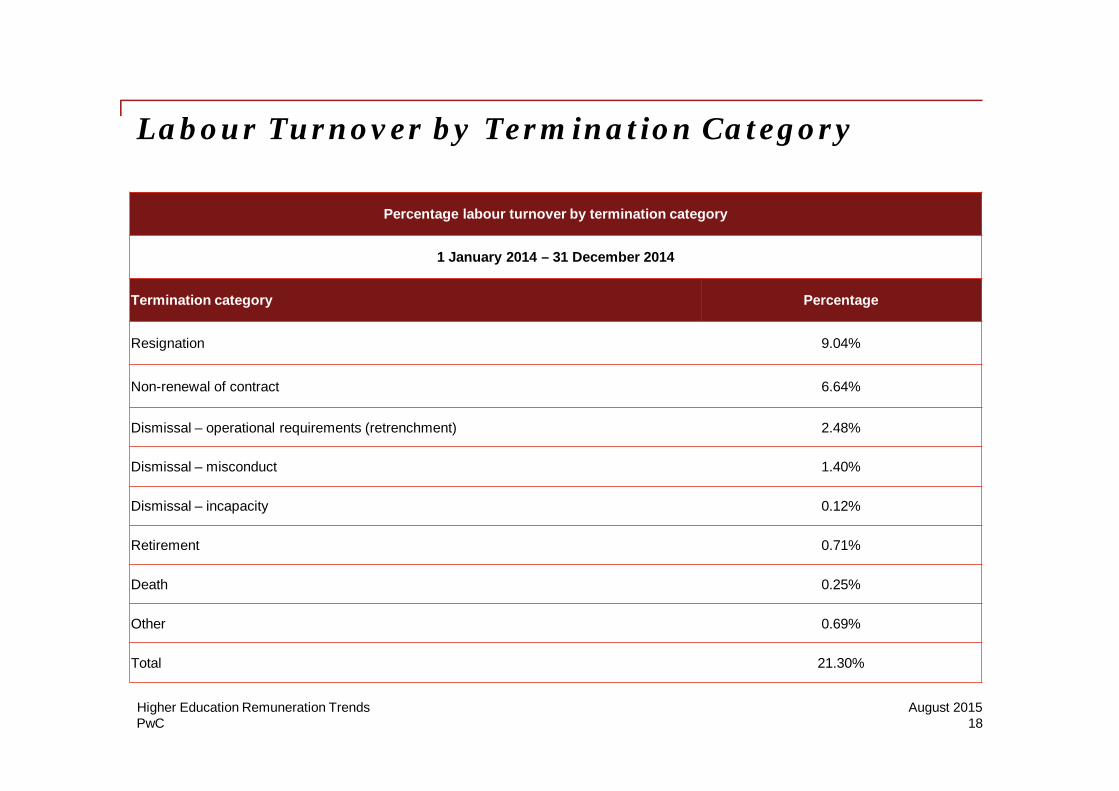
Labour Turnover by Termination Category
Percentage labour turnover by termination category
1 January 2014 – 31 December 2014
Termination category Percentage
Resignation 9.04%
Non-renewal of contract 6.64%
Dismissal – operational requirements (retrenchment) 2.48%
Dismissal – misconduct 1.40%
Dismissal – incapacity 0.12%
Retirement 0.71%
Death 0.25%
Other 0.69%
Total 21.30%
18August 2015Higher Education Remuneration Trends
PwC
Remuneration Package Structures and PayAdjustments
19August 2015Higher Education Remuneration Trends
PwC
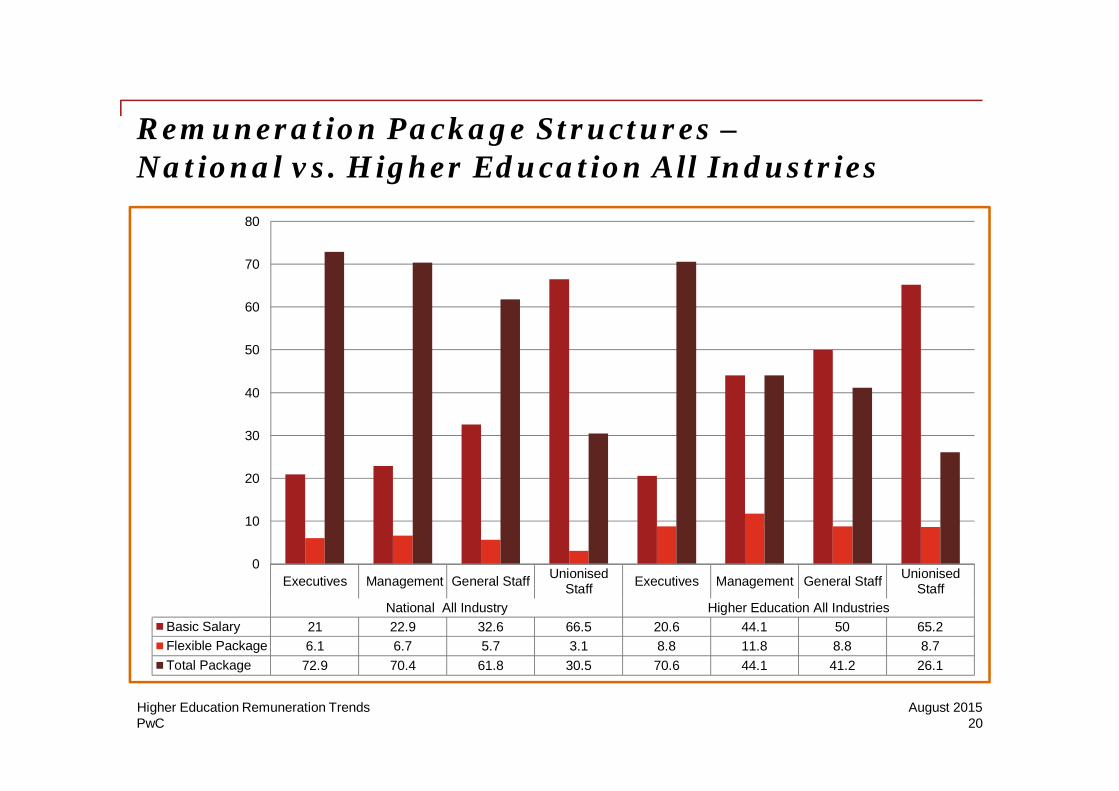
Remuneration Package Structures –National vs. Higher Education All Industries
Executives Management General StaffUnionised
StaffExecutives Management General Staff
UnionisedStaff
National All Industry Higher Education All Industries
Basic Salary 21 22.9 32.6 66.5 20.6 44.1 50 65.2
Flexible Package 6.1 6.7 5.7 3.1 8.8 11.8 8.8 8.7
Total Package 72.9 70.4 61.8 30.5 70.6 44.1 41.2 26.1
0
10
20
30
40
50
60
70
80
20August 2015Higher Education Remuneration Trends
PwC
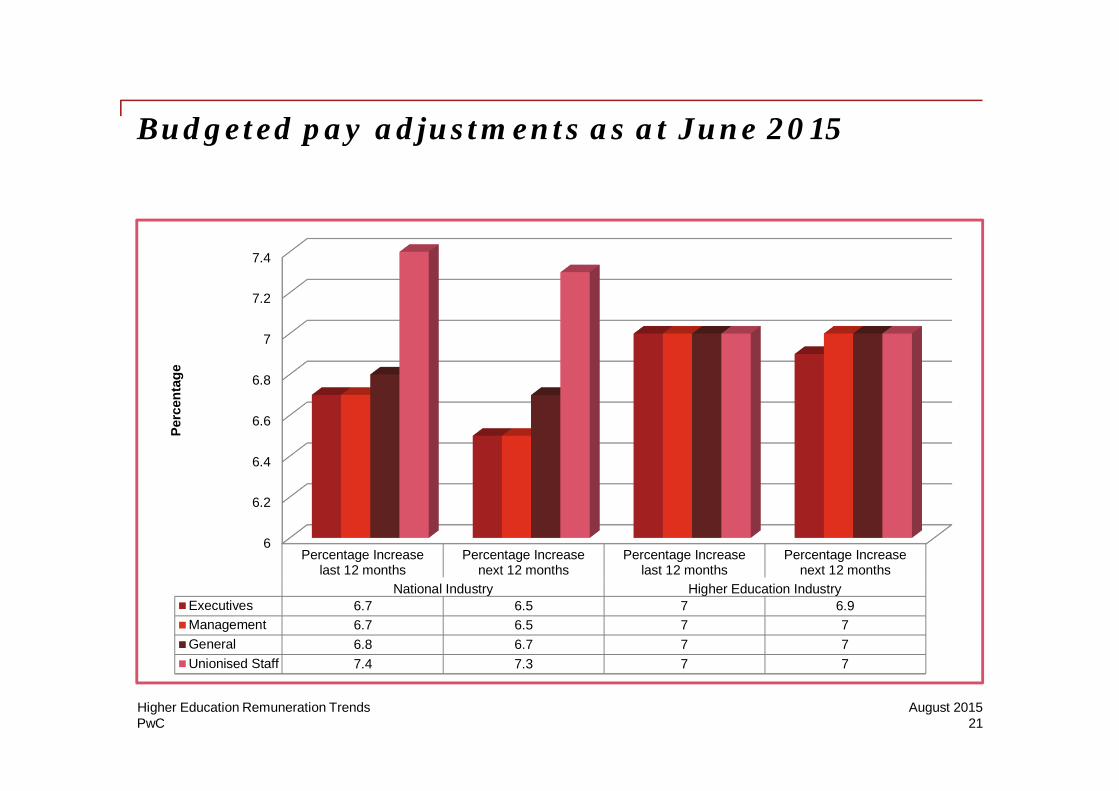
Budgeted pay adjustments as at June 2015
6
6.2
6.4
6.6
6.8
7
7.2
7.4
Percentage Increaselast 12 months
Percentage Increasenext 12 months
Percentage Increaselast 12 months
Percentage Increasenext 12 months
National Industry Higher Education IndustryExecutives 6.7 6.5 7 6.9
Management 6.7 6.5 7 7
General 6.8 6.7 7 7
Unionised Staff 7.4 7.3 7 7
Perc
en
tag
e
21August 2015Higher Education Remuneration Trends
PwC
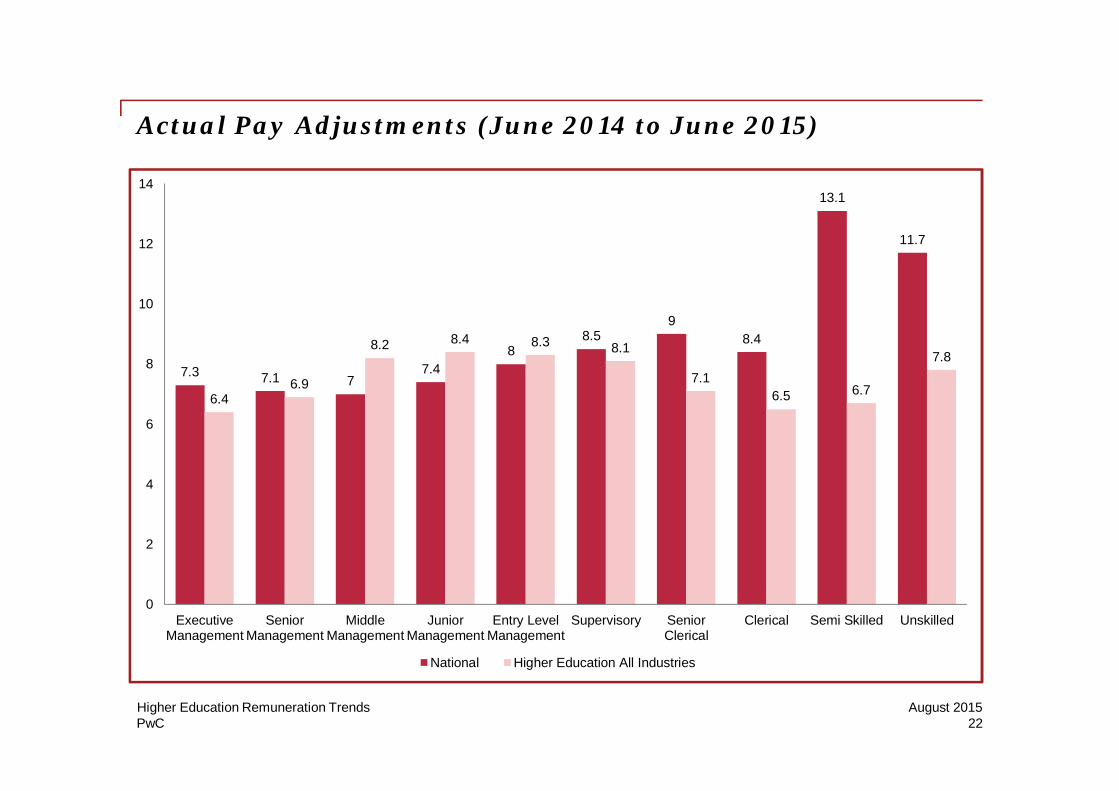
Actual Pay Adjustments (June 2014 to June 2015)
7.3 7.1 77.4
88.5
9
8.4
13.1
11.7
6.46.9
8.2 8.4 8.3 8.1
7.1
6.5 6.7
7.8
0
2
4
6
8
10
12
14
ExecutiveManagement
SeniorManagement
MiddleManagement
JuniorManagement
Entry LevelManagement
Supervisory SeniorClerical
Clerical Semi Skilled Unskilled
National Higher Education All Industries
22August 2015Higher Education Remuneration Trends

PwC
Remuneration Trends
23August 2015Higher Education Remuneration Trends
PwC
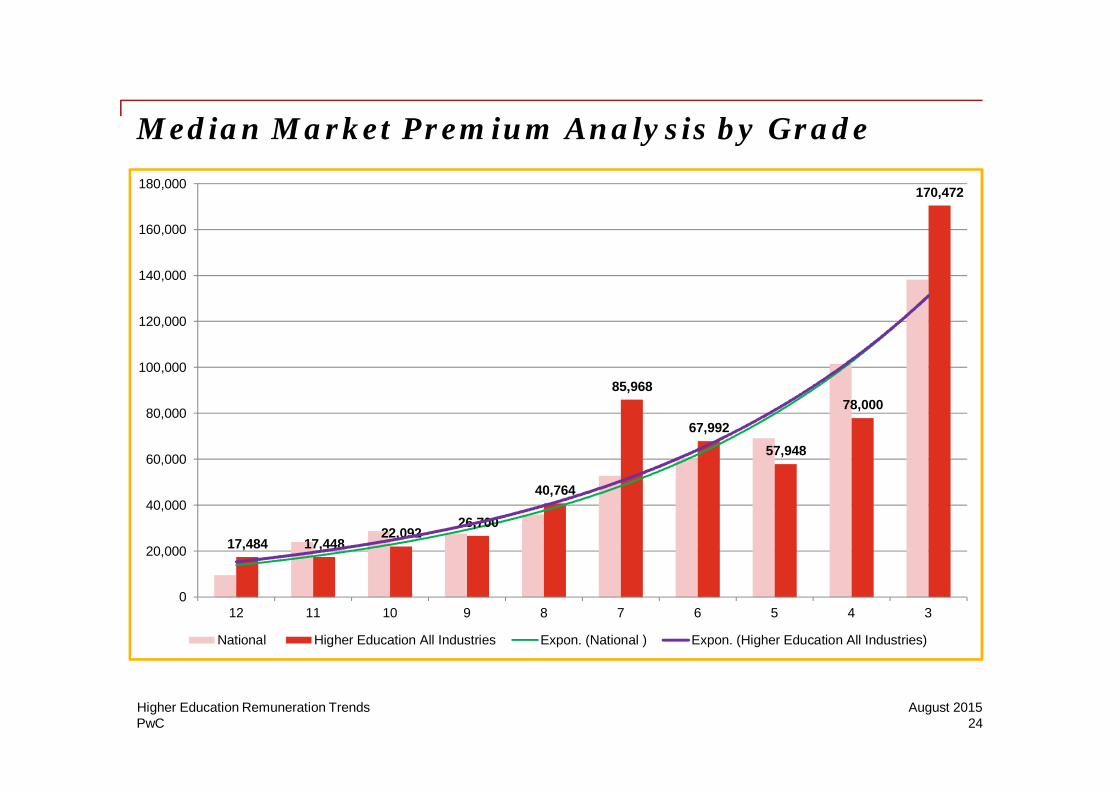
Median Market Premium Analysis by Grade
17,484 17,44822,092
26,700
40,764
85,968
67,992
57,948
78,000
170,472
0
20,000
40,000
60,000
80,000
100,000
120,000
140,000
160,000
180,000
12 11 10 9 8 7 6 5 4 3
National Higher Education All Industries Expon. (National ) Expon. (Higher Education All Industries)
24August 2015Higher Education Remuneration Trends
PwC
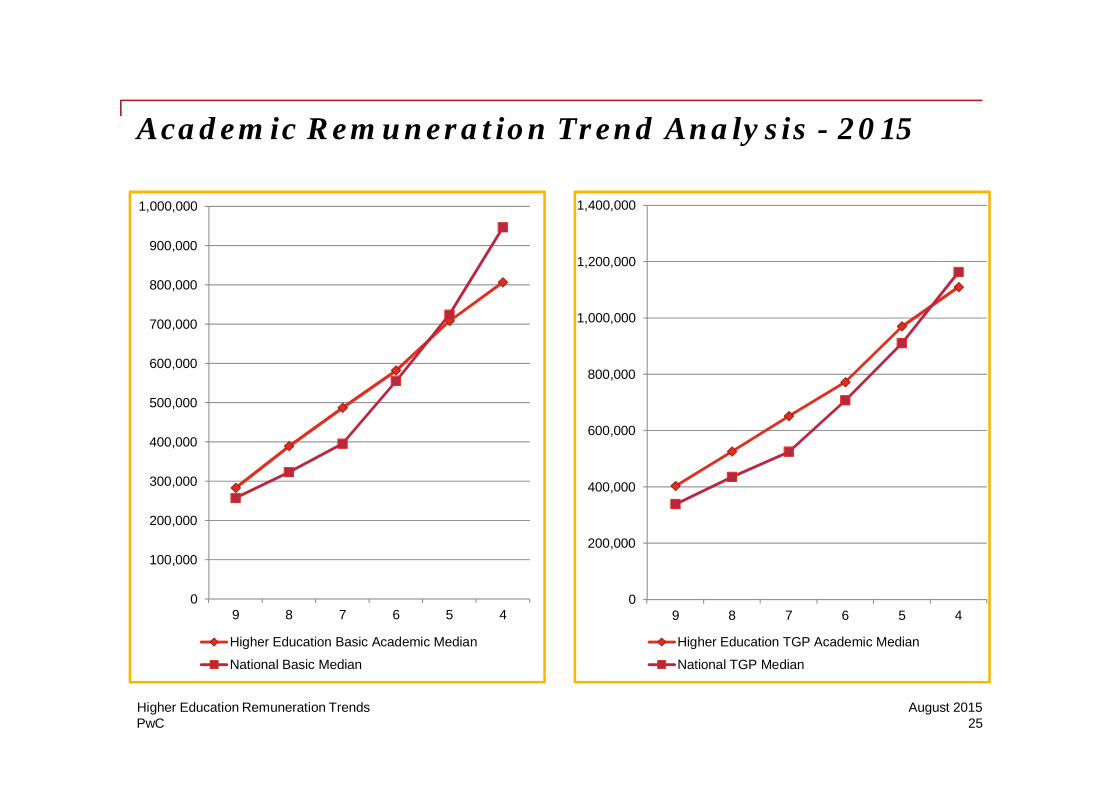
Academic Remuneration Trend Analysis - 2015
0
100,000
200,000
300,000
400,000
500,000
600,000
700,000
800,000
900,000
1,000,000
9 8 7 6 5 4
Higher Education Basic Academic Median
National Basic Median
0
200,000
400,000
600,000
800,000
1,000,000
1,200,000
1,400,000
9 8 7 6 5 4
Higher Education TGP Academic Median
National TGP Median
25August 2015Higher Education Remuneration Trends
PwC
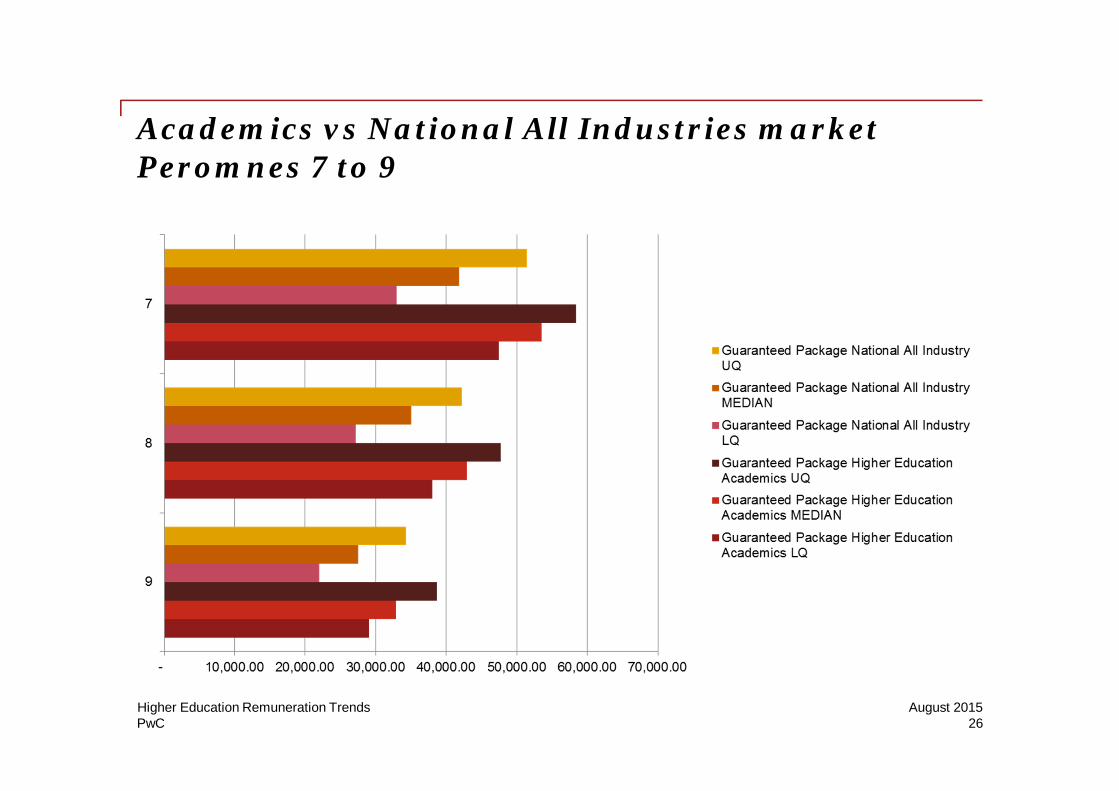
Academics vs National All Industries marketPeromnes 7 to 9
26August 2015Higher Education Remuneration Trends
PwC
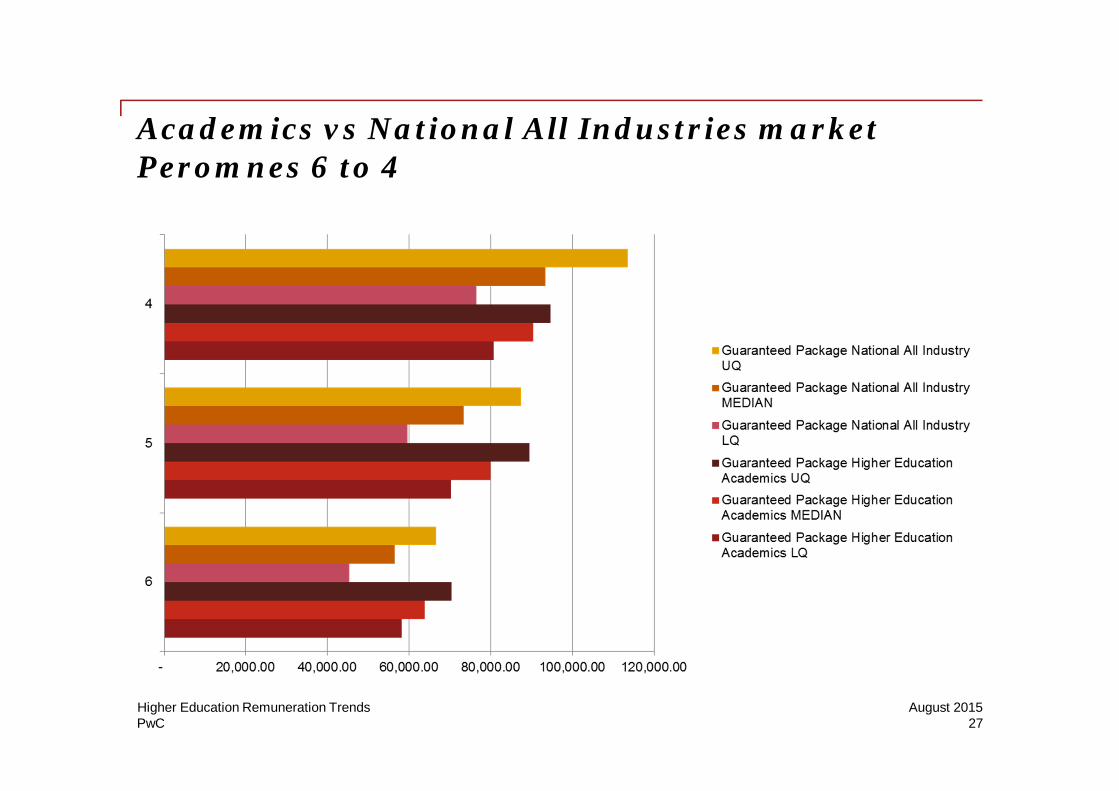
Academics vs National All Industries marketPeromnes 6 to 4
27August 2015Higher Education Remuneration Trends
PwC
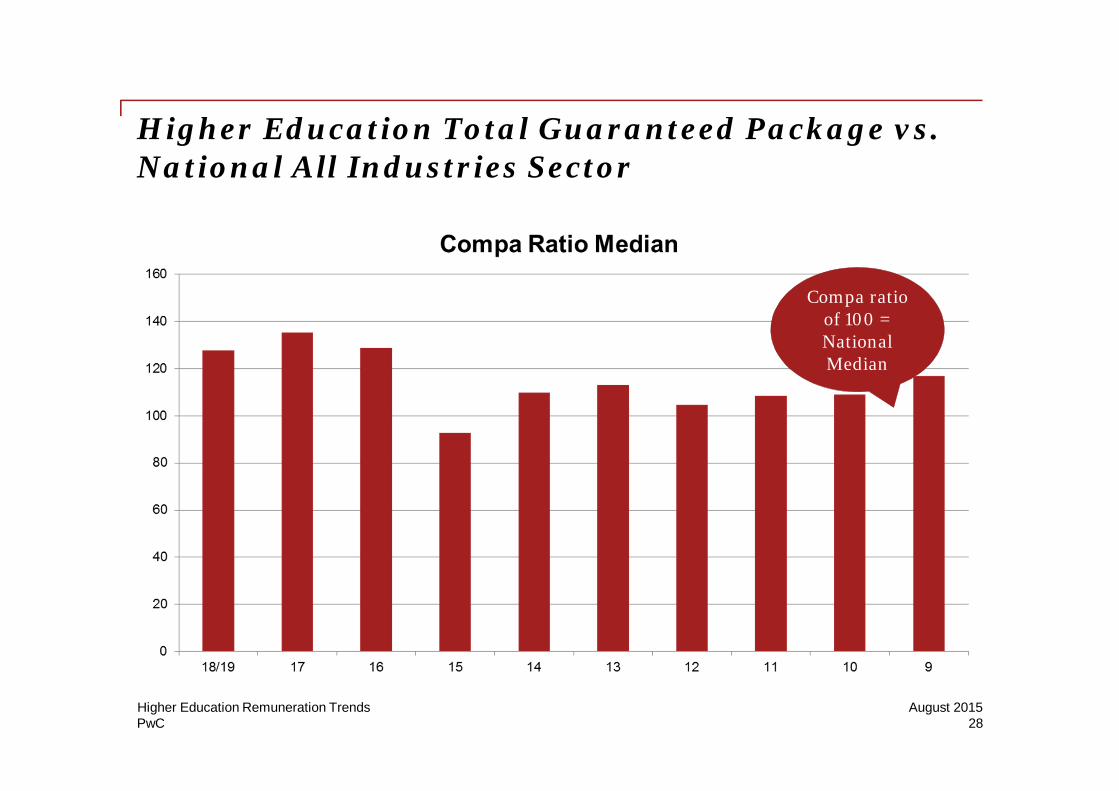
Higher Education Total Guaranteed Package vs.National All Industries Sector
Compa ratioof 100 =NationalMedian
28August 2015Higher Education Remuneration Trends
PwC
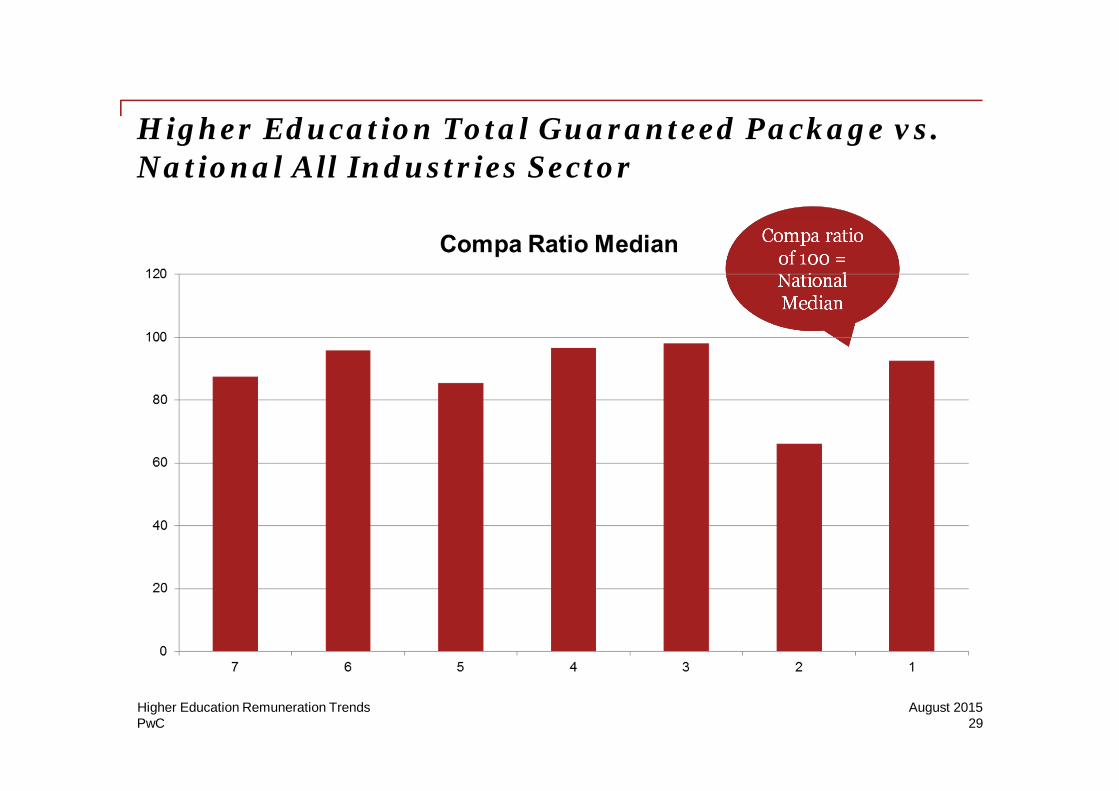
Higher Education Total Guaranteed Package vs.National All Industries Sector
Compa ratioof 100 =NationalMedian
29August 2015Higher Education Remuneration Trends
PwC
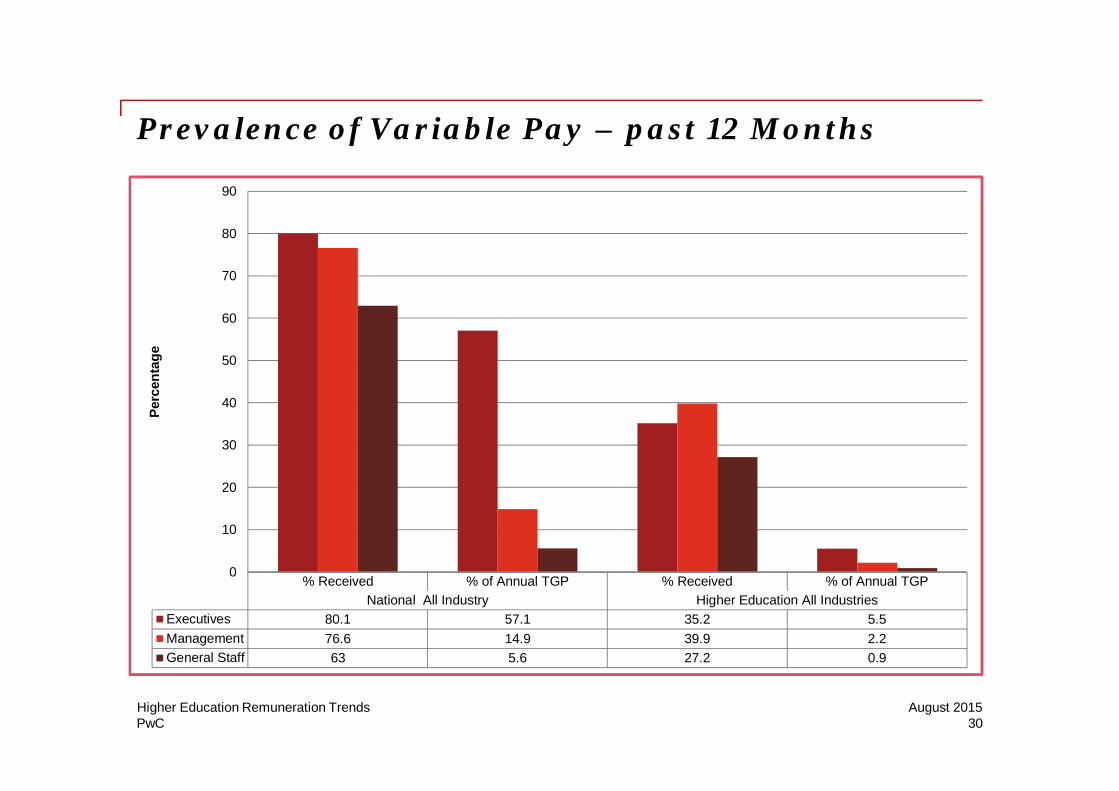
Prevalence of Variable Pay – past 12 Months
% Received % of Annual TGP % Received % of Annual TGP
National All Industry Higher Education All Industries
Executives 80.1 57.1 35.2 5.5
Management 76.6 14.9 39.9 2.2
General Staff 63 5.6 27.2 0.9
0
10
20
30
40
50
60
70
80
90
Perc
en
tag
e
30August 2015Higher Education Remuneration Trends
Your reward challenges?
“The information contained in this publication by PwC is provided for discussion purposes onlyand is intended to provide the reader or his/her entity with general information of interest. Theinformation is supplied on an “as is” basis and has not been compiled to meet the reader’s orhis/her entity’s individual requirements. It is the reader’s responsibility to satisfy him or her thatthe content meets the individual or his/ her entity’s requirements. The information should notbe regarded as professional or legal advice or the official opinion of PwC. No action should betaken on the strength of the information without obtaining professional advice. Although PwCtake all reasonable steps to ensure the quality and accuracy of the information, accuracy is notguaranteed. PwC, shall not be liable for any damage, loss or liability of any nature incurreddirectly or indirectly by whomever and resulting from any cause in connection with theinformation contained herein.”
© PwC Inc. [Registration number 1998/012055/21](“PwC”). All rights reserved. PwC refers tothe South African member firm, and may sometimes refer to the PwC network. Each memberfirm is a separate legal entity. Please see www.pwc.co.za for further details.
René Richter
PwC | Partner/DirectorOffice: +27 (11) 468 2639Mobile: +27 (82) 460 4348Email: [email protected]://www.pwc.com/za