high-throughput tensile testing reveals stochastic
TRANSCRIPT

University of New MexicoUNM Digital Repository
Mechanical Engineering ETDs Engineering ETDs
Spring 4-10-2017
High-Throughput Tensile Testing RevealsStochastic Properties in Additively ManufacturedSteelBradley C. SalzbrennerUniversity of New Mexico
Follow this and additional works at: https://digitalrepository.unm.edu/me_etds
Part of the Mechanical Engineering Commons
This Thesis is brought to you for free and open access by the Engineering ETDs at UNM Digital Repository. It has been accepted for inclusion inMechanical Engineering ETDs by an authorized administrator of UNM Digital Repository. For more information, please contact [email protected].
Recommended CitationSalzbrenner, Bradley C.. "High-Throughput Tensile Testing Reveals Stochastic Properties in Additively Manufactured Steel." (2017).https://digitalrepository.unm.edu/me_etds/125

i
Bradley C. Salzbrenner Candidate
Mechanical Engineering
Department
This thesis is approved, and it is acceptable in quality and form for publication:
Approved by the Thesis Committee:
Dr. Yu-Lin Shen, Chairperson
Dr. Mehran Tehrani, Assistant Professor
Dr. Brad L. Boyce, Distinguished Member of Technical Staff, SNL

ii
High-Throughput Tensile Testing Reveals Stochastic
Properties in Additively Manufactured Steel
by
Bradley C. Salzbrenner
B.S. in Mechanical Engineering, Northern Arizona University, 2010
THESIS
Submitted in Partial Fulfillment of the
Requirements for the Degree of
Master of Science
Mechanical Engineering
The University of New Mexico
Albuquerque, New Mexico
May, 2017

iii
DEDICATION
This thesis is dedicated to my mother and father,
Shirley and Richard Salzbrenner
who taught me the value of hard work and perseverance.
Without your love and support this work would not have been possible.
Thanks for all you have done for me!

iv
Acknowledgements
This study would not have been possible without the dedication and expertise of a
number of individuals. The author would like to thank:
John Laing and Tom Crenshaw for their invaluable assistance with
mechanical testing. Without their expert knowledge of mechanical testing this
study would not have been possible.
Bonnie McKenzie and Amy Allen for their assistance with the scanning
electron microscopy and support.
Alice Kilgo for her expertise and immediate metallographic preparation.
Jeff Rodelas, Bradley Jared, Jonathan Madison for their guidance and
support throughout my graduate studies.
Finally, my committee members and advisors, Dr. Brad Boyce, Dr. Yu-
Lin Shen, and Dr. Mehran Tehrani for their valuable recommendations pertaining
to this study and their assistance in my professional development.
Research was conducted at Sandia National Laboratories. Sandia National Laboratories
is a multi-program laboratory managed and operated by Sandia Corporation, a wholly
owned subsidiary of Lockheed Martin Corporation, for the U.S. Department of Energy’s
National Nuclear Security Administration under contract DE-AC04-94AL85000.

v
High-Throughput Tensile Testing Reveals Stochastic Properties in
Additively Manufactured Steel
by
Bradley C Salzbrenner
B.S. in Mechanical Engineering, May, 2010
M.S. in Mechanical Engineering, May 2017
Abstract
An adage within the Additive Manufacturing (AM) community is that
“complexity is free”. Complicated geometric features that normally drive manufacturing
cost and limit design options are not typically problematic in AM. While geometric
complexity is usually viewed from the perspective of part design, this advantage of AM
also opens up new options in rapid, efficient material property evaluation and
qualification. This Thesis demonstrates how 100’s of miniature tensile bars can be
produced and tested for comparable cost and in comparable time to a few conventional
tensile bars. With this technique, it is possible to evaluate the stochastic nature of
mechanical behavior and capture the statistical nature of mechanical properties. As a
proof of concept, the technique is demonstrated on a precipitation hardened stainless steel
alloy, commonly known as 17-4PH, produced by two commercial AM vendors using a
laser powder bed fusion process, also commonly known as selective laser melting.
Using two different commercial powder bed platforms, the vendors produced material
that exhibited slightly lower strength and markedly lower ductility compared to wrought
sheet. After demonstrating vendor to vendor variability, one vendor was chosen to
produce 1000’s of tensile samples to explore within-build and between-build variability.
Such a large dataset is seldom available in conventional materials evaluation and revealed
rare defects that were only present in ~2% of the population. Worst-case failures were
associated with residual porosity. To address the deleterious effect of porosity, the study

vi
examined a hot isostatic pressing process that collapsed a vast majority of the internal
voids. Lastly, hardness testing which is an alternative high-throughput material
evaluation technique was used to make a comparison between strength values obtained
by tensile tests to those approximated by hardness testing. It is shown that hardness
testing can be an appropriate technique for estimating the strength of wrought 17-4PH,
but has a non-conservative error in strength estimations for AM 17-4PH.

vii
Table of Contents
List of Figures ................................................................................................................... ix
List of Tables .................................................................................................................... xi
Chapter 1 – Introduction ................................................................................................. 1
Why Additive Manufacturing ......................................................................................... 1
Current State of AM........................................................................................................ 3
High Throughput Testing ................................................................................................ 4
Chapter 2 – Test Methods and Materials ....................................................................... 7
Material and Specimen Design ....................................................................................... 7
Tensile Method ............................................................................................................. 12
Chapter 3 – Variability in AM Material ....................................................................... 16
High-Throughput Tensile Observations ....................................................................... 16
Fractographic Observations .......................................................................................... 21
Effect of True Cross-Sectional Area on Strength ......................................................... 25
Importance of Large Data Sets for a Maturing AM Process ........................................ 27
Chapter 4 – 1000 Tensile Tests ...................................................................................... 31
High-Throughput Tensile Observations ....................................................................... 31
Build 6 Anomaly ........................................................................................................... 33
Importance of Large Datasets ....................................................................................... 36
Within-Build and Between-Build Variability ............................................................... 37
Chapter 5 – Hot Isostatic Pressing ................................................................................ 41
viii
Tensile Results .............................................................................................................. 42
Variability Associated with HIP ................................................................................... 45
Chapter 6 – Hardness Mapping..................................................................................... 48
Hardness Indentations ................................................................................................... 49
Correlation Between Hardness and Strength ................................................................ 51
Chapter 7 – Conclusion .................................................................................................. 55
Large Datasets Reveal Anomalous Behavior ............................................................... 56
Size-Dependent Mechanical Behavior .......................................................................... 57
Future Considerations ................................................................................................... 58
Appendix A: Statistical Parameters .............................................................................. 61
References ........................................................................................................................ 62

ix
List of Figures
Figure 1: a) Build array of 120 tensile specimens. b) Printed array of 120 tensile
specimens. c) tensile specimen geometry. .......................................................................... 9
Figure 2: Backscatter electron micrographs of electropolished metallographic cross-
sections showing similarity in microstructure between Vendor 1 and wrought, while
Vendor 2 was markedly different with extensive retained austenite. ............................... 11
Figure 3: Suutala diagram showing Cr/Ni vs phosphorus and sulfur concentrations for
Vendor 1, Vendor 2 and wrought product ........................................................................ 12
Figure 4: a) Model of additive manufactured tensile specimen in grips (cut-away). b)
Mechanical test set-up....................................................................................................... 13
Figure 5: Experimental results of a) varying subset size and b) repeatability of DIC
tracking using a subset of 181 pixels. ............................................................................... 15
Figure 6. A comparison of the stress-strain response of tensile tests from commercially
available wrought sheet (97 nominally identical tests) and two different commercial
additive manufacturing vendors (104 nominally identical tests each). Indicated minimum
properties are for castings and sheet in H900 condition. .................................................. 18
Figure 7. Cumulative probability distributions for the (a) yield strength, (b) ultimate
strength, and (c) strain at failure (elongation). The maximum likelihood estimate for a 3-
parameter Weibull distribution and corresponding 95% confidence bounds are shown for
each dataset. ...................................................................................................................... 20
Figure 8. Secondary electron SEM macrograph comparison of the fracture surface of two
nominally identical Vendor 1 samples that resulted in (a and b) the lowest ductility failure
at 2% strain and (c and d) the highest ductility failure at 12% strain. .............................. 23
Figure 9. Fractography comparing Vendor 1, Vendor 2, and Wrought material at the same
magnification. ................................................................................................................... 24
Figure 10. Cross sections of tensile samples from a) Vendor 1, b) Vendor 2, and c)
Wrought material. The red area shows the maximum cross sectional area and the blue
area shows a corrected cross sectional area using the Rp roughness values. .................... 26
Figure 11. A comparison of the stress-strain response of tensile tests from commercially
available wrought sheet (97 nominally identical tests) and two different commercial
additive manufacturing vendors (104 nominally identical tests each using the corrected
stress area. Indicated minimum properties are for castings and sheet in H900 condition.
........................................................................................................................................... 27
Figure 12. A comparison of the statistical inference from only 5 tests compared to a
larger dataset from an additional 99 tests on the same material condition. Dashed lines

x
show fits from only 5 data points that result in non-conservative estimates of the lower
tail of the distribution. ....................................................................................................... 30
Figure 13: Engineering stress-strain curves from 473 tests associated with four separate
builds. These four builds envelop the range of responses observed across all nine builds
........................................................................................................................................... 32
Figure 14: Cumulative probability distributions for material properties, with color
groupings for each of the nine builds. ............................................................................... 33
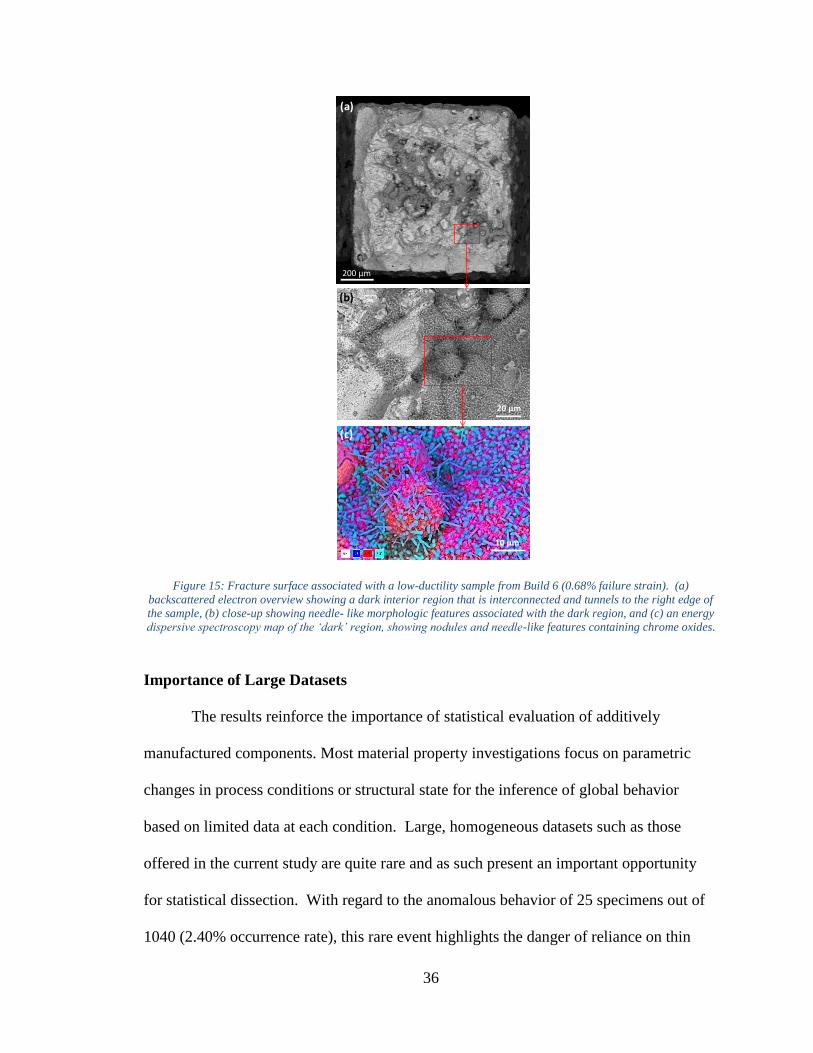
Figure 15: Fracture surface associated with a low-ductility sample from Build 6 (0.68%
failure strain). (a) backscattered electron overview showing a dark interior region that is
interconnected and tunnels to the right edge of the sample, (b) close-up showing needle-
like morphologic features associated with the dark region, and (c) an energy dispersive
spectroscopy map of the ‘dark’ region, showing nodules and needle-like features
containing chrome oxides. ................................................................................................ 36
Figure 16: Ensemble of cumulative probability distributions for ultimate tensile strength,
generated by sampling Weibull parameters from a multi-variate Gaussian distribution.
Red and Magenta lines show bounding cases of Build 2 and Build 4, respectively. ........ 40
Figure 17: Hot isostatic pressing temperature and pressure profile for AM 17-4PH. ...... 41
Figure 18: Cross sections of AM 17-4 material that has been a) untreated and b) HIP
processed. .......................................................................................................................... 42
Figure 19: Engineering stress strain curves of 33 HIP processed (red) and 34 untreated
(blue) AM tensile bars. ..................................................................................................... 43
Figure 20: Cumulative probability distributions for a) Cross-sectional area and b)
Modulus of Elasticity for AM 17-4PH H900 material that has been both HIP processed
and untreated. .................................................................................................................... 44
Figure 21: Fracture surface associated with a) an ‘average’ elongation HIP processed AM
sample and b) a low-elongation (~3%) HIP processed AM sample. ................................ 47
Figure 22: Vickers hardness mapping on a) untreated AM 17-4PH H900, b) HIP
processed AM 17-4PH H900 and, c) wrought 17-4PH H900. ......................................... 50
Figure 23: Vickers hardness indents on additively manufactured 17-4PH H900 sampling
a) a pore which is visible on the surface and b) material close to a large pore or other
defect like a sub-surface pore. .......................................................................................... 51
Figure 24: Cumulative probability distribution of a) ultimate tensile strength and b) yield
strength using data obtained from tensile tests (dark colors) and hardness tests (light
colors). .............................................................................................................................. 53

xi
List of Tables
Table 1: Chemical Composition of 17-4. "NS"=None Specified: ..................................... 9
Table 2: Surface roughness measurements of AM tensile bars from Vendor 1, Vendor 2,
and wrought. ..................................................................................................................... 10
Table 3. Weibull Distribution Parameters for tested 17-4PH H900 ................................. 21

1
Chapter 1 – Introduction
Additive manufacturing (AM), also known as rapid prototyping or 3D printing, is
a process for rapidly building an object layer by layer. This process can involve different
materials like polymers, steels and even ceramics [1, 2] and is best suited for geometries
with features that do not conform to orthonormal structures or shapes. The AM process
of interest in the current study is powder bed fusion, defined in ISO/ASTM 52900 [3].
Variations of powder bed fusion are also known by common names such as Selective
Laser Sintering [4], Direct Metal Laser Sintering [5], Selective Laser Melting [6], and
Electron Beam Melting [7], as well as proprietary names such as Direct Metal Printing
(3D Systems, Inc.) or LaserCUSING (Concept Laser GmbH). In these processes, a
layer of unfused powder is placed on the build tray and locally fused through the directed
application of an external heat source, typically a laser or electron beam. Sequential
layers are built-up and fused together in this layer-by-layer process. The use of a bed of
packed powder distinguishes this process from other common metal AM processes such
as Laser Engineered Net Shaping [8] or Direct Metal Deposition [9] in which the powder
is dynamically injected into the focal point of the laser.
Why Additive Manufacturing
AM can have a profound impact on innovation by decreasing on the time between
concept, design, build and testing and also eliminating the costly and lengthy time spent
machining parts. There are three unique uses of AM: 1) tooling/fixturing, 2) visual
prototypes and mass mocks, and 3) service hardware. The only area of use that requires
good mechanical properties is service hardware.

2
The prototyping phase of any design can take months because of the slow turn-
around of conventional machining practices. Most AM parts can have an automated
price quote, be built in a matter of hours and delivered within one week [10]. However,
the full benefit of this rapid turn-around cycle cannot be fully realized unless all elements
of the design-production-qualification route are streamlined.
The current engineering design paradigm is based on design for manufacture and
ensuring the part/s can be produced by conventional methods (milling, turning, casting,
etc). AM allows this paradigm to be completely inverted by allowing the design to be
based purely on functional requirements. Using design optimization software, engineers
can disregard the restrictions from conventional manufacturing methods and ensure the
functional requirements of the part are fulfilled, like meeting necessary weight and
loading limitations [11]. Not only can design optimization software ensure parts will be
strong enough for a desired application, but it can also have economic implications by
ensuring the minimum amount of material is used for a given part [12]. This extends to
environmental benefits by reducing the amount of waste.
Most small volume production runs using conventional manufacturing methods
are expensive and time consuming. Tool paths need to be defined for CNC machining
and custom molds need to be developed for injection molding. AM requires no expertise
and needs only a computer model to build a part. Whether 1 or 100 parts will be built by
AM, the cost remains approximately the same. In addition to geometric flexibility, the
ability to build an essential component within days is what makes AM so attractive.

3
Current State of AM
AM is currently used in a wide variety of industries including biomedical,
aerospace, automotive and consumer goods. In the biomedical field AM has been
applied to the fabrication of medical implants, tissue scaffolds and surgical models. In
aerospace, Optomec has recently used an AM process called laser engineered net shaping
to create components for jet engines, helicopters and satellites [13]. In the automotive
industry, luxury vehicle manufacturers are using AM to test ergonomics as well as build
functional components like drive shafts and gear box components. These applications
often involve small production runs and complex geometries; parts are generally not used
in high consequence applications due to their inconsistent mechanical performance.
Inconsistency, intrinsic in every manufacturing process, drives the need for
quality control principles [14]. As emerging manufacturing processes mature, they
evolve towards greater efficiency and consistency. While metal additive manufacturing
has been developed over the past several decades, variability continues to be a notable
challenge [15, 16]. Early focus in AM maturation has prioritized achieving the desired
shape of geometric features. However, there is an increasing awareness of variability in
performance metrics beyond form and finish. To combat this variability, most current
high-reliability AM components are developed under the premise of point-based process
qualification. In point-based qualification, all controllable process variables are ‘locked
down’ once functional requirements are satisfied, and the component is qualified only for
those conditions. Any time a single parameter is altered, the process must be re-qualified
which can be a time consuming and costly process. Hence the need for rapid
qualification approaches.

4
Some of the most common defects that arise in metal powder bed additive
manufacturing which give rise to stochastic performance include voids, channels bridging
many layers [17], and partially melted and sintered particles [18]. For laser powder bed
fusion, the type, size, and spatial distribution of defects is dependent on a number of
factors, including: powder chemistry, particle size distribution, printer atmosphere, laser
power, traverse rate, hatch pattern, part thickness, and build orientation [19-22]. Many of
these parameters can vary within a build, between builds, or from vendor to vendor,
leading to a lack of consistency in material performance.
High Throughput Testing
The development of complementary techniques that can rapidly qualify
manufactured parts, either in-process or immediately post-process, is beneficial to
capitalize on the agility of AM [23]. Moreover, these techniques must be capable of
evaluating statistically-relevant populations of properties which vary due to aleatory
process changes, or explore effects of intentional process changes (e.g. combinatorial
studies).
Hardness measurements are quick and easy and are widely used as a first
indication of mechanical properties [24]. This aligns well with the agility of AM but
unlike tensile testing, hardness tests lack the ability to determine critical properties like
toughness and ductility [25]. Surface preparation for hardness testing is crucial [26] to
providing accurate data which adds an extra and time consuming step. Hardness
indentations can also sample porosity that is inherent to current AM parts which would
lead to erroneously low hardness, and therefore, false estimations of strength.

5
An efficient method to destructively evaluate the stochastic material
properties on a build-by-build basis is a necessary element to include within a suite
of in-process and post-process non-destructive and destructive evaluations. Like any
destructive evaluation technique, the tensile test can only be used to infer quality of
adjacent features under the assumption of similitude. For this reason, the tensile test can
complement other diagnostics to develop model-based correlations for reliability.
Conventional tensile testing is costly, time consuming, and not well suited for
obtaining large data sets. To take full advantage of the quick turn-around time inherent to
AM, a new high-throughput tensile testing approach was developed. This new approach
provides an extensive assessment of stochastic variability in mechanical properties. With
this new approach, hundreds of high-fidelity tensile tests can be performed in a similar
time and for similar cost to a few conventional tests.
This thesis demonstrates the high-throughput testing methodology and ensuing
analysis of stochastic mechanical properties in a precipitation hardenable stainless steel,
commonly known as alloy 17-4PH produced by laser powder bed fusion. Precipitation-
hardening stainless steels such as 17-4PH have been developed to provide high toughness
and strength while maintaining the benefit of corrosion resistance [27]. Precipitation-
hardening alloys are particularly amenable to AM because the mechanical properties can
be controlled via post-deposition heat-treatment. While some stainless steel alloys made
by additive manufacturing have been shown to have average properties that can be
comparable to wrought [28] or cast [29] product, generally these previous studies involve
only a few measurements with very limited detail regarding the variability in mechanical
properties.

6
This thesis has five primary objectives: (1) Introduce the reader to the high-
throughput tensile testing methodology that was used to collect the data in chapters 3-5;
(2) demonstrate the efficacy of high-throughput testing to extract statistical distributions
of mechanical properties of nominally-identical material produced by independent
commercial vendors; (3) Identify the defects associated with lower-tail worst-case
performance and statistical outliers; (4) evaluate a standard method of hot isostatic
pressing to help improve material performance by collapsing internal porosity; and (5)
compare material properties to those obtained using an alternative high-throughput
method like hardness indentation.

7
Chapter 2 – Test Methods and Materials
Material and Specimen Design
Tensile specimens were fabricated from precipitation-hardened 17-4PH, also known
as Alloy 630 or AMS 5604 (UNS number S17400). While 17-4PH is the commonly used
name for this alloy in wrought form, similar casting variations include CB7Cu-1 (UNS
J92180) and AMS 5342-5344 (UNS J92200). This alloy was produced from powder
feedstock directly using a powder bed fusion processes at two vendors using different
commercial systems. Vendor 1 utilized a ConceptLaser Mlab printer and Vendor 2
utilized a 3DSystems ProX 300 printer. Both machines employ a laser-based powder
bed fusion process to produce a three-dimensional metallic object. Both vendors
produced net-shaped tensile bars with the tensile axis parallel to the vertical build
direction. This resulted in the individual print layers arranged in a laminate structure
perpendicular to the tensile axis. The layer thickness of parts manufactured by the
Concept Laser Mlab printer was 20m and by the 3DSystems ProX 300 printer was
40m. Aside from the build orientation and specimen geometry, no additional
constraints were placed on the process parameters such as laser power, traverse rate,
powder chemistry, feedstock source, etc. Instead, each vendor utilized their proprietary
expertise to select appropriate conditions that would achieve nominal 17-4PH
components. In this way, the present study is not intended to be a systematic assessment
of process parameter effects on resulting properties, but rather an illustration of the
variation that can be observed when requesting nominally identical manufactured
components. After printing, the AM tensile specimens were solution treated (1037ºC/1
hr/air cool) and subsequently aged to the H900 condition (482ºC/1 hour/air cool). To

8
complement the population of AM tensile bars, geometrically-equivalent tensile
specimens were also electro-discharge machined from 1 mm thick commercially-
produced wrought sheet supplied in Condition A and heat treated to the same nominal
H900 condition. Samples were machined with the tensile axis parallel to the rolling
direction.
The nominal tensile bar geometry is shown in Figure 1. The nominal width and
thickness of the specimen gauge section were both 1mm. The nominal gauge length was
4 mm. The geometry deviates from ASTM E8 standard geometries [30] to eliminate
unprintable horizontal overhang features and facilitate a compact, cost-efficient test
sample volume. The unusual 45-degree wedge-shaped end sections of the rectangular
dog-bone tensile bars not only eliminated overhang issues, but also facilitated self-
alignment in the open-face grips. A layout of 120 tensile samples was recommended to
the vendors as shown in Figure 1. While Vendor 1 produced this exact arrangement
(Figure 1b), Vendor 2 added protective structural sidewalls to prevent the print
wiper/roller from bending the vertical tensile bars. Vendor 1 was able to avoid bending
without the protective barriers, presumably due to differences in the print roller. The
ProX machine utilizes a rigid roller and the MLab machine utilizes a more compliant
wiper.

9
Figure 1: a) Build array of 120 tensile specimens. b) Printed array of 120 tensile specimens. c) tensile specimen
geometry.
The chemical composition of each material was measured by inductively coupled
plasma mass spectroscopy. Light elements including carbon, nitrogen, oxygen, and
sulfur were measured using LECO combustion analysis. Table 1 lists measured
compositions. Industrial alloy specification limits for investment cast and wrought sheet
17-4PH are also included for reference. While the composition was generally consistent
with the 17-4PH alloy, the AM parts exhibited elevated copper, oxygen, and nitrogen.
Table 1: Chemical Composition of 17-4. "NS"=None Specified:
Composition
Carb
on
Man
gane
se
Silicon
Ph
osp
ho
rus
Sulfu
r
Ch
rom
ium
Nicke
l
Nio
biu
m
Co
pp
er
Oxyge
n
Tantalu
m
Alu
min
um
Tin
Nitro
gen
Mo
lybd
en
um
Iron
Wrought Specification AMS5604
0.07 Max.
1.00 Max.
1.00 Max.
0.04 Max.
0.03 Max.
15.00- 17.5
3.00 -
5.00 0.45 Max.
3.00 -
5.00 NS NS NS NS NS 0.05
Max.
Balan
ce
Wrought Sheet 0.042 0.51 0.21 .026 <0.001 15.65 4.67 0.28 3.24 0.0036 0 0 0 0.023 0.28 Cast Specification AMS5344
0.06 Max.
0.70 Max.
0.50 -
1.00 0.025 Max.
0.025 Max.
15.50 -
16.70
3.60 -
4.60
0.15 -
0.40
2.80 -
3.50 NS 0.05
Max. 0.05 Max.
0.02 Max.
0.05 Max. NS
Vendor 1 0.012 0.24 0.38 0.019 0.003 16.64 4.24 0.3 4.05 0.100 0 0 0 0.056 0.045 Vendor 2 0.021 0.46 0.62 .023 0.006 16.51 4.53 0.29 4.08 0.083 0 0 0 0.15 0.17

10
The tensile specimens in this study were produced in the final shape by the AM
process with no post-process machining. Vendor 1 removed loose particles and
improved the surface finish through a bead blasting process whereas Vendor 2 provided
as-printed parts. The surface roughness of the tensile bars was measured using a Bruker
ContourGT-I 3D Optical Microscope and are shown in Table 2. Ra is the average
roughness of the sample and Rp is the distance from the average roughness to the highest
feature over the inspected area (Figure 10). The rough surfaces of the AM material
obscured accurate dimensional measurements and in the case of Vendor 2, appeared to be
the origin of premature tensile failures, as addressed in detail in Chapter 3.
Table 2: Surface roughness measurements of AM tensile bars from Vendor 1, Vendor 2, and wrought.
Ra (µm) (0.1 m) Rp (µm) (0.6 m)
Vendor 1 5.6 36
Vendor 2 18 82
Wrought 0.05 (on as-rolled surface)
2.6 (on EDM surface)
6.6 (on as-rolled surface)
33 (on EDM surface)
Figure 2 shows representative backscatter electron micrographs of electropolished
17-4PH wrought sheet and AM material produced by Vendors 1 and 2. The wrought
sheet microstructure (Figure 2c) heat-treated to the H900 condition shows a matrix of lath
martensite with uniformly distributed equiaxed particles that appear bright in the image.
These particles are associated with the MC-type Nb carbides expected in heat treated 17-
4PH [31-33]. The as-heat-treated AM microstructures from both vendors (Figure 2a and
b) show predominantly martensitic microstructures with similar dispersed submicron Nb-
rich second phase as observed in the wrought material. The backscatter electron
micrographs of both AM microstructures are largely devoid of solidification substructure
due to the diffusional and martensitic transformations following solidification plus the

11
additional phase transformations occurring during the solution treating and age heat
treatment thermal cycles. The microstructure of Vendor 2 (Figure 2b), shows grains
without any intragranular contrast formation associated with lath martensite—these
grains are denoted with arrows. These regions were identified using electron backscatter
diffraction as austenite retained after heat treatment. X-ray diffraction indicated ~30%
volume fraction of retained austenite in the Vendor 2 microstructure, consistent with
prior reports of retained austenite present in AM 17-4PH by [34], [28], and [35]. The
austenite phase is a lower strength phase that does not gain strength during an aging heat
treatment.
Figure 2: Backscatter electron micrographs of electropolished metallographic cross-sections showing similarity in
microstructure between Vendor 1 and wrought, while Vendor 2 was markedly different with extensive retained
austenite.

12
The origin for the large fraction of retained austenite in Vendor 2 material is
attributed in part to elevated nitrogen content (0.15 wt %). The Suutala diagram shown
in Figure 3 is commonly used in welding metallurgy to predict solidification modes. The
chrome/nickel ratio versus the phosphorus and sulfur concentration of Vendor 1 and
wrought product places the material in the primary ferrite solidification mode, whereas
the ratios of Vendor 2 place the material in the primary austenite solidification mode. A
prior study on AM 17-4PH by [34], explored the role of the atmosphere during gas
atomization process on subsequent phase formation. They showed that gas atomization
in a nitrogen atmosphere promoted austenite formation.
Figure 3: Suutala diagram showing Cr/Ni vs phosphorus and sulfur concentrations for Vendor 1, Vendor 2 and
wrought product
Tensile Method
A high-throughput test protocol was developed to evaluate the tensile properties
of the AM structures. In lieu of hydraulic- or screw-clamped grips, open face “drop-in”

13
grips were custom manufactured to facilitate rapid sample loading and unloading. Figure
4 shows a cutaway of the grips with a tensile sample loaded.
Figure 4: a) Model of additive manufactured tensile specimen in grips (cut-away). b) Mechanical test set-up.
Mechanical tests were performed using an MTS servo-hydraulic load frame and
an Interface 445N load cell. For all tests, the actuator displacement rate was 0.05 mm/s,
resulting in a gauge section strain rate of ~4x10⁻⁴ s-1. Strain measurement was performed
by real-time non-contact Digital Image Correlation (DIC) using the commercial software
VIC-Gauge, by Correlated Solutions, Inc. Unlike conventional DIC analysis where
strain values are computed by post-processing of raw images, the VIC-Gauge approach
produces real-time strain measurements at camera refresh rates. In the current study,
these strain measurements were acquired at 30 Hz or faster. The native surface
roughness of the test samples provided sufficient speckle contrast for DIC analysis. The
DIC setup consisted of a high-quality camera lens as well as a high bit-depth camera (4.1

14
mega-pixel, 10-bit) which has been shown to reduce image noise and increase speckle
contrast [36]. The strain values were transferred from the VIC-Gauge software into the
MTS data acquisition software using A/D and D/A converters. An MTS automation
procedure was written to streamline sample engagement, preloading, testing, and sample
recovery. A Matlab code was developed to process all of the raw data and calculate
stress/strain response curves as well as 0.2% offset yield strength, ultimate tensile
strength, uniform elongation, and strain to failure. Minitab 17 was used to generate
statistical distribution graphs and JMP statistical analysis software was used to estimate
distribution parameters using a maximum log-likelihood methodology.
Previous research has shown that the accuracy of DIC can be affected by factors
such as subset size, subset shape, interpolation scheme, and sub-pixel intensity [36-38].
Perhaps the most important factor affecting DIC accuracy is the subset size [36].
Previous research has shown that a subset size must be large enough to contain a distinct
speckle pattern separate from other subsets, yet small enough to be accurately
approximated by first or second-order subset shape functions and must not capture
phenomena like necking in the gauge section [36]. The use of 2D vs 3D DIC has also
been shown to have an effect on the accuracy of strain measurements in samples that
experience large amounts of out-of-plane deformation [39]. The material tested in this
study experiences low reduction in area [40] and thus small levels of out-of-plane
deformation.
To examine the effect of subset size on DIC, a wrought tensile sample was loaded
to ~60% of its yield strength (900N) then unloaded to ~2N, repeatedly using different
subset sizes. Using the unloading portion of this test, a linear regression was performed

15
on the stress-strain curve to extract a modulus. Results of this test can be seen in Figure
5a. Using a very small subset size compared to speckle size created large noise in strain
and even caused a loss of tracking. Using a very large subset size reduced strain noise
and eliminated loss of tracking. For these experiments, a subset size of 0.52 0.52 mm
(181181 pixels, ½ of the gauge width) was chosen, resulting in a measured strain noise
floor of 7.2210-4 (1 SD).
Figure 5: Experimental results of a) varying subset size and b) repeatability of DIC tracking using a subset of 181
pixels.
With any new testing methodology, it is important to ensure accurate and
repeatable data is being obtained. To examine the repeatability of this setup a wrought
sample was placed in the grips and loaded to ~60% of yield strength (900N) and
unloaded to ~2N all while DIC was tracking the strain. The loading was repeated 10
times at the same displacement rate as that of the tensile tests; 0.05mm/sec. A linear
regression was performed on the stress-strain curve to extract a modulus. Results of this
experiment are shown in Figure 5b. The average modulus was 249.5 MPa +/- 2 MPa
(1SD).

16
Chapter 3 – Variability in AM Material
In this chapter, the stochastic tensile response is evaluated for products produced
by two commercial AM vendors. The focus of this chapter is to examine the variability
within-vendor and between-vendor and how AM material compares to wrought product.
The value of large datasets is also demonstrated in this chapter.
High-Throughput Tensile Observations
Figure 6 compares the tensile stress-strain behavior of AM 17-4PH from two
different vendors to that of conventional wrought sheet. In all three cases, the tensile
sample size/geometry was nominally identical and a similar statistical population of size
N=97-104 was sampled. The stress values in Figure 6 were calculated by dividing the
applied force by an average cross-sectional area, as measured using contact-based
micrometers. The bias caused by these contact-based measurements on the rough AM
surfaces is further analyzed later in this chapter. Both of the AM vendors produced 17-
4PH material that exhibited lower strength and ductility than wrought sheet in the same
specimen form factor. However, since AM involves melting and re-solidification, a more
fair assessment may be to compare against the properties of castings. While the tensile
behavior of casting-equivalent 17-4 alloys was not measured in the current study, there are
minimum allowable properties established in standards such as AMS 5344. The minimum
allowable values are meant to set lower bound expectations for reliable engineering
design, and are not typical properties. Dashed lines in Figure 6 indicate these AMS 5344
minimum allowable properties for both cast and wrought material. Vendor 1 produced
samples with higher ultimate strength and on average, larger strain to failure than that of
17
Vendor 2. Roughly half of the samples produced by Vendor 1 satisfied the minimum
allowable values for the ultimate strength and elongation for castings. None of the tensile
bars produced by Vendor 2 satisfied the minimum property requirements for cast or
wrought product.
Previous research by Rafi, et al. measured the tensile behavior of 17-4PH H900
produced by the laser powder bed fusion process (described as selective laser melting in
that article) using a commercial EOS M270 machine, notably distinct from the two
commercial systems used in the present study [41]. They reported a yield strength,
ultimate tensile strength, and elongation for the H900 condition as 1126 MPa, 1457 MPa,
and 12% based on 3 replicate tests. That reported yield strength is quite comparable to the
characteristic value for the yield strength measured in the current study for material
produced by Vendor 1 (1117 MPa), although the characteristic values for ultimate tensile
strength and elongation of Vendor 1 material were somewhat lower (1239 MPa and 7%,
respectively). Yadollahi, et al. also measured the tensile behavior of 17-4PH H900
produced by the laser powder bed process, using a ProX 100 printer similar to the
printer used by Vendor 2 [42]. The yield strength, ultimate strength and elongation values
reported for the H900 condition were reported as 700 MPa, 950 MPa, and 3%
respectively. This previously reported elongation value was comparable to those
measured for the Vendor 2 material; however, the strength values for Vendor 2 material
were considerably higher than the previous Yadollahi study.

18
Figure 6. A comparison of the stress-strain response of tensile tests from commercially available wrought sheet (97
nominally identical tests) and two different commercial additive manufacturing vendors (104 nominally identical tests
each). Indicated minimum properties are for castings and sheet in H900 condition.
Empirical cumulative probability distributions for the yield strength, ultimate
tensile strength, and elongation were determined using a 3-parameter Weibull
distribution, as shown in Figure 7. The axes are not linear, but are instead constructed
such that a 2-parameter Weibull distribution [43] would appear as a straight line. The
remnant curvature of the empirical datasets is caused by deviation from the 2-parameter
form of the Weibull distribution, as would be expected for a 3-parameter Weibull
distribution with a non-zero threshold parameter [44]. The American Society for Testing
and Materials, standard C1683, defines how the Weibull distribution can be used to

19
describe the stochastic tensile strength of brittle materials [45]. The Weibull distribution
has also been used to describe statistical variation in properties of structural metals
including the ultimate tensile strength as described by [46, 47]; fracture toughness as
described by [48], and [49]; and elongation as described by [50]. While a 2-parameter
variation of the Weibull distribution is most commonly used, the original distribution is a
3-parameter distribution. The accurate determination of the 3rd parameter, a threshold
value below which there is zero probability of occurrence, typically requires large
datasets as described by [44]; in the absence of sufficient data, this 3rd parameter is
typically set to zero. For the current dataset, the Weibull distribution yielded a superior
goodness-of-fit compared to a Gaussian distribution based on an Anderson-Darling
metric. The 3-parameter Weibull cumulative distribution function can be described in
Equation 1 as follows:
𝑃 = 1 − 𝑒[−(
(𝛼−𝛾)
(𝜂−𝛾))
𝛽] (1)
where the cumulative probability of failure P is a function of the variable α and three
parameters; β, η and γ. The Weibull modulus β is the shape parameter that generally
describes the breadth, η is the scale parameter or characteristic value, and γ is the
location parameter or threshold below which the probability is zero. This third threshold
parameter has both physical meaning and engineering value as it suggests that the tail of
material property distributions do not asymptote to zero, but that there is some positive
lower bound for the material properties. The parameter estimates for each of the datasets
are shown in Table 3. From the graphs and this accompanying table, several general
trends are clear. Most importantly, while the wrought material demonstrated better
characteristic performance in yield strength, ultimate strength, and elongation, it also

20
benefited from substantially less scatter. Moreover, both AM vendors produced material
with significantly lower threshold values (yield strength, ultimate strength, and
elongation) compared to the wrought material.
Figure 7. Cumulative probability distributions for the (a) yield strength, (b) ultimate strength, and (c) strain at failure
(elongation). The maximum likelihood estimate for a 3-parameter Weibull distribution and corresponding 95%
confidence bounds are shown for each dataset.

21
Table 3. Weibull Distribution Parameters for tested 17-4PH H900
Property Source Number
of Tests
Shape Parameter
(Weibull
Modulus)
Scale Parameter
(Characteristic
Strength)
Location
Parameter
(Threshold Value)
N β η-γ γ
Yield Strength,
MPa
Vendor 1 104 4.4 1117 1005
Vendor 2 104 1.9 932 884
Wrought 97 2.5 1393 1359
Ultimate Tensile
Strength, MPa
Vendor 1 104 2.2 1239 1198
Vendor 2 104 63* 1034* 0*
Wrought 97 1.7 1454 1443
Elongation, %
Vendor 1 104 2.4 7.0 2.0
Vendor 2 104 2.8 2.6 0.6
Wrought 97 78* 24.9* 0*
*These values were obtained from a 2-parameter fit because the location parameter could not be
uniquely determined, as discussed in Section 4.
Fractographic Observations
Large statistical datasets offer the ability to identify atypical failure modes.
Through the use of fractography, it is often possible to diagnose sources of poor fracture
resistance. Figure 8 compares the fracture surface of the lowest ductility test (2%
elongation) from Vendor 1 to the highest ductility test (12% elongation) from the same
vendor. The 2% elongation in Figure 8a and b shows extensive lack-of-fusion voids and
unmelted/partially melted particles present within some of the larger voids in the center
of the fracture surface. The largest voids were >200 m in width and the combined voids
occupied ~20% of the reduced cross-section. The outer edges of the fracture surface
contain a pronounced shear lip. A large interlayer cliff indicated a link-up of mode-I

22
crack planes from one print layer to another. By comparison, the fracture surface in
Figure 8c and d from the highest elongation test shows only very small voids, with the
largest void ~25 m and occupying <5% of the reduced cross-section.
In addition to comparing two different specimens from the same population,
fractography also is valuable in comparing the failure modes between the three sources of
material. Macro fractographs shown in Figure 9 compare the fracture surfaces of the
Vendor 1, Vendor 2, and wrought sheet material. The fractographs in Figure 9 are
presented at the same magnification. While all three samples started out with similar
cross-sectional areas, the final size of the fracture surface for the wrought material
(Figure 9c) is much smaller than the wrought samples due to the extensive necking
ductility. Vendor 1 and 2 samples exhibited, on average, 14% and 10% reduction in area,
respectively, while the wrought samples exhibited, on average, 70% reduction in area.
The wrought fracture surface had a characteristic flat ‘fibrous’ central zone with large (5
m) equiaxed dimples and numerous secondary cracks running perpendicular to the
fracture surface. A symmetric shear lip was present around the entire perimeter.
Example fracture surfaces from prior studies, such as those provided in the fractographic
handbook from the IIT Research Institute, [51] confirm that these features are commonly
observed in 17-4PH and other similar precipitation hardened stainless steels. In contrast,
the Vendor 1 tensile samples (Figure 9a and Figure 8a) exhibited large >100 m zones of
lack-of-fusion voids in the central ‘flat fracture’ zone, and large peripheral shear lips.
The Vendor 2 sample (Figure 9b) also had voids, although they were considerably
smaller <100 m and appeared to occupy a smaller fraction (<5%) of the reduced cross
section. The Vendor 2 sample had a shear lip that was notably smaller than the Vendor 1

23
shear lip, indicating a higher strength/ lower ductility response. However, the stress-
strain curves in Figure 6 show Vendor 2 to have a lower strength than Vendor 1, as is
further discussed in Section 4. Unlike Vendor 1 where the exterior surfaces were
reasonably smooth, there was extensive penetrating voids from the rough exterior
surfaces in the Vendor 2 image. These notch-like penetrating voids appeared to provide
the stress concentrating feature that drove premature failure.
Figure 8. Secondary electron SEM macrograph comparison of the fracture surface of two nominally identical Vendor 1
samples that resulted in (a and b) the lowest ductility failure at 2% strain and (c and d) the highest ductility failure at
12% strain.

24
Figure 9. Fractography comparing Vendor 1, Vendor 2, and Wrought material at the same magnification.
This study on the stochastic tensile performance of additively manufactured 17-
4PH raises a number of interesting questions. The next sections focus on addressing
topics which are central to the theme of the high-throughput modality. Firstly, while a
detailed microstructural analysis of the causes of property difference is beyond the scope
of this work, emphasis is placed on the first-order effect of properly accounting for the
load-bearing cross-sectional area in tensile measurements. This awareness of the effect
a) Vendor 1 sample F10
b) Vendor 2 sample G10-1
c) Wrought sample E4
500 µm

25
of surface roughness on measured properties leads to a discussion of the expected size
effects (see Chapter 7) and the realization that with AM processes it is difficult to
deconvolute the intrinsic material properties from the extrinsic features caused by the
manufacturing process. Finally, a brief analysis and commentary is made regarding the
relative immaturity of the AM process and the need to adopt efficient stochastic methods
to avoid non-conservative interpretations that could arise from limited datasets. Chapter
7 discusses potential follow-up studies that could be pursued as a result of this initial
effort to unravel the stochastic reliability issues in more detail.
Effect of True Cross-Sectional Area on Strength
The engineering stress values presented in the Results section employ the
standard engineering practice of measuring tensile bar dimensions with contact-based
instruments such as calipers or micrometers. Specifically, for each tensile test the
engineering stress 𝑒𝑛𝑔 was calculated as a function of the applied force 𝐹, divided by
the product of average width �̅� and thickness 𝑡̅ as measured by contact gauges:
𝑒𝑛𝑔 =𝐹
�̅�∗�̅� (2)
While these measurement techniques work well for most engineering materials, in the
current additively manufactured materials the excessive roughness relative to the sample
dimensions causes a substantial discrepancy between this apparent stress area and the net
area that carries mechanical load.
To approximately correct for the reduced cross-section due to roughness, the
width and thickness were both reduced by the average peak roughness 𝑅𝑝̅̅̅̅ :

26
𝜎𝑐𝑜𝑟𝑟𝑒𝑐𝑡𝑒𝑑 =𝐹
(�̅�−2𝑅𝑝̅̅ ̅̅ )∗(�̅�−2𝑅𝑝̅̅ ̅̅ ) (3)
An illustration of the difference between the apparent stress area and the net/corrected
stress area is shown in Figure 10.
Figure 10. Cross sections of tensile samples from a) Vendor 1, b) Vendor 2, and c) Wrought material. The red area
shows the maximum cross sectional area and the blue area shows a corrected cross sectional area using the Rp
roughness values.
Figure 11 compares the tensile stress-strain behavior of the three sources of
material, this time using the corrected stress area. With this corrected stress area, both
AM material sources satisfy the minimum UTS requirements for cast product. However,
even with the correction for net area, the strength properties were still lower than that of
wrought sheet. The observation of depressed yield strength of Vendor 2 material relative
to Vendor 1 and wrought sheet is expected to be at least partially attributed to the
presence of retained austenite, as described in Chapter 2. A secondary factor is the likely
possibility that the notch-like stress concentrations associated with the surface roughness
triggers premature plasticity. While this first-order analysis accounted for the reduced
cross-sectional area associated with surface roughness, a more detailed notch-effect study

27
is necessary to understand the role of these stress-concentrating features on promoting
early plasticity and premature failure.
Figure 11. A comparison of the stress-strain response of tensile tests from commercially available wrought sheet (97
nominally identical tests) and two different commercial additive manufacturing vendors (104 nominally identical tests
each using the corrected stress area. Indicated minimum properties are for castings and sheet in H900 condition.
Importance of Large Data Sets for a Maturing AM Process
The AM material showed marked reduction in uniaxial tensile properties
compared to the wrought sheet. However, not only were average properties inferior, but
the AM material exhibited substantially more variability for yield strength, ultimate
strength, and elongation to failure compared to the wrought sheet. The substantial defect
population and associated effect in increasing variability (e.g. 80% variability in
elongation among 104 tests) in performance highlights an opportunity for further process

28
and feedstock improvement. Moreover, it is currently ill-advised to use specification
minimum values of non-AM material as the basis for component design that will be
fabricated using AM. Instead it is necessary to perform a detailed stochastic property
evaluation for the particular vendor and process parameters to establish representative
property minimums.
The key differentiating feature of the current study was the ability to collect a
relatively large statistical sample with a comparable level of effort as a few conventional
tests. Small populations may be reasonable for mature, comparatively more homogenous
materials that result from established thermomechanical processing routes, e.g., wrought
sheet, in which defect-dominated behavior is not expected. However, small test
populations may be inappropriate for materials produced by less mature processes such as
laser powder bed fusion that result in less controlled defect populations. When working
with small data sets, a statistical analysis would typically employ the Normal (Gaussian)
distribution. For comparison, in Figure 12 the first 5 tests are plotted using a Gaussian
distribution (fits shown in dashed lines) against the population of 104 tests using the
Weibull 3-parameter distribution (fits shown in solid lines). Only the elongation
distribution is shown because it has the most obvious shift in shape, scale and threshold
for the AM parts, however, this clear shift can also be seen in the yield strength and
ultimate strength. No obvious shift was observed in the probability distribution for the
wrought material when analyzing 5 tests versus the population. This shows that 5 tests
are truly insufficient to calibrate a Weibull 3-parameter model for AM materials.
As noted in Table 3, there are two datasets that have a zero value threshold and
used a 2-parameter Weibull distribution. For these two datasets, there is insufficient data

29
to uniquely determine all three parameters. The threshold and scale parameter are
strongly correlated for these datasets, and therefore it is not possible to determine them
independently. For this reason, statistical goodness-of-fit metrics do not clearly show a
benefit to the use of the 3-parameter Weibull over the 2-parameter Weibull. While the 2-
parameter distribution is statistically defendable, the notion of a zero-valued threshold is
physically unrealistic. Instead, these two datasets appear to require additional tests to
uniquely determine all three parameters (or to select a better alternative distribution
model altogether).
The probability distributions in Figure 7 suggest that the Weibull distribution
reasonably captures the observed property distributions. However, in some cases the
lower tail of experimental data seems to trail off from the expected distribution. These
outlying data points in elongation and ultimate tensile strength could be caused by a
bimodal distribution of properties, however even more tests would be necessary to
differentiate the overlapping distributions.

30
Figure 12. A comparison of the statistical inference from only 5 tests compared to a larger dataset from an additional
99 tests on the same material condition. Dashed lines show fits from only 5 data points that result in non-conservative
estimates of the lower tail of the distribution.

31
Chapter 4 – 1000 Tensile Tests
In this chapter, Vendor 1 (from chapter 3) was selected to produce 9 tensile arrays of 120
samples as described in chapter 2 (Figure 1b). Vendor 1 was chosen for one major
reason: The tensile samples produced by Vendor 1 were far superior to those produced
by vendor 2 both in terms of visual appearance and mechanical performance.
This chapter dives deeper into the importance of large data sets that can only be
obtained by high throughput tensile testing. Within-build and between-build variability is
discussed as well as rare defects that are only present in ~2% of the population.
High-Throughput Tensile Observations
While a total of 1080 tensile bars had been originally produced, 15 samples were
removed from the population prior to testing for metallographic analysis. No samples or
tests were censored as ‘outliers’; all available test data was included in this analysis. The
dataset for 1065 nominally identical tensile tests, including sequential images for digital
image correlation strain analysis, was quite large: totaling approximately 1 TB.
Visualizing salient features of that dataset requires reducing the dimensionality of the
data. Even presenting the whole dataset as individual stress-strain curves is problematic
since there is considerable overlap among the curves. Instead, a representative subset of
the stress-strain curves is shown in Figure 13. While tests from only four of the nine
builds are displayed in this graph, these four encompass the breadth of responses from all
nine builds. In the figure, truncated vertical lines were used to emphasize the total strain
at failure for each test. A partial unload at 2% strain provided a more accurate

32
determination of the elastic modulus. Across this large dataset of nominally identical
tensile tests, there was a substantial variation in the mechanical behavior.
Figure 13: Engineering stress-strain curves from 473 tests associated with four separate builds. These four builds
envelop the range of responses observed across all nine builds
The coloration in Figure 13 clearly suggests that there was systematic variation
from build-to-build. In prior studies of laser powder bed fusion, variation in tensile
properties from build-to-build had been previously inferred [52], yet the trends based on
those much smaller datasets were statistically insignificant. To explore these statistical
trends for the entire set of nine builds, the raw dataset was further reduced. A Matlab
algorithm extracted relevant tensile properties such as yield strength, ultimate strength,
and strain-at failure for each of the tests, grouped by build. The resulting empirical
cumulative probability distributions for material property values are shown in Figure 14.
A maximum likelihood method was used to estimate the three parameters for each of the
nine build datasets using Minitab statistical software [53]. The curves associated with the
fit, along with the associated 95%-confidence intervals are include for the highest and
lowest distributions as well as Build 6 in Figure 14. Quantitative parameter estimates

33
along with goodness-of-fit metrics and the statistical p-values are provided in Appendix
A.
Figure 14: Cumulative probability distributions for material properties, with color groupings for each of the nine
builds.
Build 6 Anomaly
The most obvious and concerning trend in the dataset is associated with Build 6
(orange left-pointed triangles and curves in Figure 14). While the yield strength values
for Build 6 display a uniform distribution shape comparable to the other datasets, the
ultimate tensile strength and strain at failure data deviate substantially from the
monomodal 3-parameter Weibull distribution. This deviation is especially apparent and
problematic in the ductility (strain at failure) values, where Build 6 contained 25
instances of failure strains below 1.95% whereas the remaining 1040 instances from
Build 6 and the other eight builds all exhibited values above 1.95%. Most concerning,
several of the Build 6 specimens exhibited failure strains as low as 0.67%, more than a
factor of two below the threshold values from the other builds. The loss of ultimate

34
strength was caused by the low ductility: the failures occurred before the Considère
criterion [54, 55] had been met, while the work hardening rate was still positive
Inspection of several fracture surfaces from this low-ductility subpopulation
showed an extensive network of interconnected lack-of-fusion porosity, which is a likely
culprit for the premature failures. Lack-of-fusion porosity is a common defect noted in
powder-based additive processes (e.g. [56, 57]) thought to be caused by several factors
such as insufficient laser power density [17, 58-61], excessively fast scan speeds [62], or
unduly coarse hatch spacing in the scan path [62, 63]. Lack-of-fusion porosity is distinct
from gas porosity, which is caused by the gas atomization process for production of
powder and tends to result in finer (≲ 2 m) spheroidal voids [17]. In the present case,
the network of lack-of-fusion porosity percolated from the interior to perforate the
exterior surface, providing a pathway for the external environment to access these large
internal pores. While isolated lack-of-fusion porosity is commonly found in most
powder-based metal additive processes and is found even in nominal tensile bars in the
present study, the extensive interconnected network appears to be rare. While the
processing origins of the interconnected porosity are not fully understood, they may be
associated with a ‘short feed’ condition where there is insufficient powder packing
density in the distributed powder bed layer [17, 64-67]. A recent synchrotron computed
tomography study noted up to 2 mm of interconnected porosity associated with electron
beam melting [68].
In the present case, the internal cavity was oxidized, as shown in the Energy
Dispersive Spectroscopy map, Figure 15c, presumably during the post-build heat
treatment in air. The Cr-rich oxides formed a nodule and needle-like/whisker

35
morphology. Several others have elucidated the environmental circumstances under
which Fe-Cr alloys form such whisker-like oxides during thermal exposure [69-71].
However, it is unclear if the presence of this brittle oxide contributes to the low resistance
to fracture, or if the premature failures are due solely to the morphology of the lack-of-
fusion cavities. Most, but not all, of the subpopulation of 25 specimens with failure strain
<1.95% from build 6 showed clear signs of the tunneling interconnected porosity
network, even based on optical imaging of the fracture surfaces. For those few
exceptions, either the interconnectivity was not obvious (e.g. interconnections occurring
out-of-plane of the fracture surface), or perhaps those specimens were members of the
nominal population and the ductility distributions for the two populations have some
overlap.
36
Figure 15: Fracture surface associated with a low-ductility sample from Build 6 (0.68% failure strain). (a)
backscattered electron overview showing a dark interior region that is interconnected and tunnels to the right edge of
the sample, (b) close-up showing needle- like morphologic features associated with the dark region, and (c) an energy
dispersive spectroscopy map of the ‘dark’ region, showing nodules and needle-like features containing chrome oxides.
Importance of Large Datasets
The results reinforce the importance of statistical evaluation of additively
manufactured components. Most material property investigations focus on parametric
changes in process conditions or structural state for the inference of global behavior
based on limited data at each condition. Large, homogeneous datasets such as those
offered in the current study are quite rare and as such present an important opportunity
for statistical dissection. With regard to the anomalous behavior of 25 specimens out of
1040 (2.40% occurrence rate), this rare event highlights the danger of reliance on thin
200 µm
20 µm
10 µm
(a)
(b)
(c)

37
datasets for statistical inference. A vast majority of prior studies on the mechanical
properties of additively manufactured metal relied on 10 or less repeat observations for
any given condition (e.g. [52, 56, 62, 72]). Based on the current dataset, any 10
randomly sampled observations from the population of 1040 samples would miss this
anomalous event 78% of the time. Even in a case where one of the observations was
from this minor population, its rarity could be dangerously ignored or discounted as a
spurious test artifact. For example, while the existence of bimodality in Build 6 is
evident, Build 1 also contained a single suspicious observation. Out of 120 observations,
one failure strain value appeared anomalously low: 1.95% strain, with the next lowest
values at 3.08%, 3.31%, 3.41%, 3.45% strain. This single observation had a profound
effect on the 3-parameter Weibull fit: by censoring this single observation, the estimated
threshold parameter for Build 1 elongation raises from 0.15% to 1.96%. This latter
censored value is consistent with the range of thresholds reported for the other seven
builds. However, fractographic analysis of this single outlier was not able to clearly
distinguish the failure mode compared to the next lowest failures; therefore, there is no
independent corroboration to defend the censoring of the lowest observation. The
profound effect of a single ‘outlier’ on threshold determination highlights the need for
large, robust, monomodal datasets – a noteworthy weakness of the 3-parameter form of
the Weibull distribution.
Within-Build and Between-Build Variability
Setting aside rare events, the large datasets also provide insight into build-to-build
variation in properties, which in some cases can be subtle. With regard to the yield

38
strength, Build 2 clearly possessed the lowest population of strength values, although
there was overlap in the Build strength values with seven of the eight other builds. The
characteristic value of the Weibull distribution, 𝜂, is the value at which 63.2% of the
observations are expected to fall below. The characteristic yield strength for Build 2 was
949 MPa, with the next lowest builds (Builds 1 and 9) at 1037 and 1039 MPa,
respectively. The highest characteristic yield strength value was 1264 MPa for Build 4,
indicating that the characteristic values could shift by as much as 33% from build-to-
build in this small population of nine builds. This build-to-build shift in material
property values is also apparent for ultimate strength and failure strain observations
shown in Figure 14. Yet the large overlap in the distributions implies that these build-to-
build variations in material properties could be easily undiscovered with smaller
populations. Another way to parse this build-to-build variation is to treat the estimated
Weibull parameters as random variables and perform Gaussian analysis. For example,
the Weibull characteristic value of ultimate tensile strength for the nine builds ranged
from 1096 to 1339 MPa with a Gaussian mean of 1230 MPa and a standard deviation of
86 MPa. These parameters suggest that if 1000 build arrays were manufactured, one of
them would be expected to have a characteristic ultimate tensile strength of only 964
MPa, notably lower than the threshold value determined for most of the individual
builds. Similar Gaussian analysis can be performed on the distribution of threshold
values themselves to estimate a 1-in-1000 lowest threshold ultimate tensile strength of
724 MPa based on eight observations of the threshold (censoring the threshold for Build
6, which was spurious due to bimodality). This value of 724 MPa appears to be a
conservative lower bound ultimate tensile strength that takes into account within-build

39
and between-build variation in properties. This value can be compared to the existing
Aerospace Material Specification (AMS) from the Society of Automotive Engineers. In
AMS 5344 for casting grades of the current alloy the minimum allowable ultimate tensile
strength for the cast alloy is 1241 MPa, almost a factor of 2 above the conservative
threshold value determined for this AM variant of the alloy.
Another approach to examine the effect of between-build uncertainty is to treat
that uncertainty as epistemic (lack of knowledge) uncertainty which is reflected in the
distribution of the Weibull parameters. If we consider the eight builds that appear to have
monomodal Weibull distributions, we have eight estimates for each of the three
parameters governing the Weibull distribution. For ultimate tensile strength, these values
are highly correlated. For example, the shape and scale parameter have a correlation
coefficient of 0.82. Assuming the three Weibull parameters have a multi-variate
Gaussian distribution with the covariance estimated from the eight data points, we can
generate many realizations of possible Weibull parameter values which honor the
relationships of the parameters governing the Weibull plots in Figure 14. Figure 16
shows 1000 realizations of Weibull distributions generated from 1000 samples of the
(shape, scale, threshold) parameters of a multi-variate Gaussian distribution [73] whose
mean and covariance structure was estimated from the collection of data from the eight
builds (excluding anomalous Build 6). In Figure 16, we have highlighted the bounding
cases of Build 2 in red and Build 4 in magenta, similar to Figure 14. While many of the
one thousand realizations fall within these bounds, a significant number fall outside. This
figure demonstrates how we can use this approach to generate an ensemble of Weibull
curves and infer conservative bounds. For example, in Figure 16, the ensemble

40
realization furthest to the left has a threshold value of 858 MPa. This value is a lower
bound that is less conservative but possibly more realistic than the value of 724 MPa
determined in the preceding paragraph. Ensemble analysis generated by sampling
potential Weibull parameter combinations consistent across the build data is a powerful
tool to address statistical questions, such as understanding the probabilities of percentiles
being above or below specified values. As mentioned previously, the ‘build-to-build’
variation described herein may also include machine-to-machine variation, since four
nominally identical machines were used to manufacture the nine builds; separating these
sources would be valuable future work.
Figure 16: Ensemble of cumulative probability distributions for ultimate tensile strength, generated by sampling
Weibull parameters from a multi-variate Gaussian distribution. Red and Magenta lines show bounding cases of Build
2 and Build 4, respectively.

41
Chapter 5 – Hot Isostatic Pressing
Hot isostatic pressing (HIP) is a widely accepted process for improving material
performance in powder metallurgy and cast product by collapsing internal porosity [74].
HIP processing has been used for interfacial bonding, densifying presintered components,
and consolidating powders [74]. It involves application of elevated temperature and very
high pressure using a (usually inert) gas. HIP processing has been shown to collapse and
bond internal porosity and defects [74, 75]. Because AM materials can also have such a
large quantity of porosity and defects it makes sense that HIP processing can be
beneficial to AM, however most producers have not accepted this as a standard method
of processing AM components. To examine the effect of HIP processing on AM, a
subset of the tensile array in Figure 1b produced by Vendor 1 were sent to an external
vendor for HIP processing in accordance with AMS 2759/3 Rev. F. Typical HIP
temperatures for steels range from 950 – 1160 °C and typical pressures are ~100MPa
[74]. The profile that was used for this HIP treatment (1120°C, 100MPa for 6 hr) can be
seen in Figure 17.
Figure 17: Hot isostatic pressing temperature and pressure profile for AM 17-4PH.

42
Tensile Results
Figure 18 compares two samples that have been cross-sectioned and polished to
highlight porosity. The untreated sample shows lines of porosity that are parallel to the
build direction indicating a problem with powder feed, scanning speed, and/or hatch
spacing [76]. The HIP processed sample shows virtually no residual porosity. Because
HIP processing collapsed most of the internal porosity, it would be expected to observe a
decrease the cross sectional area. Figure 20a shows the cumulative probability
distribution of the cross-sectional area of the HIP processed samples. The shape
parameter of the HIP processed samples increased, meaning a larger scatter in the cross
sectional area.
Figure 18: Cross sections of AM 17-4 material that has been a) untreated and b) HIP processed.
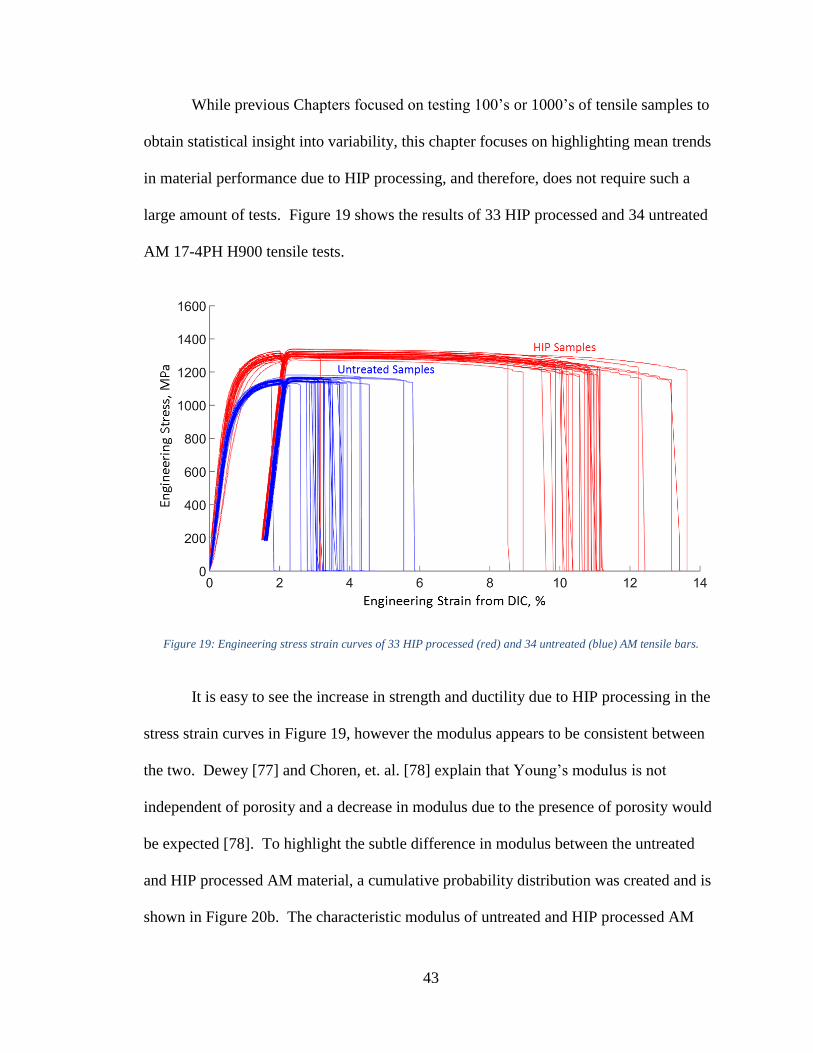
43
While previous Chapters focused on testing 100’s or 1000’s of tensile samples to
obtain statistical insight into variability, this chapter focuses on highlighting mean trends
in material performance due to HIP processing, and therefore, does not require such a
large amount of tests. Figure 19 shows the results of 33 HIP processed and 34 untreated
AM 17-4PH H900 tensile tests.
Figure 19: Engineering stress strain curves of 33 HIP processed (red) and 34 untreated (blue) AM tensile bars.
It is easy to see the increase in strength and ductility due to HIP processing in the
stress strain curves in Figure 19, however the modulus appears to be consistent between
the two. Dewey [77] and Choren, et. al. [78] explain that Young’s modulus is not
independent of porosity and a decrease in modulus due to the presence of porosity would
be expected [78]. To highlight the subtle difference in modulus between the untreated
and HIP processed AM material, a cumulative probability distribution was created and is
shown in Figure 20b. The characteristic modulus of untreated and HIP processed AM

44
material is 182 and 194, respectively. The modulus threshold values (below which the
probability of occurrence is zero) for the untreated and HIP processed samples are 154
and 178 GPa, respectively; an increase of ~16%.
Figure 20: Cumulative probability distributions for a) Cross-sectional area and b) Modulus of Elasticity for AM 17-
4PH H900 material that has been both HIP processed and untreated.
Dewey also states that the relationship of Young’s modulus between a fully dense
and porous material is not simply a rule of mixtures. The basic form of Dewey’s
equation for Young’s modulus of a porous material is shown in equation 4:
𝐸𝑝 = 𝐸0 ∗ (1 − 𝑎 ∗ 𝑃) (4)

45
where Ep is Young’s modulus of the porous body, E0 is the modulus of a non-porous
body of the same material, P is the volume porosity, and “a” is a constant dependent on
Poisson’s ratio of the matrix and is shown in equation 5.
𝑎 =3 (9+5𝑣0)(1−𝑣0)
2 (7−5𝑣0) (5)
where 𝑣0 is the poisons ratio of the matrix material. Using 𝑣0 of 0.3, equation 5 yields an
‘a’ value of 2.00.
Using ImageJ software, the volume fraction of porosity of the gauge sections in
Figure 18 were estimated. The area fraction of porosity of the untreated sample was
3.31% and the HIP processed sample was 0.06%. Using these volume porosities, a
published modulus of 197 GPa [79] for fully dense, wrought 17-4PH, and the constant ‘a’
of 2.0, equation 4 estimates the value of modulus for the untreated AM material to be
~184 GPa and the HIP processed material to be ~197 GPa. The modulus values
estimated by Dewey’s equation are very closely aligned to the characteristic modulus
values obtained from the Weibull 3-parameter distribution.
Variability Associated with HIP
The overall variability in strength and ductility improved with HIP processing.
Because of an apparent outlier in strain to failure (Figure 20d), the Weibull modulus
value (which describes the spread in the data) of strain at failure increased by nearly
800% for the HIP processed samples. If this sample is excluded from the distribution, the
Weibull modulus decreases by about 5% for the HIP processed samples. The Weibull
modulus of ultimate tensile strength (Figure 20c) decreased ~40% for the HIP processed
samples.

46
Scanning electron microscopy was performed on fracture surfaces from two of the
HIP processed specimens (one that had ‘average’ elongation at failure and one that had
low elongation at failure, about 3%) as shown in Figure 21. In both samples, the fracture
surface shows a shear lip with a flat ‘fibrous’ central zone and intergranular cleavage
which is commonly observed in alloys like 17-4PH [51]. Porosity and lack of fusion
zones that were observed in samples from chapter 3 are no longer present. Energy
dispersive X-ray spectroscopy (EDS) revealed the presence of large silicon inclusions
throughout both samples and appear green in Figure 21a. These silicon inclusions are
typical in wrought 17-4. Figure 21b shows the fracture surface of the low elongation
sample and reveals a large defect in the middle (~150 µm by ~300 µm) that contains high
amounts of aluminum. The vendor who produced these samples also processes
aluminum on the same machine. This aluminum could be explained by residual
aluminum powder in the feeder that made its way to the build tray.
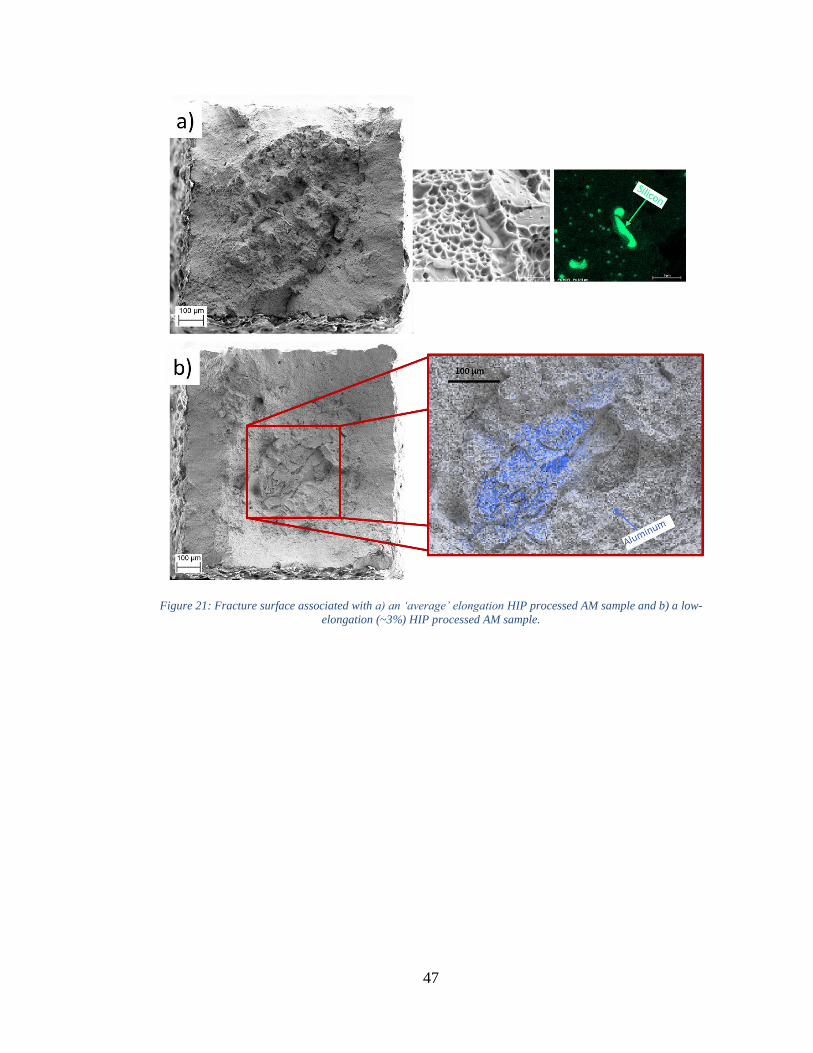
47
Figure 21: Fracture surface associated with a) an ‘average’ elongation HIP processed AM sample and b) a low-
elongation (~3%) HIP processed AM sample.

48
Chapter 6 – Hardness Mapping
Hardness testing is a quick and easy means of investigating the mechanical
properties of small volumes of material and has been useful for quality control and
materials evaluation. Hardness testing involves applying a fixed load on an indenter tip
and measuring the dimensions of the indentation. There are a variety of hardness testing
techniques, such as Rockwell, Brinell, Knoop, and Vickers. Brinell and Rockwell
hardness tests utilize spheroconical indenter tips and thus the indentation geometry does
not remain self-similar with indentation depth. Brinell and Rockwell tests are best suited
for macro-indentations [80]. Knoop and Vickers hardness tests use conical or pyramidal
indenter tips which create a constant indentation no matter the depth of penetration and
therefore produce essentially the same hardness number at all test forces [26]. This
makes them very beneficial for micro-indentations and hardness mapping [80]. The
Vickers hardness number, Hvn, is defined in equation 6 as:
𝐻𝑣𝑛 =𝑃
𝐴𝑠 (6)
where P is the applied load in kgf, and A is the pyramidal contact area in mm2. For the
Vickers pyramidal contact area, As can be calculated using equation 7:
𝐴𝑠 =𝑑𝑣
2
2∗𝑠𝑖𝑛𝛼
2
= 𝑑𝑣
2
1.8544 (7)
Where α is the face angle of the diamond indenter (136°) and dv is the mean Vickers
indentation diagonal length in mm. Because micro-indentation Vickers hardness was
used, which typically reports test forces in grams-force (gf) and lengths reported in
micrometers (µm), the hardness number can be calculated using equation 8:
𝐻𝑣𝑛 = 1000 ∗ 1.8544 ∗𝐹(𝑔𝑓)
𝑑𝑣2
(𝜇𝑚)
= 1854.4 ∗𝐹(𝑔𝑓)
𝑑𝑣2
(𝜇𝑚)
(8)

49
Vickers hardness measurements were made in accordance to ASTM E92 [26]
using a Struers DuraScan 70 hardness mapping machine on AM 17-4PH in the H900
condition, AM 17-4PH in the H900 condition that had been HIP processed, and on
wrought 17-4PH H900 sheet. All hardness measurements were made on tensile samples
that were sectioned and mechanically polished along the build direction (Figure 22). The
load used for all indents was 500 grams with a dwell time of 10 seconds which produced
a nominal diagonal length of impression in the vicinity of 45 µm. Indentations were
spaced 200µm apart and approximately 600 indentations were made on each sample.
After all indentations were made, the length of the two diagonals of the diamond shaped
Vickers indentation were measured using image recognition software attached to the
Struers DuraScan.
Hardness Indentations
Each indentation was examined for validity against ASTM E92 [26] (proximity to
an edge, visibility of all 4 points, etc) but because of the porosity present in both the HIP
processed and untreated AM material, many indentation measurements were discarded
due to a pore obstructing the diagonal point-to-point measurement. Figure 22 shows
hardness maps overlaid on montage cross-sectional images for untreated, HIP processed,
and wrought material. Hardness indents which were invalid were excluded and
interpolation between valid indents was used to create a complete color map.

50
Figure 22: Vickers hardness mapping on a) untreated AM 17-4PH H900, b) HIP processed AM 17-4PH H900 and, c)
wrought 17-4PH H900.
The average hardness of untreated AM, HIP processed AM, and wrought material
was 381 HVN (+/- 73.32, 1SD), 470 HVN (+/- 7.31, 1SD) and 461 HVN (+/- 5.27, 1SD)
respectively. These hardness maps show no correlation between build height and
hardness value, a correlation that has been seen by previous research in other AM metals
using laser powder bed AM [81]. The lack of correlation between build height and
hardness could be attributed to the fact that the AM tensile bars experienced a post build
heat treatment (solution treated (1037°C/1hr) and aged to H900 (482°C/1hr)) which
causes dynamic recrystallization of the microstructure.
The increased scatter in the hardness values of the untreated AM material is due
to the fact that some indentations are sampling porosity and voids and therefore are not a
true representation of actual material properties, but rather a measure of mechanical

51
performance. Figure 23a shows an example of an indentation that is sampling a pore that
is visible on the surface. Figure 23b shows how an indent can appear valid per ASTM
E92 but may be sampling material too close to a large pore or perhaps even sample a sub-
surface pore or other material defect, which leads to significantly lower than average
hardness values. The images of hardness indents that sample porosity can be detected
visually and excluded from the dataset, however, the abnormally low hardness values that
can be attributed to sub-surface porosity or other material defects appear valid and
obscure the true material hardness and add to the variability. This should be taken into
account if hardness values alone are to be used to qualify AM components.
Figure 23: Vickers hardness indents on additively manufactured 17-4PH H900 sampling a) a pore which is visible on
the surface and b) material close to a large pore or other defect like a sub-surface pore.
Correlation Between Hardness and Strength
Although these hardness values are empirical in nature, they can be approximated
to ultimate tensile strength and yield strength to more directly compare to the results of
high-throughput tensile testing [82, 83]. First, to make a comparison to the ultimate

52
tensile strength, the Vickers hardness values (Hvn) are converted to Rockwell C hardness
values (HRC) using equation 9 [82] and rounded to the nearest integer:
𝐻𝑅𝐶 = 31.49 + (7.967 ∗ 10−2)𝐻𝑣𝑛 −
(3.554 ∗ 10−5)(𝐻𝑣𝑛)2 − (6.728 ∗ 103)(𝐻𝑣𝑛)−1 (9)
Using the tables provided in ASTM A370, the Rockwell C hardness values can be
converted to an approximation of the ultimate tensile strength (UTS). The comparisons
between UTS obtained from tensile tests and UTS approximated from hardness
indentations are shown in Figure 24a. The UTS values obtained from hardness testing
show a ‘binning’ effect which stems from the tables which convert HRC to UTS. For the
wrought material, the UTS approximations from hardness values align closely with the
values obtained from tensile testing for the upper percentile data and have very similar
Weibull shape parameters (1.763 for UTS obtained from tensile testing and 2.311 for
UTS obtained from hardness values). The HIP processed AM material also shows a
similar Weibull shape parameter for UTS from tensile testing (3.285) and UTS from
hardness values (2.809), however the Weibull characteristic value of UTS from hardness
is 200% higher than the UTS values obtained from tensile testing.
Tabor has shown that the yield strength of hardened or severely cold worked
material can be related to hardness testing by equation 10 [84]:
𝐻𝑣𝑛 = 𝑐 ∗ 𝜎𝑦 (10)
where Hvn is the Vickers hardness number in kgf/mm2, σy is the yield strength in kgf/mm2
and c is a constant and has a value depending on the nature of the metal being tested.
Tabor originally showed that ‘c’ should equal 2.9 for steel, however other researchers
have found that ‘c’ can range from 2.9-5 depending on the composition of the steel and

53
the amount of cold working or precipitation hardening [85, 86]. Using equation 10 and a
value of ‘c’ of 2.9, the hardness values were converted to approximate yield strengths and
compared to the 0.5% offset yield strengths obtained by tensile testing (Figure 24b). The
wrought material shows very good agreement with yield strength values obtained from
tensile testing compared to hardness conversions. This agreement demonstrates that the
constant ‘c’ of 2.9 is a valid scaling factor for this material using Tabor’s relationship.
Figure 24: Cumulative probability distribution of a) ultimate tensile strength and b) yield strength using data obtained
from tensile tests (dark colors) and hardness tests (light colors).
Hardness testing has been shown to be a viable method to correlate yield strength
and tensile strength of steels [24, 87] and was demonstrated with the wrought material in
this study. However, hardness tests performed on the AM material would correlate to a
non-conservative estimation of strength. This is also true for HIP processed AM
material. This discrepancy is likely a result of tensile testing sampling bulk material
which, even in the HIP processed samples, has porosity. The hardness tests sampled
material from one tensile bar, on one plane. This study demonstrates that hardness

54
testing is not sufficient for approximating strength values for this AM material because of
the high amount of porosity.

55
Chapter 7 – Conclusion
Additive manufacturing offers the opportunity to produce geometrically complex
arrays of material property coupons that are amenable to rapid, cost-effective high-
throughput testing. With only modest efforts to streamline sample handling and
measurement, this study has demonstrated an efficient tensile method capable of many
100’s of tensile tests per day. Assuming a cost of $150/conventional sample and
$30/hour for high-throughput testing, performing 100 conventional tests would cost
~$15,000 whereas performing 100 high-throughput tests would only cost $105 (assuming
1 test per 2 minutes). This equates to a 99% cost savings for tensile testing.
The high-throughput method was used to evaluate the full stochastic stress-strain
response of a laser powder bed AM 17-4PH alloy produced by two commercial vendors,
and compare the performance to commercially-available wrought sheet and HIP
processed AM material. With this method it is possible to not only characterize trends in
average behavior, but also evaluate the stochastic reliability of the material. This
approach provides a viable pathway to efficiently determine minimum allowable property
values for AM-produced materials, which can be below the established minimum values
for other processing routes such as casting. The approach highlights how differences in
surface roughness, porosity, and microstructure give rise to changes in property
distributions. This new technique paves the way for future extensive, but cost-efficient,
parametric studies on the metallurgical and manufacturing origins of stochastic
reliability.

56
Large Datasets Reveal Anomalous Behavior
A vast majority of prior studies on the mechanical properties of additively
manufactured metals have relied on a small number of tensile tests (often <10) for any
given condition. In contrast, the data provided in Chapter 4 employed the high-
throughput method to test 1065 tensile bars produced under nominally identical
conditions. The mechanical properties exhibited substantial variability within a single
build and more variability between builds. This variability could obscure interpretation
of subtle changes in parametric studies with small sample sizes. Also, this variability
may warrant a probabilistic or worst-case threshold approach to engineering design with
AM materials. The large dataset revealed that a small subpopulation (2%) suffered from
extremely low ductility (<1.95% elongation) associated with extensive interconnected
tunneling lack-of-fusion porosity. Adoption of efficient high-throughput test methods
may drive adjustments to manufacturing processes to avoid rare defects and mitigate
sporadic unexpected failures in service.
While interconnected porosity is in some cases beneficial, (e.g. when serving as
mineralization scaffolds for bone implants [88]), with regard to monolithic mechanical
properties, extensive porosity is clearly detrimental. The oxidation of large,
interconnected lack-of-fusion porosity created a brittle interior coating, that may have
further reduced resistance to fracture. Moreover, the connectivity of this internal pore to
the free surface represents a condition that cannot be readily remedied by hot isostatic
pressing. HIP processing was shown to reduce internal porosity and improve mechanical
performance in this and other studies on AM materials (e.g. [89, 90]), however, the
surface-connected porosity associated with these worst-case defects would not allow for
the needed pressure differential to collapse the voids. The occurrence of these rare,
57
catastrophic defects reinforces the acknowledged need to develop robust process
optimization, control and/or in-process diagnostics that can detect off-nominal process
conditions and unacceptable microstructural results [91].
Size-Dependent Mechanical Behavior
This thesis only explored tensile bars of a single size (4mm x 1mm x 1mm)
commensurate with typical usage for AM component fabrication. However, both the
average mechanical properties and the property distributions are expected to be size
dependent – an effect that was not explored experimentally in this study. An implicit
assumption embedded in standardized tensile testing is the notion of scale separation: the
stress values and corresponding material strength values are considered to be material
properties independent of the sample size, and therefore scalable. For this assumption to
hold true, it is necessary that the tensile test interrogates a representative volume of
material. However, in this study, the tensile behavior is a convolution of intrinsic
material properties and the superposed contributions from flaws (e.g. roughness, voids)
that are of a somewhat comparable scale. One effect has already been described: the
effective net section stress (corrected stress) differs substantially from the apparent stress.
Moreover, the roughness and internal voids create notch-like stress concentrations that
impart stress gradients over a similar dimension.
Sharon and Zhao, et al. have shown how ductility as measured by elongation is
known to be size dependent, and hence not an intrinsic material property [92, 93]. First,
elongation depends on the initial gauge length due to the localization of necking. Second,
the onset of necking can also depend on the thickness and the size of geometric
perturbations. Furthermore, Tsuchiya showed that if the elongation is determined by the

58
eventual failure at a weakest microstructural link such as a void or notch, then the
elongation is also affected by the spatial distribution of these flaws, resulting in the
Weibull size effect [94]. The current study utilized a non-ASTM tensile geometry to
comply with the limitations of the AM processes, e.g. to avoid large overhangs off the
build plane and to allow a large number of samples in a relatively small build volume.
The gauge length:width:thickness aspect ratio of the high-throughput specimen is 4:1:1- a
relatively stout aspect ratio that prevents premature necking instability and encourages
extensive elongation to failure. By comparison, a standard ASTM E8 compliant tensile
bar made from 1-mm thick wrought sheet stock would have an aspect ratio of 50:12.5:1.
The relative thinness of that geometry promotes premature necking and results in lower
reported elongation to failure. Specifically, ASTM-compliant wrought sheet from this
alloy/condition would be expected to have a tensile elongation of ~10% whereas the stout
subsized wrought specimens in Chapter 3 exhibited a tensile elongation of ~24%.
Sharon, et al. described the issues regarding the size-dependent ductility and how
guidelines for the ratios of length:width:thickness can minimize local necking [92].
Future Considerations
This study on the stochastic tensile performance of 17-4PH opens the door to a
wide range of potential questions that warrant further investigation. A few of the open
questions that could be addressed in further studies are described here with respect to the
AM process and with respect to a high-throughput qualification methodology.
With regard to the powder-bed fusion process, there is a need for a basic
understanding of how the process variables affect the heterogeneous
microstructure/defects and ultimately control the stochastic reliability. Within the

59
scope of this study, the issues of lack-of-fusion porosity, surface roughness, and
unexpected phase formation due to impurity uptake provide exemplars of the stochastic
process-structure-property connections that might be developed with more in-depth
studies. The first comparison in Chapter 3 between the nominal products produced by
two independent vendors raises questions with regard to the optimal process settings for a
given combination of material and AM platform. Perhaps there is also an optimization
tradeoff between dimensional tolerances and material properties (e.g. lower heat input
mitigates thermal distortions but causes more internal porosity). There are also questions
regarding the effect of build orientation and the repeatability of the process within a build
(location-to-location). Many of these questions have been addressed in recent literature
but without the efficiency benefit of high-throughput methodologies nor the statistical
insight gained from large datasets. For example, in this study the individual print layers
were perpendicular to the tensile axis. While numerous prior studies have explored the
difference in average properties as a function of build orientation using a small quantity
of tensile samples (e.g. [95], [15], [96], [97], and [35]), less is known regarding the shift
in property variability as a function of build orientation.
With regard to the high-throughput testing methodology, there are several
avenues for further development. Firstly, the current process could be further streamlined
from its current state of ~2 minutes per test. Automated robotic sample loading offers the
clearest path to mitigating costly technician time. There are also important opportunities
to more carefully deconvolve the contributions of intrinsic material properties from
extrinsic features such as surface roughness. Secondly, it would be beneficial to extend
the current tensile method to other modalities such as fracture toughness, bending, fatigue

60
resistance, notch sensitivity, etc. It is possible to develop high-throughput methods that
incorporate temperature and strain-rate dependent property measurements. Automated
data analysis techniques and data mining methodologies could be developed to correlate
the high-throughput mechanical property measurements with datasets from other forms of
characterization such as density measurements, computed tomography scans of porosity
content, x-ray analysis of phase and residual stress, etc. Finally, reduced order
homogenization methods must be further developed to translate the stochastic outcomes
measured in these repeated mechanical tests into stochastic predictions for component
reliability.
The benefits of high-throughput tensile testing for identifying rare anomalous
behavior is clearly demonstrated in the current work. However, the tensile test is
destructive, and therefore only a source of inferential correlation to component reliability.
Moving forward, it will be beneficial to develop a suite of destructive and non-destructive
high-throughput modalities and correlate those results with in-process monitoring to
develop a holistic approach to component qualification. Metallography, computed
tomography, dimensional metrology, and chemical composition mapping are just a few
examples of slow, laborious inspection modes that could benefit from high-throughput
developments. These rich sources of data can be used to calibrate or validate multiscale
process-structure-property models [98] for reliability, and ultimately drive design
optimization [99].

61
Appendix A: Statistical Parameters Best fit parameters describing the distribution of yield strength, ultimate tensile
strength, and elongation values for each of the nine separate builds from Chapter 4 are
included in Table A1.
Table A1. Parameter estimates for yield strength, ultimate tensile strength, and elongation
0.5% yield strength:
Group Shape Scale Thresh N AD P
𝛽 (𝜂 − 𝛾) 𝛾
1 4.743 130.4 906.9 120 0.716 0.034
2 3.037 226.1 723.3 109 1.534 <0.005
3 4.371 169.9 1044 120 1.491 <0.005
4 3.998 147.1 1117 120 0.321 0.473
5 11.32 716.9 418.5 120 1.267 <0.005*
6 2.729 113.8 1076 105 0.577 0.109
7 2.726 77.21 1123 120 0.206 >0.500
8 5.033 152.0 1096 120 1.640 <0.005
9 2.448 169.6 869.9 116 0.322 >0.500 *low threshold value
Ultimate Tensile Strength:
Group Shape Scale Thresh N AD P
𝛽 (𝜂 − 𝛾) 𝛾
1 5.151 94.32 1032 120 0.878 0.011
2 2.467 99.26 997.6 109 0.442 0.267
3 2.266 64.25 1237 120 0.458 0.265
4 2.625 89.24 1250 120 0.276 >0.500
5 6.462 282.2 940.3 120 0.344 0.400
6 10383 533205 -531947 120 1.072 <0.005
7 2.427 65.45 1202 120 0.227 >0.500
8 1.747 44.19 1266 120 0.369 0.448
9 1.794 95.57 1060 116 0.426 0.338
Elongation:
Group Shape Scale Thresh N AD P
𝛽 (𝜂 − 𝛾) 𝛾
1 5.294 6.256 0.1520 120 0.302 >0.500*
2 2.606 5.885 2.881 109 0.194 >0.500
3 2.611 3.549 2.062 120 0.233 >0.500
4 3.105 4.460 1.871 120 0.283 >0.500
5 2.499 6.147 2.687 120 0.180 >0.500
6 2.449 8.103 -1.486 120 2.368 <0.005**
7 2.938 5.429 1.628 120 0.198 >0.500
8 3.083 3.969 1.851 120 0.235 >0.500
9 1.922 3.620 1.846 116 0.503 0.216 *low threshold value because 1 point was low **low threshold due to bimodal distribution

62
References
1. Isaza, J. and P. Aumund-Kopp, Additive Manufacturing With Metal Powders: Design for Manufacture Evolves Into Design for Function. Powder Metall. Rev, 2014. 3(2): p. 41-50.
2. Kruth, J.P., M.C. Leu, and T. Nakagawa, Progress in Additive Manufacturing and Rapid Prototyping. CIRP Annals - Manufacturing Technology, 1998. 47(2): p. 525-540.
3. Standard Terminology for Additive Manufacturing - General Principles - Terminology, ISO/ASTM 52900:2015(E). 2016, ASTM International.
4. Beaman, J.J. and C.R. Deckard, Selective laser sintering with assisted powder handling. 1990, Google Patents.
5. Khaing, M., J. Fuh, and L. Lu, Direct metal laser sintering for rapid tooling: processing and characterisation of EOS parts. Journal of Materials Processing Technology, 2001. 113(1): p. 269-272.
6. Kruth, J.-P., et al., Selective laser melting of iron-based powder. Journal of Materials Processing Technology, 2004. 149(1): p. 616-622.
7. Cormier, D., O. Harrysson, and H. West, Characterization of H13 steel produced via electron beam melting. Rapid Prototyping Journal, 2004. 10(1): p. 35-41.
8. Atwood, C., et al. Laser engineered net shaping (LENS): a tool for direct fabrication of metal parts. in Proceedings of ICALEO. 1998.
9. Mazumder, J., et al., The direct metal deposition of H13 tool steel for 3-D components. JOM, 1997. 49(5): p. 55-60.
10. Proto Labs, I. 3D Printing. 2017; Available from: https://www.protolabs.com/3d-printing/.
11. Gardan, N., Knowledge Management for Topological Optimization Integration in Additive Manufacturing. International Journal of Manufacturing Engineering, 2014. 2014: p. 356256 (9 pp.)-356256 (9 pp.).
12. Tang, Y., K. Mak, and Y.F. Zhao, A framework to reduce product environmental impact through design optimization for additive manufacturing. Journal of Cleaner Production, 2016. 137: p. 1560-1572.
13. Optomec. Available from: http://www.optomec.com/.
14. Duncan, A.J., Quality control and industrial statistics. 1974.
15. Frazier, W.E., Metal Additive Manufacturing: A Review. Journal of Materials Engineering and Performance, 2014. 23(6): p. 1917-1928.

63
16. Huang, Y., et al., Additive manufacturing: current state, future potential, gaps and needs, and recommendations. Journal of Manufacturing Science and Engineering, 2015. 137(1): p. 014001.
17. Bauereiß, A., T. Scharowsky, and C. Körner, Defect generation and propagation mechanism during additive manufacturing by selective beam melting. Journal of Materials Processing Technology, 2014. 214(11): p. 2522-2528.
18. Murr, L.E., et al., Characterization of titanium aluminide alloy components fabricated by additive manufacturing using electron beam melting. Acta Materialia, 2010. 58(5): p. 1887-1894.
19. Hu, D. and R. Kovacevic, Sensing, modeling and control for laser-based additive manufacturing. International Journal of Machine Tools and Manufacture, 2003. 43(1): p. 51-60.
20. Kruth, J.P., et al., Consolidation phenomena in laser and powder-bed based layered manufacturing. CIRP Annals - Manufacturing Technology, 2007. 56(2): p. 730-759.
21. Shamsaei, N., et al., An overview of Direct Laser Deposition for additive manufacturing; Part II: Mechanical behavior, process parameter optimization and control. Additive Manufacturing, 2015. 8: p. 12-35.
22. Xu, F., H.T. Loh, and Y.S. Wong, Considerations and selection of optimal orientation for different rapid prototyping systems. Rapid Prototyping Journal, 1999. 5(2): p. 54-60.
23. Bourell, D.L., D.W. Rosen, and M.C. Leu, The roadmap for additive manufacturing and its impact. 3D Printing and Additive Manufacturing, 2014. 1(1): p. 6-9.
24. Pavlina, E.J. and C.J. Van Tyne, Correlation of Yield Strength and Tensile Strength with Hardness for Steels. Journal of Materials Engineering and Performance, 2008. 17(6): p. 888-893.
25. Hashemi, S.H., Strength–hardness statistical correlation in API X65 steel. Materials Science and Engineering: A, 2011. 528(3): p. 1648-1655.
26. ASTM, Standard Test Methods for Vickers Hardness and Knoop Hardness of Metallic Materials, in E92. 2016.
27. Krauss, G., Steels: Heat Treatment and Processing Principles. 1990, Materials Park, Ohio 44073: ASM International. 497.
28. Rafi, H.K., T. Starr, and B. Stucker, A comparison of the tensile, fatigue, and fracture behavior of Ti–6Al–4V and 15-5 PH stainless steel parts made by selective laser melting. The International Journal of Advanced Manufacturing Technology, 2013. 69(5-8): p. 1299-1309.

64
29. Tolosa, I., et al., Study of mechanical properties of AISI 316 stainless steel processed by “selective laser melting”, following different manufacturing strategies. The International Journal of Advanced Manufacturing Technology, 2010. 51(5-8): p. 639-647.
30. ASTM, Standard Test Methods for Tension Testing of Metallic Materials, American Society for Testing and Materials, in E8. 2015: West Conshohoken, PA. p. 60-81.
31. Chen, Z., G. Zhou, and Z. Chen, Microstructure and hardness investigation of 17-4PH stainless steel by laser quenching. Materials Science and Engineering: A, 2012. 534: p. 536-541.
32. Davis, J.R., Introduction to Stainless Steels. 1994, Materials Park, OH USA: ASM International.
33. Murayama, M., K. Hono, and Y. Katayama, Microstructural evolution in a 17-4 PH stainless steel after aging at 400 °C. Metallurgical and Materials Transactions A, 1999. 30(2): p. 345-353.
34. Murr, L.E., et al., Microstructures and Properties of 17-4 PH Stainless Steel Fabricated by Selective Laser Melting. Journal of Materials Research and Technology, 2012. 1(3): p. 167-177.
35. Yadollahi, A., et al., Data demonstrating the effects of build orientation and heat treatment on fatigue behavior of selective laser melted 17–4 PH stainless steel. Data in Brief, 2016. 7: p. 89-92.
36. Pan, B., et al., Study on subset size selection in digital image correlation for speckle patterns. Optics Express, 2008.
37. Schreier, H.W., J.R. Braasch, and M.A. Sutton, Systematic errors in digital image correlation caused by intensity interpolation. Optical Engineering, 2000. 39(11): p. 2915-2921.
38. Schreier, H.W. and M.A. Sutton, Systematic errors in digital image correlation due to undermatched subset shape functions. Experimental Mechanics, 2002. 42(3): p. 303-310.
39. Sutton, M.A., J.J. Orteu, and H. Schreier, Image correlation for shape, motion and deformation measurements: basic concepts, theory and applications. 2009: Springer Science & Business Media.
40. Rack, H.J. and D. Kalish, The strength, fracture toughness, and low cycle fatigue behavior of 17-4 PH stainless steel. Metallurgical Transactions, 1974. 5(7): p. 1595-1605.
41. Rafi, H.K., et al., Microstructure and Mechanical Behavior of 17-4 Precipitation Hardenable Steel Processed by Selective Laser Melting. Journal of Materials Engineering and Performance, 2014. 23(12): p. 4421-4428.

65
42. Yadollahi, A., et al. Mechanical and microstructural properties of selective laser melted 17-4 PH stainless steel. in ASME 2015 International Mechanical Engineering Congress and Exposition. 2015. American Society of Mechanical Engineers.
43. Weibull, W., A statistical distribution function of wide applicability. Journal of Applied Mechanics - Transactions of the ASME, 1951. 18(3): p. 293-297.
44. Boyce, B., A sequential tensile method for rapid characterization of extreme-value behavior in microfabricated materials. Experimental Mechanics, 2010. 50(7): p. 993-997.
45. ASTM, Standard Practice for Reporting Uniaxial Strength Data and Estimating Weibull Dirstribution Parameters for advanced Ceramics, American Society for Testing and Materials, in C1239. 1995: West Conshohocken, PA. p. 1239-95.
46. Weibull, W., A statistical distribution function of wide applicability. Journal of applied mechanics, 1951. 18(3): p. 293-297.
47. Han, Z., et al., A three-parameter Weibull statistical analysis of the strength variation of bulk metallic glasses. Scripta Materialia, 2009. 61(9): p. 923-926.
48. Wallin, K., The scatter in KIC-results. Engineering Fracture Mechanics, 1984. 19(6): p. 1085-1093.
49. Williams, P.T., et al., Weibull statistical models of KIc/KIa fracture toughness databases for pressure vessel steels with an application to pressurized thermal shock assessments of nuclear reactor pressure vessels. International Journal of Pressure Vessels and Piping, 2001. 78(2–3): p. 165-178.
50. Zahedi, H., et al., The effect of Fe-rich intermetallics on the Weibull distribution of tensile properties in a cast Al-5 pct Si-3 pct Cu-1 pct Fe-0.3 pct Mg alloy. Metallurgical and Materials Transactions A, 2007. 38(3): p. 659-670.
51. IITRI, Fracture Handbook, ed. S.B.e. al. 1979, Chicago, IL: The Metals Research Division, IIT Research Institute. 427.
52. Luecke, W.E. and J.A. Slotwinski, Mechanical properties of austenitic stainless steel made by additive manufacturing. Journal of research of the National Institute of Standards and Technology, 2014. 119: p. 398.
53. Ryan, B.F. and B.L. Joiner, Minitab handbook. 2001: Duxbury Press.
54. Considere, A., L’emploi du fer et de I’acier dans les constructions. Ann. Ponts Chaussees, 1885. 9: p. 574.
55. Hutchinson, J. and K. Neale, Influence of strain-rate sensitivity on necking under uniaxial tension. Acta Metallurgica, 1977. 25(8): p. 839-846.

66
56. Carroll, B.E., T.A. Palmer, and A.M. Beese, Anisotropic tensile behavior of Ti–6Al–4V components fabricated with directed energy deposition additive manufacturing. Acta Materialia, 2015. 87: p. 309-320.
57. Kobryn, P. and S. Semiatin. Mechanical properties of laser-deposited Ti-6Al-4V. in Solid Freeform Fabrication Proceedings. 2001. Austin.
58. Wang, L. and S. Felicelli, Process modeling in laser deposition of multilayer SS410 steel. Journal of Manufacturing Science and Engineering, 2007. 129(6): p. 1028-1034.
59. Guan, K., et al., Effects of processing parameters on tensile properties of selective laser melted 304 stainless steel. Materials & Design, 2013. 50: p. 581-586.
60. Guo, P., et al., Study on microstructure, mechanical properties and machinability of efficiently additive manufactured AISI 316L stainless steel by high-power direct laser deposition. Journal of Materials Processing Technology, 2017. 240: p. 12-22.
61. Yadroitsev, I., et al., Energy input effect on morphology and microstructure of selective laser melting single track from metallic powder. Journal of Materials Processing Technology, 2013. 213(4): p. 606-613.
62. Vandenbroucke, B. and J.-P. Kruth, Selective laser melting of biocompatible metals for rapid manufacturing of medical parts. Rapid Prototyping Journal, 2007. 13(4): p. 196-203.
63. Ng, G., et al., Porosity formation and gas bubble retention in laser metal deposition. Applied Physics A, 2009. 97(3): p. 641-649.
64. Boley, C., S. Khairallah, and A. Rubenchik, Calculation of laser absorption by metal powders in additive manufacturing. Applied optics, 2015. 54(9): p. 2477-2482.
65. Nassar, A.R., et al. Sensing for directed energy deposition and powder bed fusion additive manufacturing at Penn State University. in SPIE LASE. 2016. International Society for Optics and Photonics.
66. Craeghs, T., et al. Online quality control of selective laser melting. in Proceedings of the Solid Freeform Fabrication Symposium, Austin, TX. 2011. Citeseer.
67. Spears, T.G. and S.A. Gold, In-process sensing in selective laser melting (SLM) additive manufacturing. Integrating Materials and Manufacturing Innovation, 2016. 5(1): p. 1.
68. Scarlett, N.V.Y., et al., Synchrotron X-ray CT characterization of titanium parts fabricated by additive manufacturing. Part II. Defects. Journal of Synchrotron Radiation, 2016. 23(4).
69. Mikkelsen, L. and S. Linderoth, High temperature oxidation of Fe–Cr alloy in O2–H2–H2O atmospheres; microstructure and kinetics. Materials Science and Engineering: A, 2003. 361(1–2): p. 198-212.
67
70. Takagi, R., Growth of oxide whiskers on metals at high temperature. Journal of the Physical Society of Japan, 1957. 12(11): p. 1212-1218.
71. Fujii, C. and R. Meussner, Oxide Structures Produced on Iron‐Chromium Alloys by a Dissociative Mechanism. Journal of the Electrochemical Society, 1963. 110(12): p. 1195-1204.
72. Baufeld, B., O. Van der Biest, and R. Gault, Additive manufacturing of Ti–6Al–4V components by shaped metal deposition: microstructure and mechanical properties. Materials & Design, 2010. 31: p. S106-S111.
73. Johnson, N.L., S. Kotz, and N. Balakrishnan, Continuous multivariate distributions, volume 1, models and applications. Vol. 59. 2002: New York: John Wiley & Sons.
74. Atkinson, H.V. and S. Davies, Fundamental aspects of hot isostatic pressing: An overview. Metallurgical and Materials Transactions A, 2000. 31(12): p. 2981-3000.
75. Zhang, Q., et al., Microstructure and anisotropic tensile behavior of laser additive manufactured TC21 titanium alloy. Materials Science and Engineering: A, 2016. 673: p. 204-212.
76. Gong, H., et al., Analysis of defect generation in Ti–6Al–4V parts made using powder bed fusion additive manufacturing processes. Additive Manufacturing, 2014. 1–4: p. 87-98.
77. Dewey, J.M., The Elastic Constants of Materials Loaded with Non‐Rigid Fillers. Journal of Applied Physics, 1947. 18(6): p. 578-581.
78. Choren, J.A., S.M. Heinrich, and M.B. Silver-Thorn, Young’s modulus and volume porosity relationships for additive manufacturing applications. Journal of Materials Science, 2013. 48(15): p. 5103-5112.
79. Corporation, A.S., AK Steel 17-4PH Stainless Steel UNS S17400. 2007: West Chester, OH 45069.
80. Yovanovich, M. Micro and macro hardness measurements, correlations, and contact models. in 44th AIAA aerospace sciences meeting and exhibit. 2006.
81. Tian, Y., et al., Rationalization of Microstructure Heterogeneity in INCONEL 718 Builds Made by the Direct Laser Additive Manufacturing Process. Metallurgical and Materials Transactions A, 2014. 45(10): p. 4470-4483.
82. ASTM, Standard Hardness Conversion Tables for Metals Relationship Among Brinell Hardness, Vickers Hardness, Rockwell Hardness, Superficial Hardness, Knoop Hardness, and Scleroscope Hardness, in E140. 2007.
83. ASTM, Standard Test Methods and Definitions for Mechanical Testing of Steel Products, in A370. 2017.
68
84. Tabor, D., The hardness and strength of metals. Journal of the Institute of Metals, 1951. 79(1): p. 1-18.
85. Speich, G. and H. Warlimont, Yield strength and transformation substructure of low-carbon martensite. J Iron Steel Inst, 1968. 206(4): p. 385-392.
86. Marcinkowski, M., A. SZIRMAE, and R. FISHER, EFFECT OF 500DEGREESC AGING ON DEFORMATION BEHAVIOR OF IRON-CHROMIUM ALLOY. Transactions of the Metallurgical Society of AIME, 1964. 230(4): p. 676-&.
87. Cahoon, J.R., W.H. Broughton, and A.R. Kutzak, The determination of yield strength from hardness measurements. Metallurgical Transactions, 1971. 2(7): p. 1979-1983.
88. Heinl, P., et al., Cellular Ti–6Al–4V structures with interconnected macro porosity for bone implants fabricated by selective electron beam melting. Acta biomaterialia, 2008. 4(5): p. 1536-1544.
89. Liu, J., et al., Manufacturing near dense metal parts via indirect selective laser sintering combined with isostatic pressing. Applied Physics A, 2007. 89(3): p. 743-748.
90. Das, S., et al., Producing metal parts with selective laser sintering/hot isostatic pressing. JoM, 1998. 50(12): p. 17-20.
91. Everton, S.K., et al., Review of in-situ process monitoring and in-situ metrology for metal additive manufacturing. Materials & Design, 2016. 95: p. 431-445.
92. Sharon, J.A., H.A.I. Padilla, and B.L. Boyce, Interpreting the ductility of nanocrystalline metals 1. Journal of Materials Research, 2013. 28(12): p. 1539-1552.
93. Zhao, Y.H., et al., Influence of specimen dimensions on the tensile behavior of ultrafine-grained Cu. Scripta Materialia, 2008. 59(6): p. 627-630.
94. Tsuchiya, T., et al., Specimen size effect on tensile strength of surface-micromachined polycrystalline silicon thin films. Microelectromechanical Systems, Journal of, 1998. 7(1): p. 106-113.
95. Thijs, L., et al., Strong morphological and crystallographic texture and resulting yield strength anisotropy in selective laser melted tantalum. Acta Materialia, 2013. 61(12): p. 4657-4668.
96. Luecke, W.E. and J.A. Slotwinski, Mechanical Properties of Austenitic Stainless Steel Made by Additive Manufacturing. Journal of Research of the National Institute of Standards and Technology, 2014. 119: p. 398-418.
97. Simonelli, M., Y.Y. Tse, and C. Tuck, Effect of the build orientation on the mechanical properties and fracture modes of SLM Ti–6Al–4V. Materials Science and Engineering: A, 2014. 616: p. 1-11.

69
98. Allison, J., D. Backman, and L. Christodoulou, Integrated computational materials engineering: a new paradigm for the global materials profession. JOM, 2006. 58(11): p. 25-27.
99. Jared, B.H., et al., Additive manufacturing: toward holistic design. In review at Scripta Materialia, 2017.