high tech venture capital investment in a small transition
TRANSCRIPT
High Tech Venture Capital Investment in a SmallTransition Country: The Case of Hungary
László Szerb and Attila VargaFaculty of Business and Economics
University of Pécs, Hungary
October 2002
Acknowledgements: The authors would like to thank to the Hungarian Venture Capital andPrivate Equity Association, its secretary István Lakos, to the venture capital representatives,Ferenc Berszán, Péter Geszti, László Hradszky, Péter Fodor, and Benedek Lőrincz.

2
3
1. Introduction
Hungary has started the change of the economic system from planned economy to marketeconomy in the late 1980s. In the first years of transition, GDP declined by around twentypercent, unemployment increased from zero to fifteen percent, and inflation began to rise. Atthe same time restructure of the economy started and liberalisation also helped to encourageentrepreneurship. Since then one of the major problem of small and start-up businesses havebeen the lack of financial resources. While government promoted new business creation in theearly years of transformation, this support disappeared by 1995. At the same time, thefinancial system of Hungary began to improve by developing banking and credit institutionsand stock markets.
Since 1997, there has been a stable positive growth of the country mounting up to 5,2 percentgrowth rate in 2000. This development was mainly due to large foreign companies wellequipped with capital and management knowledge. At the same time, small business growthshowed a declining trend that was turned only in 1999-2000. Small business debt financinghave been improving for the last two years, however, equity financing is still problematic.
As one of the solutions of equity financing, venture capital appeared first in the country in theearly 1990s, but played a minor role up to 1995. In the second half of the 1990s, besides theHungarian state, foreign venture capital funds and investors appeared and begun to dominate.After the Russian crisis of 1998, foreign VC investment dropped and started to increase onlytwo years later. While up to 1998, food industry and manufacturing were the main targets ofinvestment, since then, the direction of investment turned to the new economy, followingworld-wide tendencies.
Hungary seems to have an advantage in the internet and software business, therefore, most ofthe VC companies and fund concentrate on these sectors. High tech ventures have appeared inthe portfolio of only a few VC companies, especially electronics and telecommunications,software related computer technology, pharmaceutical. In some cases scientific instrumentshave been the favourites. However, the amount of investment and the number of high tech VCfinanced companies are by far of that of the Internet and software firms.
In the second part of this study we outline the Hungarian manufacturing sector and the changeof competitiveness. Over the last years, the importance of high technology firms has increasedbut there is still a lag behind the leading nations as well as developed European Unioncountries.
Section three shows the situation of innovation in Hungary. Despite Hungarian firms havingmore and more innovative, novel innovations are missing. It is even more difficult to financethe innovation especially in the start-up phase and in the small business sector. One of themain limit of the development of the venture capital industry is the struggle of the domesticstock market, Budapest Stock Exchange.
Section four highlights the role of government and institutions in supporting high technologyinvestments. Besides continuous government involvement in research and development,innovation and new business creation, recent government programmes are not co-ordinated inaccordance of the needs of the National Innovation System and do not pay special attention tohigh technology development.
4
Section 5 is the body of this study, analysing ten high tech projects financed by five venturecapital companies. There are detailed descriptions of venture capital companies, the investeefirms and the interaction between them.
Finally, in section 6 the paper concludes with a critical evaluation of the main findings of thestudy.
2. Manufacturing industry and competitiveness in Hungary1
2.1. Structural characteristics
Hungary is one of the most successful transition economies in East-Central Europe, due tosome historical factors (the country used to be the most liberalized one in the soviet block), itsgood geographical location, a competitive work force and a relatively well-developedinfrastructure. The economy has been growing continuously since 1997 with a rate of three tofive percent. Unemployment rate has been decreasing to the currently six percent level and theshare of the public sector in GDP is only about ten percent. As the most attractive country forforeign investors during the transition period, per-capita FDI was the highest in Hungary inthe East-Central European region during the 1990s. The number of active business entities iscurrently about 1 million.
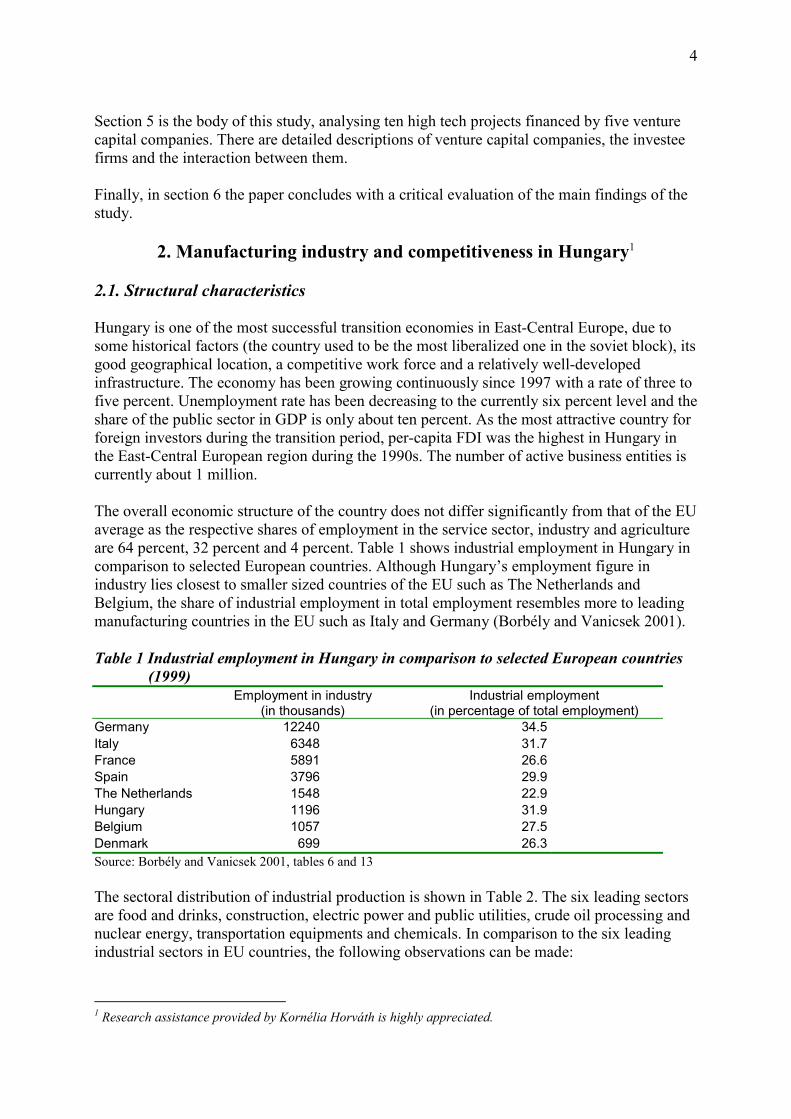
The overall economic structure of the country does not differ significantly from that of the EUaverage as the respective shares of employment in the service sector, industry and agricultureare 64 percent, 32 percent and 4 percent. Table 1 shows industrial employment in Hungary incomparison to selected European countries. Although Hungary’s employment figure inindustry lies closest to smaller sized countries of the EU such as The Netherlands andBelgium, the share of industrial employment in total employment resembles more to leadingmanufacturing countries in the EU such as Italy and Germany (Borbély and Vanicsek 2001).
Table 1 Industrial employment in Hungary in comparison to selected European countries(1999)
Employment in industry(in thousands)
Industrial employment(in percentage of total employment)
Germany 12240 34.5Italy 6348 31.7France 5891 26.6Spain 3796 29.9The Netherlands 1548 22.9Hungary 1196 31.9Belgium 1057 27.5Denmark 699 26.3Source: Borbély and Vanicsek 2001, tables 6 and 13
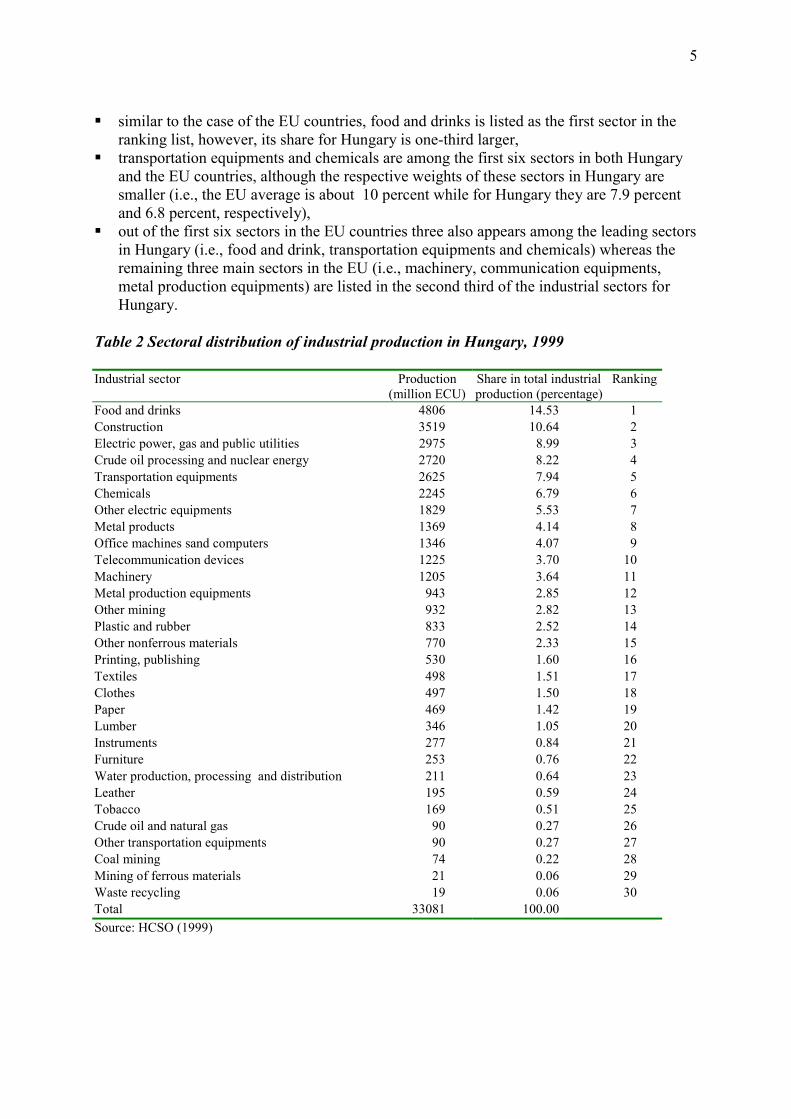
The sectoral distribution of industrial production is shown in Table 2. The six leading sectorsare food and drinks, construction, electric power and public utilities, crude oil processing andnuclear energy, transportation equipments and chemicals. In comparison to the six leadingindustrial sectors in EU countries, the following observations can be made:
1 Research assistance provided by Kornélia Horváth is highly appreciated.
5
� similar to the case of the EU countries, food and drinks is listed as the first sector in theranking list, however, its share for Hungary is one-third larger,
� transportation equipments and chemicals are among the first six sectors in both Hungaryand the EU countries, although the respective weights of these sectors in Hungary aresmaller (i.e., the EU average is about 10 percent while for Hungary they are 7.9 percentand 6.8 percent, respectively),
� out of the first six sectors in the EU countries three also appears among the leading sectorsin Hungary (i.e., food and drink, transportation equipments and chemicals) whereas theremaining three main sectors in the EU (i.e., machinery, communication equipments,metal production equipments) are listed in the second third of the industrial sectors forHungary.
Table 2 Sectoral distribution of industrial production in Hungary, 1999
Industrial sector Production(million ECU)
Share in total industrialproduction (percentage)
Ranking
Food and drinks 4806 14.53 1Construction 3519 10.64 2Electric power, gas and public utilities 2975 8.99 3Crude oil processing and nuclear energy 2720 8.22 4Transportation equipments 2625 7.94 5Chemicals 2245 6.79 6Other electric equipments 1829 5.53 7Metal products 1369 4.14 8Office machines sand computers 1346 4.07 9Telecommunication devices 1225 3.70 10Machinery 1205 3.64 11Metal production equipments 943 2.85 12Other mining 932 2.82 13Plastic and rubber 833 2.52 14Other nonferrous materials 770 2.33 15Printing, publishing 530 1.60 16Textiles 498 1.51 17Clothes 497 1.50 18Paper 469 1.42 19Lumber 346 1.05 20Instruments 277 0.84 21Furniture 253 0.76 22Water production, processing and distribution 211 0.64 23Leather 195 0.59 24Tobacco 169 0.51 25Crude oil and natural gas 90 0.27 26Other transportation equipments 90 0.27 27Coal mining 74 0.22 28Mining of ferrous materials 21 0.06 29Waste recycling 19 0.06 30Total 33081 100.00Source: HCSO (1999)
6
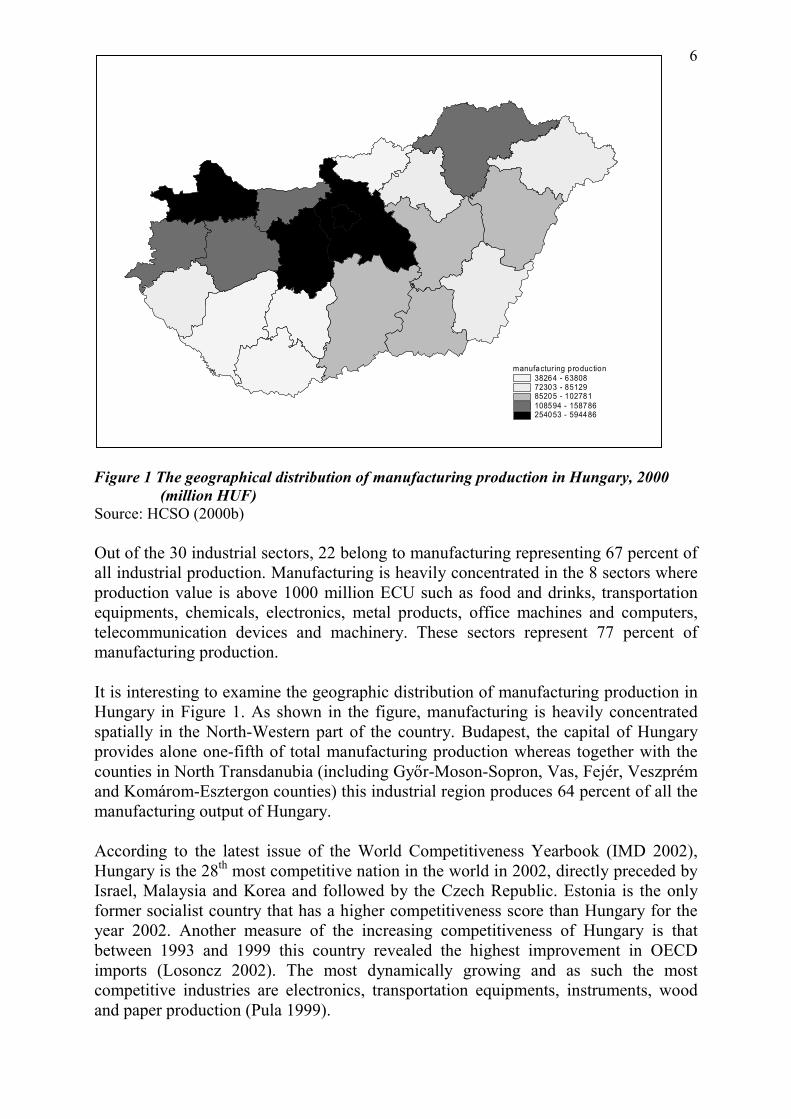
Figure 1 The geographical distribution of manufacturing production in Hungary, 2000(million HUF)
Source: HCSO (2000b)
Out of the 30 industrial sectors, 22 belong to manufacturing representing 67 percent ofall industrial production. Manufacturing is heavily concentrated in the 8 sectors whereproduction value is above 1000 million ECU such as food and drinks, transportationequipments, chemicals, electronics, metal products, office machines and computers,telecommunication devices and machinery. These sectors represent 77 percent ofmanufacturing production.
It is interesting to examine the geographic distribution of manufacturing production inHungary in Figure 1. As shown in the figure, manufacturing is heavily concentratedspatially in the North-Western part of the country. Budapest, the capital of Hungaryprovides alone one-fifth of total manufacturing production whereas together with thecounties in North Transdanubia (including Győr-Moson-Sopron, Vas, Fejér, Veszprémand Komárom-Esztergon counties) this industrial region produces 64 percent of all themanufacturing output of Hungary.
According to the latest issue of the World Competitiveness Yearbook (IMD 2002),Hungary is the 28th most competitive nation in the world in 2002, directly preceded byIsrael, Malaysia and Korea and followed by the Czech Republic. Estonia is the onlyformer socialist country that has a higher competitiveness score than Hungary for theyear 2002. Another measure of the increasing competitiveness of Hungary is thatbetween 1993 and 1999 this country revealed the highest improvement in OECDimports (Losoncz 2002). The most dynamically growing and as such the mostcompetitive industries are electronics, transportation equipments, instruments, woodand paper production (Pula 1999).
manufacturing production38264 - 6380872303 - 8512985205 - 102781108594 - 158786254053 - 594486
7
Competitiveness of the Hungarian economy has improved significantly since the early90s. What could be the main sources of this increase? Labor productivity is understoodas one of the major components of international competitiveness. It has increased inHungary by 50 percent between 1989 and 2000. This increase has at least two mainreasons (Losoncz 2002). The first is the dramatic decrease in employment during thefirst part of the 1990s. Resulting both from the introduction of market mechanisms aswell as major structural changes in the economy, between 1990 and 2000 the declinein the number of employed persons amounted to 1.2 million, accounting for a 24percent decrease in total employment.
Improving productivity is also due to the dynamic flow of foreign direct investment (FDI) tothe country since 1989. By introducing more advanced technologies into production, FDI is asignificant source of productivity increase. The important role of FDI in the Hungarianeconomy is also illustrated by the fact that besides that only 30,526 of the total of nearly 1million registered Hungarian enterprises have some foreign interest, these about 30,000foreign owned companies have a share of HUF 455 billion (i.e., over fifty percent of the totalamount of HUF 884 billion) of Hungarian investment (Fáth 2000). Another measure of thesignificance of FDI for the Hungarian economy is that 67 percent of the industrial productionis being generated by foreign owned firms (Barta 1997). These firms account for 43 percentof total employment in 1999 (Fáth 2000).
A large-scale study on the competitiveness of Hungarian companies (Chickán 1998) revealsthe fact that the top management also played a determining role in transforming firms’organizational structure (Czakó 2001). The presence of a well-qualified yet relatively lessexpensive work force is another source of an increase in international competitiveness(Losoncz 2002).
2.2. Relative importance of technological investment and high tech sectors
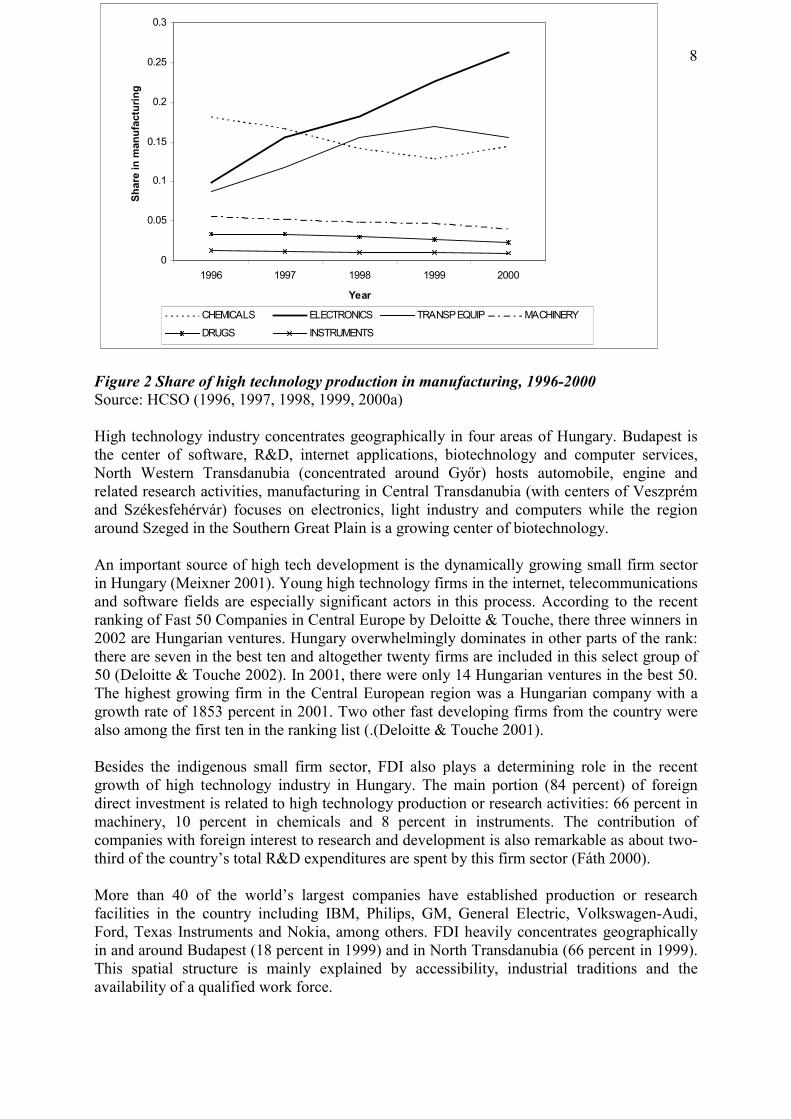
To empirically account for the “high technology” industry, three main approaches have beendeveloped in the literature (Varga 1998). High technology industry is measured as the set ofsectors with above-average ratio of R&D to sales; with higher than average percentage ofengineers and scientists in the labor force; with more than average number of innovations per1,000 employees. Based on these criteria, the relatively high level of data aggregation formanufacturing in Hungary allows us to consider the following, rather broad, sectors as hightech in this study: Chemicals, Drugs, Electronics, Machinery, Transportation Equipments andInstruments. The share of these six sectors in manufacturing has been dramatically increasingsince the mid-1990s. In 1996 high tech sectors took 47 percent of manufacturing output, whilethis share increased to 64 percent by 2000. As shown in Figure 2, the main drivers behind thisincrease are electronics and transportation equipments.
8
Figure 2 Share of high technology production in manufacturing, 1996-2000Source: HCSO (1996, 1997, 1998, 1999, 2000a)
High technology industry concentrates geographically in four areas of Hungary. Budapest isthe center of software, R&D, internet applications, biotechnology and computer services,North Western Transdanubia (concentrated around Győr) hosts automobile, engine andrelated research activities, manufacturing in Central Transdanubia (with centers of Veszprémand Székesfehérvár) focuses on electronics, light industry and computers while the regionaround Szeged in the Southern Great Plain is a growing center of biotechnology.
An important source of high tech development is the dynamically growing small firm sectorin Hungary (Meixner 2001). Young high technology firms in the internet, telecommunicationsand software fields are especially significant actors in this process. According to the recentranking of Fast 50 Companies in Central Europe by Deloitte & Touche, there three winners in2002 are Hungarian ventures. Hungary overwhelmingly dominates in other parts of the rank:there are seven in the best ten and altogether twenty firms are included in this select group of50 (Deloitte & Touche 2002). In 2001, there were only 14 Hungarian ventures in the best 50.The highest growing firm in the Central European region was a Hungarian company with agrowth rate of 1853 percent in 2001. Two other fast developing firms from the country werealso among the first ten in the ranking list (.(Deloitte & Touche 2001).
Besides the indigenous small firm sector, FDI also plays a determining role in the recentgrowth of high technology industry in Hungary. The main portion (84 percent) of foreigndirect investment is related to high technology production or research activities: 66 percent inmachinery, 10 percent in chemicals and 8 percent in instruments. The contribution ofcompanies with foreign interest to research and development is also remarkable as about two-third of the country’s total R&D expenditures are spent by this firm sector (Fáth 2000).
More than 40 of the world’s largest companies have established production or researchfacilities in the country including IBM, Philips, GM, General Electric, Volkswagen-Audi,Ford, Texas Instruments and Nokia, among others. FDI heavily concentrates geographicallyin and around Budapest (18 percent in 1999) and in North Transdanubia (66 percent in 1999).This spatial structure is mainly explained by accessibility, industrial traditions and theavailability of a qualified work force.
0
0.05
0.1
0.15
0.2
0.25
0.3
1996 1997 1998 1999 2000
Year
Shar
e in
man
ufac
turin
g
CHEMICALS ELECTRONICS TRANSP EQUIP MACHINERY
DRUGS INSTRUMENTS
9
Several studies have pointed out that (resulting from the active involvement of foreign capitalin industrial investments) the Hungarian manufacturing sector shows a highly polarized, dualstructure (e.g., Barta 1997, Pula 1999). On one of the poles there is the group of firmssuccessfully integrated into international networks consisting of mainly multinational orpartly foreign-owned companies and their Hungarian suppliers dominantly in the automobileand electronics industries. Many of the dynamically growing indigenous small high tech firmsin software, biotechnology, internet and telecommunications also belong to this group. Thissector generates about 60-70 percent of industrial growth and also it is the main driver ofHungarian export activities. However, most of the Hungarian firms can be found on the otherpole. These firms represent a lower level of technology and a slower peace of growth whilethis sector sells dominantly on the domestic market.
3. Technological change and corporate finance
As we can see from the previous section, Hungary’s competitiveness has increased over theyears of transition. As Losoncz (2002) noted the factors behind the increased productivity wasassociated with declining employment as well as technological changes. Now, let’s focus onthe second factor. Technological changes are closely associated with technologicalinnovation, research & development (R&D) and investment to new machinery2. There havebeen several papers analyzing innovation in Hungary.
In a comprehensive survey, Inzelt (1995) analyzed the innovation activity of 110 Hungarianventures in 1992. The data set was a sub-sample of a wide-range survey conducted by theCentral Statistical Office: out of the 3600 firms there were 478 (around twelve percent) whoreported some innovation activity, and out of this 110 filled out the questionnaire, mainly inthe large enterprise sector. At the early years of transition, the main focus of innovation wasquality improvement followed by the diversification of products and production. Fifty-sixpercent of the ventures introduced new technology and seventy-five percent developed newproduct. However, out of the new products, only twenty-five percent proved to be newinternationally. It was interesting that ventures spent half of the innovation budget R&D. Themost active technological research was noticed in the chemicals sector.
In a 1996 survey, Chikán et al (1997) reported that the competitiveness of Hungarianenterprises improved compared to the first years of transition. However, technological as wellas product renewal of the enterprises were ”dramatically slow”, and the lack of innovationwas the most important barrier of further development. The survey was done at 325 venturesthat represented around ten percent of the Hungarian GDP. An improvement in innovationactivity was reported by Kiss (2000) who continued the Chikán research. Out of the threehundred enterprises in the data set, thirty-six percent introduced new technology, but most ofthese technologies were new only in Hungary. Most of the companies developed the availabletechnology significantly. Twelve percent of the ventures had own R&D unit. Most companiespreferred the technological development both in the time period 1993-1995 and 1996-1998.Kiss reinforced the previous two studies’ result, that the most important aim of innovationwas product quality improvement.
Based on a regular survey of GKI that involved around 7-800 businesses, Papanek (2001)examined innovation activities of different regions in Hungary between 1997-2000. He stated
2 We know that R&D is only one of the innovation activities, but it provides the basis for the other innovationactivities, like planning, engineering, new product introduction, investment to machinery etc (Papanek 2001)
10
that innovation activity of ventures in the sample increased, compared to previous timeperiods: fifty percent introduced new technology and 63 percent of them entered the marketwith new product. However, most of the companies wanted to increase their competitiveposition by improved marketing efforts, and they paid less attention to intensive technologicaldevelopment. It was not a surprise that most of the innovations were new only to the companyand internationally novel innovations were missing.
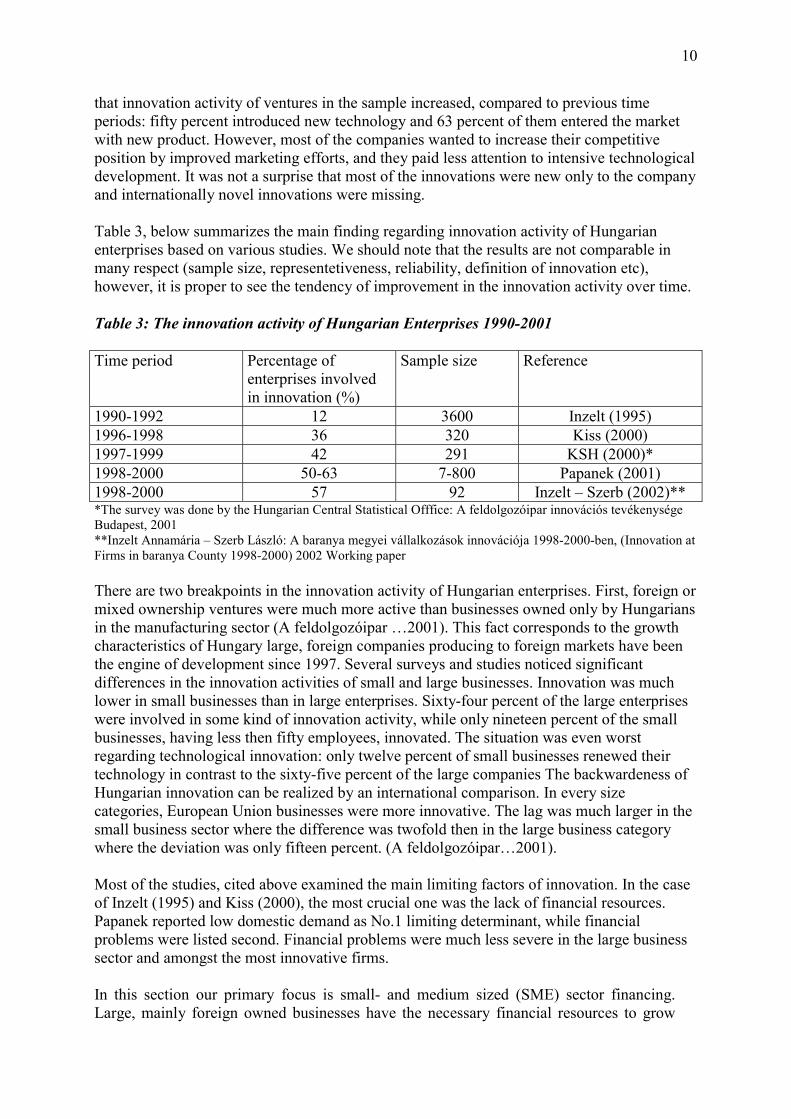
Table 3, below summarizes the main finding regarding innovation activity of Hungarianenterprises based on various studies. We should note that the results are not comparable inmany respect (sample size, representetiveness, reliability, definition of innovation etc),however, it is proper to see the tendency of improvement in the innovation activity over time.
Table 3: The innovation activity of Hungarian Enterprises 1990-2001
Time period Percentage ofenterprises involvedin innovation (%)
Sample size Reference
1990-1992 12 3600 Inzelt (1995)1996-1998 36 320 Kiss (2000)1997-1999 42 291 KSH (2000)*1998-2000 50-63 7-800 Papanek (2001)1998-2000 57 92 Inzelt – Szerb (2002)***The survey was done by the Hungarian Central Statistical Offfice: A feldolgozóipar innovációs tevékenységeBudapest, 2001**Inzelt Annamária – Szerb László: A baranya megyei vállalkozások innovációja 1998-2000-ben, (Innovation atFirms in baranya County 1998-2000) 2002 Working paper
There are two breakpoints in the innovation activity of Hungarian enterprises. First, foreign ormixed ownership ventures were much more active than businesses owned only by Hungariansin the manufacturing sector (A feldolgozóipar …2001). This fact corresponds to the growthcharacteristics of Hungary large, foreign companies producing to foreign markets have beenthe engine of development since 1997. Several surveys and studies noticed significantdifferences in the innovation activities of small and large businesses. Innovation was muchlower in small businesses than in large enterprises. Sixty-four percent of the large enterpriseswere involved in some kind of innovation activity, while only nineteen percent of the smallbusinesses, having less then fifty employees, innovated. The situation was even worstregarding technological innovation: only twelve percent of small businesses renewed theirtechnology in contrast to the sixty-five percent of the large companies The backwardeness ofHungarian innovation can be realized by an international comparison. In every sizecategories, European Union businesses were more innovative. The lag was much larger in thesmall business sector where the difference was twofold then in the large business categorywhere the deviation was only fifteen percent. (A feldolgozóipar…2001).
Most of the studies, cited above examined the main limiting factors of innovation. In the caseof Inzelt (1995) and Kiss (2000), the most crucial one was the lack of financial resources.Papanek reported low domestic demand as No.1 limiting determinant, while financialproblems were listed second. Financial problems were much less severe in the large businesssector and amongst the most innovative firms.
In this section our primary focus is small- and medium sized (SME) sector financing.Large, mainly foreign owned businesses have the necessary financial resources to grow
11
and to innovate. Small business growth and innovation has special problems. One of themajor difficulties of financing innovative small businesses is information opacity. Indealing with this information problem, financial intermediaries that screen, contract andmonitor the businesses in which they invest, play a crucial role (Berger and Udell 1998).World-wide, small and young businesses are financed more with owners’ equity than withdebt. Business angels and venture capital provide the primary equity financing for highgrowth potential, entrepreneurial firms.
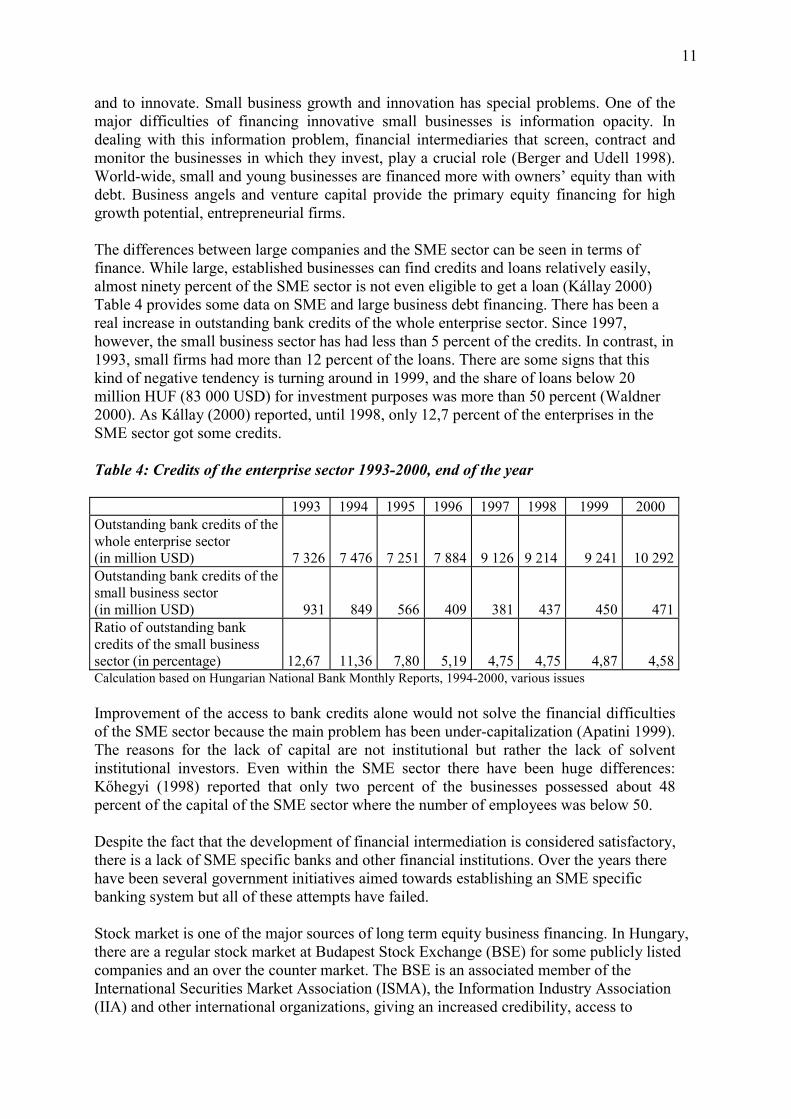
The differences between large companies and the SME sector can be seen in terms offinance. While large, established businesses can find credits and loans relatively easily,almost ninety percent of the SME sector is not even eligible to get a loan (Kállay 2000)Table 4 provides some data on SME and large business debt financing. There has been areal increase in outstanding bank credits of the whole enterprise sector. Since 1997,however, the small business sector has had less than 5 percent of the credits. In contrast, in1993, small firms had more than 12 percent of the loans. There are some signs that thiskind of negative tendency is turning around in 1999, and the share of loans below 20million HUF (83 000 USD) for investment purposes was more than 50 percent (Waldner2000). As Kállay (2000) reported, until 1998, only 12,7 percent of the enterprises in theSME sector got some credits.
Table 4: Credits of the enterprise sector 1993-2000, end of the year
1993 1994 1995 1996 1997 1998 1999 2000Outstanding bank credits of thewhole enterprise sector(in million USD) 7 326 7 476 7 251 7 884 9 126 9 214 9 241 10 292Outstanding bank credits of thesmall business sector(in million USD) 931 849 566 409 381 437 450 471Ratio of outstanding bankcredits of the small businesssector (in percentage) 12,67 11,36 7,80 5,19 4,75 4,75 4,87 4,58Calculation based on Hungarian National Bank Monthly Reports, 1994-2000, various issues
Improvement of the access to bank credits alone would not solve the financial difficultiesof the SME sector because the main problem has been under-capitalization (Apatini 1999).The reasons for the lack of capital are not institutional but rather the lack of solventinstitutional investors. Even within the SME sector there have been huge differences:Kőhegyi (1998) reported that only two percent of the businesses possessed about 48percent of the capital of the SME sector where the number of employees was below 50.
Despite the fact that the development of financial intermediation is considered satisfactory,there is a lack of SME specific banks and other financial institutions. Over the years therehave been several government initiatives aimed towards establishing an SME specificbanking system but all of these attempts have failed.
Stock market is one of the major sources of long term equity business financing. In Hungary,there are a regular stock market at Budapest Stock Exchange (BSE) for some publicly listedcompanies and an over the counter market. The BSE is an associated member of theInternational Securities Market Association (ISMA), the Information Industry Association(IIA) and other international organizations, giving an increased credibility, access to
12
information, control, and safety. However, the BSE is very small by international standardsand the dynamic development of the second part of the 1990s was broken by unfavorableconditions. Over the last 1,5 –2 years the BUX has been stagnating discouraging potentialinvestors.
As Szerb and Ulbert (2002) pointed out, the companies in the BSE do not represent the topHungarian ventures. In 1998, out of the largest 50 Hungarian companies, only 9 were in theBSE. Moreover, Hungarian companies have not relied on the BSE when they wanted to raisecapital. Over 10 years, the amount of capital raised on the BSE has been only $510 million, alittle bit more than 3 percent the market capitalization (about $15,7 billion in 2000). Some ofthe companies, mainly with foreign ownership, obtained additional resources from the “parentcompany” – abroad – and/or went to the banks for credit or raised capital privately. MATAV,MOL and OPT, amongst the largest Hungarian companies have financed their growth fromretained earnings. Corporate bonds have not played an important role in the BUX.
Similar to the NASDAQ, there is another over the counter (OTC) market in Hungary. There isno limit or requirement to being traded on this other OTC, but brokerage firms trade only afew papers – e.g., compensation coupons and some bank shares - because of the high risk anduncertainty. There are no official data available about the OTC turnover, but it is consideredto be unimportant in the Hungarian financial market. The market is very illiquid and neitherbrokers nor investors like it.
4. Incentives and institutions supporting investment in new technologies
A country’s technological progress is closely related to innovation As Inzelt (2002) noted, theweak point of innovation in developing and transitional countries is the improper distributionof scientific knowledge. The innovative performance of a country depends on the wholenational innovation system that can be defined as a set of knowledge institutions who interactwith one other. In this complex system there are collaborative efforts and interaction withother players like customers, suppliers, competitors, officials etc. Support for new technology,innovation, regional development, and entrepreneurship exists also in Hungary, but theinteraction is not integrated.
In this part of the study, we focus on three issues. First, the bases of new technology, such asinvestment and R&D support are analyzed. Second, new technology support by the state isinvestigated. Third, entrepreneurship and new business creation, as the main source ofinnovation is studied.
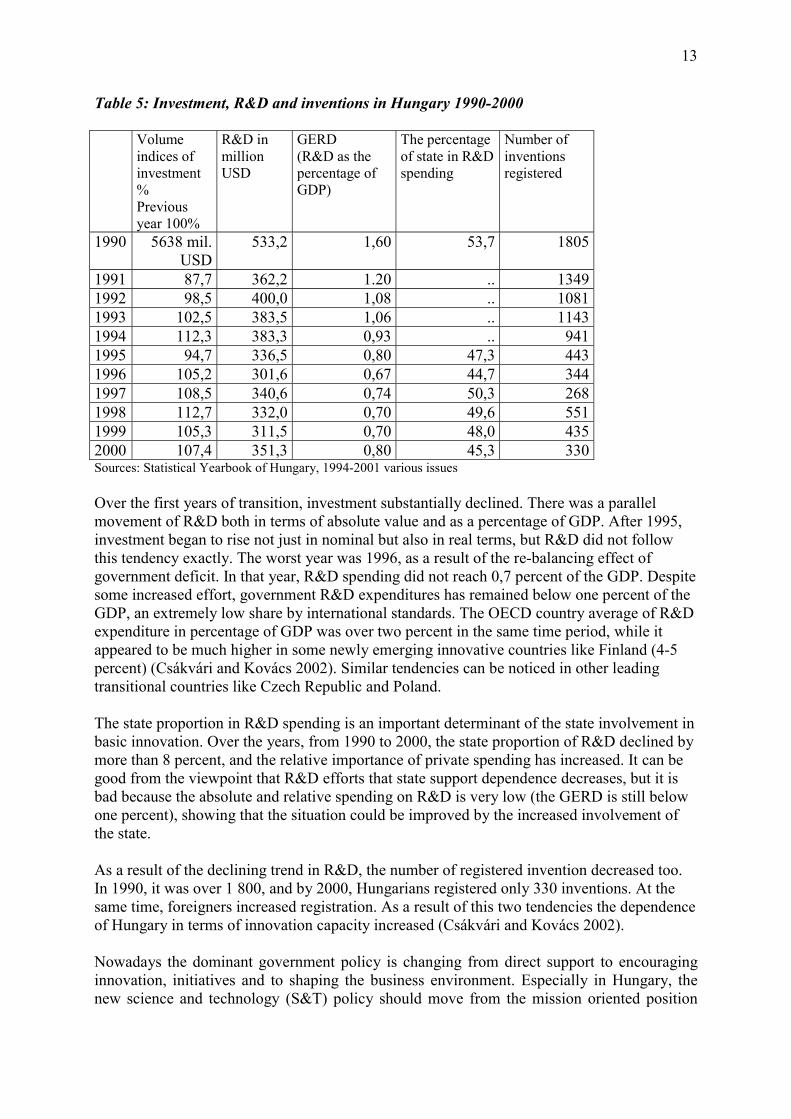
Table 5 shows the basic trends of investment R&D and registered inventions in the timeperiod of 1990-2000.
13
Table 5: Investment, R&D and inventions in Hungary 1990-2000
Volumeindices ofinvestment%Previousyear 100%
R&D inmillionUSD
GERD(R&D as thepercentage ofGDP)
The percentageof state in R&Dspending
Number ofinventionsregistered
1990 5638 mil.USD
533,2 1,60 53,7 1805
1991 87,7 362,2 1.20 .. 13491992 98,5 400,0 1,08 .. 10811993 102,5 383,5 1,06 .. 11431994 112,3 383,3 0,93 .. 9411995 94,7 336,5 0,80 47,3 4431996 105,2 301,6 0,67 44,7 3441997 108,5 340,6 0,74 50,3 2681998 112,7 332,0 0,70 49,6 5511999 105,3 311,5 0,70 48,0 4352000 107,4 351,3 0,80 45,3 330Sources: Statistical Yearbook of Hungary, 1994-2001 various issues
Over the first years of transition, investment substantially declined. There was a parallelmovement of R&D both in terms of absolute value and as a percentage of GDP. After 1995,investment began to rise not just in nominal but also in real terms, but R&D did not followthis tendency exactly. The worst year was 1996, as a result of the re-balancing effect ofgovernment deficit. In that year, R&D spending did not reach 0,7 percent of the GDP. Despitesome increased effort, government R&D expenditures has remained below one percent of theGDP, an extremely low share by international standards. The OECD country average of R&Dexpenditure in percentage of GDP was over two percent in the same time period, while itappeared to be much higher in some newly emerging innovative countries like Finland (4-5percent) (Csákvári and Kovács 2002). Similar tendencies can be noticed in other leadingtransitional countries like Czech Republic and Poland.
The state proportion in R&D spending is an important determinant of the state involvement inbasic innovation. Over the years, from 1990 to 2000, the state proportion of R&D declined bymore than 8 percent, and the relative importance of private spending has increased. It can begood from the viewpoint that R&D efforts that state support dependence decreases, but it isbad because the absolute and relative spending on R&D is very low (the GERD is still belowone percent), showing that the situation could be improved by the increased involvement ofthe state.
As a result of the declining trend in R&D, the number of registered invention decreased too.In 1990, it was over 1 800, and by 2000, Hungarians registered only 330 inventions. At thesame time, foreigners increased registration. As a result of this two tendencies the dependenceof Hungary in terms of innovation capacity increased (Csákvári and Kovács 2002).
Nowadays the dominant government policy is changing from direct support to encouraginginnovation, initiatives and to shaping the business environment. Especially in Hungary, thenew science and technology (S&T) policy should move from the mission oriented position
14
toward influencing collaboration and integration amongst the three dominant players,government-industry-universities. However, existing and recent government programmes areonly partially or not along this line. As Inzelt (2002) describes, recent priorities were tostimulate business demand for R&D, to encourage technology transfer, to promote newtechnology-devoted SMEs, and preserve and strengthen R&D capabilities.
Presently, there are several government programmes, and ways to support innovation,technological development and investments. For example, twenty percent of R&D spendingcan be deducted from company tax base, twelve percent of the investments in industrial parkscan also be deducted from the tax base. Foreign companies that set up a research laboratorywith over 30 researchers and invest over 500 million HUF can grant up to 25 percent of theinvestment. Direct support of investment up to 25 percent of the project could be receivedfrom the so called Széchenyi Plan, that was an ambitious development plan launched in 2000by the previous government. Moreover, ventures can receive several types of state subsidiesand credits, that are not directly aimed at technological innovation but indirectly involve it.Just to mentione a few: Development and Innovation Programme, Microcredit Programme forsmall, early phase enterprises, Enterprise Promotion Programme, Regional EconomicConstructions Programme etc. Now, the new government wants to change the priorities inaccordance to the requirements of European Union accession
The effectiveness of direct government spending is questionable. In one of a rare studies inthis area, Futó (2001) examines the 57 government supported innovation projects in the SMEsector. Only 35 percent of the projects were in the high tech sector, other innovations realisedmainly in the low tech machinery and agriculture. Most of the firms aimed both product andtechnology development. The support was positive mainly for the venture itself, however,diffusion of innovation affected other players only partially, except co-operation withpartners and customers. Most of the ventures (56 percent) increased their revenues but theeffect on employment was mixed, and did not increase hiring significantly.
Several public and private institutions exist to support innovation and technologicaldevelopment in Hungary. The Research and Development Division of the Ministry ofEducation is the main managing and coordinating body of research and developmentprogrammes of the government. Amongst others, one of its major aims is to stimulatetechnological modernisation. The Hungarian Patent Office’s role is the protection ofintellectual property, the Hungarian Centre for Productivity Public Foundation wasestablished to implement technical development policy. Two major initiatives are technologytransfer programmes and the benchmarking services. Investment and trade developmentinstitutions just related only partially to technological innovations. Hungarian Investment andTrade Development Company (ITD-Hungary) stimulates investment, trade, and enterprisedevelopment. Its operation includes maintenance of Euro-Info centres with purpose ofassisting SMEs in their preparation to EU accession. (State of small...2001)
Over the last few years, university research and research centres have been established toovercome the weakest link in the Hungarian innovation, that is university industry co-operation. The effect of the newly founded research centre at the Hungarian TechnologicalUniversity on the knowledge economy was investigated by Dévai and Borsi (2000). Theinitial results were positive regarding education, but unfortunately the industry relation of theuniversity did not improve significantly.
15
The are other institutions and organisations supporting new technology initiatives. Innovationcentres and incubators provide a solution for an increasing number of technology orientedbusinesses start-ups, but they exist only in a few places like Budapest (INNOCENTRE),Székesfehérvár and Győr.
One of a major private institution that supports technology related innovation is theHungarian Venture Capital and Private Equity Association. They issue a yearbook and aquarterly newsletter to spread information and to assist mainly venture capitalists, businessangels and potential investee companies. Another world-wide organisation, First Tuesday isalso present in Hungary. First Tuesday is a meeting place for investors and business people inhigh tech and new economy sectors.
Besides research and supporting institutions of technology and innovation we should alsodiscuss about business creation and entrepreneurship. Entrepreneurship is meant here in thesense of Schumpeter, i.e., the creation of something new. Therefore, entrepreneurship isclosely linked to innovation. (Szerb and Ulbert 2002). The regular Global EntrepreneurshipMonitor (GEM) compares and investigates the effect of incumbent and newly foundedbusinesses on economic development. One of the major advances of the 2001 report is theseparation of opportunity and necessity entrepreneurship. The study observes a closerelationship between research and technological development (RTD) and opportunityentrepreneurial activity. While in some sectors, large enterprises play a dominant role inR&D, in some other sectors high tech start-ups dominate (Reynolds at al 2001). Therefore,the support of new venture creation and opportunity entrepreneurship can be important for acountry’s growth, wealth creation and technological development.
Based on the 2001 GEM Report, Hungary ranked second in Europe in terms of TotalEntrepeneurial Activity3 as well as opportunity entrepreneurship, after Ireland and rankedeights in the world. As opposed to the early years of economic transition when necessityentrepreneurship was dominant, by 2001 almost 70 percent of young and incumbententrepreneurs claimed that they want to start a business because of good opportunities in theeconomy. Regarding the entrepreneurial activity Hungary is more similar to other developednations in the European Union then developing countries.
For a country, not only the new business creation but also the survivability of the newbusinesses can be important. Decreasing the mortality rate of new businesses can be animportant role of governmental and other institutions. As we presented in the previouschapter, one of the major problems of Hungarian businesses is finance, both equity anddebt financing. Unfortunately, the recently launched government programs have not beeneffective in supporting existing SMEs and have not promoted entrepreneurship and newbusiness creation (B.K. 2001).
3 Total Entrepreneurial Activity index is calculated as the percentage of the sample want to start a business(incumbent entrepreneur) and having a business aged less than 42 month.
16
5. The Venture Capital Case Study
5.1 Background to the Venture Capital industry in Hungary
In Hungary, venture capital emerged first at the end of the 1980s, but did not play a major roleuntil the mid 1990’s. By 1996, the total investment of the 25 members of the HungarianVenture Capital Association (HVCA) exceeded 250 million USD, but only 52 percent of theavailable capital was used. According to the Hungarian Venture Capital Association, by 1998the available venture capital was about 1,2 billion USD and out of this 760 million waseffectively invested. Increased activity of foreign investors characterized the second part ofthe 1990s: in 1995, domestic venture capital funds amounted to 70 percent of VC investment.By 1998, foreign venture capitalist supplied about 350 million USD (46 percent) of venturecapital investment, and the Hungarian state (mainly via the Hungarian Development Bank,HDB) supplied about one third of it. Domestic private investors had less than 25 percent ofthe investment (Hungarian Venture Capital Association Yearbook 1999). Over the last threeyears the domestic proportion of transactions have been stabilizing at around half of the deals(Hungarian Venture Capital Association Yearbook 2001). Meanwhile, international dealshave increasing counting about a third of the total transactions. At the same time, Hungarianventure capital funds (e.g. Corvinus) are more interested in foreign investments mainly inneighboring countries like Romania, Slovakia and Ukraine.
The amount of the invested venture capital in Hungary is not known exactly. Halaska –Kovács (1999) reported, that venture capitalists invested 300-500 million USD in Hungarianbusinesses between 1995-1999. Increased activity was mainly due to foreign regional funds.Karsai – Rácz (2000) claimed that by 2000, the invested venture capital exceeded 1 billionUSD. Another study (B.I. 2001) stated that total venture capital investment was about 800million USD by the end of 2000 and this is about the same amount that the HVCA estimates(Hungarian Venture Capital Association Yearbook 2000). If we add the 64 million USDinvestment that happened in 2001 (Hungarian Venture Capital Association Yearbook 2001),then the estimated total amount of venture capital investment was about 860-1000 millionUSD, probably closer to the lower than the upper limit.
There is an even less reliable estimate that we can make regarding the number of companiesreceiving venture capital injection. Over the last three years (1999-2001) there were 87 deals,but many of them were second or third round investment to the same company. Based onpersonal interviews with venture capital experts, the number of companies receiving venturecapital is about 200-450 up to 2002. We should note again, that there is no exact dataavailable regarding the above number.
Several studies (e.g. Ludányi 2001a, Karsai 1999) claimed that the Hungarian venture capitalmarket was the most attractive amongst transitional countries in the second half of the 1990s.In 1996, the USD 350 million venture capital investment reached 0,8 percent in the HungarianGDP that was higher then in some developed or European Union counties. According to arecent investigation by the Global Entrepreneurship Monitor (GEM) (Reynolds et al 2001)research, the average of the 24 GEM country venture capital investment was about 0,5 percentof the GDP, and was less than 0,1 percent of the GDP in the case of Hungary. If we comparethe results of the two different time period, we can conclude that relative to the other part ofthe world, the venture capital market in Hungary has declined. In other words, the renewal ofthe venture capital market, mainly in the US in the late 1990s, had a limited effect on the
17
Hungarian venture capital market. It can be seen, that positive world market events affectHungary with certain lag: 2000 was an exceptionally good year in Hungary. However, badevents hit Hungary very quickly: the further development of the venture capital market washalted by the collapse of the major new economy companies at the end of 2000.
In order to encourage new venture capital formation the Hungarian Parliament passed theVenture Capital Act (VCA, Act XXXIV. of 1998), the first in the Central-Eastern Europeanregion. Domestic companies and funds registered under the VCA have to be licensed by theState Money and Capital Market Commission (SMCMA). The amount of subscribed capitalhas to be over 500 million HUF (around 200 000 EURO), and the VCA describes thedocumentation that is necessary to submit to the SMCMA, including the Deed of Foundationand the Rules of Organisation and Operation. In exchange the VCA provides tax allowancesand potential collection of the funds from the public.
Unfortunately, over the three years there is only two companies receiving permission toregister under the VCA, but presently non of them operates under the VCA This data showthat the law has had a marginal effect on the Hungarian capital market. The main reason forthe fail of the VCA is associated with the strict rules on investment. Experts agree that theVCA, in its present form, is over-regulated, and the rigid requirements do not compensate forthe tax allowances (Karsai –Rácz 2000, B.I. 2001)
5.2 Investment profile
Besides the regularly published yearbooks of the Hungarian Venture Capital Association,there have been only a few major empirical studies about the role and the profile of venturecapital in Hungary: Karsai (1999), Lemák (2000) and Ludányi (2001a, 2001b). Before 1995,the Hungarian state dominated in the venture capital industry, and the main type of transactionwas turnaround investment and MBOs. After 1995, foreign investors took the leading role.Investigating the characteristics of venture capital investment in 1996-1997, Karsai (1999)found that venture capital investments mostly concentrated on medium and large enterprises.The average amount of investment was about two times more than the European Unionaverage (in 1996: 2,6 million ECU to 1,01 million ECU, in 1997 5,07 million ECU to 1,81million ECU). Venture capitalists decreased the high risk by investing in larger companies.Ninety percent of the total investment focused on the expansion phase (development capital).Turnaround businesses constituted half of the financing and seed capital was completely zero.Although, MBO played an important role before 1995, it presented only 4 percent of theinvestment in 1999. Lemák (2000) reported that foreign regional funds became the mainventure capital investors in Hungary by 2000.
International capital movements highly influenced Hungarian venture capital investment. In1997, capital withdrawal was higher than new investment. Before 1998, venture capitalistswere interested in services, machinery, food industry and information technology sectors.Since 1999, interest in high tech enterprises, e.g., information technology, software firms,telecommunication firms associated with internet and biotechnology type of businesses hasbeen rising.
The following two tables present the main characteristics of venture capital investment interms of the amount of investment and the stage of investment in 2000-2001. We have exactdata on industry-wise investment only for 2000.
18
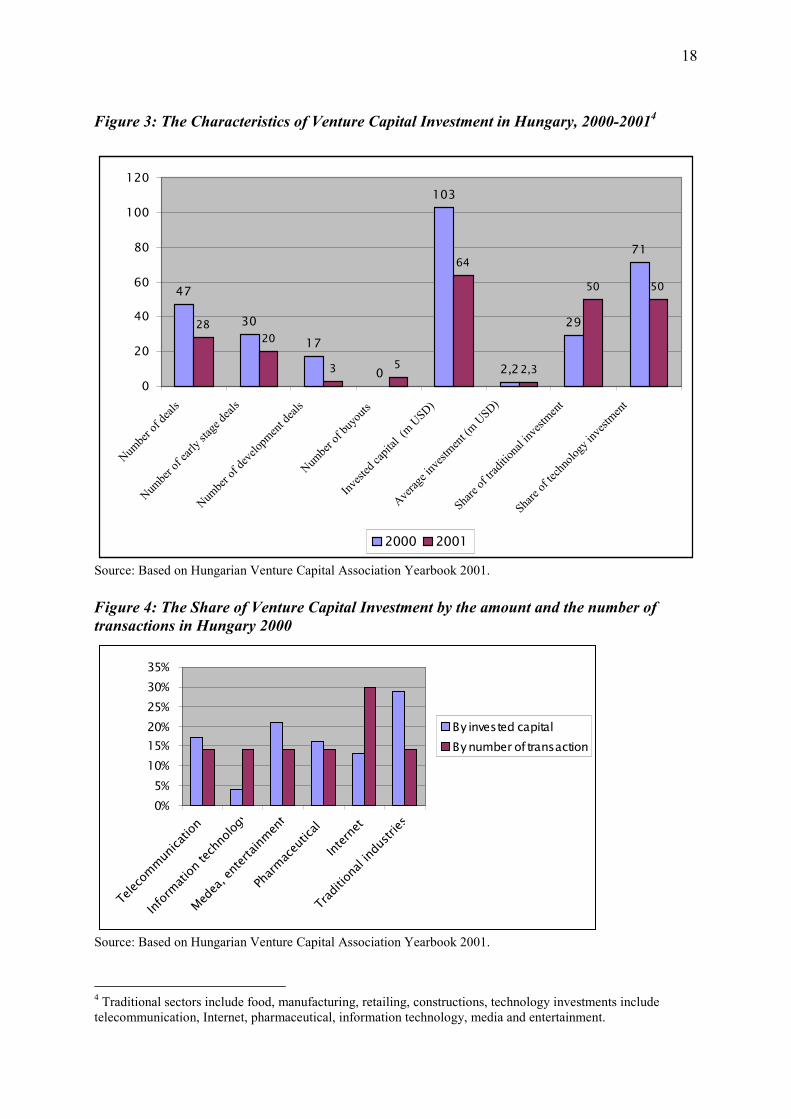
Figure 3: The Characteristics of Venture Capital Investment in Hungary, 2000-20014
Source: Based on Hungarian Venture Capital Association Yearbook 2001.
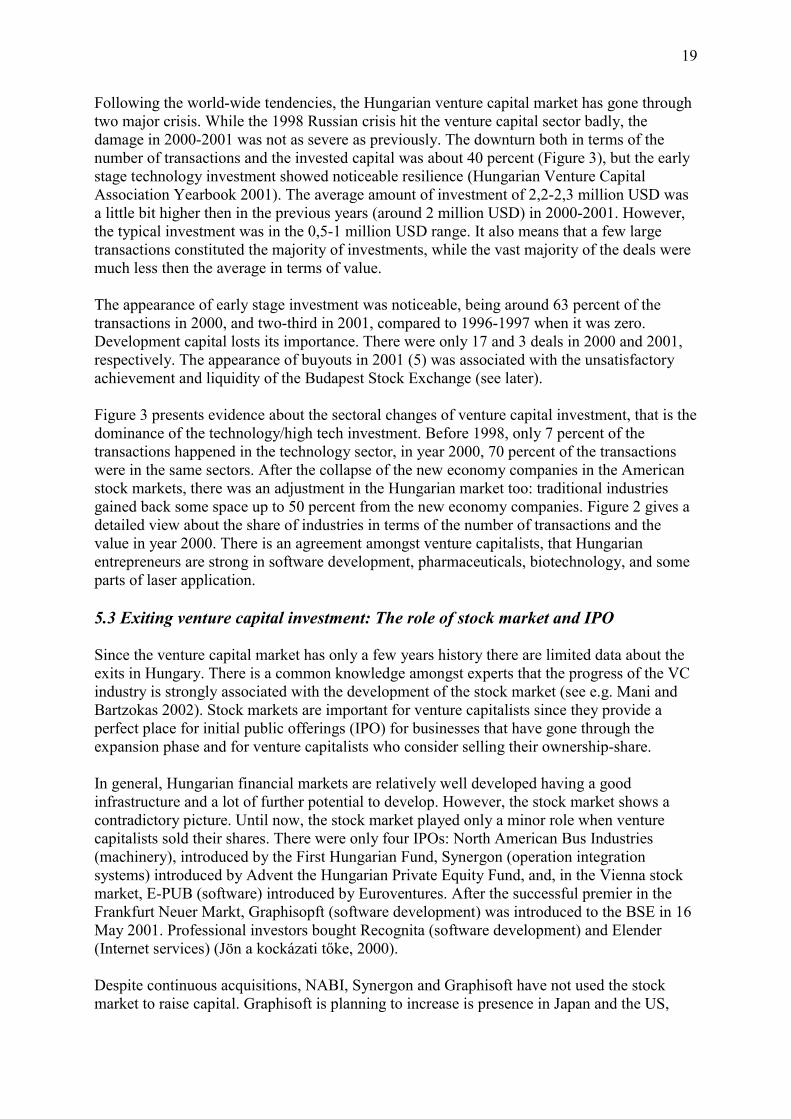
Figure 4: The Share of Venture Capital Investment by the amount and the number oftransactions in Hungary 2000
Source: Based on Hungarian Venture Capital Association Yearbook 2001.
4 Traditional sectors include food, manufacturing, retailing, constructions, technology investments includetelecommunication, Internet, pharmaceutical, information technology, media and entertainment.
0%5%
10%15%20%25%30%35%
Telec
ommun
icatio
n
Infor
mation
tech
nolog
y
Medea
, ente
rtainm
ent
Pharm
aceu
tical
Intern
et
Trad
itiona
l indu
stries
By invested capitalBy number of transaction
47
30
17
0
103
2,2
29
71
2820
3 5
64
2,3
50 50
0
20
40
60
80
100
120
Numbe
r of d
eals
Numbe
r of e
arly s
tage d
eals
Numbe
r of d
evelo
pmen
t deal
s
Numbe
r of b
uyou
ts
Invest
ed ca
pital
(m U
SD)
Averag
e inv
estmen
t (m U
SD)
Share
of tra
dition
al inv
estmen
t
Share
of tec
hnolo
gy in
vestm
ent
2000 2001
19
Following the world-wide tendencies, the Hungarian venture capital market has gone throughtwo major crisis. While the 1998 Russian crisis hit the venture capital sector badly, thedamage in 2000-2001 was not as severe as previously. The downturn both in terms of thenumber of transactions and the invested capital was about 40 percent (Figure 3), but the earlystage technology investment showed noticeable resilience (Hungarian Venture CapitalAssociation Yearbook 2001). The average amount of investment of 2,2-2,3 million USD wasa little bit higher then in the previous years (around 2 million USD) in 2000-2001. However,the typical investment was in the 0,5-1 million USD range. It also means that a few largetransactions constituted the majority of investments, while the vast majority of the deals weremuch less then the average in terms of value.
The appearance of early stage investment was noticeable, being around 63 percent of thetransactions in 2000, and two-third in 2001, compared to 1996-1997 when it was zero.Development capital losts its importance. There were only 17 and 3 deals in 2000 and 2001,respectively. The appearance of buyouts in 2001 (5) was associated with the unsatisfactoryachievement and liquidity of the Budapest Stock Exchange (see later).
Figure 3 presents evidence about the sectoral changes of venture capital investment, that is thedominance of the technology/high tech investment. Before 1998, only 7 percent of thetransactions happened in the technology sector, in year 2000, 70 percent of the transactionswere in the same sectors. After the collapse of the new economy companies in the Americanstock markets, there was an adjustment in the Hungarian market too: traditional industriesgained back some space up to 50 percent from the new economy companies. Figure 2 gives adetailed view about the share of industries in terms of the number of transactions and thevalue in year 2000. There is an agreement amongst venture capitalists, that Hungarianentrepreneurs are strong in software development, pharmaceuticals, biotechnology, and someparts of laser application.
5.3 Exiting venture capital investment: The role of stock market and IPO
Since the venture capital market has only a few years history there are limited data about theexits in Hungary. There is a common knowledge amongst experts that the progress of the VCindustry is strongly associated with the development of the stock market (see e.g. Mani andBartzokas 2002). Stock markets are important for venture capitalists since they provide aperfect place for initial public offerings (IPO) for businesses that have gone through theexpansion phase and for venture capitalists who consider selling their ownership-share.
In general, Hungarian financial markets are relatively well developed having a goodinfrastructure and a lot of further potential to develop. However, the stock market shows acontradictory picture. Until now, the stock market played only a minor role when venturecapitalists sold their shares. There were only four IPOs: North American Bus Industries(machinery), introduced by the First Hungarian Fund, Synergon (operation integrationsystems) introduced by Advent the Hungarian Private Equity Fund, and, in the Vienna stockmarket, E-PUB (software) introduced by Euroventures. After the successful premier in theFrankfurt Neuer Markt, Graphisopft (software development) was introduced to the BSE in 16May 2001. Professional investors bought Recognita (software development) and Elender(Internet services) (Jön a kockázati tőke, 2000).
Despite continuous acquisitions, NABI, Synergon and Graphisoft have not used the stockmarket to raise capital. Graphisoft is planning to increase is presence in Japan and the US,
20
Synergon aims to gain a regional market leading position. In both cases the companies reliedon retained earnings. NABI has relied on bank loans in its external growth financing in theUS and Great Britain.
The development of the BUX was broken in 1998 and in 2001 and by now even theindependent existence of the Budapest Stock Exchange is questioned. The capitalization ofthe BSE is small, the annual turnover equals about the two days’ turnover of the 30 largestcompanies traded in Frankfurt. Instead of new IPOs, companies are leaving the stock marketand this is definitely not a good news for venture capitalists that plan to sell their shares on theBSE. The buyouts in 2001 were associated with the removal of these 5 companies from theBSE.
The limited use of the stock market as an exit route by the venture capitalist is also evidencedin Karsai (1999). Between 1995 and 1998, IPOs constituted only seven percent of the exits(four percent in terms of value), while trade sales amounted 57 percent (45 percent in terms ofvalue), and other methods (repurchase, and refinancing) mounted up to the remaining 36percent (52 percent in terms of value). It is interesting that there was no involuntary exit in thesame time period – or the venture capitalist did not reveal them (Lemák 2000).
In another empirical study about Hungarian venture capital investments and investors,Ludányi (2001b) claimed that the preferred exit method of most of the investors was tradesale. On the contrary, state owned venture capital companies favoured to sell their shares tothe fellow owners, who were most of the times the entrepreneur itself (repurchase). Duringthe procedure of trade sale domestic venture capitalists strive to sell their shares fully.Potential buyers are mainly domestic and foreign strategic investors who had no ownership inthe investee company before the exit. We have exact data on exits only for year 2000, whenout of the 10 exits 6 were trade sales, two IPOs and 2 other (repurchase, refinancing). Therewere no reported involuntary exits.
As a consequence of the major problems of American new economy companies, investors ofthe Internet and high tech sectors in Hungary have been trying to get rid of their investments.However, under unfavourable conditions, the only way of exit is to sell the ownership back tothe entrepreneur, otherwise the venture capitalist has to write off the whole invested capital.As a consequence, some Hungarian entrepreneurs had a very good chance to buy back fully orpartially the business at a very limited price (Elszállt a kedvük 2002). While it looks aprofitable deal for the entrepreneurs who could gain a lot in a short run, decreased activity offuture investors can hurt the development of the Hungarian new economy in a long run.
5.4. The selection and the profile of the interviewed venture capital companies
As presented earlier, the Hungarian venture capital market is relatively small: in 2000, therewere about 35 active venture capital funds and there were 25 VC members of the HungarianVenture Capital Association (HVCA). Table 6, below, shows some basic statistics about theinvestment profile of these VC companies.
21
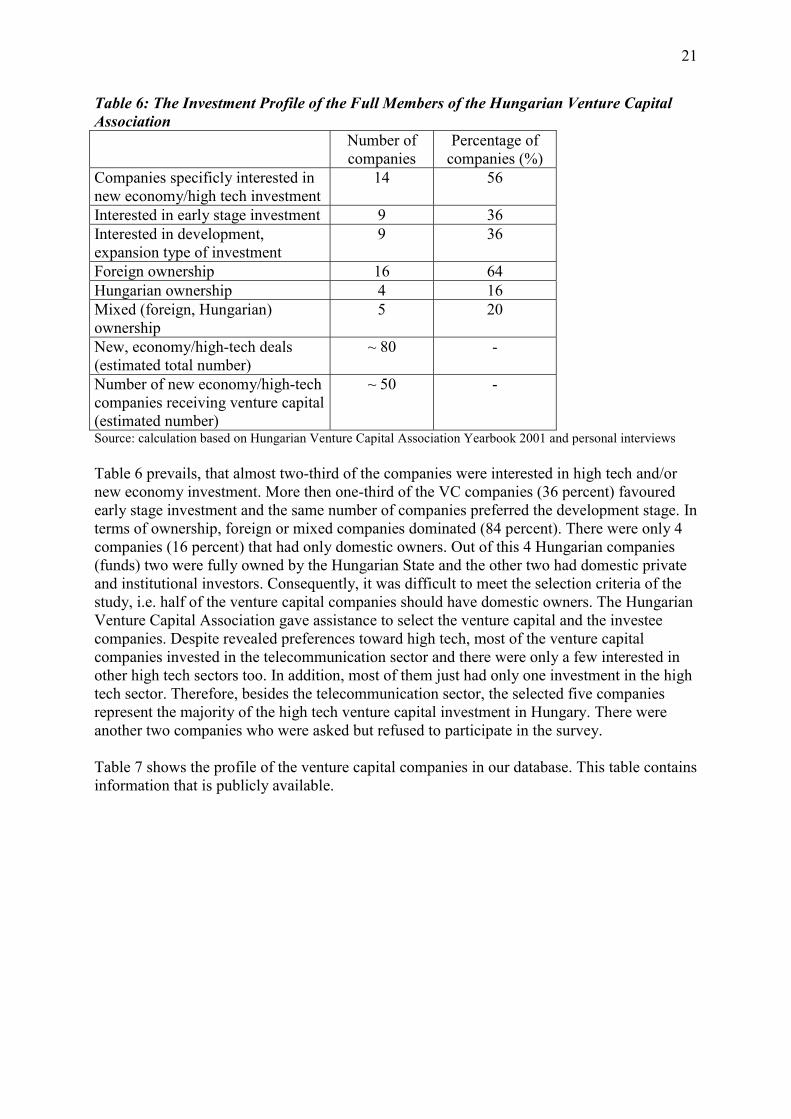
Table 6: The Investment Profile of the Full Members of the Hungarian Venture CapitalAssociation
Number ofcompanies
Percentage ofcompanies (%)
Companies specificly interested innew economy/high tech investment
14 56
Interested in early stage investment 9 36Interested in development,expansion type of investment
9 36
Foreign ownership 16 64Hungarian ownership 4 16Mixed (foreign, Hungarian)ownership
5 20
New, economy/high-tech deals(estimated total number)
~ 80 -
Number of new economy/high-techcompanies receiving venture capital(estimated number)
~ 50 -
Source: calculation based on Hungarian Venture Capital Association Yearbook 2001 and personal interviews
Table 6 prevails, that almost two-third of the companies were interested in high tech and/ornew economy investment. More then one-third of the VC companies (36 percent) favouredearly stage investment and the same number of companies preferred the development stage. Interms of ownership, foreign or mixed companies dominated (84 percent). There were only 4companies (16 percent) that had only domestic owners. Out of this 4 Hungarian companies(funds) two were fully owned by the Hungarian State and the other two had domestic privateand institutional investors. Consequently, it was difficult to meet the selection criteria of thestudy, i.e. half of the venture capital companies should have domestic owners. The HungarianVenture Capital Association gave assistance to select the venture capital and the investeecompanies. Despite revealed preferences toward high tech, most of the venture capitalcompanies invested in the telecommunication sector and there were only a few interested inother high tech sectors too. In addition, most of them just had only one investment in the hightech sector. Therefore, besides the telecommunication sector, the selected five companiesrepresent the majority of the high tech venture capital investment in Hungary. There wereanother two companies who were asked but refused to participate in the survey.
Table 7 shows the profile of the venture capital companies in our database. This table containsinformation that is publicly available.
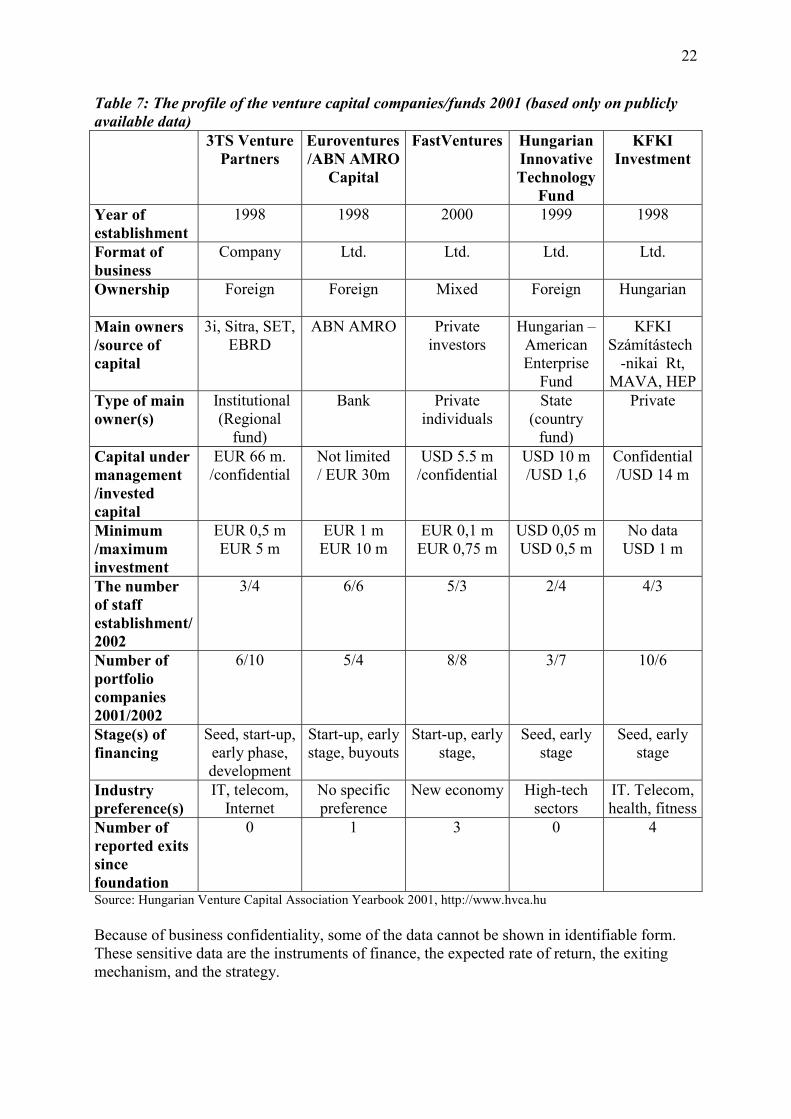
22
Table 7: The profile of the venture capital companies/funds 2001 (based only on publiclyavailable data)
3TS VenturePartners
Euroventures/ABN AMRO
Capital
FastVentures HungarianInnovativeTechnology
Fund
KFKIInvestment
Year ofestablishment
1998 1998 2000 1999 1998
Format ofbusiness
Company Ltd. Ltd. Ltd. Ltd.
Ownership Foreign Foreign Mixed Foreign Hungarian
Main owners/source ofcapital
3i, Sitra, SET,EBRD
ABN AMRO Privateinvestors
Hungarian –AmericanEnterprise
Fund
KFKISzámítástech
-nikai Rt,MAVA, HEP
Type of mainowner(s)
Institutional(Regional
fund)
Bank Privateindividuals
State(country
fund)
Private
Capital undermanagement/investedcapital
EUR 66 m./confidential
Not limited/ EUR 30m
USD 5.5 m/confidential
USD 10 m/USD 1,6
Confidential/USD 14 m
Minimum/maximuminvestment
EUR 0,5 mEUR 5 m
EUR 1 mEUR 10 m
EUR 0,1 mEUR 0,75 m
USD 0,05 mUSD 0,5 m
No dataUSD 1 m
The numberof staffestablishment/2002
3/4 6/6 5/3 2/4 4/3
Number ofportfoliocompanies2001/2002
6/10 5/4 8/8 3/7 10/6
Stage(s) offinancing
Seed, start-up,early phase,development
Start-up, earlystage, buyouts
Start-up, earlystage,
Seed, earlystage
Seed, earlystage
Industrypreference(s)
IT, telecom,Internet
No specificpreference
New economy High-techsectors
IT. Telecom,health, fitness
Number ofreported exitssincefoundation
0 1 3 0 4
Source: Hungarian Venture Capital Association Yearbook 2001, http://www.hvca.hu
Because of business confidentiality, some of the data cannot be shown in identifiable form.These sensitive data are the instruments of finance, the expected rate of return, the exitingmechanism, and the strategy.
23
Establishment All of this funds were established after 1998 or later up to 2000. Thefoundation was strongly associated with two events. First, due to the Russian crisis, some ofthe venture capital investments lost completely that made venture capitalists very careful withtraditional industries. Second, the boom of the new economy sectors in the US and EU had apositive effect on new venture capital company and fund establishment. Four out of the fivecompanies had a strong preference toward the new economy/high tech sectors.
Business format The venture capital companies prefer the limited liability company formatthat is easier to establish then a company (limited by shares) and easier to maintain the closerelationship of the owners.
Ownership- regional focus Amongst the selected companies, all of the four main types ofownership forms can be found. Institutional (regional and country funds), banks, private andstate ownership. The two largest venture capital companies are in foreign hands, and only oneof them had a clear Hungarian ownership. As it has been shown previously, this data setrepresents the Hungarian venture capital market very well regarding ownership. Theownership form is closely related to the regional focus. The three foreign companies also hadinvestments in other countries besides Hungary. 3TS had offices in Budapest, Prague andWarsaw. Euroventures clearly prevailed its international regional strategy focus to Centraland Eastern Europe. Moreover, as a part of ABN AMRO Capital, Euroventures belong to aninternational network having several offices all around the world from Chicago, LondonWarsaw and Budapest, just mentioning only a few. Three out of ten investments of HITFwere in other Central Europen countries. The remaining two companies Fastventures andKFKI had investments only in Hungary.
Within Hungary, all the five companies had the office in Budapest, the capital of Hungary.Budapest and Pest county represents more then fifty percent of the GDP in Hungary. In termsof Foreign Direct Investment (FDI) the share of the Budapest region is even larger, aroundeighty percent. So, it is not a surprise that most of the venture capital investments especiallyin the high tech sector goes to Budapest or Pest county. However, there are some venturecapital investments in the countryside: we should highlight Szeged, a major city close to theYugoslavian border, that looks to become an important centre in biotechnology.
There was only one change out of the five companies regarding ownership. Euroventuresinitially was owned by the present management and was acquired by ABN AMRO: in 1999.Since then the company is a part of ABN AMRO Capital, and the management has beenparticipating in venture capital as well as other private equity programmes of ABN AMRO.
Size – capital under management In terms of the size of the venture capital companies, thereis high variation: 3TS Venture and Euroventures/ABN AMRO Capital are large even byinternational standards, while 2 companies are much smaller having USD 5-10 million capitalunder management. We do not know the KFKI’s capital, but they already invested USD 14million, most of their available capital, so the capital under management is around USD 15million. The average size of the companies in our data set is much higher than it was a yearbefore: Ludányi (2001a) stated that capital under management in the range of USD 5-15million was missing from the Hungarian market. The three, relatively small, venture capitalcompanies (Fasventures, HITF, KFKI) raised the capital considerable over a year showingtheir interest toward further investments.
24
Size – investment The deals are in USD 0,05 - 5 million, with one exception ofEuroventures/ABN AMRO Capital except deals up to EUR 10 million. In the case of threeout of five companies, this range is much lower than the average investment in Hungarybefore 1998 (more then USD 1 million). However, it should be noted that venture capitalcompanies are trying to invest rather close to the upper than to the lower limit.
Size – staff The average number of staff was 4 at the time of investment and also in 2002.However, the venture capital companies that increased the number of companies in theportfolio employed more expert while Fasventures’ staff decreased by two and KFKI’s by onemanager. The number of staff at the venture capital company was not known exactly becauseof the varied participation of the owners. If there was a need – e.g. new companies, crisis,expansion etc. – some of the founders spent more time at the venture capital company whilein the case of shrinking portfolio and tasks they were less active.
Out of the five companies, Euroventures had the largest staff but the smallest portfolio. Thereason of this fact was that the experts handle not only the Euroventures funds but alsoparticipated in other equity businesses of the main owner, ABN AMRO. It was estimated thatabout 2-3 persons dealt with venture capital investments.
The portfolio – industry and stage preference The number of portfolio companies varies from3 to12 averaging at 6,8 in 2000 and 7 in 2002. While 3TS and HITF increased the number ofinvestee companies, KFKI’s porfolio become smaller. Euroventures replaced some of thecompanies with others, but portfolio was the same in terms of the number of companies.Euroventures’ portfolio has decreased by one, but they are launching new investmentspresently.
We should note that the average investment is much lower at the companies that have largernumber of firms in their portfolio. There is also a potential overlap in the portfolios sinceventure capital companies in the high tech frequently prefer co-investments in order todecrease and spread risk.5 Similar to other high-tech/ new economy investors, our companiesprefer early stage and/or seed capital investments and except one, have a strong preferencetoward the new economy sectors.
All of the five venture capital companies preferred minority ownership, one of them prefersqualified minority (ownership over 33 percent). All of the companies use capital stock as amain instrument of financing. Minority rights are protected by co-sale – mostly tag along -rights and shares that have specific rights (preferred shares). Two of the companies refuse touse ownership loans, and three of them rely on transferable bonds. It is commonly believedthat loans are not a proper way of financing firms by venture capitalists. Stock option plansare used by one company, that is not a surprise considering the situation of the Hungarianstock market.
Exits – exit strategies Regarding exits, all of the five companies would prefer the stock market(IPO) when they want to harvest the investment. However, the present situation of theBudapest Stock Exchange (BSE) did not make IPOs attractive. As an alternative, one of thecompanies tried to sell the ownership back to the entrepreneur (repurchase) the otherspreferred professional strategic investors (trade sales). Since this later method was very timeconsuming because of the limited number of potential buyers, venture capitalists were very 5 Co-investment or syndicate investment was not a preferred way by venture capitalists before 1998 (Ludányi2001b)
25
careful, and they rather postpone of or cancelled their new investment if they were not sure ofthe exit conditions. Actual data on exits showed that there were two companies out of fivewith a larger number of exits: Fastventures had 3 (and one partial) and KFKI had 4 exist. Wehave no data on the exit method but it probably did not different what we had already statedpreviously: trade sales and repurchase dominated while IPO was zero. At the same timeperiod, two other venture capital companies – 3TS Ventures and HITF - considerablyincreased the number of portfolio companies. Therefore the number of investee companies didnot change in the data set between 2000-2002 It also means that different venture capitalistsexhibit different exit strategies:
� a group that waits with the exit for the proper and/or better time and does not want to getrid of the investment in the case of crisis.
� another group exits much quicker and leaves the investee companies when there is no signof recovery in a short run (in a year)
Both strategies have advantages and disadvantages:. The insistence on the portfolio companycan cause problems if the situation becomes worse and the loss can be even larger, butsometimes a considerable amount of extra investment is necessary even to keep the investeecompany alive. On the other hand, the too rapid adjustment can result in a loss of a potentiallygood investment. The reason behind the two strategies is the different expectations regardingthe recovery of the new economy. We have seen that some foreign new economy companieshave sold their Hungarian interests to be able to focus on solving domestic problems.
One of Euroventures fund was amongst a few in the region that finished a full circle ofventure capital with an average twenty percent yearly yield in 2000. As the company reported(Regional Investment Strategies 2000) the majority of the portfolio of ten companies provedto be successful businesses. Five out of this investee companies became a part of inter ormultinational companies, and two of them remain independent businesses under the newownership. There were two failures: as András Geszti reported, all the invested money –around a million USD - to Alfagrafix was completely lost to the last penny (Csabai 2002)Probably the remaining one investment were around the breakeven point.
Strategy – change of the strategy All of the venture capital companies were established underfavourable conditions in the new economy. When there was a boom in the high tech industry,venture capitalist poured the money to the new sector companies much less carefully thanpreviously. However, this was only partially true in Hungary where foreign investors weretraditionally more risk averse then in other developed countries. Table 8 below, serves topresent the most important changes in venture capital investment pre- and after 1998. Thebasis of comparison is based on Karsai (1999) who analysed the basic characteristics ofinvestment before 1998. Karsai’s finding are also compared to our venture capital company’scharacteristics.
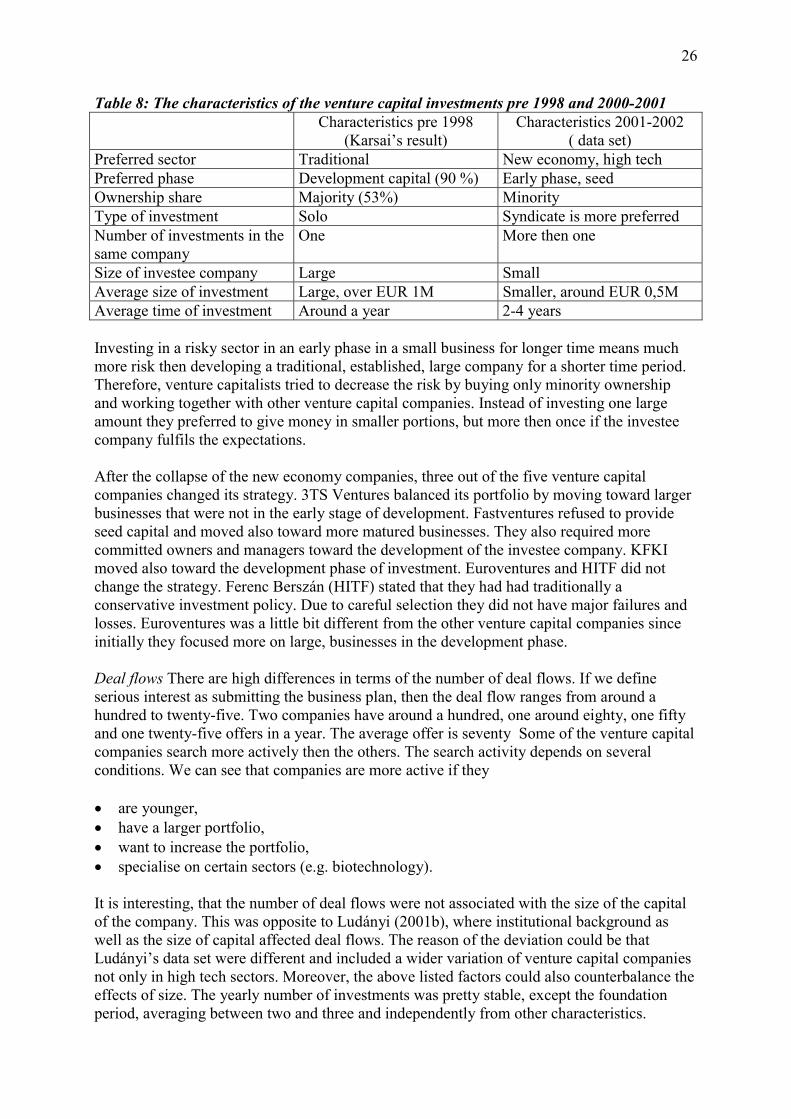
26
Table 8: The characteristics of the venture capital investments pre 1998 and 2000-2001Characteristics pre 1998
(Karsai’s result)Characteristics 2001-2002
( data set)Preferred sector Traditional New economy, high techPreferred phase Development capital (90 %) Early phase, seedOwnership share Majority (53%) MinorityType of investment Solo Syndicate is more preferredNumber of investments in thesame company
One More then one
Size of investee company Large SmallAverage size of investment Large, over EUR 1M Smaller, around EUR 0,5MAverage time of investment Around a year 2-4 years
Investing in a risky sector in an early phase in a small business for longer time means muchmore risk then developing a traditional, established, large company for a shorter time period.Therefore, venture capitalists tried to decrease the risk by buying only minority ownershipand working together with other venture capital companies. Instead of investing one largeamount they preferred to give money in smaller portions, but more then once if the investeecompany fulfils the expectations.
After the collapse of the new economy companies, three out of the five venture capitalcompanies changed its strategy. 3TS Ventures balanced its portfolio by moving toward largerbusinesses that were not in the early stage of development. Fastventures refused to provideseed capital and moved also toward more matured businesses. They also required morecommitted owners and managers toward the development of the investee company. KFKImoved also toward the development phase of investment. Euroventures and HITF did notchange the strategy. Ferenc Berszán (HITF) stated that they had had traditionally aconservative investment policy. Due to careful selection they did not have major failures andlosses. Euroventures was a little bit different from the other venture capital companies sinceinitially they focused more on large, businesses in the development phase.
Deal flows There are high differences in terms of the number of deal flows. If we defineserious interest as submitting the business plan, then the deal flow ranges from around ahundred to twenty-five. Two companies have around a hundred, one around eighty, one fiftyand one twenty-five offers in a year. The average offer is seventy Some of the venture capitalcompanies search more actively then the others. The search activity depends on severalconditions. We can see that companies are more active if they
� are younger,� have a larger portfolio,� want to increase the portfolio,� specialise on certain sectors (e.g. biotechnology).
It is interesting, that the number of deal flows were not associated with the size of the capitalof the company. This was opposite to Ludányi (2001b), where institutional background aswell as the size of capital affected deal flows. The reason of the deviation could be thatLudányi’s data set were different and included a wider variation of venture capital companiesnot only in high tech sectors. Moreover, the above listed factors could also counterbalance theeffects of size. The yearly number of investments was pretty stable, except the foundationperiod, averaging between two and three and independently from other characteristics.
27
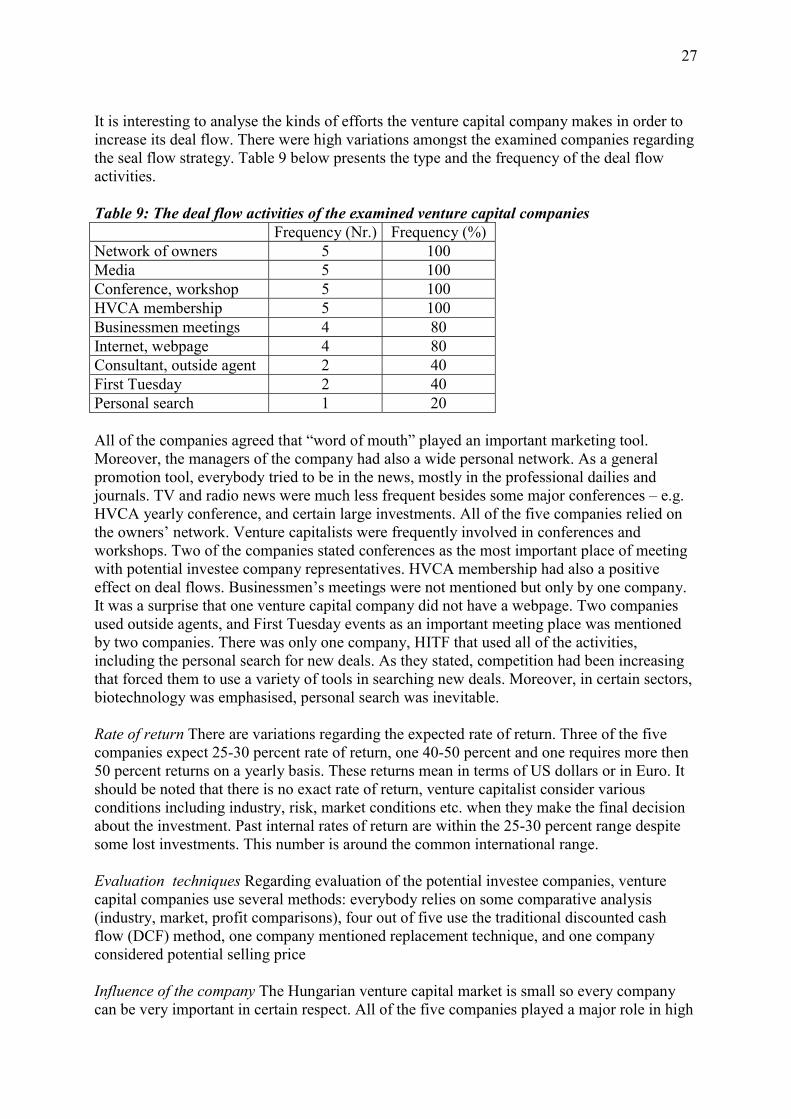
It is interesting to analyse the kinds of efforts the venture capital company makes in order toincrease its deal flow. There were high variations amongst the examined companies regardingthe seal flow strategy. Table 9 below presents the type and the frequency of the deal flowactivities.
Table 9: The deal flow activities of the examined venture capital companiesFrequency (Nr.) Frequency (%)
Network of owners 5 100Media 5 100Conference, workshop 5 100HVCA membership 5 100Businessmen meetings 4 80Internet, webpage 4 80Consultant, outside agent 2 40First Tuesday 2 40Personal search 1 20
All of the companies agreed that “word of mouth” played an important marketing tool.Moreover, the managers of the company had also a wide personal network. As a generalpromotion tool, everybody tried to be in the news, mostly in the professional dailies andjournals. TV and radio news were much less frequent besides some major conferences – e.g.HVCA yearly conference, and certain large investments. All of the five companies relied onthe owners’ network. Venture capitalists were frequently involved in conferences andworkshops. Two of the companies stated conferences as the most important place of meetingwith potential investee company representatives. HVCA membership had also a positiveeffect on deal flows. Businessmen’s meetings were not mentioned but only by one company.It was a surprise that one venture capital company did not have a webpage. Two companiesused outside agents, and First Tuesday events as an important meeting place was mentionedby two companies. There was only one company, HITF that used all of the activities,including the personal search for new deals. As they stated, competition had been increasingthat forced them to use a variety of tools in searching new deals. Moreover, in certain sectors,biotechnology was emphasised, personal search was inevitable.
Rate of return There are variations regarding the expected rate of return. Three of the fivecompanies expect 25-30 percent rate of return, one 40-50 percent and one requires more then50 percent returns on a yearly basis. These returns mean in terms of US dollars or in Euro. Itshould be noted that there is no exact rate of return, venture capitalist consider variousconditions including industry, risk, market conditions etc. when they make the final decisionabout the investment. Past internal rates of return are within the 25-30 percent range despitesome lost investments. This number is around the common international range.
Evaluation techniques Regarding evaluation of the potential investee companies, venturecapital companies use several methods: everybody relies on some comparative analysis(industry, market, profit comparisons), four out of five use the traditional discounted cashflow (DCF) method, one company mentioned replacement technique, and one companyconsidered potential selling price
Influence of the company The Hungarian venture capital market is small so every companycan be very important in certain respect. All of the five companies played a major role in high
28
technology venture capital investment in Hungary. 3TS was the first who specialised to thehigh tech sector. Euroventures/ABN AMRO is the largest investor with major internationalbackground and financial resources. Fastventures played a pioneering role in investing small,early phase high risk projects. Amongst the venture capital companies, HITF invested belowUSD 1 million first in the Hungarian market. KFKI was proud of its good reputation and itsmajor role in the Hungarian IT sector.
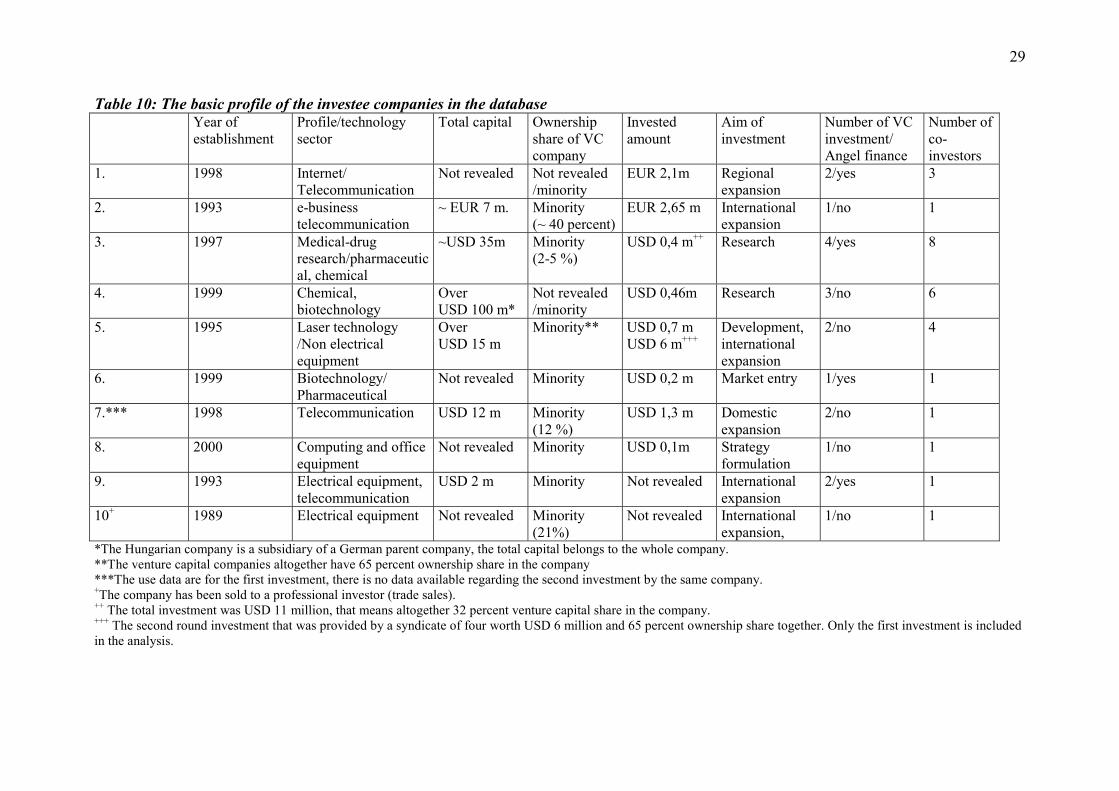
5.5. The selection and the profile of the investee companies in the data set
The estimated number of investee companies in the new economy segment is around 50,most of them received venture capital more then once. Out of this 50 companies 10 wereselected to our database (Table 10). The choice of the investee companies in the data set was amixed procedure of media news and venture capital company suggestions limited by therequirement that they should represent at least five high tech sectors.
Because of business confidentiality we do not provide the name of the company and itsconnection to the venture capital firm. Despite of guaranteed privacy, some of the sensitivedata were not revealed exactly. However, table 5 makes it possible to have an inside viewabout the Hungarian investments.Unlike the case of venture capital companies, there had not been any research regarding theinvestee firms in Hungary, so this is the first time when Hungarian investee company’s profileare analysed. It is not a surprise since most of these data are confidential, this is the reasonwhy we have some missing boxes in table 5. The most sensitive questions were related to theownership share and the capitalisation of the investee firm.
It was given initially that eight technology sectors – aerospace, computing and officeequipment, electronics and telecommunication, electrical equipment, non electricalequipment, scientific instruments, chemical and pharmaceutical – should be provided in theanalysis. The ten selected investee companies must have been represented at least five of theabove eight sectors. Since there is no aerospace sector in Hungary, only seven sectorsremained. It is not a surprise that three out of the ten companies are in the telecommunication,and two of them are in the pharmaceutical sectors. The electrical equipment sector isrepresented by two firms, and one company belongs to the non electrical equipment, one tothe computing and office equipment and one to the chemical sectors. However, we shouldnote that sometimes the company has mixed activities that make clear classification difficult.This is the reason why we have sometimes two sectors in one box.
Capitalisation of the firms – if data are available – shows high variations. The upper range isaround USD 100 million, a Hungarian subsidiary of an international company. (The venturecapital investment was used to support the research activity in Hungary.) The lowest range iscompany capitalisation of USD 2 million, that is a medium size company in Hungary.Company 1 is probably larger than USD 5 million, and company 10 is probably below theUSD 2 million capital value. We have no estimate regarding companies 6 and 8.
29
Table 10: The basic profile of the investee companies in the databaseYear ofestablishment
Profile/technologysector
Total capital Ownershipshare of VCcompany
Investedamount
Aim ofinvestment
Number of VCinvestment/Angel finance
Number ofco-investors
1. 1998 Internet/Telecommunication
Not revealed Not revealed/minority
EUR 2,1m Regionalexpansion
2/yes 3
2. 1993 e-businesstelecommunication
~ EUR 7 m. Minority(~ 40 percent)
EUR 2,65 m Internationalexpansion
1/no 1
3. 1997 Medical-drugresearch/pharmaceutical, chemical
~USD 35m Minority(2-5 %)
USD 0,4 m++ Research 4/yes 8
4. 1999 Chemical,biotechnology
OverUSD 100 m*
Not revealed/minority
USD 0,46m Research 3/no 6
5. 1995 Laser technology/Non electricalequipment
OverUSD 15 m
Minority** USD 0,7 mUSD 6 m+++
Development,internationalexpansion
2/no 4
6. 1999 Biotechnology/Pharmaceutical
Not revealed Minority USD 0,2 m Market entry 1/yes 1
7.*** 1998 Telecommunication USD 12 m Minority(12 %)
USD 1,3 m Domesticexpansion
2/no 1
8. 2000 Computing and officeequipment
Not revealed Minority USD 0,1m Strategyformulation
1/no 1
9. 1993 Electrical equipment,telecommunication
USD 2 m Minority Not revealed Internationalexpansion
2/yes 1
10+ 1989 Electrical equipment Not revealed Minority(21%)
Not revealed Internationalexpansion,
1/no 1
*The Hungarian company is a subsidiary of a German parent company, the total capital belongs to the whole company.**The venture capital companies altogether have 65 percent ownership share in the company***The use data are for the first investment, there is no data available regarding the second investment by the same company.+The company has been sold to a professional investor (trade sales).++ The total investment was USD 11 million, that means altogether 32 percent venture capital share in the company.+++ The second round investment that was provided by a syndicate of four worth USD 6 million and 65 percent ownership share together. Only the first investment is includedin the analysis.
30
In all of the cases, venture capital companies gained minority ownership, ranging from 2 to 40percent. The average amount of the investment was about USD 0,89 (EUR 1m), that was lessthen half of the average venture capital investment in years 2000 (average investment USD2,1 m) – 2001 (average investment USD 2,3 m). It is not a surprise that the largest investmentwent to the most capital intensive telecommunication companies – USD 1,3 m, EUR 2,1 m,EUR 2,65 m . The other six known investments were below USD 1 million, and probably theremaining two company investments were also well below USD 1 million. Withouttelecommunication investment, the average money put in a company was about USD 372000, less than 20 percent of the average investment in 2001. This lower average investmentcorresponds to the yearly data of the HVCA 2001 (Hungarian Venture Capital AssociationYearbook 2002) that half of the transactions went to the high tech sector but they representonly 30 percent of the value of investments.
There are several reasons of the low amount of venture capital investments in the high techsector– especially if we compare to the US data where average investment was USD 7,5 m inthe high tech sector (Karsai 2000):
� Investors are very careful as they want to risk a low amount of money in one company,and they rather widen the portfolio of companies
� Since most of the investments are in the early phase they require relatively less money� If we have a look at the other column of table 3, it can be seen that most of the companies
receive venture capital more then once, only four out of the ten companies received VCmoney only once, and the average number of investments is 1,9. It means that venturecapitalists put a limited amount to the company first, and if the results meet theexpectations they are willing to provide more money.
There is another way also that is related to the risk sharing strategy of the VC companies.Contrary to the pre 1998 deals, when most of the investments were made alone, 4 of theventure capital investments in the data set were syndicate ones.
It is interesting to analyse why companies/entrepreneurs turn to venture capitalists and whatdo they expect from them? As it prevails from table 5, two companies wanted to continueresearch that related to the development of new drugs, medicine or molecules. Bothcompanies in this area belong to an international parent and have research network. Thesearch for venture capital was associated with the high expenses and high risk of failure ofthis type of research, as well as the limited money for R& D in Hungary. Anotherpharmaceutical firm that already had the product aimed to enter the market (seed capital).Company 8 had no clear strategy about the product and the company’s future and looked forhelp. In this case the most important problem was the market.
In all the other six cases – independently from whether the investments were in the early or inthe development phases – the investee companies were looking for expanding their businesseither domestically but mainly internationally/regionally. So beside the money, they expectedthe venture capitalist to provide help to search markets or provide actual connections to otherbuyers. The internationalisation of the high tech business is vital in a small, developingcountry like Hungary. On the one hand, the domestic market and consequently the number ofpotential buyers are very small. On the other hand the demand for high tech product is alsolimited because of the development stage of the country. Moreover, the quick exploitation ofexisting opportunities in the rapidly expanding high tech business is inevitable. Other earlier
31
successful Hungarian high tech companies like Graphisoft and Synergon used the receivedventure capital to set up branch and/or selling offices in the USA and the European Union.
It is well-known in the literature (e.g. Reynolds et al 2001) that not only formal venturecapital but also informal business angel financing can be very important for high techbusinesses. It is common thing in the US that the company starts with a relative low amountof angel money and then continues with a larger venture capital investment. In Hungary,business angels represent only 2,2 percent of the total population that is less then the worldaverage and much less than the leading New Zealand and USA (around 6 percent). However,the importance of business angels can be noticed in Hungary: four out of the ten companieshad received angel money before the venture capital participation.
5.6. The connection between the venture capitalist and the investee company: controllingand participating
A distinguishing feature of the venture capital companies is to provide additional help to theinvestee company besides the money. The reason of the additional help is twofold. First, itprovides a strong control over the company – much stronger than in the case of bank loans.Second, most of the companies are not properly managed. Leadership, management,marketing, financial planning, reporting, strategy focus etc. are frequently missing. Moreover,most of the times the investee companies want to expand the businesses. It means that theprevious management techniques, even if they used to be perfect, cannot be applied anymore.The company has to deal with changes in sales, personnel, organisation, buyers/sellersconnections etc. at the same time. Venture capitalists provide help to find the solution tomanage growth. It can be believed that in a transitional country, like Hungary, entrepreneurs,potential venture capital investee companies have less experience in management andleadership than in other countries having longer history in the market economy.
This fact was reinforced by venture capitalists: the lack of proper managerial skills is one ofthe main limits of further venture capital investments in Hungary. As a consequence of thisless experienced management, venture capitalists can follow two practices. They select theinvestee companies much carefully than in other countries, and/or they engage more activelyin the management. The second solution of more active participation could be more expensivein terms of costs that would increase the expected rate of return substantially. The risk is evenlarger if the company is in the early phase and the owner(s) have no managerial and businessexperience at all.
We can find both of the selection strategies amongst our venture capital companies. Two ofthe companies focused more on the selection criteria and made no difference in managing acompany in the early or development phase. However, they choose companies that have atime-tested management team. All the other venture capital companies made a difference inmanaging research, early phase, or developing companies. The earlier the investee companyin the life cycle the more time is necessary for the venture capitalist to manage it successfully.While two venture capital companies requires quarterly, three expects monthly reports.

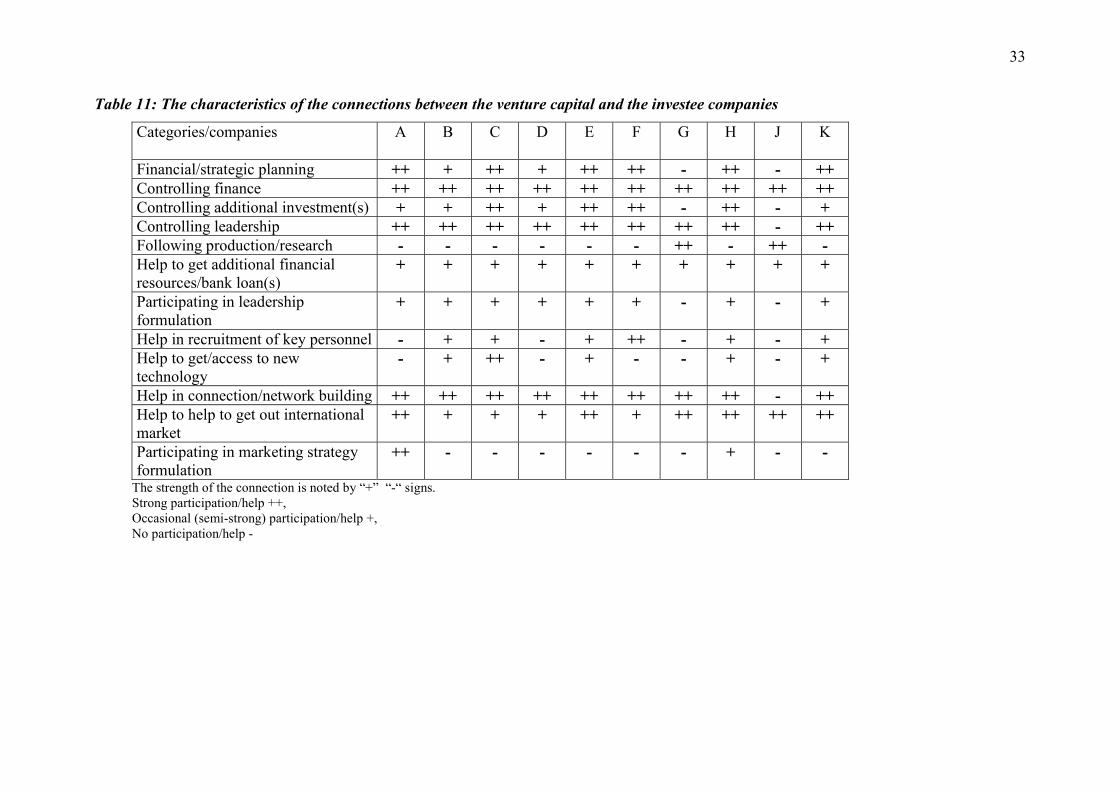
33
Table 11: The characteristics of the connections between the venture capital and the investee companies
Categories/companies A B C D E F G H J K
Financial/strategic planning ++ + ++ + ++ ++ - ++ - ++Controlling finance ++ ++ ++ ++ ++ ++ ++ ++ ++ ++Controlling additional investment(s) + + ++ + ++ ++ - ++ - +Controlling leadership ++ ++ ++ ++ ++ ++ ++ ++ - ++Following production/research - - - - - - ++ - ++ -Help to get additional financialresources/bank loan(s)
+ + + + + + + + + +
Participating in leadershipformulation
+ + + + + + - + - +
Help in recruitment of key personnel - + + - + ++ - + - +Help to get/access to newtechnology
- + ++ - + - - + - +
Help in connection/network building ++ ++ ++ ++ ++ ++ ++ ++ - ++Help to help to get out internationalmarket
++ + + + ++ + ++ ++ ++ ++
Participating in marketing strategyformulation
++ - - - - - - + - -
The strength of the connection is noted by “+” “-“ signs.Strong participation/help ++,Occasional (semi-strong) participation/help +,No participation/help -
34
When we asked the companies to estimate how much time they spent at the investeecompany, it proved to be difficult. There was an agreement that one venture capital managercan manage 2-4 projects. Besides Euroventures, who is less active in management, three outof the other four venture capital companies spent around a day in a week, and one passed ahalf day in a week or one day in every second week at an investee company. In the earlyphase of the investment, the connection between the venture capitalist and the investeecompany could be daily. In some cases, HITF requested the company to send daily cash-flow,3TS participated in negotiations, Fastventures focused on avoiding crisis situations. In othercases, the venture capital company helped the investee company to set up the financialreporting system. The venture capitalist’s help is vital in the early phase when the investeecompany has no resources to finance a professional employee.
If it was necessary for the investee firm to get a help that the venture capital manager couldnot provide than most of the companies relied on the owners. Some of the individual ownerswere actively participating in the management. Only one company noticed that they usedoutside experts, consultants, independent experts, head-hunters.
We have already mentioned that Hungarian entrepreneurs possess less business skills thenentrepreneurs in the developed countries. Three out of the five venture capital companiescomplained more or less about the lack of vital management skills and improper commitmenttoward the project. This was probably the reason why these venture capital companies beganto move toward later phase and larger investments, where the management team had alreadyhad some experience and proof of survival capacity. More attention was given to thecommitment of the entrepreneur both financially and non-financially (how much effort hewanted to take to the company).
Table 11 provides the necessary information about the connection of the venture capital andthe investee companies on a company basis. The first five categories – strategy formulation,financial control, investment control, leadership control and production/research control – arethe most important tools for the venture capitalists to check the investee company. The othercategories describe the type of help that the venture capital company provides to the investeefirm.
By examining the tools of control, table 11 reveals that venture capitalists practice bothfinancial and leadership control. The close financial control, including the regular follow upof the investee company’s financial performance – sales, costs, financial ratios etc. -, and theparticipation in the additional investments are common. However, regularity does not mean adaily involvement, most frequently the monthly report is required. There are only twocompanies where venture capitalists do not participate in financial/strategic planning. Thereason of that is that these companies are in the research phase, and actually there are no sales.However, as a substitute, venture capitalists have close look at the research procedure. In allthe other eight cases, the investor is not participating in the production process.
Authority over the leadership (management) is mainly practiced via the board of directors orregular assembly meetings. The magnitude of the authority, however, depends on the numberof delegates of the venture capitalists in the board. Since most of the cases in our data setventure capitalists have minority shares it means that the entrepreneur/original owners havemajority in the board. Despite the limited control over the management, personal conflicts arerare because venture capitalists have a close look at the management in the due diligence
35
phase in the selection procedure. If they have any doubt about the personality, capability orskills of the management/owners, they will not invest in the business. This role of the venturecapitalist is reinforced by the relatively weak/occasional participation in the leadershipformulation.
While control over the investee company serves the interest of the venture capitalist, theadditional help provided by the investor can be vital from the viewpoint of the company.There are two factors where the companies in our survey receive considerable help from theventure capitalists. In the high tech sectors, network building and close personal contacts withother similar companies or potential buyers are inevitable. Hungarian venture capitalists assistto the investee firms to find the proper connection. As we have already noted, entering theforeign markets was overwhelmingly the most important reason of the companies’ search forventure capital. Based on table 11, it looks that venture capitalists fulfil the initialexpectations of the investee firms and provide major help to get access to and, widen foreignrelations. By far, the two most important desired direction of foreign relations were the USAand the European Union, mainly Germany. There were only one company that complainedabout the improper help of the venture capitalist in foreign relation building.
It can happen that there is a need to get additional financial resources, mainly bank loans. Inthese cases, venture capitalists provide limited help and in most of the time they refuse to be aguarantor behind the bank loan. Sometimes they participate in finding key personnel, if theyare missing from the investee company. In the case of company F, the venture capitalistcarried out an extensive international search to find the proper expert. In half of the cases theventure capitalist helped the companies to find the proper technology or to develop their ownone. However, technology was only vital at one telecommunication company. It also showsthat the investee companies had possessed the necessary technology at the time of investment.
Marketing is probably one of the weakest point of Hungarian businesses. While there areexcellent ideas and creative persons, marketisation of the innovations are far fromsatisfactory. We believed initially that venture capitalist pay special attention to the marketingstrategy of the investee company. However, this was true only in one case and there wasanother case when some marketing strategy participation of the venture capitalist could benoticed.
6. Conclusion
Over the last three years, venture capital industry has been in haven and hell. The enormousboom in the American new economy had a crowding out effect on the world. While Europefollowed US with a little lag, the influence on Hungary arrived even later in 2000. This is themain reason, why the collapse of the new economy companies in the USA did not have amajor effect on Hungary: since the whole new economy constitutes only a little share in theHungarian economy.
The examined venture capital companies were established in the late 1990s – early 2000s withthe aim to make high tech investments in Hungary. At the same time, existing venture capitalcompanies turned more to new economy and early stage investment, following world-widetendencies in VC investments. After the unexpectionally good year of 2000, venture capitalinvestment decreased by 40 percent in 2001, however, the high tech sector preserved thedominant position in VC investment.
36
It was presented in the case study, that venture capital companies became more carefully inselecting the investee firms, and followed the performance of the company in a moreconsistent way. Despite difficulties in comparing developed country venture capitalcompanies’ behaviour to Hungarian ones, there are some variations. Even in hard times, someventure capitalists increased the number of portfolio companies while others tried to get rid ofthem. Some of the companies focus more on selecting a firm that has a proved management,others are more willing to teach the investee company managers, owners how to managegrowth. Lack of managerial knowledge and commitment of the entrepreneur have been themain limits of further venture capital investments.
Because of the problems in the small, local Budapest Stock Exchange, IPO, as a wishful exitroute is not possible. Therefore trade sales played the primary role in the exit procedure. Insome cases “pushed” repurchase technique could be noticed.
Examining the available capital in the region it can be seen that it is still plenty of availablemoney, but there is a lack of proper investments – as venture capitalists stated. The latestreports of Deloittle and Touche shows that Hungary is the most promising nation in theCentral Eastern European region having high tech, fast growing companies that could be thepotential target for venture capitalists. Due to high level of entrepreneurial activity, thenumber of innovative start-ups can increase too. It is also promising that the Hungarianeconomy grow at a rate double of that of the European Union. Moreover, the expectedaccession to the EU could also have a positive effect on the development of the Hungarianventure capital market.
Hungary has done the most painful part of transition, by 2002 the country is definitelyintegrated into the globalised world economy. Now, the task for the government is to supportEuropean Union integration and further economic development. The economic policy shouldfocus more on shaping favourable conditions for small and start-up businesses particularly inthe high technology and fastest growing business sectors.
References
Apatini Kornélné (1999) Kis- és középvállalkozások finanszírozása, Közgazdasági és JogiKönyvkiadó, Budapest.
Barta, Györgyi (1997) Műszaki versenyképesség az átmeneti gazdaságban: külföldi és hazaivállalatok a magyar iparban (Technological competitiveness in a transition country:Foreign and domestic firms in the Hungarian industrial sector), Tér és Társadalom,105-130
Berger, Allen – G. Udell (1998)The Economics of Small Business Finance: The Roles ofPrivate Equity and Debt Markets in the Financial Growth Cycle, Journal of Bankingand Finance 22 pp. 613-673 1998
B.I. (2001): Kockázatató tőke,Cégvezetés 2001 April, pp. 122-125
B.K. (2001) Változik a Széchenyi-terv, Cégvezetés 2001 October, pp.124-126
Borbély, Szilvia and Vanicsek, Mária (2001) Magyarország helye Európa gazdaságában (Theplace of Hungary in the European economy), Közgazdasági Szemle 48, pp.63-90
37
Chickán, Attila (1998) Jelentés a magyar vállalati szféra nemzetközi versenyképességéről(Report on the international competitiveness of Hungarian firms), BKÁEVállalatgazdaságtan Tanszék, Versenyben a világgal – kutatási program, October 1997
Chickán Attila – Czakó Erzsébet – Demeter Krisztina (1997): Vállalataink erőltetett(át)menetben, Gazdaság Vállalkozás Vezetés 1997/1 pp. 12 -35
Csabai Károly (2002):Kiszálláscsinálók, Heti világgazdaság (2002). Február 2. Pp. 101-103
Csákvári Tamás – Kovács Dániel 2002: Innovációs képesség, tudomány- éstechnológiapolitika hazánkban és külföldön, Külgazdaság Vol. XLVI. No. 1 Januarypp. 45-59
Czakó, Erzsébet (2001) A vállalati versenyképesség alakulása a kilencvenes évek másodikfelében (Patterns in firm level competitiveness in the 1990s), Vezetéstudomány 32 pp.2-7
Deloitte & Touche (2001) Fast 50 companies in Central Europe. 2001 Technology industrysurvey
Deloitte & Touche (2002) Fast 50 companies in Central Europe. 2002 Technology industrysurvey
Dévai Katalin – Borsi Balázs: Műegyetemi innovációk hozzájárulása a tudásalapú gazdaságkialakulásához, in: Felzárkózás és EU csatlakozás, A VII. Ipar- és VállalatgazdaságiKonferencia előadásai , MTA Ipar- és Vállalatgazdasági Bizottsága Budapest pp.161-167
Elszállt a kédvük 2002 Heti világgazdaság melléklet Kalauz az internethez 2002. Augusztus,pp. 6-9
Fáth, Péter (2000) Experiences and expectations of investors in Hungary, Economic Trends inHungary, Ecostat, Budapest, pp. 27-36
A feldolgozóipar…(2001): A feldolgozóipar innovációs tevékenysége, Időszaki statisztikaitájékoztató, Hungarian Central Statistical Office Budapest 2001
Futó Péter 2001: A kisvállalatok támogatott innovációs-fejlesztési projectjei, 1995-1999,Statisztikai Szemle Vol. 79 no. 6 pp. 522-535
HCSO (1996) Ipari és építőipari évkönyv 1996 (Industrial and construction yearbook),Hungarian Central Statistical Office, Budapest
HCSO (1997) Ipari és építőipari évkönyv 1997 (Industrial and construction yearbook),Hungarian Central Statistical Office, Budapest
HCSO (1998) Ipari és építőipari évkönyv 1998 (Industrial and construction yearbook),Hungarian Central Statistical Office, Budapest
38
HCSO (1999) Ipari és építőipari évkönyv 1999 (Industrial and construction yearbook),Hungarian Central Statistical Office, Budapest
HCSO (2000a) Ipari és építőipari évkönyv 2000 (Industrial and construction yearbook),Hungarian Central Statistical Office, Budapest
HCSO (2000b) A nemzeti számlák 2000 (National accounts), Hungarian Central StatisticalOffice, Budapest
Hungarian Venture Capital Association Yearbook 1999, Budapest
Hungarian Venture Capital Association Yearbook 2000, Budapest
Hungarian Venture Capital Association Yearbook 2001, Budapest
IMD (2002) World Competitiveness Yearbook. http://www02.imd.ch/wcy/ranking/
Inzelt, Annamária (1995): Helyzetkép a magyarországi innováció állapotáról az átmenetidőszakában, Külgazdaság 1995/2 pp. 69-86
Inzelt Annamária (2002): Restructuring and Financing R�d New Partnership, in :forthcoming Varga Attila – Szerb László (ed.) 2002 : Innovation, Entrepreneurshipand Regional Economic Development, University of Pécs, Faculty of Business andEconomics Pécs
Kállay László (2000): Mikrohitelezés piaci alapon, Közgazdasági Szemle 2000. 1. Pp. 41-63
Karsai, Judit (2000): A koxkázati tőke szerepe a technológiai alapú induló vállalkozásokfinanszírozásában, in: Felzárkózás és EU csatlakozás, A VII. Ipar- ésVállalatgazdasági Konferencia előadásai , MTA Ipar- és Vállalatgazdasági BizottságaBudapest pp. 324-330
Karsai Judit (1999) A megfontoltan kockáztató tőkések, Közgazdasági Szemle 1999. 9. Pp.789 –812
Karsai Judit – Rácz András (2000) Kockázati tőkések, Cégvezetés 2000 June pp.116-121
Kiss János (2000): Az innováció szerepe a hazai vállalatok versenyképességében, in:Felzárkózás és EU csatlakozás, A VII. Ipar- és Vállalatgazdasági Konferenciaelőadásai , MTA Ipar- és Vállaaltgazdasági bizottsága Budapest pp 194-202
Kőhegyi Kálmán (1998): A kisvállalkozói szektor tagolódása, Közgazdasági Szemle 1998 3.Pp. 261-276
Lemák Gábor (2000): Kockázatitőke-társaságok Magyarországon, Bankszemle 2000 vol. 4.Pp. 18-43
Losoncz, Miklós (2002) Nemzetközi versenyképesség (International competitiveness),Cégvezetés March, 88-93
39
Ludányi Arnold (2001a): A tőkeerő és az alapítói háttér hatása a kockázatitőke-szervezetekbefektetési magatartására - I. Közgazdasági Szemle XLVIII. Évf. 2001. Jólius-augusztus pp. 659-572.
Ludányi Arnold (2001b): A tőkeerő és az alapítói háttér hatása a kockázatitőke-szervezetekbefektetési magatartására - II. Közgazdasági Szemle XLVIII. Évf. 2001. Szeptemberpp. 779-797.
Mani, Sunil – Anthony Bartzokas (2002): Institutional Support for Investment in NewTechnologies: The Role of Venture Capital Institutions in Developing Countries,United Nations University/INTECH Discussion Papers, Maastricht, the Netherlands
Meixner Zoltán (2001) Új gazdaság Magyarországon (The new economy in Hungary),Cégvezetés February, pp.77-95
Papanek Gábor (2001) Innováció a magyar régiókban, Vezetéstudomány Vol XXXII. No. 9pp. 12-16
Pula, Gábor (1999) Modernizáció és deficit (Modernization and deficit), Külgazdaság 43, pp.4-32
Regional Investment Strategies 2001htttp://wwww.euroventures.hu/euroventureshungarybv.html, 2002-09-28
Reynolds, Paul – M. Hay – W. Bygrave – S. Camp – E. Autio (2001): GlobalEntrepreneurship Monitor 2001 Executive Report, London Business School
Small and medium-sized….(2002): Small and Medium-Sized Enterprises in the HungarianEconomy, Hungarian Central Statistical Office Budapest
State of small …(2001): State of Small and Medium Size Businesses in Hungary 2001, AnnualReport, Institute for Small Business Development Budapest
Szerb László – Ulbert József (2002) Entrepreneurial Growth and the Role of Venture Capitalin Hungary in : forthcoming Varga Attila – Szerb László (ed.) 2002 : Innovation,Entrepreneurship and Regional Economic Development, University of Pécs, Facultyof Business and Economics Pécs
Varga, Attila (1998) University research and regional innovation. A spatial econometricanalysis of academic technology transfers, Kluwer Academic Publishers, Boston
Waldner Zoltán (2000): Vágyak kontra realitások, Figyelő 2000. November 18-24, pp. 20-21