high-speed laser-launched flyer impacts studied with ... · high-speed laser-launched flyer impacts...
TRANSCRIPT

High-Speed Laser-Launched Flyer Impacts Studied with UltrafastPhotography and Velocimetry
Alexandr A. Banishev1 • William L. Shaw1• Will P. Bassett1 • Dana D. Dlott1
Received: 11 January 2016 / Accepted: 11 February 2016 / Published online: 16 February 2016
� Society for Experimental Mechanics, Inc 2016
Abstract Pulsed lasers can launch thin metal foils at
km s-1, but for precision measurements in shock com-
pression science and shock wave spectroscopy, where one-
dimensional shock compression is vital, flyer plate impacts
with targets must have a high degree of flatness and min-
imal tilt, and the flyer speeds and impact times at the target
must be highly reproducible. We have developed an
apparatus that combines ultrafast stroboscopic optical
microscopy with photon Doppler velocimetry to study
impacts of laser-launched Al and Cu flyer plates with flat,
transparent glass targets. The flyer plates were 0.5 mm in
diameter, and ranged from 12 to 100 lm thick, with flyer
speeds up to 6.25 km s-1. The velocity variations over
30–60 launches from the same flyer plate optic can be as
low as 0.6 %, and the impact time variations can be as low
as 0.8 ns. Stroboscopic image streams (reconstructed
movies) show uniform, flat impacts with a glass target.
These stroboscopic images can be used to estimate the tilt
in the flyer-target impact to be\1mrad.
Keywords High-speed impact � Flyer plate � Shockgeneration � Ultrafast microscopy
Introduction
Pulsed lasers can launch thin metal foils at high velocities,
for example 13 km s-1 using a tabletop laser [1] or a large
laser facility [2]. But for precision measurements in shock
compression science and shock wave spectroscopy, where
one-dimensional shock compression is vital [3, 4], flyer
plate impacts with targets must be as sudden as possible,
with a high degree of flatness and minimal tilt, and the flyer
speeds and impact times at the target must be reproducible.
In light gas guns, where long projectiles and precision-
machined bores can be used, impact tilts of 3.5 mrad [5]
and 0.9 mrad have been measured [6, 7]. Factors such as
flatness and tilt have not been studied in as much detail for
laser-driven flyers, and they are of particular concern due
to the small thickness of laser-launched flyer plates [8–11]
and the possibility of spatially nonuniform launch laser
beams [11–15]. Here we combined ultrafast stroboscopic
microscopy, using a femtosecond white-light supercontin-
uum strobe, with photon Doppler velocimetry (PDV) [16–
18] to study the impacts of 0.5 mm diameter km s-1 laser-
launched Al and Cu flyer plates with flat transparent glass
targets. PDV uses a high-speed laser interferometer, where
the flyer plate forms one arm of the interferometer and the
flyer velocity history is derived from the time-dependent
interferogram [16–19]. In previous works [17, 18], we
investigated the laser launching and target impact pro-
cesses with PDV, using Al flyers that were about 0.5 mm in
diameter and 25–75 lm thick. The flyer plate thickness is
important in that it determines the duration of the fully-
supported shock in the target [18, 20]. Here we have
extended previous PDV measurements of 25 lm thick Al
flyer reproducibility [18] to Cu flyers (q = 8.96 g cm-3)
and to thicker Al (q = 2.70 g cm-3) flyers. But the unique
feature of this study is the use of ultrafast optical
& Dana D. Dlott
1 School of Chemical Sciences, University of Illinois at
Urbana-Champaign, Box 01-6 CLSL, 600 S. Mathews Ave.,
Urbana, IL 61801, USA
123
J. dynamic behavior mater. (2016) 2:194–206
DOI 10.1007/s40870-016-0058-2

microscopy. Our PDV uses a laser beam that probes the
average behavior of the central 70 lm of the flyer plate
[18], whereas with ultrafast microscopy we can see and
assess the flatness and tilt of the entire flyer surface,
including the outer edges.
The simplest method of laser flyer launching involves
focusing a nanosecond high-energy laser pulse onto a sheet
of metal foil [1, 21], or onto a flyer plate optic consisting of
a sheet of foil bonded to a transparent window [22]. The
usual mechanism of flyer launch involves creating a metal
plasma in a thin layer of the foil facing the laser [13, 23–
25]. Rapid expansion of the plasma propels a disk of foil
away from the foil sheet, creating the laser-driven flyer
plate. An alternative to the flyer plate optic is to fabricate
the flyer plates as individual disks on a window [9, 10, 22,
26] or fiberoptic surface [14, 15, 27]. This fabrication
avoids the edge effects involved in tearing disks away from
a sheet, but is less convenient. With a 50 9 50 mm2 flyer
plate optic, we can launch 30–60 identical flyer plates in a
short time, whereas fabricating individual flyer plates
introduces complexities that significantly reduce the num-
ber of flyers that can be shot.
High-speed imaging has been previously used by Frank
and Trott [23] and by Trott [25] to study laser flyer laun-
ches. Those authors visualized the launch plasma and the
surface of the flyer plate shortly after launch, but did not
image the target impact process that is the primary focus of
the present study. Yu et al. [13] used right-angle imaging
(shadowgraphy) with a high-speed camera to visualize Cu
flyers. They were able to observe the different plasmas with
and without a black paint absorbing layer, and they were
also able to see the curvature of the flyer surface. Rupp
et al. [28] used a two-camera stereo reconstruction method
with a 10 ns duration strobe to image the surfaces of 3 mm
diameter flyers made from 50 lm Cu or 100 lm Ti. The Ti
flyers, launched at about 0.5 km s-1 by a nominally flat top
beam with intensity spikes, showed bowing of *30 lm[28], which indicates that the variation in arrival time at a
flat target would be on the order of 60 ns. Zhao et al. [11]
imaged the impact of a flyer with a glass target using an
array of 12 optical fibers attached to fast photodetectors.
The outputs of three of these photodetectors was used to
conclude that the planarity of the impact was ‘‘good’’.
Paisley et al. [26] and Greenfield et al. [29] used transient
imaging displacement interferometry (TIDI) to study the
surfaces of 0.1–2 mm thick Cu flyers in the form of 8 mm
precut disks with carbon underlayers. The flyers were
launched by a facility-sized 500 J laser TRIDENT, at
speeds of 0.1–0.5 km s-1 [26]. The TIDI experiments
showed a 400 lm diameter, 2 lm high bump at the center
of 0.1 mm thick flyers, but not in thicker flyers, caused by a
central hot spot in the launch beam. A B 3 mrad convex
bowing of the flyer was observed, indicating that the edges
of the 8 mm diameter flyer trailed the center region by
about 12 lm. At a speed of 0.1 km s-1, a 2 lm high bump
at 0.1 km s-1 would impact a target 20 ns before the rest
of the central flyer, and the edges would impact the target
120 ns after the center. At a speed of 0.5 km s-1, these
different impact times would be reduced to 4 and 24 ns.
The most common method for laser flyer launching, the
ablation plasma-generation method [24], raises several
concerns about the state of the flyer plate upon impact [10].
During launch and flight, the flyer plate loses mass, and
upon impact the flyer consists of both liquid and hot solid
materials. These concerns can be alleviated using ablative
underlayers to launch the flyer [2, 8, 10, 26, 30]. In this
case, the flyer itself is shielded from the laser beam, and it
is launched by a laser-generated shock in the underlayers.
Recently, our group has shown that it is possible to harness
this shock launch mechanism without having to fabricate
multilayers, using the shock-launch method described in
Fig. 1 [17]. Sheets of Al or Cu foil were bonded to
6.35 mm thick 50 9 50 mm2 borosilicate glass substrates
by a 3.5 lm epoxy layer [17]. A laser beam with a high
degree of spatial uniformity (Fig. 1b), produced using a
diffractive beam homogenizer, was focused onto the
foil/glass interface [17]. The homogenizer was used in first-
order to eliminate the central hot spot created with zero-
order diffractive optics. The beam full-width half
Fig. 1 a Schematic of flyer launch from a flyer plate optic consisting
of metal foil bonded to a glass substrate. The flyer is launched by a
shock created at the glass/epoxy interface. b Profile of the focused
homogenized laser launch beam at the flyer plate. The uniform region
is 0.5 mm in diameter and the FWHM is 0.7 mm. PDV and
spectroscopy experiments probe a 0.1 mm diameter region at the
center of the flyer. c A flyer recovered after impacting a glass target at
1.7 km s-1, showing the flyer detached from the flyer plate optic at
the glass/epoxy interface. d The uniform 0.5 mm center of the beam
would be expected to launch a 0.5 mm flyer while the soft edges of
the beam would be expected to launch a thin outer ring that trails the
main flyer
J. dynamic behavior mater. (2016) 2:194–206 195
123

maximum was 0.7 mm and the uniform region at the beam
center was 0.5 mm, as shown in Fig. 1b. The focused pulse
intensity greatly exceeded the surface damage threshold of
glass at the glass/epoxy interface but not at the entrance
face (the glass/air interface) where the beam was much
larger and less intense. Most of the laser energy was
absorbed by a thin layer of glass immediately adjacent to
the epoxy layer [17]. Absorption at the glass/epoxy inter-
face, denoted the ‘‘absorbing interface’’ in Fig. 1a, created
a shock in the glass that launched the flyer. The evidence
for this shock launch mechanism was summarized in Ref.
[17]. Briefly: (1) only a small fraction of the incident light
pulse was transmitted through the glass substrate; (2) visual
inspection of recovered flyers (c.f. Fig. 1c) showed the
flyer consisted of foil plus an epoxy underlayer, proving
that the flyer detached at the glass/epoxy interface, and that
the flyer at the metal/epoxy interface was not vaporized; (3)
Multilayer flyer plate optics, where the flyers were shielded
from the launch laser beam by additional underlayers of
metal foil, had the same launch, flight and impact charac-
teristics as unshielded flyers [17].
Figure 1c is a micrograph of one 25 lm thick Al flyer
recovered after a 1.7 km s-1 impact with glass. The flyer is
close to 0.5 mm in diameter, while the epoxy underlayer is
slightly larger. The 0.5 mm flyer diameter is indicative of
the proposed scheme depicted in Fig. 1d, which is based on
the observation that the launch beam has soft edges
extending out to about 0.7 mm. The uniform center of the
beam propels a 0.5 mm disk at a higher speed than the soft
edges of the beam, and some of the launch plasma near the
disk edges escapes transversely [28], so a 0.5 mm foil flyer
will be accompanied in flight by a thin slower trailing outer
ring.
An example of a PDV flyer velocity history is shown in
Fig. 2. A 75 lm thick Al flyer was launched at a glass
window across a 375 lm vacuum gap, by a laser pulse
arriving at time t = 0. The velocity history in Fig. 2a was
derived using the usual moving-window Fourier transform
[16, 31] that gives a smoother time-averaged velocity
history. The expanded view in Fig. 2b used a fringe-
counting method described previously [17, 32]
_ENREF_36, which gave higher time resolution with a bit
more noise [17, 18, 33]. The free-space velocity of the flyer
plate from Fig. 2a was Uf = 1.4 (±0.007) km s-1. At
354 ns, the velocity dropped abruptly by *35 %, and this
drop indicated the instant of impact with the glass target.
The lower velocity, denoted Up, is the velocity of the
flyer/glass interface, or alternatively the material velocity
in glass that drives a shock into the target. The value of Up
remained approximately constant for a time interval ss,where ss denotes the duration of the fully-supported shock
in the window. Subsequent to the time interval ss, Up
declined and the shock pressure decayed. In Fig. 2a,
ss = 14 ns, and the apparent velocity Up = 0.878
(±0.015) km s-1. When the flyer plate is moving through a
solid transparent medium, an optical window correction
should be applied to convert apparent velocity to true
velocity. For borosilicate glass, the conversion factor is
close to unity. The apparent velocity should be multiplied
by 0.9410 [31]. The shock pressure in glass can be deter-
mined from the corrected Up using tabulated Hugoniot data
[34], and here P = 9.0 (±0.15) GPa.
The errors in our PDV velocity measurements are gen-
erally about 1 %. Accuracy increases as the constant-ve-
locity flight path increases. In the Uf determination for this
flyer, the flyer flew at constant velocity for *150 ns
(Fig. 2a), and the fractional velocity error was 0.5 %. In
the Up determination, the constant velocity in glass lasted
14 ns (Fig. 2b) and the fractional error was 1.7 %.
The key features of the measurement in Fig. 2b are the
suddenness of the transition from free flight at Uf to shock
drive at Up, and the constancy of Up during the interval ss.The sudden transition is indicative of an impact between
two flat parallel surfaces. The observed time for the sudden
transition is\0.2 ns, but an analysis of the time resolution
of our PDV system [17, 18, 33] suggests a more conser-
vative value of 0.5 ns is more appropriate. A transition
time of 0.5 ns at Uf = 1.4 km s-1 indicates a tilt of
Fig. 2 PDV velocity history
from a 1.4 km s-1, 75 lm thick
Al flyer launched at a glass
target by a laser pulse at t = 0.
After the reverberations die out
the flyer travels at 1.4 km s-1
until it impacts the target. The
impact at 354 ns is indicated by
a sudden drop in velocity
occurring in\0.5 ns
196 J. dynamic behavior mater. (2016) 2:194–206
123
\0.7 lm over the 70 lm diameter region probed by PDV,
corresponding to a flyer tilt\10 mrad.
In the rest of this paper, we describe the experimental
apparatus, we present results showing flyer speed versus
laser intensity for Al flyers 12, 25, 50, 75 and 100 lm thick
and Cu flyers 25 and 70 lm thick. We present PDV results
showing the measured variations in flyer speeds and target
impact times. We then present ultrafast optical microscope
images of impacts with glass targets that allow us to assess
the significance of edge effects and the planarity of the
impact over the entire surface of the flyer, rather than just
the 70 lm region probed by PDV.
Experimental
Launch Laser and PDV
The laser launch and PDV apparatus have been described
in previous publications [17, 22]. Synchronization of the
femtosecond strobe laser with the launch laser has also
been described [35, 36]. A new feature needed to perform
ultrafast strobe microscopy is the more stringent synchro-
nization of the strobe laser with target impact as deter-
mined by PDV.
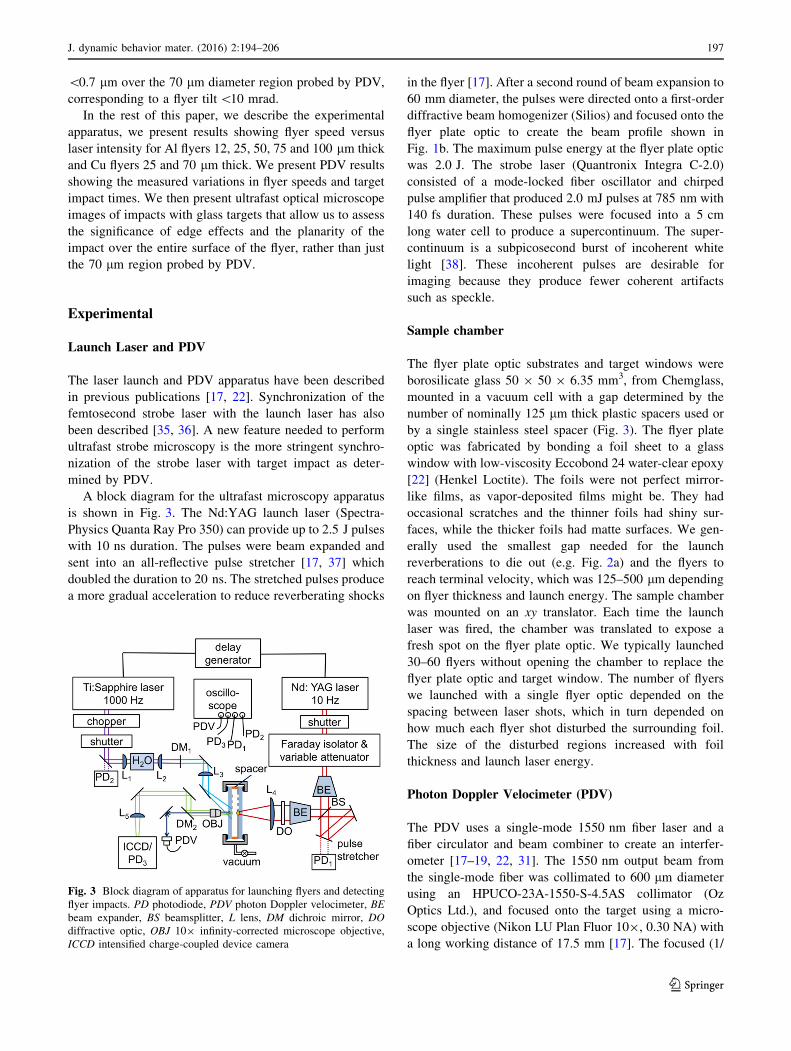
A block diagram for the ultrafast microscopy apparatus
is shown in Fig. 3. The Nd:YAG launch laser (Spectra-
Physics Quanta Ray Pro 350) can provide up to 2.5 J pulses
with 10 ns duration. The pulses were beam expanded and
sent into an all-reflective pulse stretcher [17, 37] which
doubled the duration to 20 ns. The stretched pulses produce
a more gradual acceleration to reduce reverberating shocks
in the flyer [17]. After a second round of beam expansion to
60 mm diameter, the pulses were directed onto a first-order
diffractive beam homogenizer (Silios) and focused onto the
flyer plate optic to create the beam profile shown in
Fig. 1b. The maximum pulse energy at the flyer plate optic
was 2.0 J. The strobe laser (Quantronix Integra C-2.0)
consisted of a mode-locked fiber oscillator and chirped
pulse amplifier that produced 2.0 mJ pulses at 785 nm with
140 fs duration. These pulses were focused into a 5 cm
long water cell to produce a supercontinuum. The super-
continuum is a subpicosecond burst of incoherent white
light [38]. These incoherent pulses are desirable for
imaging because they produce fewer coherent artifacts
such as speckle.
Sample chamber
The flyer plate optic substrates and target windows were
borosilicate glass 50 9 50 9 6.35 mm3, from Chemglass,
mounted in a vacuum cell with a gap determined by the
number of nominally 125 lm thick plastic spacers used or
by a single stainless steel spacer (Fig. 3). The flyer plate
optic was fabricated by bonding a foil sheet to a glass
window with low-viscosity Eccobond 24 water-clear epoxy
[22] (Henkel Loctite). The foils were not perfect mirror-
like films, as vapor-deposited films might be. They had
occasional scratches and the thinner foils had shiny sur-
faces, while the thicker foils had matte surfaces. We gen-
erally used the smallest gap needed for the launch
reverberations to die out (e.g. Fig. 2a) and the flyers to
reach terminal velocity, which was 125–500 lm depending
on flyer thickness and launch energy. The sample chamber
was mounted on an xy translator. Each time the launch
laser was fired, the chamber was translated to expose a
fresh spot on the flyer plate optic. We typically launched
30–60 flyers without opening the chamber to replace the
flyer plate optic and target window. The number of flyers
we launched with a single flyer optic depended on the
spacing between laser shots, which in turn depended on
how much each flyer shot disturbed the surrounding foil.
The size of the disturbed regions increased with foil
thickness and launch laser energy.
Photon Doppler Velocimeter (PDV)
The PDV uses a single-mode 1550 nm fiber laser and a
fiber circulator and beam combiner to create an interfer-
ometer [17–19, 22, 31]. The 1550 nm output beam from
the single-mode fiber was collimated to 600 lm diameter
using an HPUCO-23A-1550-S-4.5AS collimator (Oz
Optics Ltd.), and focused onto the target using a micro-
scope objective (Nikon LU Plan Fluor 109, 0.30 NA) with
a long working distance of 17.5 mm [17]. The focused (1/
Fig. 3 Block diagram of apparatus for launching flyers and detecting
flyer impacts. PD photodiode, PDV photon Doppler velocimeter, BE
beam expander, BS beamsplitter, L lens, DM dichroic mirror, DO
diffractive optic, OBJ 109 infinity-corrected microscope objective,
ICCD intensified charge-coupled device camera
J. dynamic behavior mater. (2016) 2:194–206 197
123
e2) beam diameter at the flyer surface was 69 ± 3 lm and
the confocal parameter was 4.8 mm, so the PDV beam was
collimated on the flyer over its entire flight path. The
interferogram was detected with 20 GHz amplified photo-
diodes (Miteq SCMR-100K20G-30-15-10) whose output
was digitized with an 8 GHz oscilloscope (Tektronix
DPO70804).
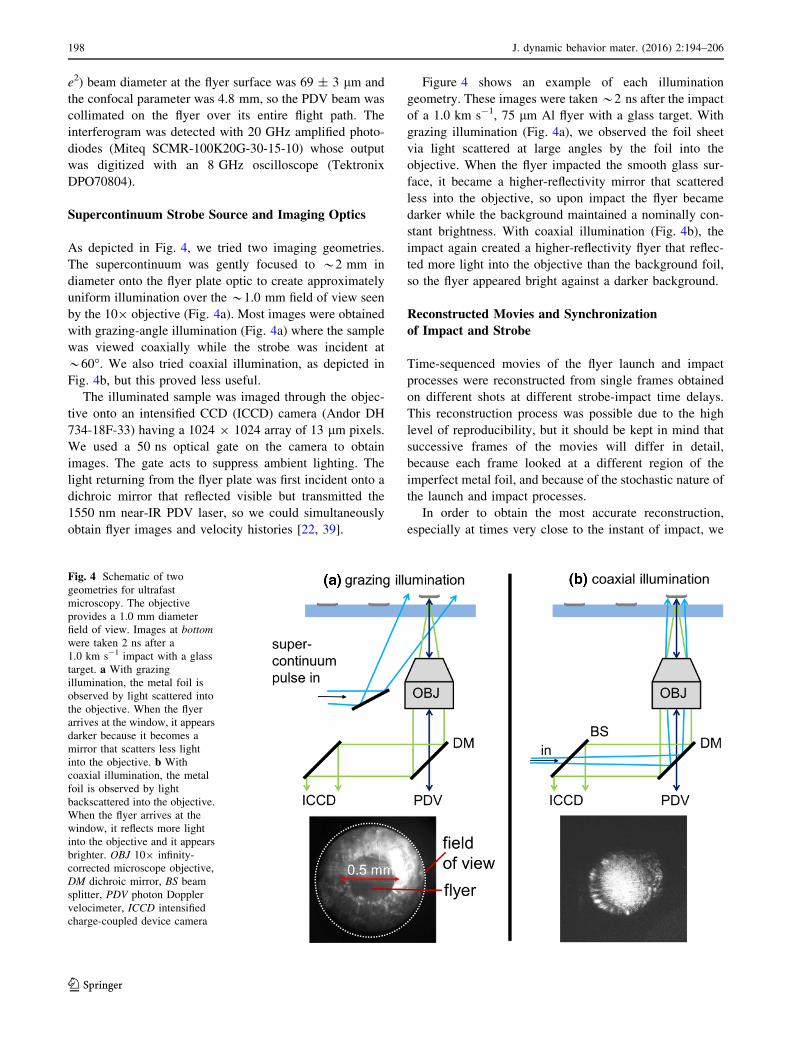
Supercontinuum Strobe Source and Imaging Optics
As depicted in Fig. 4, we tried two imaging geometries.
The supercontinuum was gently focused to *2 mm in
diameter onto the flyer plate optic to create approximately
uniform illumination over the *1.0 mm field of view seen
by the 109 objective (Fig. 4a). Most images were obtained
with grazing-angle illumination (Fig. 4a) where the sample
was viewed coaxially while the strobe was incident at
*60�. We also tried coaxial illumination, as depicted in
Fig. 4b, but this proved less useful.
The illuminated sample was imaged through the objec-
tive onto an intensified CCD (ICCD) camera (Andor DH
734-18F-33) having a 1024 9 1024 array of 13 lm pixels.
We used a 50 ns optical gate on the camera to obtain
images. The gate acts to suppress ambient lighting. The
light returning from the flyer plate was first incident onto a
dichroic mirror that reflected visible but transmitted the
1550 nm near-IR PDV laser, so we could simultaneously
obtain flyer images and velocity histories [22, 39].
Figure 4 shows an example of each illumination
geometry. These images were taken*2 ns after the impact
of a 1.0 km s-1, 75 lm Al flyer with a glass target. With
grazing illumination (Fig. 4a), we observed the foil sheet
via light scattered at large angles by the foil into the
objective. When the flyer impacted the smooth glass sur-
face, it became a higher-reflectivity mirror that scattered
less into the objective, so upon impact the flyer became
darker while the background maintained a nominally con-
stant brightness. With coaxial illumination (Fig. 4b), the
impact again created a higher-reflectivity flyer that reflec-
ted more light into the objective than the background foil,
so the flyer appeared bright against a darker background.
Reconstructed Movies and Synchronization
of Impact and Strobe
Time-sequenced movies of the flyer launch and impact
processes were reconstructed from single frames obtained
on different shots at different strobe-impact time delays.
This reconstruction process was possible due to the high
level of reproducibility, but it should be kept in mind that
successive frames of the movies will differ in detail,
because each frame looked at a different region of the
imperfect metal foil, and because of the stochastic nature of
the launch and impact processes.
In order to obtain the most accurate reconstruction,
especially at times very close to the instant of impact, we
Fig. 4 Schematic of two
geometries for ultrafast
microscopy. The objective
provides a 1.0 mm diameter
field of view. Images at bottom
were taken 2 ns after a
1.0 km s-1 impact with a glass
target. a With grazing
illumination, the metal foil is
observed by light scattered into
the objective. When the flyer
arrives at the window, it appears
darker because it becomes a
mirror that scatters less light
into the objective. b With
coaxial illumination, the metal
foil is observed by light
backscattered into the objective.
When the flyer arrives at the
window, it reflects more light
into the objective and it appears
brighter. OBJ 109 infinity-
corrected microscope objective,
DM dichroic mirror, BS beam
splitter, PDV photon Doppler
velocimeter, ICCD intensified
charge-coupled device camera
198 J. dynamic behavior mater. (2016) 2:194–206
123

developed a new procedure described in Fig. 5, to syn-
chronize the femtosecond strobe with the target impact as
determined by PDV. The launch pulses, the femtosecond
strobe pulses and the PDV signals were all detected by
photodiodes connected to a common 8 GHz oscilloscope
(Fig. 3), but the optical and electronic delays were different
for each detector. We determined the PDV-launch pulse
delay Dt1 as described in Fig. 5a and the strobe-launch
pulse delay Dt2 as described in Fig. 5b. Then we could
monitor the launch pulses with photodiode PD1 and the
strobe pulses with photodiode PD2 (see Fig. 3) and use the
delay generator (Stanford Research Systems DG645) to set
the strobe-impact time delay within about 1 ns.
The determination of the PDV-launch pulse delay was
described previously [22]. The PDV was aimed at a mirror
consisting of a glass window with a 150 nm Cr film at the
glass target location, and the launch laser was used to
vaporize the Cr film. Since the Cr ablation occurred with a
sharp threshold, the film vaporization and loss of mirror
reflectivity was very sudden, creating a sudden drop in the
PDV signal (Fig. 5a). The value of Dt1 was then defined as
the time between this sudden PDV transient and the 90 %
rise of the launch pulse seen by photodiode PD1.
The determination of the strobe-launch pulse delay Dt2used a third photodiode PD3 temporarily inserted in front
of the ICCD camera (Fig. 3) to simultaneously monitor the
launch pulse and strobe arrival at the glass target, as
illustrated in Fig. 5b. The glass target was temporarily
replaced with a ground-glass plate to scatter the launch and
strobe pulses into PD3. However, since the dichroic optics
would not transmit the 1.064 lm launch pulse to PD3, we
temporarily inserted a second-harmonic crystal in the
launch beam path to convert a small portion of the beam to
visible 0.532 lm light.
Results
Flyer Velocities and Reproducibility
Figure 6 shows velocities of flyers versus laser fluence,
where the fluence (J cm-2) was computed based on the
laser pulse energy incident on the flyer plate optic (up to
2 J) and a beam area of 3.8 9 10-3 cm2 (a circle 0.7 mm
in diameter). The maximum available fluence was
500 J cm-2. The 25, 50 and 75 lm Al data were published
previously [22] and are included for completeness. The 12
and 100 lm Al and 25 and 70 lm Cu data are new. As
described previously [22], at the lowest fluences, edge
effects became significant and the flyers did not detach
from the metal foil sheet. To overcome this problem, we
created a flyer plate optic with many 0.7 mm individual
flyer plates, by starting with the usual foil bonded to a
window and using a laser milling machine to etch away a
ring around each flyer [22]. These flyer plate ‘‘cut-outs’’
Fig. 5 Synchronization of femtosecond strobe with the flyer plate
impact observed by PDV. The photodiodes PD1–PD3 are defined in
Fig. 3. a The time interval Dt1 between the launch pulse in PD1 and
the PDV was determined by aligning the PDV beam on a mirror with
a thin Cr coating and ablating away the coating with the launch laser
to cause a sudden decrease in the PDV signal. b The time Dt2 betweenthe launch pulse and the strobe pulse was determined by inserting PD3
at the location of the ICCD camera (Fig. 3). PD3 observed light
scattered from a ground glass target from the launch and strobe
pulses. Knowing Dt1 and Dt2, PD1 and PD2 could be monitored online
to determine and control the timing between flyer impact and strobe
pulse (Color figure online)
Fig. 6 Measured velocities of flyer plates versus launch laser fluence
(Color figure online)
J. dynamic behavior mater. (2016) 2:194–206 199
123

[22] were used to obtain the 25 lm Al data below
2 km s-1.
Figure 7 shows the variations (one standard deviation)
in flyer velocities and impact times at the glass target for Al
and Cu flyers. Each data set, consisting of 30–60 shots, was
obtained using a single flyer plate optic at the specified
launch laser pulse energy. The results are summarized in
Table 1. The smallest variations in velocities and impact
times were obtained with the 25 lm Al flyers, where the
velocity variations were 0.56 % and the impact time vari-
ations were 0.81 ns.
Ultrafast Images of Flyer Impacts
Figure 8 shows a reconstructed movie using grazing illu-
mination, of 25 lm Al flyers at Uf = 1.3 km s-1 across a
125 lm vacuum gap. A representative PDV velocity his-
tory is also shown. Notice the scratches and defects on the
Al foils vary from image to image. Figure 8a was obtained
prior to launch. Figure 8b and c were obtained during
flight, with Fig. 8c obtained just 5 ns before impact. Fig-
ure 8d was taken 2 ns after impact. It shows a darker,
nearly perfect 0.5 mm diameter disk in contact with the
window. The sudden appearance of this uniform 0.5 mm
disk establishes the high degree of planarity of the impact
process over the entire flyer diameter.
Shortly after impact (compare Fig. 8d, e), the flyer
diameter increased slightly from 0.5 to 0.6 mm, which we
attribute to the delayed arrival of the slower outer ring of
the flyer driven by the soft edges of the launch laser beam,
as described by Fig. 1d. After the shock unloaded (e.g.
Fig. 8g–j), the annular region of glass surrounding the flyer
plate became brighter. This brighter annulus corresponds to
the outer rim of the impact crater in the glass [40]. As the
shock spreads radially outward from the flyer, the crushed
glass scattered more light back into the objective.
Figure 9 shows the timing diagram for Fig. 10 The
strobe was set to the mean time of impact as measured by
PDV, and the 35 images in Fig. 10 were obtained at this
instant in time. The same conditions as Fig. 8 were used
except the flyer speed was a bit faster, 1.4 km s-1. Due to
the ±0.8 ns variation in flyer plate impact time, images
were randomly obtained no more than 1 ns before impact
or no more than 1 ns after impact.
Figure 11 shows grazing illumination stroboscopic
images of 25, 50 and 75 lm thick Al flyers and a 25 lmthick Cu flyer, taken *2 ns after impact. These images
show all flyer plates as uniform disks in contact with the
glass surface. The thicker Al flyers and the Cu flyers are
all about 0.1 mm smaller in diameter than the 25 lm Al
flyer.
Figure 12 shows one application for these laser-laun-
ched flyers, that involves researching the kinetics of impact
initiation of explosives. The sample consisted of a fine
powder of the explosive HMX (octahydro-1,3,5,7-tetrani-
tro-1,3,5,7-tetrazocine), produced by fluid-energy milling
[41], in a 40 lm thick layer, against the same kind of glass
window used in the other measurements. The emission
from a 100 lm diameter region at the center of the impact
region (Fig. 1b) was detected by a time-resolved spec-
trometer with 32 wavelength-separated channels described
in another publication [42]. Due to the zero problem with
logarithmic time bases, the instant of impact was set to
10-8 s. When the 25 lm Al flyer plate speed was
2.6 km s-1, intense emission was observed during the
shock in HMX, as shown in Fig. 11a. A second emission
burst lasting a few ls was observed after a delay of a few
hundred ns. When the flyer impacted glass only, minimal
emission was observed, showing the flyer plates initiated a
powerful chemical reaction in the HMX.
Discussion
We have shown that our apparatus can launch 0.5 mm
diameter flyer plates made of Al and Cu at velocities up to
6.3 km s-1, and photograph them with strobe pulses syn-
chronized to the flyer impact. Using a single flyer plate
optic, simply consisting of a sheet of metal foil bonded to a
glass window, we could launch between 30 and 60 flyers.
The number of flyers we could launch depended on how
much each flyer launch disturbed the surrounding foil,
Fig. 7 Impact times at a glass target (top) and variations of flyer plate
velocities (bottom), for flyers launched from a single flyer plate optic
consisting of a sheet of metal foil bonded to glass (Color
figure online)
200 J. dynamic behavior mater. (2016) 2:194–206
123

which was greater with thicker flyers and higher-energy
launch pulses. The ultrafast optical microscopy data
focused primarily on 25 lm thick Al flyers launched across
a short 125 lm gap, because those conditions gave the best
and most reproducible results, but results for other flyers
that were hardly worse were also presented.
Table 1 Flyer velocities, target impact times and their variations (one standard deviation)
Flyer
material
Thick-ness
(lm)
Number of
shots
Launch laser
energy (mJ)
Launch laser
fluence (J cm-2)
Flight
distance
(lm)
Velocity
(km s-1)
% velocity
variation
Impact time
(ns)
Al 25 36 300 78 125 1.31 (±0.007) 0.56 123.8 (±0.81)
Al 50 51 300 78 375 0.97 (±0.014) 1.46 432.4 (±7.5)
Al 50 51 600 156 500 1.02 (±0.012) 1.19 546.8 (±5.8)
Al 75 51 300 78 375 0.84 (±0.010) 1.19 490.3 (±5.13)
Al 75 51 600 156 375 0.92 (±0.015) 1.63 456.2 (±6.86)
Cu 25 31 600 156 375 1.13 (±0.02) 2.11 394.5 (±6.3)
Fig. 8 Ultrafast images of 25 lm thick 1.3 km s-1 flyers impacting a
glass target. A representative PDV trace is shown at bottom right. The
strobe was flashed at the times indicated by blue squares. a Prior to
launch. The dotted circle indicates the field of view of the microscope
objective. b 54 ns before impact. c 5 ns before impact. d 2 ns after
impact. e 7 ns after impact. f 9 ns after impact. g 33 ns after impact.
h 48 ns after impact. i 80 ns after impact. j 155 ns after impact (Color
figure online)
J. dynamic behavior mater. (2016) 2:194–206 201
123

Flyer velocities
Besides the velocity versus laser fluence results in Fig. 6,
there were two notable observations, the lower speed cut-
off and the variability among flyer plate optics described in
Fig. 7 and Table 1. The lower speed cut-off results from
edge effects. At lower laser fluences, a portion of the foil
will puff out from the glass substrate but a flyer will not
detach. This occurs when the fluence is not high enough to
overcome the cohesion at the perimeter of the flyer disk
[22]. As shown in Fig. 6, we did not obtain much data for
flyers launched below 0.5 km s-1. The exception was the
25 lm thick Al data, where we made a special effort to
fabricate a flyer plate optic with detached discrete 700 lmflyers [22]. Then we were able to launch flyers as slow as
0.1 km s-1. We presume that the discrete flyer arrange-
ment would work for the other foils, but we have not
demonstrated it.
Fig. 9 Timing diagram for Fig. 10. A series of 25 lm thick Al flyers
were launched from the same flyer plate optic at a glass target at
1.4 km s-1, and images were acquired by femtosecond strobe pulses
arriving at the mean time of impact, as denoted by the blue square on
this typical PDV velocity history (Color figure online)
Fig. 10 Ultrafast images of 25 lm thick 1.4 km s-1 Al flyers
impacting a glass target, obtained with 35 consecutive shots from
the same flyer plate optic. The strobe pulse was set to the mean instant
of impact. Due to the ±0.8 ns variation in impact time, images were
randomly obtained just prior to and just after impact
202 J. dynamic behavior mater. (2016) 2:194–206
123

At a given laser fluence, different flyer plate optics
launched flyers at slightly different velocities. An example
is shown by the data in Figs. 8 and 9, where 25 lm Al
flyers were launched with 300 mJ pulses. In the first case
the speed was 1.3 km s-1 and in the second 1.4 km s-1.
We believe this variability results from random variability
in the glass surface quality. The laser drive pulses are
absorbed at the glass/epoxy interface (Fig. 1), the amount
of energy absorbed and the flyer speed depends on the glass
surface damage threshold [14, 15, 22], and the manufac-
turer does not control for this property. If we want to
perform experiments at a particular flyer speed, we have to
take a few ranging shots initially to determine the behavior
of each flyer plate optic.
Velocity and Impact Time Variations
When 30–60 flyers were launched from a single flyer plate
optic at a constant laser fluence, the velocities varied
slightly. As shown in Table 1, the fractional variations
ranged from 0.56 to 2.11 %. We believe the primary cause
of velocity variations[0.5 % is foil quality and the care
taken to bond the foil to the glass substrate. The 25 lm Al
foils were smoother and shinier than the thicker foils, and
easier to bond uniformly, so those generally gave the best
results.
The impact time variations depend on the velocity
variations, and they are proportional to the flight distance
and inversely proportional to the flight velocity. The choice
of gap thickness depends on the acceleration and rever-
beration damping profile of the flyer launch, as illustrated
in Fig. 2b and as described in detail previously [17]. The
reverberation damping is faster with thinner foils, and in
our 1.3–1.4 km s-1 25 lm Al flyer measurements, we were
able to use a small gap of 125 lm. These conditions pro-
duced the smallest impact time variations of 0.8 ns. In
other, less favorable cases, those variations were seen to be
as large as 7.5 ns, as seen in Table 1.
Flyer Flatness and Tilt
The most comprehensive information regarding flyer flat-
ness and tilt can be derived from Fig. 10, which show 35
images obtained with the strobe set to the mean time of
impact. Due to impact time variations, images randomly
were obtained\1 ns before impact when flyer plates were
practically invisible, or\1 ns after impact where the flyers
could be easily seen. In the post-impact images, the flyer
plates were always uniform disks *0.5 mm in diameter.
To interpret the data in Fig. 10, consider what would be
observed in the collision between a 0.5 mm flyer with a
Fig. 11 Images of flyers taken 2 ns after impacting a glass target.
The 25 lm flyer diameter was the same as the 0.5 mm uniform part of
the launch laser beam. The thicker Al and Cu flyer diameters were
about 20 % smaller due to edge effects resulting from cohesive forces
as the flyers were torn away from the foil sheet
Fig. 12 Time-dependent emission spectra of a 40 lm thick layer of
HMX fine powder on glass after impact with a 25 lm thick Al flyer at
2.58 km s-1. a HMX emission. b Glass emission at the same impact
velocity. Due to the log(time) axis, time was shifted so that 10-8 s
denoted the instant of flyer impact (Color figure online)
J. dynamic behavior mater. (2016) 2:194–206 203
123

glass target if the two surfaces were flat and parallel. In the
grazing-incidence geometry, when the flyer plate approa-
ches the glass within about one visible wavelength
k & 0.5 lm, it creates a mirror-like surface that reduces
the strobe light scattered back into the microscope objec-
tive, causing a dark 0.5 mm disk to appear. When the flyer
velocity was 1.4 km s-1, the time interval between this
close approach and impact would be only 350 ps, so we
will ignore it.
On the other hand, if the flyer were tilted, then at shorter
times we would not see a disk, we would see a partial disk.
For instance, at an instant when only one-half of the flyer
was in contact with the glass target, we would see a half-
moon shape. If a flyer were not flat, for instance if its
surface had hills and valleys, then as the flyer came into
contact with the glass target we would see dark hills and
brighter valleys. These conditions, partial disks, hills and
valleys were never observed in Fig. 10. We observed only
uniform disks or no disks. In fact every post-impact image
(19/38) was a nearly perfect disk. This indicates the impact
tilt is very small and the flyer plates are flat at impact.
Although we cannot quantitatively determine the tilt and
flatness from the data in Fig. 10, we can estimate it. In all
the post-impact images in Fig. 10, the entire 0.5 mm flyer
disk must be within 0.5 lm of the glass target and PDV
shows flight to impact in\0.5 ns. This implies a tilt of\1
mrad for every impact.
Flyer Diameters
The flyer diameters should be affected by two types of edge
effects, one arising from the soft edges of the launch laser
beam and the other from cohesive forces within the metal
foils that inhibit tearing away a flyer disk from the foil sheet.
As described in Fig. 1, the launch laser beam had a
0.5 mm flat region and soft edges that extended to about
0.7 mm. Thus based solely on this beam profile, our initial
expectation would be that we should launch 0.5 mm flyers
accompanied by an outer ring, extending out to perhaps
0.6–0.7 mm, that moved at slower velocities. That appears
to be the case, as shown in Fig. 8 for 25 lm Al flyers. The
initial impact created a disk that was 0.48 mm in diameter
(Fig. 8d), but 5 ns later (Fig. 8e) the disk had enlarged to
0.6 mm in diameter.
When thicker Al or 25 lm thick Cu flyers were laun-
ched, as shown in Fig. 11, the disks appearing on the glass
target were noticeably smaller, about 20 % smaller, than
with the 25 lm Al flyers. Based on Fig. 11, we conclude
that edge cohesion effects reduced the diameter of the
planar flyer plates launched from these foils to slightly less
than the 0.5 mm diameter of the uniform part of the launch
beam.
Summary and Conclusions
In this study, we used PDV to determine the velocity range
for Al and Cu flyers launched from a simple flyer plate
optic consisting of a metal foil bonded to a glass window,
employing a shock launch mechanism that creates cold,
intact flyers. With a single flyer plate optic, we can launch
30-60 flyers. The launch process shows a high degree of
reproducibility, in the case of 25 lm thick Al flyers the
velocity variations for 36 launches were 0.56 %. Other Al
flyer plate optics had slightly worse velocity variations of
1–1.5 %. The Cu flyers had the largest velocity variations
of 2.11 %. We believe we could improve the velocity
variations[0.5 % by devoting more effort to fabricating
more perfect flyer launch optics, but the simple methods
we used seem adequate for most applications.
The impact time with a glass target after flying across a
vacuum gap also showed a high degree of reproducibility.
With the 25 lm Al flyers launched across a minimal
125 lm gap, the impact time variation was just 0.8 ns.
Ultrafast strobe photography, using an amplified fem-
tosecond laser interfaced with the nanosecond launch laser,
provided information about the uniformity and tilt of the
flyer impact with a flat glass target. In the case we studied
the most, which was the best case, 25 lm Al flyers
exhibited a high degree of flatness and minimal tilt. The tilt
in this case was estimated to be\1 mrad.
The simple foil sheet method does create edge effects
when the flyers tear themselves away from the sheet. Edge
effects limit our ability to launch flyers at lower speeds
\0.5 km s-1 due to the inhibiting effects of foil cohesion.
Edge effects also reduce the effective flyer diameter by
about 20 % when the uniform part of the launch beam was
0.5 mm. These effects can be mostly eliminated using
individual flyer cut-outs, but that increases the fabrication
time significantly.
The reproducibility, planarity and tilt values obtained
here for laser-launched thin foils compare well with the
most precise gas guns, and the laser-launched foil appa-
ratus can support many more shots, often 100 per day.
The primary limitation of this system is the limited
duration of the shock pulses, which are generally\20 ns.
For this reason, this apparatus is well-suited to under-
standing the shorter-time behavior of shocked media in
greater detail than has been possible previously [20, 43,
44]. One example application briefly described here is the
use of this apparatus to study the shorter-time behavior of
impact initiation of the high explosive HMX. The ability
of an impactor to initiate explosives depends both on
shock pressure and shock duration. A P2t = constant
relation is most commonly used to describe explosives
initiation thresholds [45, 46], so, for example, the shock
204 J. dynamic behavior mater. (2016) 2:194–206
123

pressure must be increased by four if the duration is
reduced by two. As we have shown in Fig. 12, despite the
limited duration of shocks produced by the thin flyer
plates, it is still possible to initiate explosive chemistries
in high explosives.
Acknowledgments The research described in this study was based
on work supported by the US Army Research Office under award
W911NF-13-1-0217, the US Air Force Office of Scientific Research
under awards FA9550-14-1-0142 and FA9550-16-1-0042, the
Defense Threat Reduction Agency under award HDTRA1-12-1-0011,
and the Office of Naval Research under award N00014-12-1-0828.
William L. Shaw and Will P. Bassett acknowledge support from the
Stewardship Sciences Academic Alliance Program from the Carne-
gie-DOE Alliance Center, under DOE award DE-NA0002006.
References
1. He H, Sekine T, Kobayashi T, Kimoto K (2001) Accurate mea-
surement of the velocity history of a laser-driven foil plate with a
push-pull-type VISAR. Appl Opt 40:6327–6333
2. Tanaka KA, Hara M, Ozaki N, Sasatani Y, Kondo K, Nakano M,
Nishihara K, Takenaka H, Yoshida M, Mima K (2000) Multi-
layered flyer accelerated by laser induced shock waves. Phys
Plasma 7:676–680
3. Cagnoux J, Chartagnac P, Hereil P, Perez M (1987) Lagrangian
analysis. Modern tool of the dynamics of solids. Ann Phys Fr
12:451–524
4. Forbes JW (2012) Shock wave compression of condensed matter.
A primer. Springer, New York
5. Mashimo T, Sawaoka A (1981) A measurement system for
interior projectile motion and particle-velocity histories for
impact shock study with a two-stage light gas gun. Jpn J Appl
Phys 20:963–970
6. Fowles GR, Duvall GE, Asay J, Bellamy P, Feistmann F, Grady
D, Michaels T, Mitchell R (1970) Gas gun for impact studies.
Rev Sci Instrum 41:984–996
7. Gupta YM, Keough DD, Walter DF, Dao KC, Henley D,
Urweider A (1980) Experimental facility to produce and measure
compression and shear waves in impacted solids. Rev Sci Instrum
51:183–194
8. Ito K, Aizawa T, Paisley DL (1998) Laser-driven shock device
for real-time Hugoniot measurement. Rev High Press Sci Technol
7:876–878
9. Paisley DL, Luo S-N, Greenfield SR, Koskelo AC (2008)
Laser-launched flyer plate and confined laser ablation for shock
wave loading: validation and applications. Rev Sci Instrum
79:023902
10. Swift DC, Niemczura JG, Paisley DL, Johnson RP, Luo S-N,
Tierney TE IV (2005) Laser-launched flyer plates for shock
physics experiments. Rev Sci Instrum 76:093907
11. X-h Zhao, Zhao X, G-c Shan, Gao Y (2011) Fiber-coupled laser-
driven flyer plates system. Rev Sci Instrum 82:043904
12. Watson S, Field JE (2000) Integrity of thin, laser-driven flyer
plates. J Appl Phys 88:3859–3864
13. Yu H, Fedotov V, Baek W, Yoh JJ (2014) Towards controlled
flyer acceleration by a laser-driven mini flyer. Appl Phys A
115:971–978
14. Greenaway MW, Proud WG, Field JE, Goveas SG (2002) The
development and study of a fiber delivery system for beam
shaping. Rev Sci Instrum 73:2185–2189
15. Greenaway MW, Proud WG, Field JE, Goveas SG (2003) A
laser-accelerated flyer system. Int J Impact Eng 29:317–321
16. Strand OT, Goosman DR, Martinez C, Whitworth TL, Kuhlow
WW (2006) Compact system for high-speed velocimetry using
heterodyne techniques. Rev Sci Instrum 77:083108
17. Curtis AD, Banishev AA, Shaw WL, Dlott DD (2014) Laser-
driven flyer plates for shock compression science: launch and
target impact probed by photon Doppler velocimetry. Rev Sci
Instrum 85:043908
18. Curtis AD, Dlott DD (2014) Dynamics of shocks in laser-laun-
ched flyer plates probed by photon Doppler velocimetry. J Phys:
Conf Ser 500:192002
19. Weng J, Wang XX, Ma Y, Tan H, Cai L, Li J, Liu C (2008) A
compact all-fiber displacement interferometer for measuring the
foil velocity driven by laser. Rev Sci Instrum 79:113101
20. Banishev AA, Shaw WL, Dlott DD (2014) Dynamics of polymer
response to nanosecond shock compression. Appl Phys Lett
104:101914
21. He H, Kobayshi T, Sekine T (2001) Time-resolved measurement
on ablative acceleration of foil plates driven by pulsed laser
beam. Rev Sci Instrum 72:2032–2035
22. Brown KE, Shaw WL, Zheng X, Dlott DD (2012) Simplified
laser-driven flyer plates for shock compression science. Rev Sci
Instrum 83:103901
23. Frank AM, Trott WM (1994) Stop motion microphotography of
laser driven plates. SPIE, San Diego
24. Lawrence RJ, Trott WM (1993) Theoretical analysis of a pulsed-
laser-driven hypervelocity flyer launcher. Int J Impact Eng
14:439–449
25. Trott WM (1996) High-speed optical studies of the driving
plasma in laser acceleration of flyer plates. AIP Conf Proc
370:921–924
26. Paisley DL, Luo SN, Swift DC, Greenfield S, Loomis E, Johnson
R, Peralta P, Koskelo A, Tonks D (2007) Experimental method
for laser-driven flyer plates for 1-D shocks. AIP Conf Proc
955:1337–1340
27. Trott WM, Meeks KD (1990) High-power Nd: glass laser trans-
mission through optical fibers and its use in acceleration of thin
foil targets. J Appl Phys 67:3297–3301
28. Rupp TD, Gehr RJ, Bucholtz S, Robbins DL, Stahl DB, Sheffield
SA (2003) Stereo camera system for three-dimensional recon-
struction of a flyer plate in flight. Rev Sci Instrum 74:5274–5281
29. Greenfield SR, Luo SN, Paisley DL, Loomis EN, Swift DC,
Koskelo AC (2007) Transient imaging displacement interferom-
etry applied to shock loading. AIP Conf Proc 955:1093–1096
30. Stahl DB, Paisley DL (1994) Carbon-assisted flyer plates. In:
U.P. Office (ed). Washington, DC, US Department of Energy
31. Jensen BJ, Holtkamp DB, Rigg PA, Dolan DH (2007) Accuracy
limits and window corrections for photon Doppler velocimetry.
J Appl Phys 101:013523
32. Barker LM (1972) Laser interferometry in shock-wave research.
Exp Mech 12:209–215
33. Shaw WL, Curtis AD, Banishev AA, Dlott DD (2014) Laser-
driven flyer plates for shock compression spectroscopy. J Phys
500:142011
34. Marsh SP (1980) LASL shock Hugoniot data. University of
California Press, Berkeley
35. W-l Liu, Bassett WP, Christensen JM, Dlott DD (2015) Emission
lifetimes of a fluorescent dye under shock compression. J Phys
Chem A 119:10910–10916
36. Liu W-l, Christensen JM, Bassett WP, Dlott DD (2015) Photo-
physics of fluorescent probes under shock compression. AIP Conf
Proc (in press)
37. Khare R, Shukla PK (2010) Temporal stretching of laser pulses.
In: Duarte FJ (ed) Coherence and ultrashort pulse laser emission.
InTech, Rijeka
38. Alfano RR (1989) The supercontinuum laser source. Springer,
New York
J. dynamic behavior mater. (2016) 2:194–206 205
123

39. Brown KE, Fu Y, Shaw WL, Dlott DD (2012) Time-resolved
emission of dye probes in a shock-compressed polymer. J Appl
Phys 112:103508
40. Fujiwara H, Brown KE, Dlott DD (2010) High-energy flat-top
beams for laser launching using a Gaussian mirror. Appl Opt
49:3723–3731
41. Welle EJ, Molek CD, Wixom RR, Samuels P (2014)
Microstructural effects on the ignition behavior of HMX. J Phys
500:052049
42. Bassett WP, Dlott DD (2015) 32-channel pyrometer with high
dynamic range for studies of shocked thermites. AIP Conf Proc
(in press)
43. Banishev AA, Dlott DD (2014) Ultrafast pressure-sensitive paint
for shock compression spectroscopy. J Appl Phys 115:203515
44. Christensen JM, Banishev AA, Dlott DD (2014) Bright emissive
core-shell spherical microparticles for shock compression spec-
troscopy. J Appl Phys 116:033513
45. Andersen WH (1984) Approximate method of calculating critical
shock initiation conditions and run distance to detonation. Pro-
pellants Explos Pyrotech 9:39–44
46. Walker FE, Walsey RJ (1976) A general model for the shock
initiation of explosives. Propellants Explos Pyrotech 1:73–80
206 J. dynamic behavior mater. (2016) 2:194–206
123