high school equivalency program (hep) and college … · college assistance migrant program data...
TRANSCRIPT

REPORT TO CONGRESS
High School Equivalency Program (HEP) and College Assistance Migrant Program (CAMP)
FY 2018
U.S. Department of Education Office of Elementary and Secondary Education

HEP-CAMP FY 2018 Report to Congress Page ii
U.S. Department of Education Betsy DeVos Secretary Office of Elementary and Secondary Education Frank Brogan Assistant Secretary for Elementary and Secondary Education Office of Migrant Education Lisa C. Gillette Director July 2018 This report is in the public domain. Authorization to reproduce it in whole or in part is granted. While permission to reprint this publication is not necessary, the citation should be: U.S. Department of Education, Office of Elementary and Secondary Education, Office of Migrant Education, HEP-CAMP FY 2018 Report to Congress, Washington, D.C., 2018. To order copies of this report, write to: ED Pubs, Education Publications Center, U.S. Department of Education, P. O. Box 22207, Alexandria, VA 22304; or e-mail your request to: [email protected]. or call in your request toll-free: 1-877-433-7827 (1-877-4-ED-PUBS). Those who use a telecommunications device for the deaf (TDD) or a teletypewriter (TTY), should call 1-877-576-7734. or order online at: www.ed.gov/edpubs. This report is also available on the Department’s Web site at http://www2.ed.gov/about/offices/list/oese/ome/index.html. On request, this publication is available in alternative formats, such as Braille, large print, or CD Rom. For more information, please contact Edward Monaghan at 202-260-2823 or [email protected].

HEP-CAMP FY 2018 Report to Congress Page iii
The Office of Migrant Education welcomes all comments and suggestions on both the content and presentation of this report. Please forward them to Edward Monaghan at [email protected]. Office of Migrant Education U.S. Department of Education Washington, D.C. 20202–6135 “The mission of the Office of Elementary and Secondary Education is to promote academic excellence, enhance educational opportunities and equity for all of America’s children and families, and to improve the quality of teaching and learning by providing leadership, technical assistance and financial support.” Website for the Office of Migrant Education: http://www2.ed.gov/about/offices/list/oese/ome/index.html

HEP-CAMP FY 2018 Report to Congress Page iv
CONTENTS
CONTENTS ............................................................................................................................... iv FOREWORD ............................................................................................................................. 1 SUMMARY OF PERFORMANCE DATA .................................................................................... 2
Program Performance Measures .................................................................................... 2 High School Equivalency Program Data ......................................................................... 2 Table 1: HEP GPRA Measure 1 Performance Results for FY 2014 – FY 2016 .............. 4 Table 2: HEP GPRA Measure 2 Performance Results for FY 2014 – FY 2016 ............. 4 Table 3: HEP Efficiency Measure Results for FY 2014 – FY 2016 ................................. 5 College Assistance Migrant Program Data ..................................................................... 6 Table 4: CAMP GPRA Measure 1 Performance Results for FY 2015 – FY 2016 ........... 7 Table 5: CAMP GPRA Measure 2 Performance Results for FY 2015 – FY 2016 ........... 7 Table 6: CAMP Efficiency Measure Results for FY 2015 – FY 2016 .............................. 8 Accomplishments and Initiatives ..................................................................................... 8
PERFORMANCE DETAILS AND DISAGGREGATED RESULTS .............................................10 How to Read the Results ...............................................................................................10 Definitions of Key Terms ...............................................................................................10 HEP Performance Details and Disaggregated Results ..................................................13 Table 7: HEP Number Served Subgroup Results for FY 2014 – FY 2016 .....................13 Table 8: HEP GPRA Measure 1 Subgroup Performance Results for FY 2014 – FY 2016 .................................................................. ………………………………………..14 Table 9: HEP GPRA Measure 2 Subgroup Performance Results for FY 2014 – FY 2016 .........................................................................................................................15 CAMP Performance Details and Disaggregated Results ...............................................16 Table 10: CAMP Number Served Subgroup Results for FY 2015 – FY 2016 ................16 Table 11: CAMP GPRA Measure 1 Subgroup Performance Results for FY 2015 – FY 2016 .........................................................................................................................17 Table 12: CAMP GPRA Measure 2 Subgroup Performance Results for FY 2015 – FY 2016 .........................................................................................................................18 CAMP Graduation Data .................................................................................................18 Table 13: CAMP Graduation Data for FY 2015 – FY 2016 ............................................19
APPENDICES ...........................................................................................................................20 Office of Migrant Education Links. .................................................................................20 Abbreviations .................................................................................................................20

HEP-CAMP FY 2018 Report to Congress Page 1 of 21
FOREWORD
The High School Equivalency Program (HEP) and the College Assistance Migrant Program (CAMP) are authorized by Title IV, Section 418A of the Higher Education Act of 1965 (HEA), as amended by section 408 of the Higher Education Opportunity Act (HEOA), P.L. 110-315. The purpose of the HEP is to help migrant and seasonal farmworkers and members of their immediate family obtain the equivalent of a secondary school diploma and subsequently to gain employment or be placed in the military, an institution of higher education (IHE), or another postsecondary education or training program. The purpose of the CAMP is to provide the academic and financial support necessary to help migrant and seasonal farmworkers and members of their immediate family who have been accepted into an IHE to successfully complete their first year of college. Section 418(h) of the HEA requires the Secretary to collect data annually on persons receiving services under these programs, including their rates of secondary school graduation, entrance into postsecondary education, and completion of postsecondary education, as applicable, and to submit biennial reports to Congress on the most recently available data for the program. These reports must also be made available to the public.

HEP-CAMP FY 2018 Report to Congress Page 2 of 21
SUMMARY OF PERFORMANCE DATA Program Performance Measures The Government Performance and Results Act (GPRA) requires all Federal agencies to establish strategic goals, performance measures, and performance targets. The U.S. Department of Education (Department) established two performance measures for projects implementing the HEP and two performance measures for projects implementing the CAMP in fiscal year (FY) 2016. The performance measures for the HEP are (1) the percentage of HEP participants who receive a High School Equivalency Diploma (HSED), and (2) the percentage of HEP HSED recipients who enter postsecondary education training programs, upgraded employment, or the military. The performance measures for the CAMP are (1) the percentage of CAMP participants who complete the first academic year of their postsecondary program, and (2) the percentage of CAMP participants who complete their first academic year of college and continue their postsecondary education. The Department requires each HEP and CAMP grantee to submit an annual performance report (APR) that contains data with regard to the grantee’s progress in meeting the two approved performance targets for each program.
High School Equivalency Program Data The targets1 the Department established for the HEP measures for use in FY 2014 through FY 2016 were (1) 69 percent of HEP participants would receive a HSED, and (2) 80 percent of HEP HSED recipients would enter postsecondary education or training programs, attain upgraded employment, or enter the military. During those years, between 42.6 percent and 70.3 percent of participants attained a HSED, and between 78.2 percent and 79.9 percent of HSED recipients entered postsecondary education or training programs, upgraded employment, or the military. The HEP exceeded the
1 The Department used baseline data from the previous year to set the initial GPRA targets in FY 2003, and increased the targets incrementally until they met a high, yet realistic expectation for program performance. The Department set the HEP GPRA 1 target in FY 2003 at 60% (two points higher than the previous two years’ results), increased the target to 69% by FY 2009, and has maintained this target through FY 2016. The Department set the initial HEP GPRA 2 target in FY 2005 at 80 percent (four points higher than the previous year’s results), and has maintained this target through FY 2016. Targets have remained level due largely to two factors: (1) it is sometimes difficult to locate former HEP students to obtain GPRA 2 data, and (2) former HEP students may not achieve placement before the project is required to submit its annual performance report data (approximately 5 months after the performance period ends).

HEP-CAMP FY 2018 Report to Congress Page 3 of 21
national target for HSED attainment in FY 2016, and the program achieved within two percent of the national target for HSED recipients to enter postsecondary education or training programs, upgraded employment, or the military in FY 2014 through FY 2016. The Department is reporting HEP data from FY 2014 at this time because the Office of Migrant Education (OME) collected revised HEP FY 2014 data in December 2016. On January 26, 2016, the General Educational Development (GED) Testing Service announced that the passing score for the GED test had been recalibrated, effectively changing the passing score for the GED from 150 to 145. The GED Testing Service also approved this scoring change retroactive to January 1, 2014, and recommended that students who scored in the range of 145 to 149 be eligible for a HSED. All States where HEP projects are operated agreed to implement the scoring change as revised by the GED Testing Service, and HEP projects submitted revised FY 2014 data to OME. The Department collects data on measures of program efficiency as well as performance outcomes for three categories of projects. For the HEP, program efficiency is determined by dividing each project’s annual budget by the total number of HEP HSED attainers. Moreover, program efficiency targets are based on actual costs in 2011 (the baseline year), multiplied by an estimated rate of inflation for IHE-associated costs and then decreased by an expected improvement in program efficiency annually of one percent. The three categories of HEP projects are commuter projects, residential projects, and commuter-residential projects. Commuter projects serve mostly students who do not live in IHE-funded housing, residential projects serve mostly students who live in IHE-funded housing, and commuter-residential projects serve both students who live in IHE-funded housing and students who do not live in IHE-funded housing. Because of a wide variation in test costs, and types and levels of support by other HSED programs, any comparison with other HSED programs’ efficiency ratios is problematic. While all HSED programs may provide educational and/or assessment services, HEP projects typically provide instructional support services, e.g., counseling, tutoring, tuition, and stipends to a specific population of individuals associated with migrant and seasonal farmwork, in order to assist participants in obtaining the HSED credential. These additional services for a mobile, largely non-English speaking population residing in rural areas require costs that other HSED programs may not have.

HEP-CAMP FY 2018 Report to Congress Page 4 of 21
Table 1: HEP GPRA Measure 1 Performance Results for FY 2014 – FY 2016 Objective: An increasing percentage of HEP participants will receive their HSED. Measure. The percentage of HEP participants receiving a HSED. Target: 69%.
Year HSED Attainers: Target HSED Attainers: Actual 2014 69% 66.6% 2015 69% 42.6% 2016 69% 70.3%
Explanation: The HEP exceeded its GPRA Measure 1 target for one of the last three years, and the percentage of HEP participants who received a HSED increased 3.7% between 2014 and 2016. The substantial decrease in HSED attainers occurred during 2015, the first full year that HEP projects implemented the 2014 GED test.
Table 2: HEP GPRA Measure 2 Performance Results for FY 2014 – FY 2016 Objective: An increasing percentage of HEP participants receiving a HSED will enter postsecondary education programs, upgraded employment, or the military. Measure. The percentage of HEP HSED recipients who enter postsecondary education programs, career positions, or the military. Target: 80%.
Year HSED Placement: Target HSED Placement: Actual
2014 80% 79.9% 2015 80% 78.2% 2016 80% 78.7%
Explanation: The HEP did not meet its GPRA Measure 2 target in any of the last three years, and the percentage of HEP HSED recipients who enter postsecondary education programs, career positions, or the military decreased 1.2% between 2014 and 2016.

HEP-CAMP FY 2018 Report to Congress Page 5 of 21
Table 3: HEP Efficiency Measure Results for FY 2014 – FY 2016
Year Cost per HSED
Received: Target2
Cost per HSED Received: Actual
2014 Commuter Projects $8,718 $5,985
2014 Residential Projects $16,962 $12,750
2014 Commuter-Residential Projects $13,732 $7,433
2015 Commuter Projects $9,104 $12,882
2015 Residential Projects $17,719 $22,847
2015 Commuter-Residential Projects $14,344 $15,377
2016 Commuter Projects $9,509 $8,075
2016 Residential Projects $18,511 $10,649
2016 Commuter-Residential Projects $14,984 $10,438
Explanation: Between FY 2014 and FY 2016, the HEP reported efficiency measure results for commuter projects that serve mostly students who do not live in IHE-funded housing, residential projects that serve mostly students who live in IHE-funded housing, and commuter-residential projects that serve both students who do not live in IHE-funded housing and students who live in IHE-funded housing. In FY 2014 and FY 2016, each type of HEP project exceeded its target for efficiency, and in FY 2015, no type of HEP project met its target for efficiency, as this was the first year that HEP projects fully implemented the 2014 GED test. By FY 2016, the average cost per HSED received in the HEP ranged from a low of $8,075 per student who participated in a commuter project to a high of $10,649 per student in a residential project.
2 The Department set HEP efficiency targets for use in FY 2012 through FY 2016, using FY 2011 baseline data and an upper quartile estimation model that includes constants of inflation, expected improvement, and costs for new HSED assessments.

HEP-CAMP FY 2018 Report to Congress Page 6 of 21
College Assistance Migrant Program Data The targets3 the Department established for the CAMP measures for use in FY 2015 and FY 2016 were (1) 86 percent of participants would complete their first academic year of their postsecondary program, and (2) 85 percent of CAMP participants who complete their first academic year in college would continue their postsecondary education. During those years, 84.5 percent and 88.1 percent of CAMP participants completed the first academic year of their postsecondary program, exceeding the national CAMP target of 86 percent in FY 2016. Also, 96.7 and 96.5 percent of CAMP students who completed their first year in college continued their postsecondary education, surpassing the national CAMP target of 85 percent in both fiscal years. The data reported here for FY 2016 exceeded both national targets and the national retention rates for first-time college freshmen returning in their second year, which was 81 percent for four-year IHEs and 61 percent for two-year IHEs in 2014.4 The Department collects data on measures of both program efficiency and performance outcomes for three categories of CAMP projects. For the CAMP, program efficiency is determined by dividing each project’s annual budget by the total number of CAMP completers who continued their postsecondary education. Moreover, program efficiency targets are based on actual costs in 2011 (the baseline year), multiplied by an estimated rate of inflation for college-associated costs and then decreased by an expected improvement in program efficiency annually of one percent. The three categories of CAMP projects include commuter projects, residential projects, and commuter-residential projects. Commuter projects serve mostly students who do not live in IHE-funded housing, residential projects serve mostly students who live in IHE-funded housing, and commuter-residential projects serve both students who live in IHE-funded housing and students who do not live in IHE-funded housing.
3 The Department used baseline data from the previous year to set the initial GPRA targets in FY 2004, and increased the targets incrementally until they met a high, yet realistic expectation for program performance. The Department set the initial CAMP GPRA 1 target in FY 2004 at 83 percent (one point higher than the previous three years’ results), increased the target to 86 percent by FY 2006, and has maintained this target at 86 percent through FY 2016. The Department set the initial CAMP GPRA 2 target in FY 2005 at 79 percent (one point higher than the previous two years’ results), increased the target to 85 percent in FY 2010, and has maintained this target at 85 percent through FY 2016. 4 Institutional retention and graduation rates for undergraduate students (2017). Retrieved May 11, 2018, from National Center for Educational Statistics web site, National Center for Educational Statistics web site.

HEP-CAMP FY 2018 Report to Congress Page 7 of 21
Table 4: CAMP GPRA Measure 1 Performance Results for FY 2015 – FY 2016 Objective: All CAMP students will complete their first academic year at a postsecondary institution in good standing. Measure. The percentage of CAMP participants completing their first year of a postsecondary program in good standing. Target: 86%. Year First Year Completers: Target First Year Completers: Actual 2015 86% 84.5% 2016 86% 88.1% Explanation: The CAMP exceeded its GPRA Measure 1 target for one of the last two years, and the percentage of CAMP participants completing their first year of a postsecondary program in good standing increased 3.6% between 2015 and 2016.
Table 5: CAMP GPRA Measure 2 Performance Results for FY 2015 – FY 2016 Objective: A majority of CAMP students who successfully complete their first academic year of college will continue in postsecondary education. Measure. The percentage of CAMP participants who, after completing their first academic year of college, continue their postsecondary education. Target: 85%.
Year First Year Completers Who Continue: Target
First Year Completers Who Continue: Actual
2015 85% 96.7% 2016 85% 96.5%
Explanation: The CAMP exceeded its GPRA Measure 2 target for each of the last two years. The percentage of CAMP participants who, after completing their first academic year of college, continued their postsecondary education decreased 0.2% between 2015 and 2016.

HEP-CAMP FY 2018 Report to Congress Page 8 of 21
Table 6: CAMP Efficiency Measure Results for FY 2015 – FY 2016
Year Cost per First Year Completer: Target5
Cost per First Year Completer Who
Continues: Actual 2015 Commuter
Projects $13,697 $10,326
2015 Residential Projects $21,952 $12,354
2015 Commuter-Residential Projects $16,693 $11,503
2016 Commuter Projects $14,314 $10,161
2016 Residential Projects $22,940 $13,279
2016 Commuter-Residential Projects $17,444 $12,311
Explanation: In FY 2015 and FY 2016, the CAMP reported efficiency measure results for commuter projects that serve mostly students who do not live in IHE-funded housing, residential projects that serve mostly students who live in IHE-funded housing, and commuter-residential projects that serve both students who do not live in IHE-funded housing and students who live in IHE-funded housing. In FY 2015 and FY 2016, each type of CAMP project exceeded its target for efficiency. By FY 2016, the average cost per first year completer who continued in postsecondary education ranged from a low of $10,161 per student for participants in commuter projects to a high of $13,279 per student for participants in residential projects.
Accomplishments and Initiatives The Department collects APRs electronically. This format provides data checks and auto-calculations to ensure data accuracy and efficient use of time, and helped grantees improve verification of the APR data. The Department reviewed grantee performance in order to identify low performing projects and provide technical assistance to grantees. Specifically, the Department used the reported data to identify and prioritize projects that require more intensive program monitoring and technical assistance, and to inform program-level decisions with regard to both eligibility for continuation awards and
5 The Department set CAMP efficiency targets for use in FY 2012 through FY 2016 using FY 2011 baseline data and an upper quartile estimation model that includes constants of inflation and expected improvement.
HEP-CAMP FY 2018 Report to Congress Page 9 of 21
issuance of new awards to applicants that had operated previously low-performing projects. In FY 2017, the Department reviewed its HEP and CAMP GPRA data, performance targets, and efficiency targets, and determined new CAMP GPRA Measure 2 targets for FY 2018 through FY 2020 and HEP and CAMP efficiency targets for FY 2017 through FY 2022. The new CAMP GPRA Measure 2 targets represent an increase from 85 percent in FY 2017 to 88 percent in FY 2018, 90 percent in FY 2019, and 92 percent in FY 2020. The new targets demonstrate increased expectations for CAMP first academic year completers to continue their postsecondary education. Additionally, new HEP and CAMP efficiency targets for FY 2017 through FY 2022 continue to incorporate expected improvements in project efficiency and new, lower inflationary costs for HEP and CAMP projects.
HEP-CAMP FY 2018 Report to Congress Page 10 of 21
PERFORMANCE DETAILS AND DISAGGREGATED RESULTS
How to Read the Results The following tables provide the HEP performance data for FY 2014 – FY 2016 and CAMP performance data for FY 2015 – FY 2016. In addition to providing information on the total population, each table provides the results and the explanations for subgroups. These subgroups include equal to or over-serving projects and under-serving projects, commuter, residential, and commuter-residential projects, open and structured enrollment projects, and large, medium, and small projects. Following each table is an analysis, which provides insights into grantees’ progress.
Definitions of Key Terms
Commuter Projects: Projects that serve mostly students who do not live in IHE-funded housing. The parameters for determining commuter projects are adjusted annually, based upon the most recent APR data. Commuter-Residential Projects: Projects that serve both students who live in IHE-funded housing and students who do not live in IHE-funded housing. The parameters for determining commuter-residential projects are adjusted annually, based upon the most recent APR data. Continuing Post-Secondary Education: CAMP students who completed their first academic year of college in a reporting period, and continued in postsecondary education programs by re-enrolling in an IHE in the academic year immediately following the one in which he or she is reported as being a first academic year completer, and remaining enrolled past the date when students can no longer add/drop courses, or a census date. Equal to or Over-Serving Projects: Projects that serve the same number or more students than the number of students proposed in their approved applications. Large CAMP Projects: CAMP projects that serve at least 75 students. Large HEP Projects: HEP projects that serve at least 125 students. Medium CAMP Projects: CAMP projects that serve between 50 and 74 students.

HEP-CAMP FY 2018 Report to Congress Page 11 of 21
Number Funded to Be Served in CAMP Instruction: As identified in the approved CAMP project applications, the number of participants to be enrolled in CAMP instruction in an IHE during a budget period for which the Department provides financial support for CAMP instruction. Number Funded to Be Served in HEP HSED Instruction: As identified in the approved HEP project applications, the number of participants to be enrolled in HSED instruction in a HEP project during a budget period for which the Department provides financial support for HSED instruction. Number Served in CAMP Instruction: The number of CAMP eligible students who completed intake and were enrolled and attending college courses past the Add/Drop deadline assigned by the project’s IHE. Number Served in HEP HSED Instruction: The number of HEP HSED eligible students who completed intake and were enrolled and attending HEP HSED instruction for at least 12 hours of instructional services during a budget period. Open Enrollment Projects: HEP projects that allow continuous entry into instructional services (i.e., there is no cut-off date for student enrollment in order to enter a course). Open-Structured Projects: HEP projects that both allow continuous entry into instructional services, and allow enrollment for a defined period of time prior to the start of instructional services. Projects at Four-Year IHEs: CAMP projects in an IHE that offers a bachelor’s degree upon successful completion of established graduation requirements. Projects at Two-Year IHEs: CAMP projects in an IHE that offers an associate’s degree upon successful completion of established graduation requirements. Residential Projects: Projects that serve mostly students who live in IHE-funded housing. The parameters for determining residential projects are adjusted annually, based upon the most recent APR data. Small CAMP Projects: CAMP projects that serve fewer than 50 students. Small HEP Projects: HEP projects that serve fewer than 125 students. Structured Enrollment Projects: HEP projects that allow enrollment for a defined period of time prior to the start of instructional services. Once the defined period of enrollment has expired, students must wait until the next semester or series of instructional services to participate in services. Total CAMP Projects: The national total number of CAMP projects.

HEP-CAMP FY 2018 Report to Congress Page 12 of 21
Total HEP Projects: The national total number of HEP projects. Two and Four-Year Projects: CAMP projects that reside in both an IHE that offers at least an associate’s degree upon successful completion of established graduation requirements, and in an IHE that offers a bachelor’s degree upon successful completion of established requirements. Under-Serving Projects: Projects that serve fewer students than the number of students proposed in their approved application. Upgraded Employment: A qualifying placement for purposes of the GPRA 2 Measure. For a student to have obtained upgraded employment, the student must have done at least one of the following: 1) moved to a job that is both full-time and salaried, compared to the job immediately prior to and/or during instructional services, or 2) moved to a job with increased benefits, such as healthcare, worker’s compensation, unemployment insurance, social security, and vacation and sick leave, compared to the job immediately prior to and/or during instructional services, or 3) obtained a position upgrade with same employer, such as a move to a supervisory position, compared to the job immediately prior to and/or during instructional services, or 4) moved to a new job with pre-defined career ladder, regardless of wage change (e.g. management trainee, formal apprenticeship), compared to career ladder options at the job immediately prior to and/or during instructional services, or 5) moved to a job with higher hourly wages than the job immediately prior to and/or during instructional services.
HEP-CAMP FY 2018 Report to Congress Page 13 of 21
HEP Performance Details and Disaggregated Results
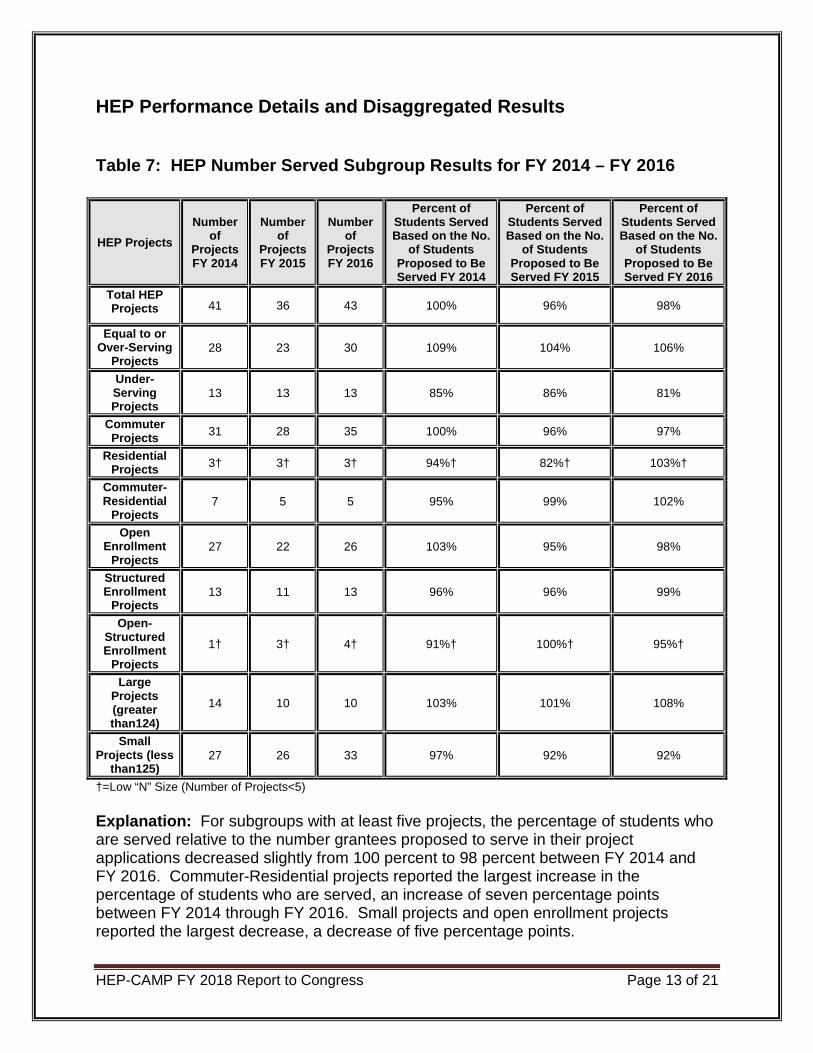
Table 7: HEP Number Served Subgroup Results for FY 2014 – FY 2016
HEP Projects Number
of Projects FY 2014
Number of
Projects FY 2015
Number of
Projects FY 2016
Percent of Students Served Based on the No.
of Students Proposed to Be Served FY 2014
Percent of Students Served Based on the No.
of Students Proposed to Be Served FY 2015
Percent of Students Served Based on the No.
of Students Proposed to Be Served FY 2016
Total HEP Projects 41 36 43 100% 96% 98%
Equal to or Over-Serving
Projects 28 23
30
109% 104% 106%
Under-Serving Projects
13 13 13 85% 86% 81%
Commuter Projects 31 28 35 100% 96% 97%
Residential Projects 3† 3† 3† 94%† 82%† 103%†
Commuter-Residential
Projects 7 5 5 95% 99% 102%
Open Enrollment
Projects 27 22 26 103% 95% 98%
Structured Enrollment
Projects 13 11 13 96% 96% 99%
Open-Structured Enrollment
Projects 1† 3† 4† 91%† 100%† 95%†
Large Projects (greater than124)
14 10 10 103% 101% 108%
Small Projects (less
than125) 27 26 33 97% 92% 92%
†=Low “N” Size (Number of Projects<5) Explanation: For subgroups with at least five projects, the percentage of students who are served relative to the number grantees proposed to serve in their project applications decreased slightly from 100 percent to 98 percent between FY 2014 and FY 2016. Commuter-Residential projects reported the largest increase in the percentage of students who are served, an increase of seven percentage points between FY 2014 through FY 2016. Small projects and open enrollment projects reported the largest decrease, a decrease of five percentage points.

HEP-CAMP FY 2018 Report to Congress Page 14 of 21
In FY 2016, equal to or over-serving projects served the highest percentage of students relative to the number projected to be served in project applications, 106 percent, while underserving projects served the lowest percentage of students relative to the number projected to be served in project applications, 81 percent, for subgroups with at least five projects.
Table 8: HEP GPRA Measure 1 Subgroup Performance Results for FY 2014 – FY 2016 HEP Objective: An increasing percentage of HEP participants will receive their HSED. Measure. The percentage of HEP participants receiving a HSED. Target: 69%.
HEP Projects Percent GPRA 1 Target FY 2014-2016
GPRA 1 Actual FY 2014 Percent
GPRA 1 Actual FY 2015 Percent
GPRA 1 Actual FY 2016 Percent
Commuter Projects 69% 66% 47% 67% Residential Projects 69% 57%† 38%† 76%†
Commuter-Residential Projects 69% 78% 55% 80%
Open Enrollment Projects 69% 65% 52% 64%
Structured Enrollment Projects 69% 70% 40% 74%
Open-Structured Enrollment Projects 69% 69%† 47%† 79%†
Large Projects (greater than124) 69% 71% 59% 75%
Small Projects (less than125) 69% 62% 40% 64%
†=Low “N” Size (Number of Projects<5) Explanation: For subgroups with at least five projects, structured enrollment projects and large projects reported the largest increase in the GPRA Measure 1, an increase of four percentage points between FY 2014 and FY 2016. Open enrollment projects were the only subgroup to report a decrease in the GPRA Measure 1, a decrease of one percentage point. In FY 2016, commuter-residential projects reported the highest GPRA Measure 1, 80 percent, while small projects and open enrollment projects reported the lowest GPRA Measure 1, 64 percent, for subgroups with at least five projects.
HEP-CAMP FY 2018 Report to Congress Page 15 of 21
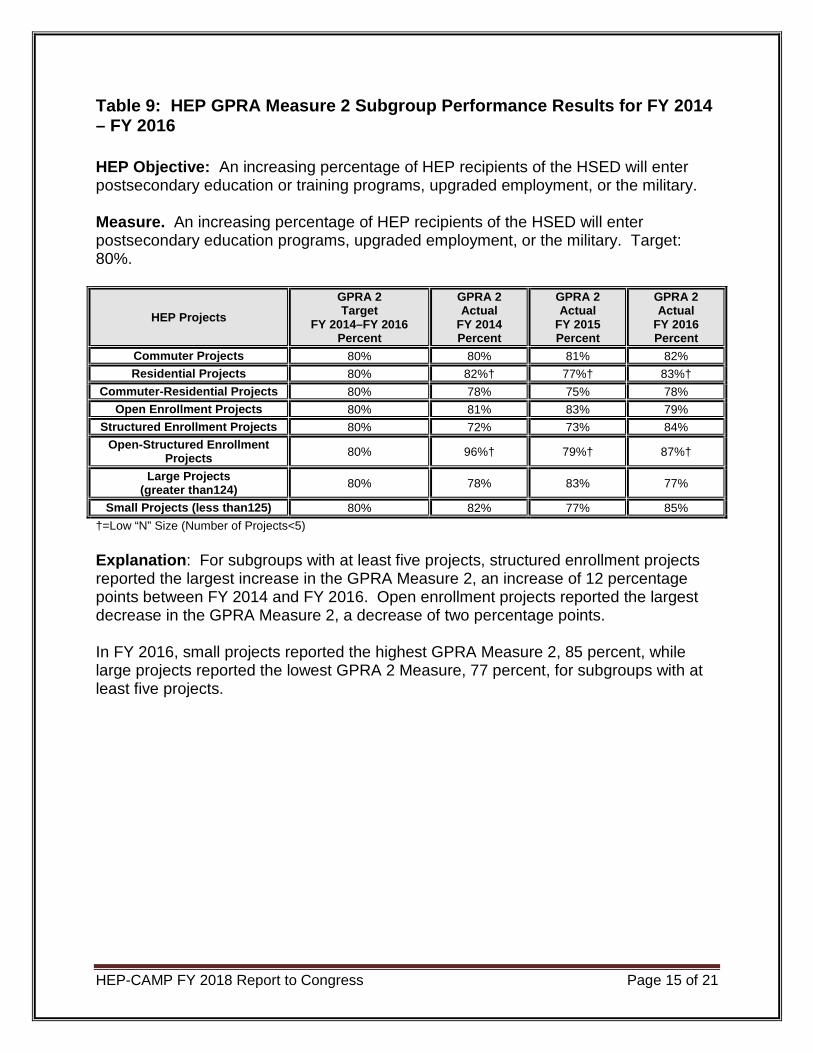
Table 9: HEP GPRA Measure 2 Subgroup Performance Results for FY 2014 – FY 2016 HEP Objective: An increasing percentage of HEP recipients of the HSED will enter postsecondary education or training programs, upgraded employment, or the military.
Measure. An increasing percentage of HEP recipients of the HSED will enter postsecondary education programs, upgraded employment, or the military. Target: 80%.
HEP Projects GPRA 2 Target
FY 2014–FY 2016 Percent
GPRA 2 Actual
FY 2014 Percent
GPRA 2 Actual
FY 2015 Percent
GPRA 2 Actual
FY 2016 Percent
Commuter Projects 80% 80% 81% 82% Residential Projects 80% 82%† 77%† 83%†
Commuter-Residential Projects 80% 78% 75% 78% Open Enrollment Projects 80% 81% 83% 79%
Structured Enrollment Projects 80% 72% 73% 84% Open-Structured Enrollment
Projects 80% 96%† 79%† 87%†
Large Projects (greater than124) 80% 78% 83% 77%
Small Projects (less than125) 80% 82% 77% 85% †=Low “N” Size (Number of Projects<5) Explanation: For subgroups with at least five projects, structured enrollment projects reported the largest increase in the GPRA Measure 2, an increase of 12 percentage points between FY 2014 and FY 2016. Open enrollment projects reported the largest decrease in the GPRA Measure 2, a decrease of two percentage points. In FY 2016, small projects reported the highest GPRA Measure 2, 85 percent, while large projects reported the lowest GPRA 2 Measure, 77 percent, for subgroups with at least five projects.
HEP-CAMP FY 2018 Report to Congress Page 16 of 21
CAMP Performance Details and Disaggregated Results
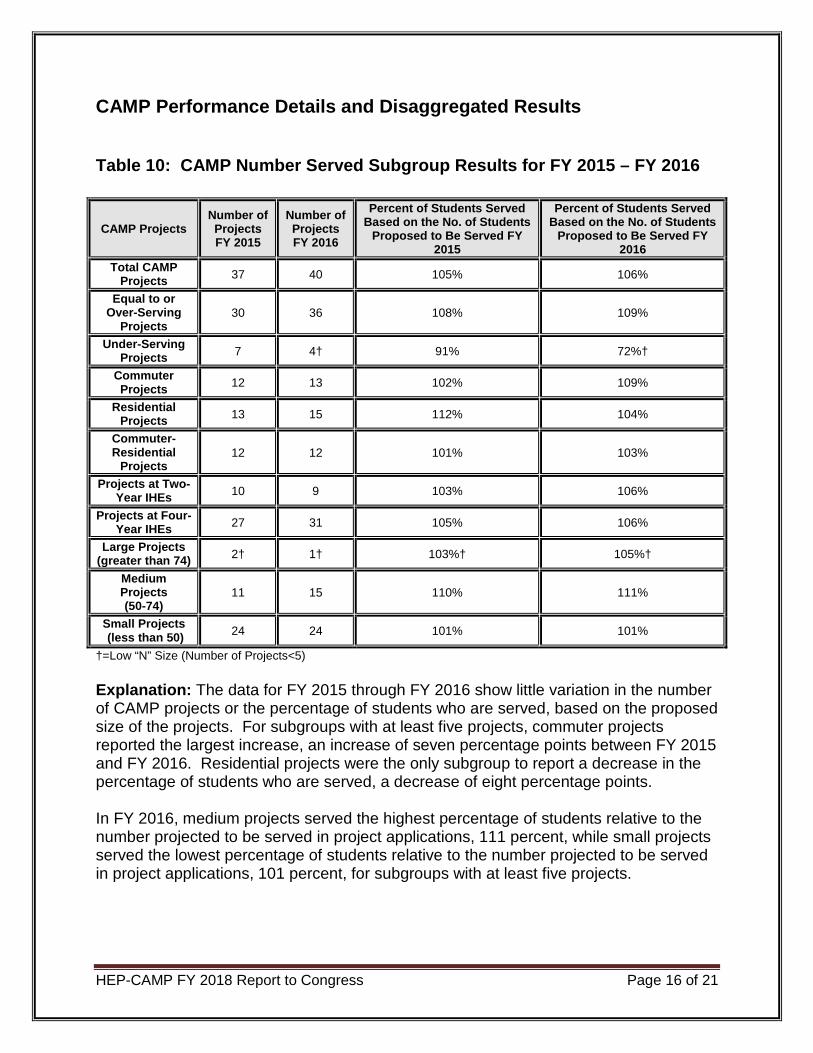
Table 10: CAMP Number Served Subgroup Results for FY 2015 – FY 2016
CAMP Projects Number of Projects FY 2015
Number of Projects FY 2016
Percent of Students Served Based on the No. of Students
Proposed to Be Served FY 2015
Percent of Students Served Based on the No. of Students
Proposed to Be Served FY 2016
Total CAMP Projects 37 40 105% 106%
Equal to or Over-Serving
Projects 30 36 108% 109%
Under-Serving Projects 7 4† 91% 72%†
Commuter Projects 12 13 102% 109%
Residential Projects 13 15 112% 104%
Commuter-Residential
Projects 12 12 101% 103%
Projects at Two-Year IHEs 10 9 103% 106%
Projects at Four-Year IHEs 27 31 105% 106%
Large Projects (greater than 74) 2† 1† 103%† 105%†
Medium Projects (50-74)
11 15 110% 111%
Small Projects (less than 50) 24 24 101% 101%
†=Low “N” Size (Number of Projects<5) Explanation: The data for FY 2015 through FY 2016 show little variation in the number of CAMP projects or the percentage of students who are served, based on the proposed size of the projects. For subgroups with at least five projects, commuter projects reported the largest increase, an increase of seven percentage points between FY 2015 and FY 2016. Residential projects were the only subgroup to report a decrease in the percentage of students who are served, a decrease of eight percentage points. In FY 2016, medium projects served the highest percentage of students relative to the number projected to be served in project applications, 111 percent, while small projects served the lowest percentage of students relative to the number projected to be served in project applications, 101 percent, for subgroups with at least five projects.

HEP-CAMP FY 2018 Report to Congress Page 17 of 21
Table 11: CAMP GPRA Measure 1 Subgroup Performance Results for FY 2015 – FY 2016 CAMP Objective: All CAMP students will complete their first academic year at a postsecondary institution in good standing. Measure. The percentage of CAMP participants completing the first year of their academic or postsecondary program. Target: 86%.
CAMP Projects Percent GPRA 1 Target FY 2015 – FY 2016
Percent GPRA 1 Actual FY 2015
Percent GPRA 1 Actual FY 2016
Commuter Projects 86% 89% 85% Residential Projects 86% 83% 85%
Commuter-Residential Projects 86% 85% 88% Projects at Two-Year IHEs
86% 85% 85%
Projects at Four-Year IHEs 86% 91% 86% Large Projects
(greater than 74) 86% 83%† 95%†
Medium Projects (50-74) 86% 88% 88%
Small Projects (less than 50) 86% 84% 83%
†=Low “N” Size (Number of Projects<5) Explanation: For subgroups with at least five projects, commuter-residential projects reported the largest increase in the GPRA Measure 1, an increase of three percentage points between FY 2015 and FY 2016. Projects at four-year IHEs reported the largest decrease in the GPRA Measure 1, a decrease of five percentage points. In FY 2016, commuter projects and medium projects reported the highest GPRA Measure 1, 88 percent, while small projects reported the lowest GPRA Measure 1, 83 percent, for subgroups with at least five projects.

HEP-CAMP FY 2018 Report to Congress Page 18 of 21
Table 12: CAMP GPRA Measure 2 Subgroup Performance Results for FY 2015 – FY 2016 CAMP Objective: A majority of CAMP students who successfully complete their first year of college will continue in postsecondary education. Measure. The percentage of CAMP participants who, after completing the first year of college, continue their postsecondary education. Target: 85%.
CAMP Projects Percent GPRA 2
Target FY 2015–FY 2016
Percent GPRA 2 Actual
FY 2015 Percent GPRA 2 Actual
FY 2016
Commuter Projects 85% 96% 96% Residential Projects 85% 99% 97%
Commuter-Residential Projects 85% 97% 97%
Projects at Two-Year IHEs 85% 97% 96%
Projects at Four-Year IHEs 85% 98% 97%
Large Projects (greater than74) 85% 100%† 90%†
Medium Projects (50-74) 85% 98% 98%
Small Projects (less than 50) 85% 96% 96%
†=Low “N” Size (Number of Projects<5) Explanation: For subgroups with at least five projects, no subgroup of projects reported an increase in the GPRA 2 Measure, between FY 2015 through FY 2016. Residential projects reported the largest decrease in the GPRA 2 Measure, a decrease of two percentage points. In FY 2016, medium projects reported the highest GPRA 2 Measure, 98 percent, while commuter projects, small projects, and projects at two-year IHEs reported the lowest GPRA 2 Measure, 96 percent, for subgroups with at least five projects.
CAMP Graduation Data The Department began collecting data on former CAMP students who graduated with an Associate of Arts (AA), a Bachelor of Arts (BA), or a Bachelor of Science (BS) degree in FY 2009. These former CAMP students would have participated in the program anytime between FY 2004 and FY 2016. During FY 2015 and FY 2016, the Department emphasized the need for grantees to secure complete CAMP graduation data, and it will continue to do so in future technical assistance to grantees.

HEP-CAMP FY 2018 Report to Congress Page 19 of 21
Enrollment data for FY 2015 and FY 2016 indicate a trend of increasing enrollment in CAMP projects. In FY 2016, a total of 1,882 CAMP students were served by the program, with 441 students enrolled in two-year IHE projects and 1,441 students enrolled in four-year projects. There has been an increase in the number of former CAMP students who have graduated from two-year IHE projects and four-year IHE projects during these two year periods due to a number of factors, including the variation in the number of projects that are funded each year and the number of new projects. The total number of Bachelor of Arts (BA) or Bachelor of Science (BS) graduates has increased from 643 to 811 between FY 2015 and FY 2016, while the total number of Associate of Arts (AA) graduates has also increased, from 215 to 319 during the same time period.
Table 13: CAMP Graduation Data for FY 2015 – FY 2016
Number of Students/Graduates Total CAMP Two-Year IHE
Projects Four-Year IHE Projects
Number of Students Served FY
2015 1,782 469 1,313
Number of Students Served FY
2016 1,882 441 1,441
Number of AA Graduates
FY 2015 215† 173† 42†
Number of AA Graduates
FY 2016 319† 269† 50†
Number of BA or BS Graduates
FY 2015 643† 68† 575†
Number of BA or BS Graduates
FY 2016 811† 83† 729†
†=The number of former CAMP students who graduated with a BA/BS or AA is dependent upon each CAMP project’s number of former CAMP students served through one or more grant cycles and each project’s capacity for tracking former CAMP students.
HEP-CAMP FY 2018 Report to Congress Page 20 of 21
APPENDICES
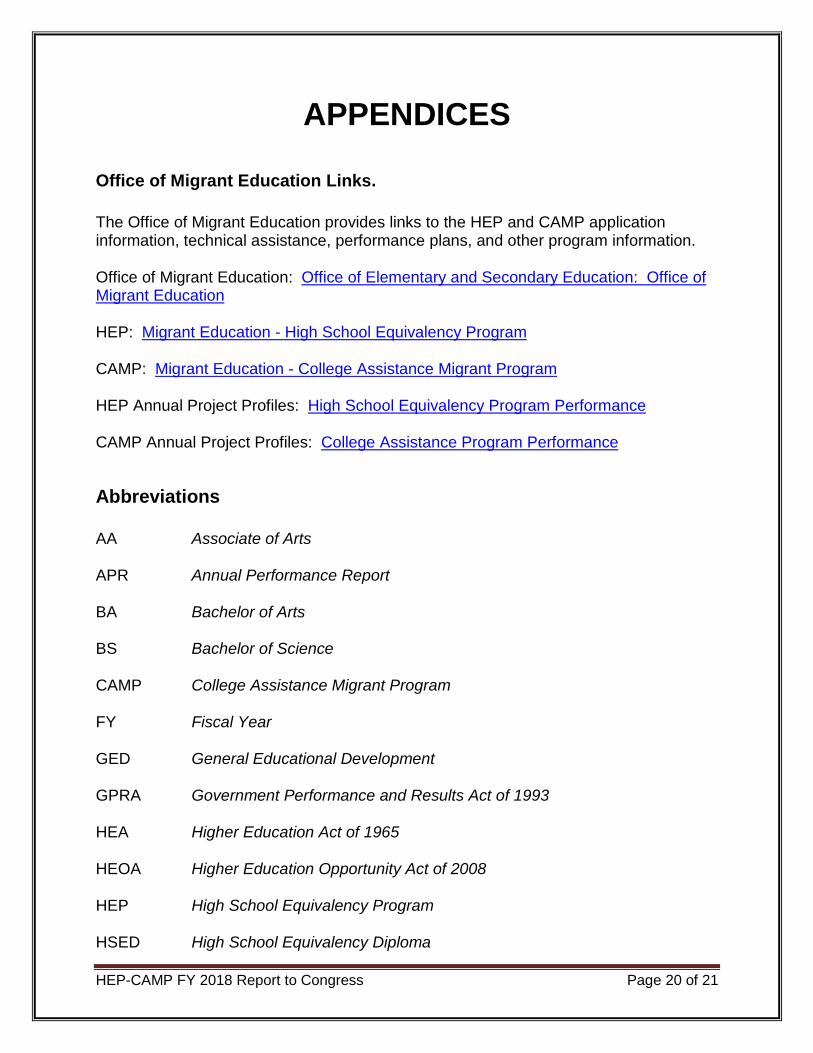
Office of Migrant Education Links. The Office of Migrant Education provides links to the HEP and CAMP application information, technical assistance, performance plans, and other program information. Office of Migrant Education: Office of Elementary and Secondary Education: Office of Migrant Education HEP: Migrant Education - High School Equivalency Program CAMP: Migrant Education - College Assistance Migrant Program HEP Annual Project Profiles: High School Equivalency Program Performance CAMP Annual Project Profiles: College Assistance Program Performance
Abbreviations AA Associate of Arts APR Annual Performance Report BA Bachelor of Arts BS Bachelor of Science CAMP College Assistance Migrant Program FY Fiscal Year GED General Educational Development GPRA Government Performance and Results Act of 1993 HEA Higher Education Act of 1965 HEOA Higher Education Opportunity Act of 2008 HEP High School Equivalency Program HSED High School Equivalency Diploma
HEP-CAMP FY 2018 Report to Congress Page 21 of 21
IHE Institution of Higher Education OME Office of Migrant Education