high-resolution small rna structures from exact nuclear
TRANSCRIPT

ARTICLE
High-resolution small RNA structures from exactnuclear Overhauser enhancement measurementswithout additional restraintsParker J. Nichols1, Morkos A. Henen 1,2, Alexandra Born1, Dean Strotz3, Peter Güntert3,4,5 & Beat Vögeli1
RNA not only translates the genetic code into proteins, but also carries out important cellular
functions. Understanding such functions requires knowledge of the structure and dynamics at
atomic resolution. Almost half of the published RNA structures have been solved by nuclear
magnetic resonance (NMR). However, as a result of severe resonance overlap and low proton
density, high-resolution RNA structures are rarely obtained from nuclear Overhauser
enhancement (NOE) data alone. Instead, additional semi-empirical restraints and labor-
intensive techniques are required for structural averages, while there are only a few
experimentally derived ensembles representing dynamics. Here we show that our exact NOE
(eNOE) based structure determination protocol is able to define a 14-mer UUCG tetraloop
structure at high resolution without other restraints. Additionally, we use eNOEs to calculate
a two-state structure, which samples its conformational space. The protocol may open an
avenue to obtain high-resolution structures of small RNA of unprecedented accuracy with
moderate experimental efforts.
DOI: 10.1038/s42003-018-0067-x OPEN
1 Department of Biochemistry and Molecular Genetics, University of Colorado Denver, Anschutz Medical Campus, 12801 East 17th Avenue, Aurora,CO 80045, USA. 2 Faculty of Pharmacy, Mansoura University, Mansoura 35516, Egypt. 3 Laboratory of Physical Chemistry, ETH Zürich, ETH-Hönggerberg,Zürich 8093, Switzerland. 4 Institute of Biophysical Chemistry, Center for Biomolecular Magnetic Resonance, Goethe University Frankfurt am Main, Frankfurtam Main 60438, Germany. 5 Graduate School of Science, Tokyo Metropolitan University, Hachioji, Tokyo 192-0397, Japan. Correspondence and requests formaterials should be addressed to B.Vög. (email: [email protected])
COMMUNICATIONS BIOLOGY | (2018) 1:61 | DOI: 10.1038/s42003-018-0067-x | www.nature.com/commsbio 1
1234
5678
90():,;
A lthough Nuclear Magnetic Resonance (NMR)-determinedstructures currently make up <10% of the total in theProtein Data Bank (PDB), they account for >40% of all
RNA structures. This is mostly due to the inherent advantages ofNMR over other structural techniques when it comes to RNA.First, solution-state NMR completely avoids the common diffi-culties involving crystallization of RNA common in X-ray1, 2.Second, NMR is one of the most powerful techniques for studyinginteractions between proteins, other nucleic acids, low molecularweight molecules, and solvent molecules. Finally, NMR is well-equipped to probe the inherent dynamics of RNA molecules,proven critical to their functions by amassing evidence3–5. Inparticular, residual dipolar couplings (RDCs) have been shownespecially fruitful for investigating such dynamics, as they arecapable of reporting on the orientation of bond vectors relative toa known molecular alignment frame6. Although X-ray crystal-lography and cryo-electron microscopy (cryo-EM) are still thetechniques of choice for investigating RNAs and RNA–proteincomplexes larger than 50 kDa, which are difficult to study usingNMR due to spectral overlap and fast T2 relaxation times, recentmethodological advances have made NMR an alternative forstudies of RNA of such sizes7–11.
Despite these advantages, NMR has room for substantialimprovement. One such area is the continued use of distance-dependent Nuclear Overhauser Enhancements (NOE) rate con-stants as semiquantitative upper limit distance restraints12, whichare employed this way due to various interfering mechanismsthroughout the pulse sequence13, but mainly spin diffusion anddynamics14. The non-exact nature of these restraints means thatimportant information about structure and dynamics is lost.Therefore, the only current NMR methods for probing dynamicsare spin relaxation measurements, which are usually used forprobing single-site flexibility and exchange, and RDCs, whichrequire high technical sophistication when applied to RNA15.
RNA poses several challenges over proteins regarding NOEspectroscopy (NOESY). As a biopolymer composed of only four
chemically unique building blocks, as opposed to 20 for proteins,RNA results in a large amount of spectral overlap, causingresonance assignment to be more difficult. This is exemplified bythe H2′-H5′′ ribose protons whose chemical shifts normallyappear within the narrow range of 4–5 ppm where water signalpredominates. The overlap problem is further increased by thepredominately A-form helical structure of RNA, which results ina lack of chemical environment diversity, especially for largerRNAs. Chemical shift diversity is therefore often only seen innon-canonical RNA structures such as hairpin loops, bulges, orinternal loops16. An additional difficulty with using NOEs inRNA structure determination is the low proton density of RNAcompared with proteins, resulting in a sparser NOE network. Thelack of sufficient NOE distance restraints means that traditionalstructure calculations have to rely on additional restraints such asdihedral angle restraints, RDCs, cross-correlated relaxation(CCR) rates17–19, electron paramagnetic resonance measure-ments20, as well as hydrogen bonding patterns, and rarely canthese RNA structures achieve high resolution with NOEsalone16, 21. Often, semi-empirical restraints such as base-pairplanarity are added that cannot be used to characterize spatialsampling because they lack an accurate parameterization relatinga specific conformation in a dynamic ensemble to an empiricalobservable. Therefore, a better use of the NOE would improve thequality of NMR structures and enable spatial sampling to beprobed.
We have previously reported on the methodology and use ofexact nuclear Overhauser enhancements (eNOEs) for the deter-mination of distances up to 5 Å with less than a 0.1 Å error inproteins (Fig. 1a)22, 23. The r−6-averaged nature of eNOEs allowsfor the construction of multi-state ensembles that describe theirconformational space (Fig. 1b)24, 25. Although we have appliedour eNOE protocol to a number of proteins25, we have yet toinvestigate its applicability to RNA. Interestingly, pioneeringwork on the extraction of exact distances in biomacromoleculesfrom NOE buildup measurements was carried out on RNA26 as
H2
Averaged eNOE (H1-H2 and H3)
eNOE (H1-H2)
eNOE (H1-H3)
eNOE multi-state structure calculation
Relative motions between protons eNOE single-state structure calculation
Stro
ng
Med
ium
Wea
k
Stro
ng
Med
ium
Wea
k
NOE cross-peak intensity
eNOEConventional NOE
r
Real distance
Upper limit restraint
Bi-directional eNOE
Uni-directional eNOE
a b
H1
H1
H3
H2
H2
H1
H1
H1
H3
H3
H
H
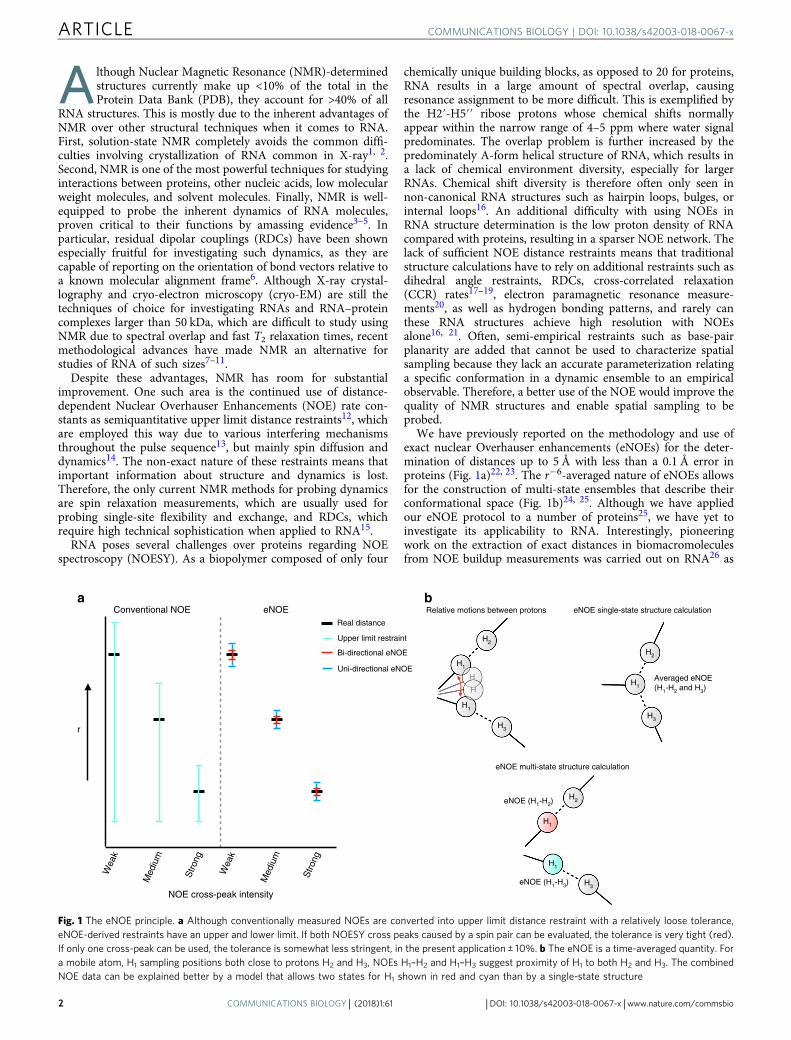
Fig. 1 The eNOE principle. a Although conventionally measured NOEs are converted into upper limit distance restraint with a relatively loose tolerance,eNOE-derived restraints have an upper and lower limit. If both NOESY cross peaks caused by a spin pair can be evaluated, the tolerance is very tight (red).If only one cross-peak can be used, the tolerance is somewhat less stringent, in the present application ± 10%. b The eNOE is a time-averaged quantity. Fora mobile atom, H1 sampling positions both close to protons H2 and H3, NOEs H1–H2 and H1–H3 suggest proximity of H1 to both H2 and H3. The combinedNOE data can be explained better by a model that allows two states for H1 shown in red and cyan than by a single-state structure
ARTICLE COMMUNICATIONS BIOLOGY | DOI: 10.1038/s42003-018-0067-x
2 COMMUNICATIONS BIOLOGY | (2018) 1:61 | DOI: 10.1038/s42003-018-0067-x | www.nature.com/commsbio
early as the late 1980s, most notably by the groups of James27, 28,Jardetzky29, Kaptein30 and Gorenstein31, 32. A typical applicationwas the distinction between A, B and D helical forms.
To determine the feasibility and accuracy of extracting eNOEdistances from RNA, we have applied our eNOE protocol to theRNA 14-mer UUCG tetraloop16, 21, 33–37. The aptly named four-nucleotide tetraloops are simple but important RNA structuralmotifs that stabilize the caps of RNA stem loops38 and have otherfunctions including initiation of RNA folding39, 40, participationin tertiary interactions in large RNAs such as ribosomal RNAs41–43 and self-splicing RNAs44, and as recognition sites for proteins
in ribonucleoprotein complexes45–47. The secondary structure ofthe 14-mer, as well as the discussed defining features of theUUCG tetraloop are shown (Fig. 2a). The high thermodynamicstability of the UUCG tetraloop has been attributed to arise froma non-canonical base-pair between U6 and G7 of the loop,favorable base-stacking between U6 and U8, and stabilizinghydrogen bonds between the U6 and U7 hydroxyls and thepurine of G948. In addition, the UUCG tetraloop adopts a Z-turnmotif that is defined by favorable O4’-π stacking contacts betweenthe ribose of C8 and the purine of G949, 50. Here, we presentevidence that eNOEs do not only provide interproton distances to
eNO
E d
ista
nce
(Å)
eNO
E d
ista
nce
(Å)
eNO
E d
ista
nce
(Å)
2KOC distance (Å)
C1 distance (Å)
C1 distance (Å)
e
f
7
π
a b d
c
8C
6U9G
6U 9G
10G5C
4A 11U
12G3C
2G
1G
13C
14C
8C
1G
7U
14C
<1/r6>
<1/r6>
1/<r>6
5
3
1
7
5'3'
4 H2
11 H3
8 H4'
8 H4'
8 H5''11 H3
5
3
60
σ = 0.403 s–1
σ = 0.176 s–1 σ = 0.260 s–1
ρ = 3.37 s–1 ρ = 2.44 s–1
σ = 0.772 s–1
200
0.02 ppm 0.04 ppm
0.02 ppm0.02 ppm
0.19 ppm
0.22 ppm0.14 ppm
0.9 ppm
0.16 ppm0.14 ppm
501.8
1.6
1.4
1.2
1.0
40
30
20
0 40 80 120 160 200 240 280 320 0
Mixing time (ms)
Int[1
/100
0/m
ulti]
[AU
]
40 80 120 160 200 240 280 320
160
120
80
40
40
20
1
7
5
3
1
1 3 5 7
1 3 5 7
1 3 5 7
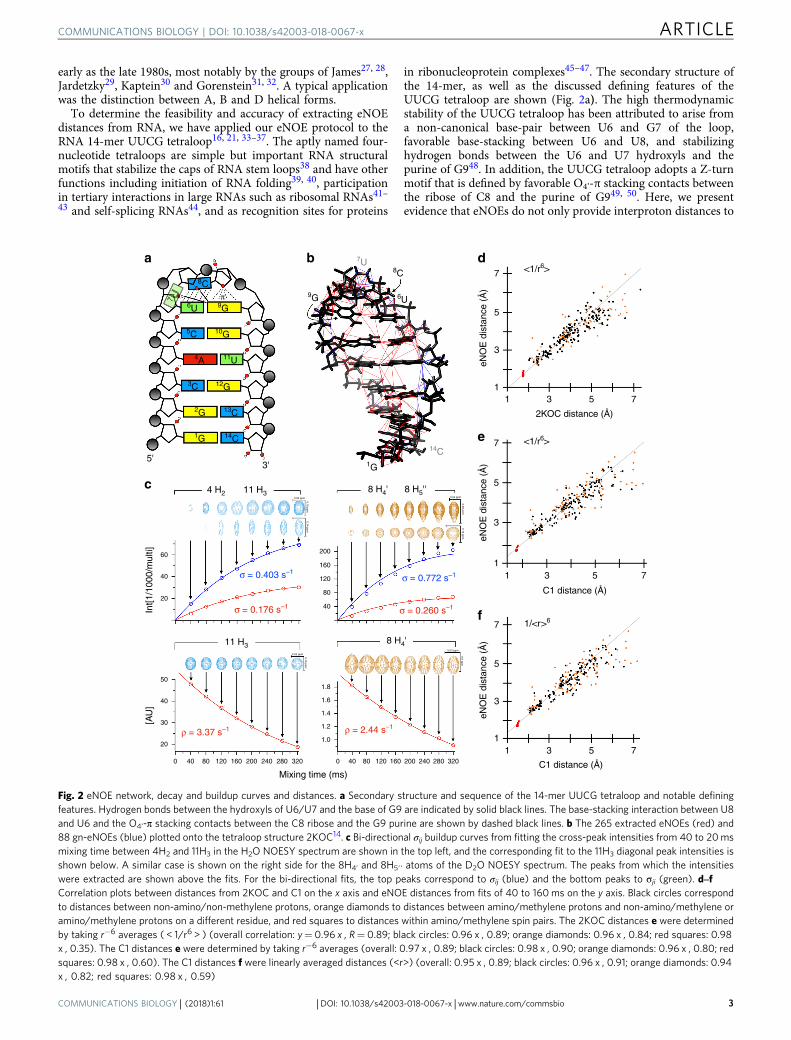
Fig. 2 eNOE network, decay and buildup curves and distances. a Secondary structure and sequence of the 14-mer UUCG tetraloop and notable definingfeatures. Hydrogen bonds between the hydroxyls of U6/U7 and the base of G9 are indicated by solid black lines. The base-stacking interaction between U8and U6 and the O4’-π stacking contacts between the C8 ribose and the G9 purine are shown by dashed black lines. b The 265 extracted eNOEs (red) and88 gn-eNOEs (blue) plotted onto the tetraloop structure 2KOC14. c Bi-directional σij buildup curves from fitting the cross-peak intensities from 40 to 20msmixing time between 4H2 and 11H3 in the H2O NOESY spectrum are shown in the top left, and the corresponding fit to the 11H3 diagonal peak intensities isshown below. A similar case is shown on the right side for the 8H4’ and 8H5′′ atoms of the D2O NOESY spectrum. The peaks from which the intensitieswere extracted are shown above the fits. For the bi-directional fits, the top peaks correspond to σij (blue) and the bottom peaks to σji (green). d‒fCorrelation plots between distances from 2KOC and C1 on the x axis and eNOE distances from fits of 40 to 160ms on the y axis. Black circles correspondto distances between non-amino/non-methylene protons, orange diamonds to distances between amino/methylene protons and non-amino/methylene oramino/methylene protons on a different residue, and red squares to distances within amino/methylene spin pairs. The 2KOC distances e were determinedby taking r−6 averages ( < 1/r6 > ) (overall correlation: y= 0.96 x , R= 0.89; black circles: 0.96 x , 0.89; orange diamonds: 0.96 x , 0.84; red squares: 0.98x , 0.35). The C1 distances e were determined by taking r−6 averages (overall: 0.97 x , 0.89; black circles: 0.98 x , 0.90; orange diamonds: 0.96 x , 0.80; redsquares: 0.98 x , 0.60). The C1 distances f were linearly averaged distances (<r>) (overall: 0.95 x , 0.89; black circles: 0.96 x , 0.91; orange diamonds: 0.94x , 0.82; red squares: 0.98 x , 0.59)
COMMUNICATIONS BIOLOGY | DOI: 10.1038/s42003-018-0067-x ARTICLE
COMMUNICATIONS BIOLOGY | (2018) 1:61 | DOI: 10.1038/s42003-018-0067-x | www.nature.com/commsbio 3
high accuracy, but also contain enough information to defineRNA structures to high resolution with no additional restraints.
ResultsAccuracy of extracted eNOE distances. To reliably determine theNOE cross-relaxation rate constants for our unlabeled 14-merUUCG tetraloop (see Methods), we excluded overlapped diagonaland cross peaks from analysis. This substantially reduced thenumber of distance restraints because of the large amount ofspectral overlap in the 2D NOESY spectra. We could fit 265eNOEs out of the totally available 677 semiquantitative NOEs.The NOESY acquired from the sample in H2O yielded 91 eNOEsinvolving exchangeable amino resonances, as well as the stablehydroxyl resonance of U6. The Watergate suppression of thewater signal in the H2O NOESY was sub-par, therefore, a NOESYwith water presaturation was acquired in D2O, which yielded 174eNOEs between non-exchangeable base and ribose resonances.The eNOE coverage of the ribose sugars was poor due to theirextreme overlap of the H2’ through H5′′ resonances in the 2DNOESY. However, this problem was alleviated by the use of 88generic normalized eNOEs (gn-eNOEs)51, which are used as anupper distance limit, as described in Methods. The large numberof eight mixing times allowed us to establish a general rule for theoptimal NOESY mixing times for RNA (see details in theMethods section). Assuming an inverse relationship of themaximal mixing time with the overall tumbling time τc, we obtaina maximal mixing time of 4 × 10⁻¹⁰ s2 τc
−1. This is larger thanour recommendation of 2.5 × 10⁻¹⁰ s2 τc
−1 for proteins26. TheeNOE network spans most of the 14-mer (Fig. 2b). One notableexception was G1, whose amino and imino protons were notpresent in the NOESY spectrum due to chemical exchange, likelyfrom end-fraying. Additionally, the non-exchangeable resonancesof G1 were overlapped due to a lack of chemical shift dispersion.Excluding clear outliers and fits from peaks with low signal-to-noise, the fits were of high quality. Examples of some exemplarycross-peak buildup and diagonal peak decay curves are shown(Fig. 2c). These results indicated that for the 14-mer tetraloopenough eNOEs of good quality could be extracted to ensure thestructure calculation.
To investigate the accuracy of the extracted eNOEs distances,we compared the eNOE distances from fits of 40–160 ms (adetailed analysis for this choice of mixing times is presented inthe Methods section; Supplementary Data 1) to the previouslysolved NMR structure with Protein Data Bank accessioncode 2KOC with an overall root-mean-square deviation (RMSD)of 0.37 Å21. 2KOC is a well-defined structure with input restraintsfrom a large set of conventional NOEs, allowed dihedral angleranges, and RDCs, making it an ideal reference structure.Effective distances were calculated from the 20-conformer2KOC ensemble by taking the r−6 average ( < 1/r6 > ), whichtakes into account structural variation. This analysis showed thatthe determined eNOE distances correlate well with the back-calculated distances from 2KOC (Fig. 2d). Despite the goodcorrelation, there were quite a few outliers suggesting that thedistance-averaged nature of the eNOEs is sensitive enough to pickup dynamics within the 14-mer. Because 2KOC is an averagedrepresentation of its input data, we also compared our eNOE dataset with the 10-state bundle provided by Al-Hashimi (hereafterreferred to as C1), which was calculated using RDCs frommultiple alignment conditions and is thus more likely torepresent the dynamic nature of the 14-mer15. However, in orderto generate different alignment tensors, the stem of the tetraloophad to be extended and modulated through base mutations in abulge between what would normally be the stem and UUCGtetraloop of the 14-mer15. To still enable a comparison, we
discarded all atoms between the gUUCGc loop and the four stembase pairs in all 10 states and all distances between the stem andthe loop. Again, the correlation between our eNOEs and theaveraged distances was good (Fig. 2e). Interestingly, thecorrelations to both 2KOC and C1 were essentially of the samequality (2KOC: R= 0.89, C1: R= 0.89), suggesting that themeasured eNOE data set was in good agreement with bothstructures. We also compared our eNOE data set to the linearlyaveraged distances < r > from C1 (Fig. 2f). The correlation was ofthe same quality, however, there were several distances thatagreed much better with the r−6 averaging than the averageddistance, indicative of the eNOEs sensitivity to motional effects.Overall, it is clear that the extracted eNOE distances areconsistent with the previously determined high-resolutionstructures.
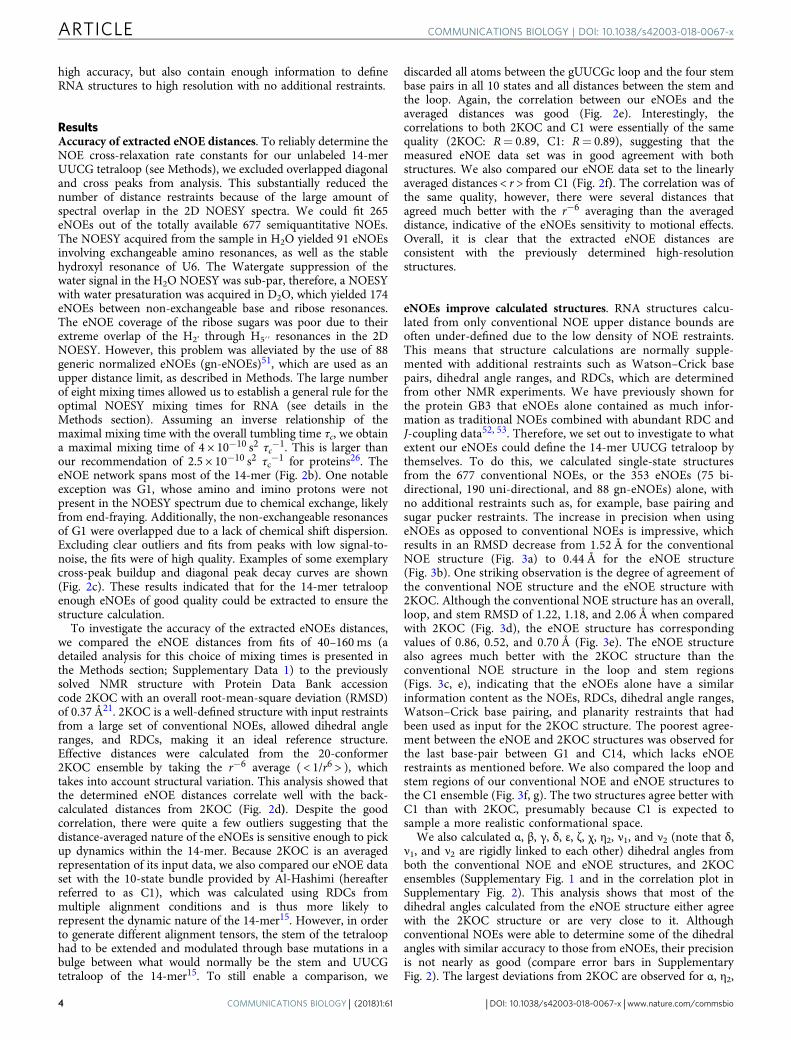
eNOEs improve calculated structures. RNA structures calcu-lated from only conventional NOE upper distance bounds areoften under-defined due to the low density of NOE restraints.This means that structure calculations are normally supple-mented with additional restraints such as Watson–Crick basepairs, dihedral angle ranges, and RDCs, which are determinedfrom other NMR experiments. We have previously shown forthe protein GB3 that eNOEs alone contained as much infor-mation as traditional NOEs combined with abundant RDC andJ-coupling data52, 53. Therefore, we set out to investigate to whatextent our eNOEs could define the 14-mer UUCG tetraloop bythemselves. To do this, we calculated single-state structuresfrom the 677 conventional NOEs, or the 353 eNOEs (75 bi-directional, 190 uni-directional, and 88 gn-eNOEs) alone, withno additional restraints such as, for example, base pairing andsugar pucker restraints. The increase in precision when usingeNOEs as opposed to conventional NOEs is impressive, whichresults in an RMSD decrease from 1.52 Å for the conventionalNOE structure (Fig. 3a) to 0.44 Å for the eNOE structure(Fig. 3b). One striking observation is the degree of agreement ofthe conventional NOE structure and the eNOE structure with2KOC. Although the conventional NOE structure has an overall,loop, and stem RMSD of 1.22, 1.18, and 2.06 Å when comparedwith 2KOC (Fig. 3d), the eNOE structure has correspondingvalues of 0.86, 0.52, and 0.70 Å (Fig. 3e). The eNOE structurealso agrees much better with the 2KOC structure than theconventional NOE structure in the loop and stem regions(Figs. 3c, e), indicating that the eNOEs alone have a similarinformation content as the NOEs, RDCs, dihedral angle ranges,Watson–Crick base pairing, and planarity restraints that hadbeen used as input for the 2KOC structure. The poorest agree-ment between the eNOE and 2KOC structures was observed forthe last base-pair between G1 and C14, which lacks eNOErestraints as mentioned before. We also compared the loop andstem regions of our conventional NOE and eNOE structures tothe C1 ensemble (Fig. 3f, g). The two structures agree better withC1 than with 2KOC, presumably because C1 is expected tosample a more realistic conformational space.
We also calculated α, β, γ, δ, ε, ζ, χ, η2, ν1, and ν2 (note that δ,ν1, and ν2 are rigidly linked to each other) dihedral angles fromboth the conventional NOE and eNOE structures, and 2KOCensembles (Supplementary Fig. 1 and in the correlation plot inSupplementary Fig. 2). This analysis shows that most of thedihedral angles calculated from the eNOE structure either agreewith the 2KOC structure or are very close to it. Althoughconventional NOEs were able to determine some of the dihedralangles with similar accuracy to those from eNOEs, their precisionis not nearly as good (compare error bars in SupplementaryFig. 2). The largest deviations from 2KOC are observed for α, η2,
ARTICLE COMMUNICATIONS BIOLOGY | DOI: 10.1038/s42003-018-0067-x
4 COMMUNICATIONS BIOLOGY | (2018) 1:61 | DOI: 10.1038/s42003-018-0067-x | www.nature.com/commsbio

and γ. The deviation for the α and η2 dihedral angles wereexpected because they both define angles from which we were notable to measure NOEs, α because it mostly defines the phosphatemoiety, and η2 because most of the hydroxyls were absent in thespectrum due to chemical exchange at 25 °C. U6 contained theonly visible hydroxyl due to its stabilizing role in the tetraloop,and thus its dihedral angles agree well with 2KOC. Thus, theaccuracy and precision of eNOEs were able to define the 14-merUUCG tetraloop to excellent agreement with previous structureswith no additional restraints.
Two-state eNOE structure and dynamics. Given the demon-strated high density of the eNOE network, we investigated if it issufficient to calculate an ensemble of conformers where all stateson average fulfill the distance restraints rather than each struc-ture. We selected the 20 conformers with the lowest CYANAtarget function (TF) to represent the multi-state bundle. The TFfor the 14-mer tetraloop RNA decreased with increasing numberof states, indicating that multiple states were necessary to describethe input data (Fig. 4a). The largest decrease in the TF was fromone to two states, which proceeded to level off from three to five
Restraints
RMSD[Å]
a
NOEs only
b
eNOEs
c
NOEs vs eNOEs
d
NOEs vs 2KOC
Overall 1.52 0.44 1.16a/2.34b 1.22a/2.49b
Loop 0.74 0.23 0.85a/1.01b 1.18a1.28b
Stem 1.61 0.42 1.55a/2.24b 2.06a/2.63b
NMR ensemble
/ super-
imposed NMR
ensemble
Restraints
RMSD[Å]
e
eNOE vs 2KOC
f
NOEs vs C1
g
eNOEs vs C1
h
eNOEs vs NOEs vs 2KOC
Overall 0.86a/1.22b N/A N/A N/A
Loop 0.52a/0.78b 0.95a/0.99b 0.27a/0.44b N/A
Stem 0.70a/0.810b 1.79a/2.29b 0.74a/0.95b N/A
Super-imposed
NMR ensemble
Fig. 3 eNOEs improve structures. a Structure calculated with only conventional NOEs as input data. b Structure calculated using only eNOEs as input data.For a and b the RMSD values are given for the heavy atoms of nucleotides 1–14 (overall), 1–5 and 10–14 (stem), or 6–9 (loop). Both structures werecalculated in CYANA. c Superimposition of the structures calculated from conventional NOEs only (red) and eNOEs (black). The RMSD values refer to thedeviation between the eNOE and NOE structures. d Superimposition of the conventional NOE structure (black) and 2KOC (cyan). e Superimposition of theeNOE structure (black) and 2KOC (cyan). f Superimposition of conventional NOE structure (black) and C1 (green). The overall RMSD is not availablebecause the loop and stem region had to be evaluated separately. g Superimposition of eNOE structure (black) and C1 (green). The overall RMSD is notavailable because the loop and stem region had to be evaluated separately. h Ribbon representations of the NOE structure (red), eNOE structure (black),and 2KOC (cyan). For c–h, bundle-averaged structures were created using MOLMOL69. The RMSD values for the superimposed structures weredetermined in Chimera70 using MatchMaker. For comparisons of structures, the first RMSD (‘a’) is the one between the averaged bundles, and the secondRMSD (‘b’) the one between the bundle of the first reported structure and the averaged second structure
COMMUNICATIONS BIOLOGY | DOI: 10.1038/s42003-018-0067-x ARTICLE
COMMUNICATIONS BIOLOGY | (2018) 1:61 | DOI: 10.1038/s42003-018-0067-x | www.nature.com/commsbio 5
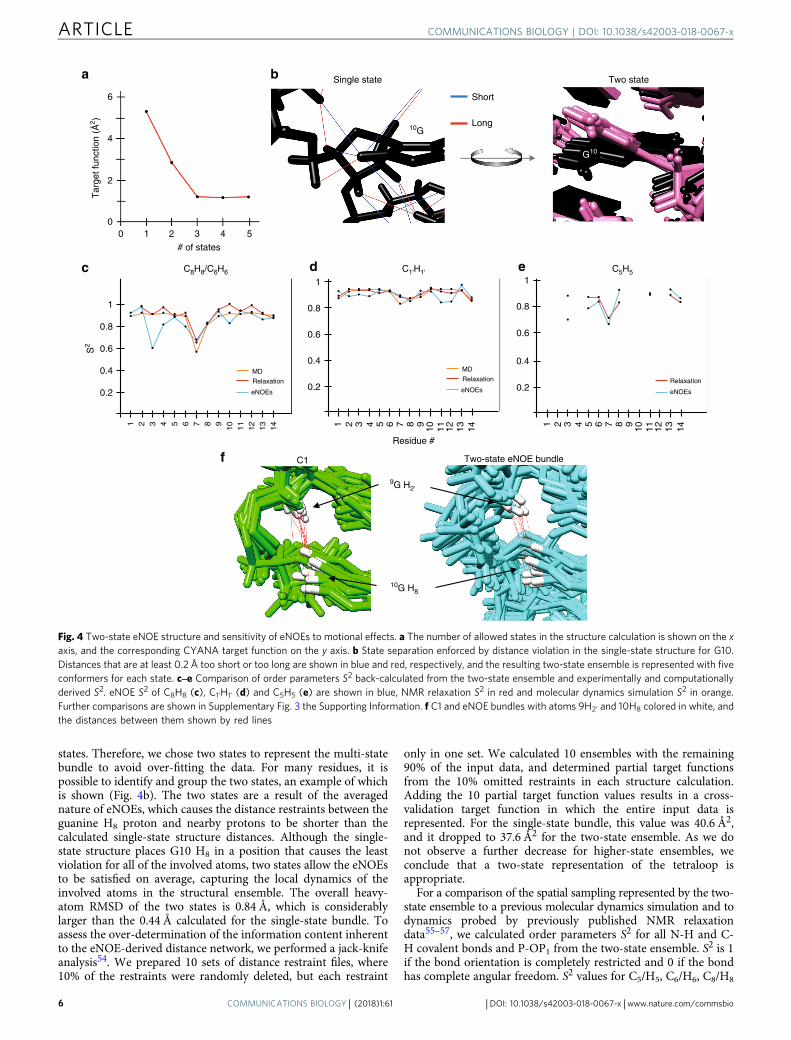
states. Therefore, we chose two states to represent the multi-statebundle to avoid over-fitting the data. For many residues, it ispossible to identify and group the two states, an example of whichis shown (Fig. 4b). The two states are a result of the averagednature of eNOEs, which causes the distance restraints between theguanine H8 proton and nearby protons to be shorter than thecalculated single-state structure distances. Although the single-state structure places G10 H8 in a position that causes the leastviolation for all of the involved atoms, two states allow the eNOEsto be satisfied on average, capturing the local dynamics of theinvolved atoms in the structural ensemble. The overall heavy-atom RMSD of the two states is 0.84 Å, which is considerablylarger than the 0.44 Å calculated for the single-state bundle. Toassess the over-determination of the information content inherentto the eNOE-derived distance network, we performed a jack-knifeanalysis54. We prepared 10 sets of distance restraint files, where10% of the restraints were randomly deleted, but each restraint
only in one set. We calculated 10 ensembles with the remaining90% of the input data, and determined partial target functionsfrom the 10% omitted restraints in each structure calculation.Adding the 10 partial target function values results in a cross-validation target function in which the entire input data isrepresented. For the single-state bundle, this value was 40.6 Å2,and it dropped to 37.6 Å2 for the two-state ensemble. As we donot observe a further decrease for higher-state ensembles, weconclude that a two-state representation of the tetraloop isappropriate.
For a comparison of the spatial sampling represented by the two-state ensemble to a previous molecular dynamics simulation and todynamics probed by previously published NMR relaxationdata55–57, we calculated order parameters S2 for all N-H and C-H covalent bonds and P-OP1 from the two-state ensemble. S2 is 1if the bond orientation is completely restricted and 0 if the bondhas complete angular freedom. S2 values for C5/H5, C6/H6, C8/H8
C1 Two-state eNOE bundlef
9G H2'
10G H8
a b
Short
Long
Two state
G10
10G
Single state
6
4
2
00 1 2 3
# of states
Tar
get f
unct
ion
(Å2 )
4 5
MD
Relaxation
eNOEs
1 142 3 4 5 6 7 8 9 10 11 12 13
1
0.8
0.4
0.2
C8H8/C6H6
0.6
Residue #
c
S2
C1'H1'
1 142 3 4 5 6 7 8 9 10 11 12 13
1
0.8
0.4
0.2
0.6
MD
Relaxation
eNOEs
1 142 3 4 5 6 7 8 9 10 11 12 13
1
0.8
0.4
0.2
0.6
Relaxation
eNOEs
d e C5H5
Fig. 4 Two-state eNOE structure and sensitivity of eNOEs to motional effects. a The number of allowed states in the structure calculation is shown on the xaxis, and the corresponding CYANA target function on the y axis. b State separation enforced by distance violation in the single-state structure for G10.Distances that are at least 0.2 Å too short or too long are shown in blue and red, respectively, and the resulting two-state ensemble is represented with fiveconformers for each state. c‒e Comparison of order parameters S2 back-calculated from the two-state ensemble and experimentally and computationallyderived S2. eNOE S2 of C8H8 (c), C1’H1’ (d) and C5H5 (e) are shown in blue, NMR relaxation S2 in red and molecular dynamics simulation S2 in orange.Further comparisons are shown in Supplementary Fig. 3 the Supporting Information. f C1 and eNOE bundles with atoms 9H2’ and 10H8 colored in white, andthe distances between them shown by red lines
ARTICLE COMMUNICATIONS BIOLOGY | DOI: 10.1038/s42003-018-0067-x
6 COMMUNICATIONS BIOLOGY | (2018) 1:61 | DOI: 10.1038/s42003-018-0067-x | www.nature.com/commsbio

and C1’/H1’ are shown (Fig. 4c, all other values in SupplementaryFig. 3 in the Supporting Information). The agreement for all baseS2 is exceptionally good. For the sugar S2, the 1′ and 2′ positionsare also excellent, whereas 4′ is moderate and 5′ and 5′′ arerelatively poor. We note that the density of eNOEs involving 5′/5′′ was lower than for the other positions, which may explain thelower agreement. We also assessed the backbone dynamics becomparing ensemble P-O S2 to S2 derived from 31P CSA values57.Not surprisingly, the agreement is poor, as we do not have anyrestraints for P and O atoms. The comparison may be furtherchallenged by the difficulty in disentangling the order parameterfrom the apparent CSA tensor. We note that there is alsoconsiderable disagreement between these relaxation S2 and arecent MD simulation of the tetraloop58. Overall, the two-stateensemble reproduces experimental order parameters well. Weregard this as an independent confirmation of the representationof the spatial sampling of our two-state ensemble.
DiscussionIn conventional structure calculation of RNA, many ad hocrestraints such as hydrogen bond or planarity restraints are usedand combined with labor-intensive additional experiments. Here,we have demonstrated that we can reproduce high-resolutionstructures of small RNA based on eNOE restraints alone. Con-ventional semiquantitative NOE upper distance bounds discard aparticularly large part of structural information regarding med-ium- to long-range features and dihedral angles that is actuallyencoded in the cross-relaxation rate52, 53. However, the eNOEsare able to accurately determine this kind of information forRNA. For instance, the stem loop curvatures defined by theconventional NOEs and eNOEs are quite different, suggestingthat the eNOEs are able to pick up on the relative orientation ofthe stem loop (Fig. 3c). This is further illustrated by comparingthe backbones of the eNOE structure (Fig. 3h, black), 2KOC(Fig. 3h, cyan), and the conventional NOE structure (Fig. 3h, red),which shows that the eNOE structure aligns much better with2KOC than to the structure from conventional NOEs. Thisdemonstrates that eNOEs are indeed capable of defining theorientation of the stem relative to the loop. This is a cumulativeeffect resulting from many accurate short-range restraints ratherthan direct long-range restraints. It is worth to mention that thecurvature of the bundle calculated from conventional NOEs doesnot improve upon inclusion of angular restraints that restricttorsion angles to their generally allowed regions as proposed inreference59.
Although ad hoc restraints are very helpful in defining averagestructures, they cannot be used to assess spatial sampling. Theymay even produce erroneous sampling because no detailed rela-tionship between indirect evidence and parametrization of spe-cific conformations in a dynamic ensemble is possible. We havepreviously shown that in structure calculations that try to fulfillall restraints with a single structural state, the accuracy of oureNOEs results in high TF values indicative of many distancerestraint violations24. This results from the eNOE’s ability to pickup on structural dynamics, which is normally suppressed in asingle-state structure calculation as the algorithm attempts tofinds the global minimum that simultaneously satisfies the distantrestraints best. Thus, allowing for multiple states in the structurecalculation alleviates these disagreements and allows for multi-state structures to be calculated that sample their conformationalspace24, 53.
The two states obtained for the cUUCGg tetraloop are markedby a clear difference in the relative positioning of the backbone, aswell as differences in the location of the bases with respect to eachother. The nucleobases of U6 and G9, for example, preserve
Watson–Crick base pairing as they undergo correlated motionsbetween the two states. A similar trend is present for the C5 toG10 base-pair, although this particular base-pair appears tosample a larger angular space than that of U6 to G9. The posi-tioning of the U6 to G9 base-pair in the two states also appears toinfluence the orientation of the C8 base relative to U6. Interest-ingly, U6 in the first state is further away from the loop than inthe second state, which would mean that base-stacking betweenU6 and C8 would be less favorable than in the second state whereU6 is located closer to the loop. The backbone is also correlated tothese changes. It is noteworthy that the distinction between thetwo states in the loop is progressively lost down the stem, sug-gesting that the stem and the loop undergo motions that are notcorrelated. Although the motions sampled by the eNOEs are oflittle biological significance for the thermostable UUCG tetraloop,they may be of interest for investigations of RNA systems wheredynamics play a critical role in the modulation of their functions.
There were some rather large changes between distances cal-culated from the C1 ensemble by r−6 averaging, which takes intoaccount motional effects, and the ensemble linearly averageddistances < r > . To demonstrate how eNOEs are sensitive todynamics, we investigated one of the largest outliers (Fig. 4f).Here, the two methods of distance calculation yield more than a0.5 Å difference for the 9H2′–10H8 distance from C1 (3.93 Å fromr−6 averaging and 4.50 Å by arithmetic average). The 2KOCbundle is extremely tight and thus showed almost no differencebetween the two methods. The difference between the twomethods of distance calculation for C1 is due to a rather largeamount of rotational dynamics of the bases G9 and G10 (Fig. 4b).This base twisting causes atoms 9H2’ and 10H8 to undergo largefluctuations relative to each other (see Fig. 4f), which in turnaugments the measured σ and thus decreases the extractedeffective eNOE distance. In line with this, the extracted eNOEdistance between this atom pair of 3.97 Å (Supplementary DataFile 1) was extremely close to the r−6 calculated distance from C1of 3.93 Å (Table 1). In addition, our two-state eNOE structuresampled a similar conformation space to that of C1 (Fig. 4f),although the linearly averaged distances from the two-state eNOEbundle resulted in a distance that was slightly shorter than thelinearly averaged distance from C1.
The information density obtained from eNOEs is higher thanthe one contained in a conventional NOE network. As such,eNOEs should improve the structure calculation of RNAs of anysize. A particularly interesting question is what quality of struc-tures of RNA larger than the 14-mer studied here can beexpected. The relevant parameter is the eNOE density, which isthe number of diagonal and cross peaks that can be evaluated pernucleotide. Therefore, we simulated increasingly larger RNAconstructs be deleting fractions of diagonal and cross peaks in a2:1 ratio (Supplementary Fig. 4 in the Supporting Informationand Fig. 5). The chosen ratio reflects the fact that the diagonaloverlap increases faster than the cross-peak overlap, because onlyone resonance has to be similar for two spins. Bundles obtainedfrom structure calculations with the new distance restraints areplotted along with the RMSD values of the bundles and the RMS
Table 1 Distances extracted from either r−6 averaging or theensemble linearly averaged distances 1/ < r > 6 from 2KOC,C1, or the eNOE two-state ensemble
2koc.pdb distance (Å) 3.94C1 distance (Å) < 1/r6> 3.93C1 distance (Å) < 1/ < r > 6 4.50Two-state eNOE structure distance (Å) < 1/r6> 3.98Two-state eNOE structure distance (Å) 1/ < r > 6 4.09
COMMUNICATIONS BIOLOGY | DOI: 10.1038/s42003-018-0067-x ARTICLE
COMMUNICATIONS BIOLOGY | (2018) 1:61 | DOI: 10.1038/s42003-018-0067-x | www.nature.com/commsbio 7

deviation from the reference NMR structure 2KOC. There is anapproximately linear increase in both the bundle RMSD and thedeviation from 2KOC up to a loss of 70% diagonal peaks and 35%cross peaks, after which the structures deteriorate considerably(RMSD larger than 1 Å, RMS deviation from 2KOC larger than2.5 Å). Beyond deleting 40/20% there is also a dependence on theexact selection of diagonal peaks to be deleted as indicated by thedeviation of the general trend in the bundle RMSD. The reasonfor this observation is that the deletion of a specific diagonal peakshifts all distance restraints involving the corresponding atominto a less stringent category (bi-directional → uni-directional →generic normalized NOE), which presumably causes low eNOEdensity in specific segments. Rather than defining a specific sizecutoff, we recommend estimating the number of diagonal andcross peaks that can be evaluated for a specific RNA under study,which can be compared with the plot presented in Fig. 5.
In conclusion, we have applied our eNOE protocol to a nucleicacid for the first time. We have established an estimation for theideal maximal NOESY mixing time for eNOE measurements withRNA, and showed that eNOEs extracted from buildup curves areof high quality. We expect that eNOE data sets of similar qualitycan be obtained for larger RNA constructs employing 15N and13C labeling. This strategy would also allow to measure moreeNOEs between the ribose H3′-H5′′ protons, which should sub-stantially improve the γ dihedral angles. We calculated a single-state structure of the 14-mer UUCG tetraloop to 0.44 Å precisionwith only eNOEs as input, which agreed well with the previouslydetermined high-resolution structures that were calculated usingconventional NOEs, RDCs, dihedral angles, planarity restraints,and Watson–Crick base pairing. We emphasize that eNOEs canbe acquired in a fraction of the time compared with otherrestraints such as RDCs and dihedral angle restraints. In addition,the accuracy and precision of the eNOEs allowed us to calculate atwo-state ensemble that samples its conformational space. Forsuch multi-state calculations, only NOE and RDC restraints canbe used, but not other popular semi-empirical ones. For thesereasons, it is our hope that our eNOE protocol will be founduseful among the NMR RNA community to help define RNAensembles where a sufficient number of eNOE restraints can be
collected. For larger RNA, where the NOE restraint density is notsufficient for the calculation of a structure, selective distances ofhigh interest may be determined. We have recently demonstratedthat distances between valine, leucine and isoleucine methylgroups can be measured in a 360 kDa protein complex60. Withthe implementation of eNORA2 into the newest version ofCYANA, the computational procedure is straightforward toapply.
MethodsSample conditions. Two 2.0 µmol scale synthesis reactions of unlabeled 14-mer-cUUCGg tetraloop RNA with the sequence 5′-PO4
2—PO3—PO2-GGCAC(UUCG)
GUGCC-3′ were purchased from Dharmacon (Lafayette, Colorado, United States)with High-Performance Liquid Chromatography (HPLC) purification. Both sam-ples were re-suspended and then dialyzed via centrifugation in their respectivebuffers to remove residual triethylammonium from the synthesis. The first samplewas concentrated to a final concentration of 1 mM and a total volume of 500 µl in20 mM potassium phosphate, pH 6.4, 0.4 mM EDTA and 5% D2O. The secondsample was concentrated to a final concentration of 1.7 mM and a total volume of500 µl in 20 mM potassium phosphate, pH 6.4, 0.4 mM EDTA and 100% D2O.
NMR data and processing. All spectra were acquired at 25 °C on a 900MHzDirect Drive Varian spectrometer equipped with a 5-mm triple resonance 1H/13C/15N cryo-probe with z axis gradient. For the sample in H2O, a 2D WaterGate [1H-1H] NOESY buildup series with eight mixing points (40, 80, 120, 160, 200, 240,280, and 320 ms) was acquired with 1470 × 200 complex points and a 1.3-s recycledelay. The number of scans was 64 and tmax was 73.5 ms in the direct and 10 ms inthe indirect dimension. For the sample in 100% D2O, a 2D PreSat [1H-1H] NOESYbuildup series with eight mixing points (40, 80, 120, 160, 200, 240, 280, and 320ms) was acquired with 1470 × 400 complex points and a 1.5-s recycle delay. Thenumber of scans taken was 32, and the tmax was again 73.5 ms in the directdimension, and 20 ms in the indirect dimension. All spectra were processed withthe NmrPipe/NmrDraw/NlinLS package61. Each dimension was apodized using a90o phase-shifted cosine-bell window function and zero-filled once. Assignment ofpeaks in the 320 ms NOESY spectra from both the H2O and D2O samples wasdone in ccpNMR62 based on the resonance assignments of the previously solvedhigh-resolution structure21 (PDB entry 2KOC, BMRB entry 5705). Cross anddiagonal peak intensities at all eight mixing times were extracted using the NlinLSautofit script with the assignment from the longest mixing time (320 ms) as thereference spectrum.
NOESY buildup fitting and distance restraints using CYANA. Cross-relaxationrate constants (σ) and auto-relaxation rate constants (ρ) were determined using thefull-matrix approach14, 63, which is a part of the eNORA2 package64 that hasrecently been implemented into the CYANA software package65, 66. The protein-
Hea
vy a
tom
RM
SD
[Å]
0 10 20 30 40 50 60 70 80 90
0
0.5
1.0
1.5
2.0
2.5
3.0
% Cross-peaksremoved
RMSD Vs 2KOC
Ensemble RMSD
0 5 10 15 20 25 30 35 40 45
% Diagonalsremoved
Fig. 5 Simulation of eNOE analysis of larger RNA molecules. Trends of the RMSD value of the single-state bundle (red) and the RMSD from the previouslydeterminated NMR structure 2KOC (blue) with increasing peak overlap are shown. eNOE restraints were recalculated assuming that the percentage oforiginal diagonal peaks that cannot be evaluated is twice as large as the corresponding percentage of the cross peaks, as shown on the x axis. The resultingbundles are shown for all calculations
ARTICLE COMMUNICATIONS BIOLOGY | DOI: 10.1038/s42003-018-0067-x
8 COMMUNICATIONS BIOLOGY | (2018) 1:61 | DOI: 10.1038/s42003-018-0067-x | www.nature.com/commsbio

specific MATLAB code of eNORA2 has been transcribed into the Fortran pro-graming language and generalized for use with DNA/RNA and any other mole-cules that can be handled by CYANA67. The implementation in CYANA alsoextends features such as the three-spin approximation of spin diffusion for partiallydeuterated molecules to deuteration of any configuration. The increase in com-putational efficiency in the CYANA framework furthermore allows for spin dif-fusion averaging over several conformers. Details of the CYANA implementationof eNORA2 will be described elsewhere. The full-matrix approach corrects for spindiffusion by simulating the active magnetization transfer pathways between allspins simultaneously. Spin diffusion corrections were calculated from the existingNMR structure (PDB entry 2KOC)21, as well as from relevant atoms in a 10-statebundle provided by Hashim Al-Hashimi15 (C1). The spin diffusion corrections andthe extracted eNOE distances depend on the overall rotational correlation time τcvia the spectral density function26. This requires an accurate overall τc value asinput. For the sample in H2O, we used the previously determined τc of 2.23 nsdetermined by NMR and molecular dynamics simulations55. For the sample inD2O, we used τc=2.74 ns, which was estimated from the 23% viscosity increase ofD2O using the Stokes–Einstein equation68. An average auto-relaxation rate con-stant ρ of 2.9 s-1 was used for spins for which no value could be fitted. The spindiffusion corrections at each mixing time were derived from the simulation andapplied to the extracted intensities. The diagonal peaks were fit to monoexponentialdecay curves to determine ρi and ρj and initial magnetization values ΔMii(0) andΔMjj(0)63. The corrected cross-peak buildup curves were then fitted using ρi, ρj,ΔMii(0), and ΔMjj(0) as fixed input parameters, and the cross-relaxation rateconstants σij and σji as free variables. Uni-directional buildups that were of sub-parquality when normalized to the spin of origin (i→j), but were of high quality whennormalized to the destination spin (j→i), were normalized to the destination spin13.The quality of all fits was evaluated visually, and poor fits from both (i→j) and (j→i)were excluded. Then, σij and σji were converted into distance restraints r throughthe relationship σ ~ r−6. ΔMii(0), ΔMjj(0), ρi, ρj, σij, σji, and r’s were determinedusing the intensities from all eight mixing times (40–320 ms), as well as from thefirst four (40–160 ms). Further analysis described in the Supporting Informationrevealed that rates obtained from fits to 160 ms are more reliable and were used forstructure calculation. For the extraction of the distances, we assumed isotropictumbling of the molecule. Using the simulations (Fig. 3 of reference Vögeli et al.22),we estimate a maximal distance error of ca. 2% for a molecule with a ratio of 1.5between the longitudinal and transverse axes of the diffusion tensor. In CYANA,this entire process is automated except a visual fit evaluation. Comparison of theextracted eNOE cross-relaxation rates σ from non-exchangeable resonancesbetween the H2O and D2O NOESY buildup series showed a slope of 1.21, indi-cating that our τc approximation for the D2O sample was in good agreement withthe data (Supplementary Fig. 5).
Determination of ideal maximum mixing times. The proton distribution anddensity in RNA is different from that of proteins. Thus, we expect an optimalmaximum mixing time that is different from the previously established tumblingtime-dependent value for proteins26. Although most of the fits were similar inquality to those shown (Fig. 2c), there were some notable exceptions whichrequired additional investigation. First, the diagonal peak intensities of ribosemethylene protons, as well as the amino protons of guanine, adenine, and cytosinebases followed a similar pattern where the intensities apparently decayed muchfaster within the first four points than the last eight. Hence, the ρ and corre-sponding ΔM(0) (for amino protons only) values fitted from mixing times 40–320ms were smaller than those fitted from 40–160 ms (Supplementary Fig. 6a and 1b,Supplementary Fig. 6d). This effect is caused by a deviation from monoexponentialdecay. We simulated decay curves for amino, methylene and all other atomsassuming typical ρ values and upper limits for effective σ values, which integratethe dipolar interactions with all protons (Supplementary Figs. 6f ). The true ΔM(0)values are underestimated by 12, 5, and 2% when fitting a monoexponentialfunction to 40–160 ms. The effect is stronger for methylene or amino protonsbecause their effective σ is dominated by the dipolar interaction with the geminalproton. These errors translate into relatively small distance errors of <2% even inthe case of amino protons. However, fitting to 40–320 ms results in 45, 21, and 12%underestimation of ΔM(0) for the same extreme cases. The resulting distance errorsof up to 6% (for amino protons) suggest that they can be reduced by restricting thefits of the diagonal peak decays to a maximal mixing time of 160 ms.
We also investigated the effect of fitting σ from 40 to 320 ms and from 40 to160 ms mixing time on the rates, as well as the extracted distances. Correlationplots between σ from fitting from 40 to 320 ms and 40 to 160 ms indicated that themost extreme difference occurred for interactions within methylene and aminospin pairs (Supplementary Fig. 6e). Interestingly, σ from interactions between asingle amino/methylene proton and a non-amino/non-methylene proton, or to anamino/methylene proton on a separate residue had similar values between fittingfour and eight points (Supplementary Fig. 6e). However, it was clear that the eNOEdistances from both scenarios were extremely close, as shown in SupplementaryFig. 6c. In addition, comparison of effective eNOE distances from fits to 160 msand 320 ms vs the 2KOC and C1 structures showed very similar statistics(Supplementary Fig. 7a-f). Therefore, we decided to fit ρ and σ from 40 to 160 ms,as the corrections for spin diffusion, and thus the error, increase at longer mixingtimes. We regard this result as a general guideline for the optimal choice of the
mixing time. Assuming an inverse relationship of the maximal mixing time withthe overall tumbling time τc, we obtain a maximal mixing time of 4 × 10⁻¹⁰ s2 τc-1.
eNOE distance comparison against 2KOC and C1. The extracted eNOE distances(with spin diffusion correction from 2KOC) from buildups of exchangeable reso-nances in H2O were combined with the distances from buildups in D2O to createtwo master lists with distances from fits to data from 40 to 320 ms and 40 to 160 msmixing times, respectively. The distances from 40 to 160 ms are listed (Supple-mentary Data 1). The same process was repeated for distances calculated with spindiffusion corrections based on the relevant atoms of the C1 bundle. The eNOEdistances determined with spin diffusion corrections from 2KOC or C1 were thencompared with distances calculated from the 20-conformer 2KOC structure or C1respectively by taking the r−6 average ( < 1/r6 > ), where r is the distance betweentwo atoms and < > denotes the ensemble average. eNOE distances were alsocompared with the average distances < r > calculated from just C1.
Structure calculations. Distances extracted from bi-directional eNOEs (bothsymmetry-related cross peaks can be normalized to their corresponding diag-onals) had no error tolerance applied and had the same values for the upper andlower limit distance restraints. For uni-directional eNOEs (only one cross-peakcan be evaluated or the eNOE cannot be normalized to both diagonals), a tol-erance of ± 10% was applied for the conversion to upper and lower distancelimits13. Generic normalized eNOEs (gn-eNOEs)51 were converted into upperdistance limit restraints and given a tolerance of ± 10% (gn-eNOEs and corre-sponding distances are listed in Supplementary Data File, Table 2). gn-eNOEswere calculated by giving overlapped diagonals an upper limit ΔM(0) and ρ.Amino, methylene, and all other hydrogen atoms had substantially different ΔM(0) and ρ values, and therefore the upper limit ΔM(0) and ρ values were based onthe highest values in the corresponding atom groups. All structure calculationswere performed in CYANA-3.9865, 66, starting with 100 initial structures withrandom torsion angle values using the standard simulated annealing protocolwith 10,000 torsion angle dynamics steps. The 20 structures with the lowest targetfunction values were selected for the ensemble. For the structure calculationbased on conventional NOEs, a total of 677 upper distance limit restraints wereused as input. For the single-state structure calculated from eNOEs, a total of 75bi-directional eNOEs, 190 uni-directional eNOEs, and 88 gn-eNOEs were used.The multi-state structures were calculated as previously described24 using thesame input restraints as for the single-state structure. The symmetry restraintweight was 0.1 for all heavy atoms with a flat-bottom width of 1.2 Å in a har-monic potential.
Data availability. The final structure coordinates and processed spectra weredeposited into the PDB/BMRB database (BMRB ID 30386; PDB IDs 6BY4 and6BY5, respectively, for the single- and two-state ensemble).
Received: 19 January 2018 Accepted: 9 May 2018
References1. Perbandt, M. et al. Crystal structure of domain E of Thermus flavus 5S rRNA:
a helical RNA structure including a hairpin loop. FEBS Lett. 429, 211–215(1998).
2. Ke, A. & Doudna, J. A. Crystallization of RNA and RNA-protein complexes.Methods 34, 408–414 (2004).
3. Dethoff, E. A., Chugh, J., Mustoe, A. M. & Al-Hashimi, H. M. Functionalcomplexity and regulation through RNA dynamics. Nature 482, 322–330 (2012).
4. Fürtig, B., Nozinovic, S., Reining, A. & Schwalbe, H. Multiple conformationalstates of riboswitches fine-tune gene regulation. Curr. Opin. Struct. Biol. 30,112–124 (2015).
5. Breaker, R. R. Prospects for Riboswitch discovery and analysis. Mol. Cell 43,867–879 (2011).
6. Bothe, J. R. et al. Characterizing RNA dynamics at atomic resolution usingsolution-state NMR spectroscopy. Nat. Methods 8, 919–931 (2011).
7. Duss, O., Diarra Dit Konté, N. & Allain, F. H. T. Cut and paste RNA fornuclear magnetic resonance, paramagnetic resonance enhancement, andelectron paramagnetic resonance structural studies. Methods Enzymol. 565,537–562 (2015).
8. Karaca, E., Rodrigues, J. P. G. L. M., Graziadei, A., Bonvin, A. M. J. J. &Carlomagno, T. M3: an integrative framework for structure determination ofmolecular machines. Nat. Methods 14, 897–902 (2017).
9. Marchanka, A., Simon, B., Althoff-Ospelt, G. & Carlomagno, T. RNAstructure determination by solid-state NMR spectroscopy. Nat. Commun. 6,7024 (2015).
10. Keane, S. C. et al. Structure of the HIV-1 RNA packaging signal. Sci. (80-.).348, 917–921 (2015).
COMMUNICATIONS BIOLOGY | DOI: 10.1038/s42003-018-0067-x ARTICLE
COMMUNICATIONS BIOLOGY | (2018) 1:61 | DOI: 10.1038/s42003-018-0067-x | www.nature.com/commsbio 9
11. Barnwal, R. P., Yang, F. & Varani, G. Applications of NMR to structuredetermination of RNAs large and small. Arch. Biochem. Biophys. 628, 42–56(2017).
12. Wüthrich, K. NMR of Proteins and Nucleic Acids. 32, (Wiley, Hoboken, NJ,1986).
13. Strotz, D., Orts, J., Minges, M. & Vögeli, B. The experimental accuracy of theuni-directional exact NOE. J. Magn. Reson. 259, 32–46 (2015).
14. Zinovjev, K. & Liepinsh, E. Validation of the CHARMM27 force field fornucleic acids using 2D nuclear overhauser effect spectroscopy. J. Biophys.Chem. 4, 58–65 (2013).
15. Salmon, L. et al. Modulating RNA alignment using directional dynamic kinks:application in determining an atomic-resolution ensemble for a hairpinusingNMR residual dipolar couplings. J. Am. Chem. Soc. 137, 12954–12965(2015).
16. Fürtig, B., Richter, C., Wöhnert, J. & Schwalbe, H. NMR spectroscopy of RNA.Chembiochem 4, 936–962 (2003).
17. Felli, I. C., Richter, C., Griesinger, C. & Schwalbe, H. Determination of RNAsugar pucker mode from cross-correlated relaxation in solution NMRspectroscopy [2]. J. Am. Chem. Soc. 121, 1956–1957 (1999).
18. Schwalbe, H. et al. Cross-correlated relaxation for measurement of anglesbetween tensorial interactions. Methods Enzymol. 338, 35–81 (2001).
19. Boisbouvier, J., Brutscher, B., Pardi, A., Marion, D. & Simorre, J. P. NMRdetermination of sugar puckers in nucleic acids from CSA-dipolar cross-correlated relaxation [8]. J. Am. Chem. Soc. 122, 6779–6780 (2000).
20. Grytz, C. M. et al. Determination of helix orientations in a flexible DNA bymulti-frequency EPR spectroscopy. Phys. Chem. Chem. Phys. 19, 29801–29811(2017).
21. Nozinovic, S., Fürtig, B., Jonker, H. R. A., Richter, C. & Schwalbe, H. High-resolution NMR structure of an RNA model system: the 14-mer cUUCGgtetraloop hairpin RNA. Nucleic Acids Res. 38, 683–694 (2009).
22. Vögeli, B., Friedmann, M., Leitz, D., Sobol, A. & Riek, R. Quantitativedetermination of NOE rates in perdeuterated and protonated proteins:practical and theoretical aspects. J. Magn. Reson. 204, 290–302 (2010).
23. Vögeli, B. et al. Exact distances and internal dynamics of perdeuteratedubiquitin from NOE buildups. J. Am. Chem. Soc. 131, 17215–17225(2009).
24. Vögeli, B., Kazemi, S., Güntert, P. & Riek, R. Spatial elucidation of motion inproteins by ensemble-based structure calculation using exact NOEs. Nat.Struct. Mol. Biol. 19, 1053–1058 (2012).
25. Nichols, P. et al. The exact nuclear overhauser enhancement: recent advances.Molecules 22, 1176 (2017).
26. Vögeli, B. The nuclear Overhauser effect from a quantitative perspective.Progress. Nucl. Magn. Reson. Spectrosc. 78, 1–46 (2014).
27. Borgias, B. A., Gochin, M., Kerwood, D. J. & James, T. L. Relaxation matrixanalysis of 2D NMR data. Progress. Nucl. Magn. Reson. Spectrosc. 22, 83–100(1990).
28. James, T. L. Relaxation matrix analysis of two-dimensional nuclearOverhauser effect spectra. Curr. Opin. Struct. Biol. 1, 1042–1053 (1991).
29. Lefevre, J. F., Lane, A. N. & Jardetzky, O. Solution structure of the Trpoperator of Escherichia coli determined by NMR. Biochemistry 26, 5076–5090(1987).
30. Boelens, R., Koning, T. M. G., van der Marel, G. A., van Boom, J. H. &Kaptein, R. Iterative procedure for structure determination from proton-proton NOEs using a full relaxation matrix approach. Application to a DNAoctamer. J. Magn. Reson. 82, 290–308 (1989).
31. Nikonowicz, E. P., Meadows, R. P. & Gorenstein, D. G. NMR structuralrefinement of an extrahelical adenosine Tridecamer d(CGCAGAATTCGCG)2 via a hybrid relaxation matrix procedure.Biochemistry 29, 4193–4204 (1990).
32. Nikonowicz, E. P., Meadows, R. P. & Gorenstein, D. G. A hybrid completerelaxation matrix structural refinement of an extra-helical adenosinetridecamer d(CGCAGAATTCGCG)2 from 2D 1H NMR. Bull. Magn. Reson.11, 226–229 (1989).
33. Cheong, C., Varani, G. & Tinoco, I Jr. Solution structure of an unusually stableRNA hairpin, 5’ GGAC(UUCG)GUCC. Nature 346, 680–682 (1990).
34. Varani, G., Cheong, C. & Tinoco, I. Structure of an unusually stable RNAhairpin. Biochemistry 30, 3280–3289 (1991).
35. Allain, F. H. & Varani, G. Structure of the P1 helix from group I self-splicingintrons. J. Mol. Biol. 250, 333–353 (1995).
36. Allain, F. H. T. & Varani, G. Divalent metal ion binding to a conserved wobblepair defining the upstream site of cleavage of group I self-splicing introns.Nucleic Acids Res. 23, 341–350 (1995).
37. Allain, F. H. & Varani, G. How accurately and precisely can RNA structure bedetermined by NMR? J. Mol. Biol. 267, 338–351 (1997).
38. Baumruk, V., Gouyette, C., Huynh-Dinh, T., Sun, J. S. & Ghomi, M.Comparison between CUUG and UUCG tetraloops: thermodynamic stabilityand structural features analyzed by UV absorption and vibrationalspectroscopy. Nucleic Acids Res. 29, 4089–4096 (2001).
39. Molinaro, M. & Tinoco, I. Use of ultra stable UNCG tetraloop hairpins to foldRNA structures: thermodynamic and spectroscopic applications. Nucleic AcidsRes. 23, 3056–3063 (1995).
40. Chen, A. A. & Garcia, A. E. High-resolution reversible folding of hyperstableRNA tetraloops using molecular dynamics simulations. Proc. Natl. Acad. Sci.110, 16820–16825 (2013).
41. Noller, H. F. RNA structure: reading the ribosome. Sci. (80-.). 309, 1508–1514(2005).
42. Nissen, P., Ippolito, J. A., Ban, N., Moore, P. B. & Steitz, T. A. RNA tertiaryinteractions in the large ribosomal subunit: the A-minor motif. Proc. Natl.Acad. Sci. 98, 4899–4903 (2001).
43. Butcher, S. E. & Pyle, A. M. The molecular interactions that stabilize RNAtertiary structure: RNA motifs, patterns, and networks. Acc. Chem. Res. 44,1302–1311 (2011).
44. Cate, J. H. et al. Crystal structure of a group I ribozyme domain: principles ofRNA packing. Sci. (80-.). 273, 1678–1685 (1996).
45. Williamson, J. R. Induced fit in RNA-protein recognition. Nat. Struct. Biol. 7,834–837 (2000).
46. Leulliot, N. & Varani, G. Current topics in RNA-protein recognition: controlof specificity and biological function through induced fit and conformationalcapture. Biochemistry 40, 7947–7956 (2001).
47. Frankel, A. D. & Smith, C. A. Induced folding in RNA-protein recognition:more than a simple molecular handshake. Cell 92, 149–151 (1998).
48. Varani, G. Exceptionally stable nucleic acid hairpins. Annu. Rev. Biophys.Biomol. Struct. 24, 379–404 (1995).
49. D’Ascenzo, L., Leonarski, F., Vicens, Q. & Auffinger, P. Revisiting GNRA andUNCG folds: U-turns versus Z-turns in RNA hairpin loops. Rna Rna 059097,116, https://doi.org/10.1261/rna.059097.116 (2016).
50. D’Ascenzo, L., Leonarski, F., Vicens, Q. & Auffinger, P. ‘Z-DNA like’fragments in RNA: a recurring structural motif with implications for folding,RNA/protein recognition and immune response. Nucleic Acids Res. 44,5944–5956 (2016).
51. Chi, C. N., Strotz, D., Riek, R. & Vögeli, B. Extending the eNOE data set oflarge proteins by evaluation of NOEs with unresolved diagonals. J. Biomol.NMR 62, 63–69 (2015).
52. Vögeli, B., Olsson, S., Riek, R. & Güntert, P. Complementarity and congruencebetween exact NOEs and traditional NMR probes for spatial decoding ofprotein dynamics. J. Struct. Biol. 191, 306–317 (2015).
53. Vögeli, B., Olsson, S., Güntert, P. & Riek, R. The exact NOE as an alternativein ensemble structure determination. Biophys. J. 110, 113–126 (2016).
54. Brünger, aT., Clore, G. M., Gronenborn, aM., Saffrich, R. & Nilges, M.Assessing the quality of solution nuclear magnetic resonance structures bycomplete cross-validation. Science 261, 328–331 (1993).
55. Ferner, J. et al. NMR and MD studies of the temperature-dependent dynamicsof RNA YNMG-tetraloops. Nucleic Acids Res. 36, 1928–1940 (2008).
56. Vallurupalli, P. & Kay, L. E. A suite of 2H NMR spin relaxation experimentsfor the measurement of RNA dynamics. J. Am. Chem. Soc. 127, 6893–6901(2005).
57. Rinnenthal, J. et al. RNA phosphodiester backbone dynamics of aperdeuterated cUUCGg tetraloop RNA from phosphorus-31 NMR relaxationanalysis. J. Biomol. NMR 45, 143–155 (2009).
58. Giambasu, G. M., York, D. M. & Case, D. A. Structural fidelity and NMRrelaxation analysis in a prototype RNA hairpin. RNA 21, 963–974 (2015).
59. Tolbert, B. S. et al. Major groove width variations in RNA structuresdetermined by NMR and impact of 13C residual chemical shift anisotropy and1H-13C residual dipolar coupling on refinement. J. Biomol. NMR 47, 205–219(2010).
60. Chi, C. N., Strotz, D., Riek, R. & Vögeli, B. NOE-derived methyl distancesfrom a 360 kDa proteasome complex. Chem. A Eur. J. 24, 2270–2276(2018).
61. Delaglio, F. et al. NMRPipe: a multidimensional spectral processing systembased on UNIX pipes. J. Biomol. NMR 6, 277–293 (1995).
62. Vranken, W. F. et al. The CCPN data model for NMR spectroscopy:development of a software pipeline. Proteins Struct. Funct. Genet. 59, 687–696(2005).
63. Orts, J., Vögeli, B. & Riek, R. Relaxation matrix analysis of spin diffusion forthe NMR structure calculation with eNOEs. J. Chem. Theory Comput. 8,3483–3492 (2012).
64. Strotz, D., Orts, J., Chi, C. N., Riek, R. & Vögeli, B. ENORA2 exact NOEanalysis program. J. Chem. Theory Comput. 13, 4336–4346 (2017).
65. Güntert, P., Mumenthaler, C. & Wüthrich, K. Torsion angle dynamics forNMR structure calculation with the new program Dyana. J. Mol. Biol. 273,283–298 (1997).
66. Güntert, P. & Buchner, L. Combined automated NOE assignment andstructure calculation with CYANA. J. Biomol. NMR 62, 453–471 (2015).
67. Yilmaz, E. M. & Güntert, P. NMR structure calculation for all small moleculeligands and non-standard residues from the PDB chemical componentdictionary. J. Biomol. NMR 63, 21–37 (2015).
ARTICLE COMMUNICATIONS BIOLOGY | DOI: 10.1038/s42003-018-0067-x
10 COMMUNICATIONS BIOLOGY | (2018) 1:61 | DOI: 10.1038/s42003-018-0067-x | www.nature.com/commsbio
68. Harris, K. R. & Woolf, L. A. Temperature and volume dependence of theviscosity of water and heavy water at low temperatures. J. Chem. Eng. Data 49,1064–1069 (2004).
69. Koradi, R., Billeter, M. & Wüthrich, K. MOLMOL: a program for display andanalysis of macromolecular structures. J. Mol. Graph. 14, 51–55 (1996).
70. Pettersen, E. F. et al. UCSF chimera — a visualization system for exploratoryresearch and analysis. J. Comput. Chem. 25, 1605–1612 (2004).
AcknowledgementsWe would like to thank Professor Hashim Al-Hashimi for providing us with the 10-stateUUCG tetraloop ensemble. This work was supported by a start-up package from theUniversity of Colorado at Denver to B.V.
Author contributionsP.J.N. and B.V. designed research; P.J.N. and M.A.H. conducted experiments; P.J.N. andB.V. analyzed data; D.S. and P.G. wrote software, P.J.N., M.A.H., A.B., D.S., P.G. and B.V.wrote the paper.
Additional informationSupplementary Information accompanies this paper at https://doi.org/10.1038/s42003-018-0067-x.
Competing interests: The authors declare no competing interests.
Reprints and permission information is available online at http://npg.nature.com/reprintsandpermissions/
Publisher's note: Springer Nature remains neutral with regard to jurisdictional claims inpublished maps and institutional affiliations.
Open Access This article is licensed under a Creative CommonsAttribution 4.0 International License, which permits use, sharing,
adaptation, distribution and reproduction in any medium or format, as long as you giveappropriate credit to the original author(s) and the source, provide a link to the CreativeCommons license, and indicate if changes were made. The images or other third partymaterial in this article are included in the article’s Creative Commons license, unlessindicated otherwise in a credit line to the material. If material is not included in thearticle’s Creative Commons license and your intended use is not permitted by statutoryregulation or exceeds the permitted use, you will need to obtain permission directly fromthe copyright holder. To view a copy of this license, visit http://creativecommons.org/licenses/by/4.0/.
© The Author(s) 2018
COMMUNICATIONS BIOLOGY | DOI: 10.1038/s42003-018-0067-x ARTICLE
COMMUNICATIONS BIOLOGY | (2018) 1:61 | DOI: 10.1038/s42003-018-0067-x | www.nature.com/commsbio 11