high resolution climate and vegetation simulations of the
TRANSCRIPT
HAL Id: hal-00423720https://hal.archives-ouvertes.fr/hal-00423720
Submitted on 27 Feb 2012
HAL is a multi-disciplinary open accessarchive for the deposit and dissemination of sci-entific research documents, whether they are pub-lished or not. The documents may come fromteaching and research institutions in France orabroad, or from public or private research centers.
L’archive ouverte pluridisciplinaire HAL, estdestinée au dépôt et à la diffusion de documentsscientifiques de niveau recherche, publiés ou non,émanant des établissements d’enseignement et derecherche français ou étrangers, des laboratoirespublics ou privés.
High resolution climate and vegetation simulations ofthe Mid-Pliocene, a model-data comparison over
western Europe and the Mediterranean regionAnne Jost, Séverine Fauquette, Masa Kageyama, Gerhard Krinner, Gilles
Ramstein, Jean-Pierre Suc, Sophie Violette
To cite this version:Anne Jost, Séverine Fauquette, Masa Kageyama, Gerhard Krinner, Gilles Ramstein, et al.. Highresolution climate and vegetation simulations of the Mid-Pliocene, a model-data comparison overwestern Europe and the Mediterranean region. Climate of the Past, European Geosciences Union(EGU), 2009, 5, pp.585-606. �10.5194/cp-5-585-2009�. �hal-00423720�
Clim. Past, 5, 585–606, 2009www.clim-past.net/5/585/2009/© Author(s) 2009. This work is distributed underthe Creative Commons Attribution 3.0 License.
Climate
of the Past
High resolution climate and vegetation simulations of the LatePliocene, a model-data comparison over western Europeand the Mediterranean region
A. Jost1,2, S. Fauquette3, M. Kageyama4, G. Krinner5, G. Ramstein4, J.-P. Suc6, and S. Violette1,2
1UPMC Univ. Paris 06, UMR 7619, Sisyphe, France2CNRS, UMR 7619, Sisyphe, France3Univ. Montpellier 2, UMR CNRS 5554, Institut des Sciences de l’Evolution, France4UMR CEA-CNRS-UVSQ 1572, Laboratoire des Sciences du Climat et de l’Environnement/IPSL, France5UJF Univ. Grenoble 1, UMR CNRS 5183, Laboratoire de Glaciologie et Geophysique de l’Environnement, France6UCB Univ. Lyon 1, UMR CNRS 5125, Laboratoire PaleoEnvironnements et PaleobioSphere, France
Received: 9 April 2009 – Published in Clim. Past Discuss.: 13 May 2009Revised: 31 August 2009 – Accepted: 15 September 2009 – Published: 12 October 2009
Abstract. Here we perform a detailed comparison betweenclimate model results and climate reconstructions in westernEurope and the Mediterranean area for the mid-Piacenzianwarm interval (ca 3 Myr ago) of the Late Pliocene epoch.This region is particularly well suited for such a comparisonas several quantitative climate estimates from local pollenrecords are available. They show evidence for tempera-tures significantly warmer than today over the whole area,mean annual precipitation higher in northwestern Europeand equivalent to modern values in its southwestern part.To improve our comparison, we have performed high reso-lution simulations of the mid-Piacenzian climate using theLMDz atmospheric general circulation model (AGCM) witha stretched grid which allows a finer resolution over Eu-rope. In a first step, we applied the PRISM2 (PlioceneResearch, Interpretation, and Synoptic Mapping) boundaryconditions except that we used modern terrestrial vegeta-tion. Second, we simulated the vegetation for this periodby forcing the ORCHIDEE (Organizing Carbon and Hy-drology in Dynamic Ecosystems) dynamic global vegetationmodel (DGVM) with the climatic outputs from the AGCM.We then supplied this simulated terrestrial vegetation coveras an additional boundary condition in a second AGCM run.This gives us the opportunity to investigate the model’s sen-sitivity to the simulated vegetation changes in a global warm-ing context.
Correspondence to: A. Jost([email protected])
Model results and data show a great consistency for meanannual temperatures, indicating increases by up to 4◦C in thestudy area, and some disparities, in particular in the north-ern Mediterranean sector, as regards winter and summer tem-peratures. Similar continental mean annual precipitation andmoisture patterns are predicted by the model, which broadlyunderestimates the wetter conditions indicated by the data innorthwestern Europe. The biogeophysical effects due to thechanges in vegetation simulated by ORCHIDEE are weak,both in terms of the hydrological cycle and of the temper-atures, at the regional scale of the European and Mediter-ranean mid-latitudes. In particular, they do not contribute toimprove the model-data comparison. Their main influenceconcerns seasonal temperatures, with a decrease of the tem-peratures of the warmest month, and an overall reduction ofthe intensity of the continental hydrological cycle.
1 Introduction
Past well-documented episodes of significant climate warm-ing provide climate change scenarios that can help us to testthe sensitivity of physical models of the climate system andto evaluate the significance of their results in the context offuture climate change prediction. It is necessary to look backto the Late Pliocene, within the middle part of the Piacen-zian stage, to find the last notable and stable phase of globalwarmth, considered as the closest potential analogue of theexpected near future climate state (Jansen et al., 2007). In-deed, the warming that occurred between around 3.3 and
Published by Copernicus Publications on behalf of the European Geosciences Union.
586 A. Jost et al.: Mid-Piacenzian warmth high resolution simulations
3 million years before present is the most recent interval ingeological history during which a significantly warmer-than-present global climate was maintained over a period longerthan any interglacial stage of the Quaternary (Dowsett et al.,1996) in an almost similar to present geographic configura-tion (Crowley, 1996). A large number of modelling studies(e.g. Chandler et al., 1994; Sloan et al., 1996; Haywood et al.,2000a; Haywood and Valdes, 2004; Jiang et al., 2005) sug-gests that global average temperatures were approximately 2to 3◦C greater than today, i.e. a level of warming within therange of projected global temperature increase for the midto late 21st century (Meehl et al., 2007). Atmospheric con-centrations of carbon dioxide (estimated to be between 360and 400 ppmv, Kurschner et al., 1996; Raymo et al., 1996)are also comparable to what could occur during the 21stcentury. The mid-Piacenzian, which itself contains episodicclimate fluctuations, takes place at the transition from rel-atively warm stable global climate conditions to the signif-icant global cooling of the Pleistocene, just before the ini-tiation of the Northern Hemisphere major glaciations, ap-proximately 2.7 million years ago (Leroy et al., 1998; Za-chos et al., 2001; St. John and Krissek, 2002). The causesof the mid-Piacenzian optimum remain uncertain. A com-bination of increased levels of greenhouse gases in the at-mosphere and an enhanced meridional ocean heat transporthas been proposed as a leading explanation (e.g. Crowley,1996; Dowsett et al., 1996; Raymo et al., 1996). Potentialcauses such as orographic effects related to an altered ele-vation of major mountain chains (Rind and Chandler, 1991),ice-albedo feedbacks relationships resulting from a reducedextent of high-latitude terrestrial ice sheets and sea-ice cover(Haywood and Valdes, 2004) or permanent El Nino-like con-ditions (e.g. Molnar and Cane, 2002) have also been invoked.
The mid-Piacenzian therefore appears a very interestingperiod to study given the predictions of future global warm-ing. Climate modelling can help determining the causesof the warming. This period, also referred to as PRISMTime Slab or PRISM Interval, has been selected for detailedstudy and is reasonably well-documented through both ma-rine and terrestrial proxy climate records (e.g. Dowsett andCronin, 1991; Poore and Sloan, 1996) that have allowed thereconstruction of comprehensive global datasets, all of whichare suitable for integration into GCMs (PRISM2, Dowsettet al., 1999; Dowsett, 2007). Indeed, many simulationshave been performed to investigate the nature and variabil-ity of climate during the mid-Piacenzian, from the exam-ination of the global response of atmosphere(-ocean) gen-eral circulation models (A(O)GCMs) (GISS, NCAR GEN-ESIS, UKMO, IAP AGCMs and HadCM3 AOGCM) to suchboundary conditions (Chandler et al., 1994; Sloan et al.,1996; Haywood et al., 2000a; Haywood and Valdes, 2004)to the evaluation on regional scale climate changes (Hay-wood et al., 2000b, 2001; Jiang et al., 2005). Various sensi-tivity analyses have been performed to explore the potentialcauses for the Late Pliocene warmth (e.g. Haywood et al.,
2007; Lunt et al., 2008). Following current extensive re-search efforts to understand climate-vegetation interactions(Cosgrove et al., 2002, and references therein), several of thelatest studies have considered the climatic impact of the mid-Piacenzian vegetation cover. Even though its influence onglobal climate appears to be rather minor, the authors showthat it must be considered on a regional scale at mid to highlatitudes (Jiang et al., 2005), especially in the regions en-countering the most prominent changes of vegetation, e.g. inthe polar and subpolar regions (Salzmann et al., 2009; Luntet al., 2009). It can affect the seasonality of temperaturesover wide regions (Haywood and Valdes, 2006).
Within this framework, our objective is to perform such ananalysis of model sensitivity to vegetation changes, throughthe use of a combined data and modelling approach, cen-tred on western Europe and the Mediterranean region as awell-documented case study. Indeed, the existence of re-constructions of the mid-Piacenzian climate based on paly-nological analyses provides a detailed quantification of themain climatic variables of the period and a reliable descrip-tion of the vegetation of this region at time of global warming(Fauquette et al., 1998b, 2007). We rely on these terrestrialpaleoclimate archives to examine the performance of the at-mospheric general circulation model LMDz in simulating themid-Piacenzian climate, mainly in terms of temperatures andprecipitation. This AGCM uses a stretched grid, which al-lows for a finer resolution over Europe. This gives us theopportunity to refine our comparison between model resultsand climate reconstructions from local pollen data and to in-vestigate specific regional aspects of the Late Pliocene pa-leoclimate response of western European and Mediterraneanregions. Moreover, running the climate model at high reso-lution allows to improve orographic resolution and represen-tation of dynamical and physical processes acting at smallscales and hence, to reproduce precipitation pattern with abetter accuracy (Jost et al., 2005), especially close to themain orographic features, the Alps and the Pyrenees in ourcase study. High resolution is more particularly essentialfor the description of the Mediterranean climate, which isstrongly driven by local processes induced by the complexorography of this region (Li et al., 2006).
Our experimental design also accounts for the influenceof the mid-Piacenzian vegetation on the climate. Indeed,we simulate the vegetation for this period by forcing theDGVM ORCHIDEE (Krinner et al., 2005) with the climaticoutputs from our first AGCM run, which uses a modern vege-tation cover. We then supply this simulated vegetation cover-age as an additional boundary condition in a second AGCMrun, as a first step of including the vegetation feedback intoan atmospheric-vegetation fully coupled simulation design.The numerical experiments are therefore designed to investi-gate vegetation distributions during the mid-Piacenzian andto explore in detail the sensitivity of the climate model resultsto different representations of the land cover. We examinethe consistency between the vegetation cover produced by
Clim. Past, 5, 585–606, 2009 www.clim-past.net/5/585/2009/

A. Jost et al.: Mid-Piacenzian warmth high resolution simulations 587
the vegetation model and palynological paleodata. We dis-cuss the accuracy of the resulting simulated climate for themid-Piacenzian by comparing the second experiment to thefirst one and their fit to the paleoclimatic reconstructions.
2 Experimental design
We employ the high resolution version LMDZ.3.3 of theLaboratoire de Meteorologie Dynamique atmospheric model(Zhou and Li, 2002; Li and Conil, 2003), which is part ofthe Institut Pierre Simon Laplace (IPSL) atmosphere-ocean-vegetation coupled GCM (Marti et al., 2005). We use astretched grid with a horizontal resolution down to about60 km near the centre of the zoom, centred on Paris. In pre-vious works, this configuration has been evaluated for thepresent-day climate state (Jost et al., 2005) and has alreadybeen used to explore the Last Glacial Maximum, the HeinrichEvents 1 and 4 paleoclimates (Jost et al., 2005; Kageyamaet al., 2005; Sepulchre et al., 2007, respectively). The modelis formulated in the finite-difference grid with 144 points inlongitude, 108 points in latitude and 19 hybrid vertical layers.The physical parameterizations of this version are describedin detail in Marti et al. (2005). On the continent, the land sur-face scheme ORCHIDEE (Krinner et al., 2005) is coupled tothe atmospheric model. Only the thermodynamic componentof ORCHIDEE is active in the simulations presented here.
First, two numerical experiments have been carried out,the first for the modern period, referred to as CTRL, andwhich is the same as in Jost et al. (2005) in which At-mospheric Model Intercomparison Project (AMIP) monthlymean sea surface temperatures (SSTs) and sea ice extentboundary conditions were prescribed (Taylor et al., 2001),the second corresponding to PRISM Time Slab conditions.The climatological averages were computed from the last tenyears of each 11-year run.
All numerical simulations are forced by the present-dayorbital configuration. Atmospheric CO2 and CH4 concen-trations are set to values of 315 ppmv and 790 ppbv re-spectively, following the experimental design defined in themid-Piacenzian climate simulations using atmosphere-onlyGCMs (Chandler et al., 1994; Sloan et al., 1996; Haywoodet al., 2000a; Jiang et al., 2005; Haywood et al., 2009).Therefore, the impacts arising from the increase in atmo-spheric CO2 (absolute level of around 400 ppmv) occurringduring the mid-Piacenzian, as indicated by proxy estimates(Kurschner et al., 1996; Raymo et al., 1996), are not takeninto account in this study. However, the 400 ppmv value,which is used in ocean-atmosphere or vegetation-atmospherecoupled experiments (e.g. Haywood and Valdes, 2004, 2006,respectively), is not completely consensual for 3 Ma. Firstthe error bar is large whatever the proxy used (Kurschneret al., 1996; Raymo et al., 1996). Second the mean valueitself is often lower than 400 ppmv (Kurschner et al., 1996;Pearson and Palmer, 2000; Zachos et al., 2008).
The prescribed boundary conditions for the mid-Piacenzian are applied according to the PRISM2 reconstruc-tion (Dowsett et al., 1999; Dowsett, 2007) compiled by theUnited States Geological Survey’s Pliocene Research, Inter-pretation and Synoptic Mapping group, covering the time-slab between 3.29 and 2.97 Ma BP (geomagnetic polaritytime scale of Berggren et al., 1995). This global synthesisof the paleoenvironmental and paleoclimatic conditions ofthe middle part of the Piazencian stage of the Pliocene epochconsists of a 2◦×2◦ digital data set that derives from a seriesof studies conducted at a large number of marine and terres-trial sites and areas (e.g. Cronin, 1991; Dowsett et al., 1992,1994, 1996; Poore and Sloan, 1996; Williams et al., 2005).It is the most complete and detailed global reconstruction ofclimate and environmental conditions for any warm periodprior to the last thousands of years. A detailed descriptionof the PRISM2 data set and how it was created can be foundin Dowsett et al. (1999); Dowsett (2007). PRISM Time Slabsurface conditions involve, with respect to the present con-figuration (Fig. 1):
1. a +25 m sea-level rise leading to slightly modified coast-lines;
2. a substantial reduction of ice-sheets size and height (by50% for Greenland and by 33% for Antarctica) and ofsea-ice, the Arctic being seasonally ice free;
3. an altered orography, e.g. a reduced elevation of majormountain chains, such as the Rockies Mountains and theAndes Cordillera, related to Late Cenozoic uplift, and inGreenland and Antarctica, due to removal of continentalice, and a higher East African Rift System;
4. increased SSTs at middle to high latitudes, especially inthe northeastern North Atlantic sector, but unchangedSSTs in low latitudes;
5. and the presence of warmth- or moisture-loving vegeta-tion at middle to high latitudes.
As stated in the introduction, previous modelling studieshave emphasized the role of warmer sea surface tempera-tures and reduced land and sea ice extent, as specified by thePRISM2 data set, in determining the mid-Piacenzian climate(Haywood and Valdes, 2004; Jiang et al., 2005). Paleogeo-graphic change has also been invoked as a major contribut-ing mechanism to global Late Pliocene warmth (Rind andChandler, 1991). In this respect, it is certainly crucial formid-Piacenzian climate modelling to describe the surface re-lief with accuracy because of significant orographic changes,mainly due to Cenozoic tectonics. In the European andMediterranean areas, the Alpine tectonics must be respon-sible for elevation differences. However, the mid-Piacenzianrelief is poorly known in detail, the PRISM2 reconstructionbeing only a first order estimate of the mid-Piacenzian orog-raphy derived from present day elevations. Therefore, in the
www.clim-past.net/5/585/2009/ Clim. Past, 5, 585–606, 2009

588 A. Jost et al.: Mid-Piacenzian warmth high resolution simulations
-4
-3
-2
-1
0
1
2
3
4
5
6
a) LMDz, SST, PLIO-CTRL
-180 -150 -120 -90 -60 -30 0 30 60 90 120 150 18006
1218243036424854606672788490
0
500
1000
1500
2000
2500
3000
3500
b) LMDz, Orography & Ice Sheet Outline, PLIO
-180 -150 -120 -90 -60 -30 0 30 60 90 120 150 18006
1218243036424854606672788490
0
500
1000
1500
2000
2500
3000
3500
c) LMDz, Orography & Ice Sheet Outline, CTRL
-180 -150 -120 -90 -60 -30 0 30 60 90 120 150 18006
1218243036424854606672788490
Fig. 1. Mid-Piacenzian paleoenvironmental conditions in the Northern Hemisphere, originating from PRISM2 (Dowsett et al., 1999):(a)mean annual SST anomaly (◦C) from the present climate (Taylor et al., 2001);(b) mid-Piacenzian absolute values of orography (m) and icesheet outline in red, as compared to(c) present.
absence of a realistic and extensive geological reconstruc-tion, in particular in the study area, we computed a high res-olution mid-Piacenzian topography by adjusting the 2◦
×2◦
PRISM2 set of elevations to the finer grid, given the presentspatial variability (see Fig. 1). The modern value from thehigh resolution control run over the finer grid is multiplied bythe ratio between the modern value aggregated to the coarsergrid and the PRISM2 value. This is done at each fine-gridpoint after the ratio has been first smoothed at low resolutionand then simply refined on the high resolution grid. It resultsthat our experimental design accounts for the influence of abetter resolved orography, but not for the specific impact ofregional orographic changes from modern.
As far as the vegetation is concerned, we employ OR-CHIDEE (Krinner et al., 2005), the land surface compo-nent of the IPSL coupled GCM, to simulate the vegetationdistribution of the PRISM Interval. ORCHIDEE is a ter-restrial biosphere model that calculates the energy and hy-drology budgets and simulates the principal processes of thecontinental biosphere influencing the global carbon cycle aswell as changes in vegetation distributions. ORCHIDEEis composed of the Soil-Vegetation-Atmosphere Transferscheme SECHIBA (Schematisation des Echanges Hydriquesa l’Interface Biosphere-Atmosphere) (Ducoudre et al., 1993)and of the carbon module STOMATE (Saclay-Toulouse-Orsay Model for the Analysis of Terrestrial Ecosystems),
Clim. Past, 5, 585–606, 2009 www.clim-past.net/5/585/2009/
A. Jost et al.: Mid-Piacenzian warmth high resolution simulations 589
which includes the vegetation dynamics part of the LPJ(Lund-Postdam-Jena) model (Sitch et al., 2003). The readeris referred to Krinner et al. (2005) for a more detailed de-scription of the ORCHIDEE model and its validation.
ORCHIDEE is designed either to be coupled to a GCM orforced by climatic data. Here it is run in stand-alone mode,as the fully coupled model was still in development at thetime of running the experiments. We therefore opted for anasynchronous coupling of our global vegetation and climatemodels. We use the same vegetation cover as in the controlsimulation, i.e. modern (including anthropogenic) vegetationcover in a first experiment, hereafter referred to as PLIO-modernveg. We did not specify PRISM2 vegetation distri-bution as a starting point because its translation to combina-tions of ecological functioning categories used by the landsurface model may add uncertainty and bias due to a lackof coherence between land cover types and plant functionaltype (PFT) classification. We then simulate the vegetation forthe mid-Piacenzian period by forcing ORCHIDEE with theclimate outputs derived from PLIO-modernveg. ORCHIDEEis capable of predicting the geographical vegetation distribu-tion using twelve PFTs and bare soil that can co-exist withinone model grid-cell, in response to a set of GCM-derivedclimatic variables. The forcing data for ORCHIDEE are pro-duced by a weather generator, driven by the monthly anoma-lies fields between the simulated mid-Piacenzian climate andthe results of the CTRL simulation, added to a present-dayobserved climatology (New et al., 1999). The newly pre-dicted mid-Piacenzian vegetation map is then supplied as anadditional boundary condition in a second AGCM run, re-ferred to as PLIO-paleoveg. We have not extended the itera-tive process further as the simulated climate-vegetation equi-librium is usually reached very soon after the first integration(Claussen, 1994) and to save calculation time, given the highresolution. We therefore assume that the continuation of theiterative process would not alter significantly the predictedvegetation types and distribution. The use of ORCHIDEEprovides a detailed view of mid-Piacenzian vegetation coverthat then can be compared with the palynologic record, de-spite there not being full compatibility between PFTs used bythe model and the biome typology of pollen data. Compar-ing the two mid-Piacenzian climate simulations also allows aquantification of the influence of the vegetation on calculatedwarming and moisture levels. However, a potential weaknessof our vegetation simulation is that we have not allowed forchanges in stomatal conductance and leaf area index (LAI)that result from a higher atmospheric CO2, consistent withthe fact that we have not modified this level in the AGCMsimulation either. As shown recently, the hydrological con-sequences of changes in stomatal conductance and CO2 fer-tilization are not negligible (Gedney and Valdes, 2000; Piaoet al., 2007; Alkama, 2007), given their influence on transpi-ration.
3 Climate reconstruction from pollen data
Terrestrial data, i.e. mainly fossil pollen data but also plantmegafossil records, vertebrate paleontological or paleohy-drological data, have provided the basis for reconstructingthe mid-Piacenzian vegetation. Abundant data exist for Eu-rope and the Mediterranean area and many of them were usedwithin the PRISM2 vegetation reconstruction (Dowsett et al.,1999) or the new global biome reconstruction for the mid-Piacenzian based on a combined proxy and modelling ap-proach (Salzmann et al., 2008). The paleobotanical data alsosupport several paleoclimatic inferences. Here we compareour climate simulation results with climatic estimates basedon pollen data covering the mid-Piacenzian in western Eu-rope and the Mediterranean region, on a quantitative basis.
The climate was reconstructed from pollen data using the“Climatic Amplitude Method” developed by Fauquette et al.(1998a,b) to quantify the climate of periods for which nomodern analogue of the pollen spectra exists. In this method,past climate variables are estimated by transposing the cli-matic requirements of the maximum number of modern taxato the fossil data. This approach does not rely on the analy-sis of entire pollen assemblages, but on the relationship be-tween the relative pollen abundance of each individual taxaand climate. Presence/absence limits, as well as abundancethresholds, have been defined for 60 taxa from modern pollenspectra and the literature. This method takes into accountnot only presence/absence criteria but also pollen percent-ages to provide more reliable reconstructions. For example,low abundances of some subtropical taxa (e.g.Microtropisfallax) are meaningful and should be taken into account aspollen grains of these plants are generally under-representedbecause suffering some disadvantages in the transport. Con-versely, low abundances of wind-pollinated taxa (e.g.Quer-cus, Alnus) may reflect long-distance transport of these highpollen producers by air and water. In this case, very lowpollen percentages are not significant. The most probableclimate for a fossil pollen assemblage is estimated as the cli-matic interval in which the highest number of taxa can ex-ist. The climatic estimate is presented as an interval and as a“most likely value”, which corresponds to a weighted meanaccording to the size of the climatic intervals of all taxa ex-ceeding their presence/absence and/or abundance thresholds.As the precision of the information obtained from a taxon’sclimatic interval is inversely related to the breadth of this in-terval, the weights are greater for taxa with smaller intervals.
High latitude/altitude taxa were excluded from the recon-struction process. The identification and exclusion of highlatitude/altitude plants are based on numerous palynologi-cal studies (e.g. Suc et al., 1995a,b, 1999) showing that thePliocene vegetation zonation follows a similar latitudinal andaltitudinal zonation to the one observed in present-day south-eastern China (Wang, 1961), where most of the taxa that haddisappeared from Europe by the late Neogene may be found.Therefore, the obtained estimates correspond to the climate
www.clim-past.net/5/585/2009/ Clim. Past, 5, 585–606, 2009
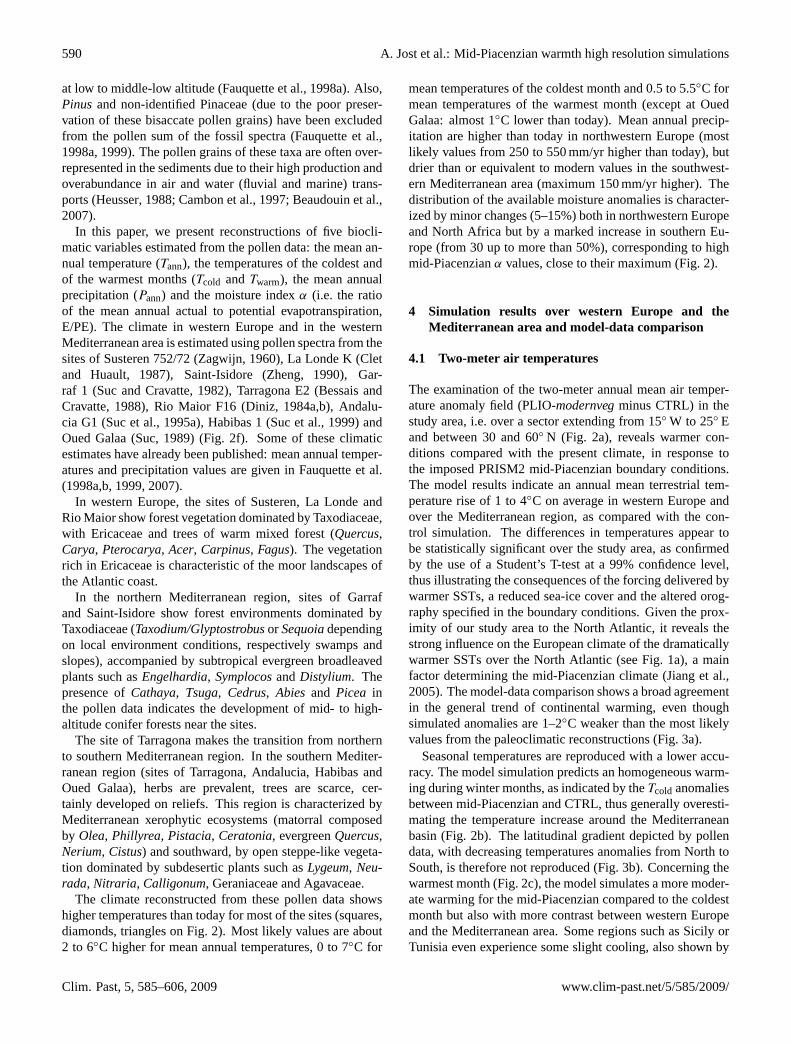
590 A. Jost et al.: Mid-Piacenzian warmth high resolution simulations
at low to middle-low altitude (Fauquette et al., 1998a). Also,Pinus and non-identified Pinaceae (due to the poor preser-vation of these bisaccate pollen grains) have been excludedfrom the pollen sum of the fossil spectra (Fauquette et al.,1998a, 1999). The pollen grains of these taxa are often over-represented in the sediments due to their high production andoverabundance in air and water (fluvial and marine) trans-ports (Heusser, 1988; Cambon et al., 1997; Beaudouin et al.,2007).
In this paper, we present reconstructions of five biocli-matic variables estimated from the pollen data: the mean an-nual temperature (Tann), the temperatures of the coldest andof the warmest months (Tcold andTwarm), the mean annualprecipitation (Pann) and the moisture indexα (i.e. the ratioof the mean annual actual to potential evapotranspiration,E/PE). The climate in western Europe and in the westernMediterranean area is estimated using pollen spectra from thesites of Susteren 752/72 (Zagwijn, 1960), La Londe K (Cletand Huault, 1987), Saint-Isidore (Zheng, 1990), Gar-raf 1 (Suc and Cravatte, 1982), Tarragona E2 (Bessais andCravatte, 1988), Rio Maior F16 (Diniz, 1984a,b), Andalu-cia G1 (Suc et al., 1995a), Habibas 1 (Suc et al., 1999) andOued Galaa (Suc, 1989) (Fig. 2f). Some of these climaticestimates have already been published: mean annual temper-atures and precipitation values are given in Fauquette et al.(1998a,b, 1999, 2007).
In western Europe, the sites of Susteren, La Londe andRio Maior show forest vegetation dominated by Taxodiaceae,with Ericaceae and trees of warm mixed forest (Quercus,Carya, Pterocarya, Acer, Carpinus, Fagus). The vegetationrich in Ericaceae is characteristic of the moor landscapes ofthe Atlantic coast.
In the northern Mediterranean region, sites of Garrafand Saint-Isidore show forest environments dominated byTaxodiaceae (Taxodium/Glyptostrobus or Sequoia dependingon local environment conditions, respectively swamps andslopes), accompanied by subtropical evergreen broadleavedplants such asEngelhardia, Symplocos andDistylium. Thepresence ofCathaya, Tsuga, Cedrus, Abies and Picea inthe pollen data indicates the development of mid- to high-altitude conifer forests near the sites.
The site of Tarragona makes the transition from northernto southern Mediterranean region. In the southern Mediter-ranean region (sites of Tarragona, Andalucia, Habibas andOued Galaa), herbs are prevalent, trees are scarce, cer-tainly developed on reliefs. This region is characterized byMediterranean xerophytic ecosystems (matorral composedby Olea, Phillyrea, Pistacia, Ceratonia, evergreenQuercus,Nerium, Cistus) and southward, by open steppe-like vegeta-tion dominated by subdesertic plants such asLygeum, Neu-rada, Nitraria, Calligonum, Geraniaceae and Agavaceae.
The climate reconstructed from these pollen data showshigher temperatures than today for most of the sites (squares,diamonds, triangles on Fig. 2). Most likely values are about2 to 6◦C higher for mean annual temperatures, 0 to 7◦C for
mean temperatures of the coldest month and 0.5 to 5.5◦C formean temperatures of the warmest month (except at OuedGalaa: almost 1◦C lower than today). Mean annual precip-itation are higher than today in northwestern Europe (mostlikely values from 250 to 550 mm/yr higher than today), butdrier than or equivalent to modern values in the southwest-ern Mediterranean area (maximum 150 mm/yr higher). Thedistribution of the available moisture anomalies is character-ized by minor changes (5–15%) both in northwestern Europeand North Africa but by a marked increase in southern Eu-rope (from 30 up to more than 50%), corresponding to highmid-Piacenzianα values, close to their maximum (Fig. 2).
4 Simulation results over western Europe and theMediterranean area and model-data comparison
4.1 Two-meter air temperatures
The examination of the two-meter annual mean air temper-ature anomaly field (PLIO-modernveg minus CTRL) in thestudy area, i.e. over a sector extending from 15◦ W to 25◦ Eand between 30 and 60◦ N (Fig. 2a), reveals warmer con-ditions compared with the present climate, in response tothe imposed PRISM2 mid-Piacenzian boundary conditions.The model results indicate an annual mean terrestrial tem-perature rise of 1 to 4◦C on average in western Europe andover the Mediterranean region, as compared with the con-trol simulation. The differences in temperatures appear tobe statistically significant over the study area, as confirmedby the use of a Student’s T-test at a 99% confidence level,thus illustrating the consequences of the forcing delivered bywarmer SSTs, a reduced sea-ice cover and the altered orog-raphy specified in the boundary conditions. Given the prox-imity of our study area to the North Atlantic, it reveals thestrong influence on the European climate of the dramaticallywarmer SSTs over the North Atlantic (see Fig. 1a), a mainfactor determining the mid-Piacenzian climate (Jiang et al.,2005). The model-data comparison shows a broad agreementin the general trend of continental warming, even thoughsimulated anomalies are 1–2◦C weaker than the most likelyvalues from the paleoclimatic reconstructions (Fig. 3a).
Seasonal temperatures are reproduced with a lower accu-racy. The model simulation predicts an homogeneous warm-ing during winter months, as indicated by theTcold anomaliesbetween mid-Piacenzian and CTRL, thus generally overesti-mating the temperature increase around the Mediterraneanbasin (Fig. 2b). The latitudinal gradient depicted by pollendata, with decreasing temperatures anomalies from North toSouth, is therefore not reproduced (Fig. 3b). Concerning thewarmest month (Fig. 2c), the model simulates a more moder-ate warming for the mid-Piacenzian compared to the coldestmonth but also with more contrast between western Europeand the Mediterranean area. Some regions such as Sicily orTunisia even experience some slight cooling, also shown by
Clim. Past, 5, 585–606, 2009 www.clim-past.net/5/585/2009/
A. Jost et al.: Mid-Piacenzian warmth high resolution simulations 591
0 1 2 3 4 5 6 7-2 -1
a) LMDz, Tann, PLIOmodernveg-CTRL
-15 -10 -5 0 5 10 15 20 2530
32
34
36
38
40
42
44
46
48
50
52
54
56
58
60
0 1 2 3 4 5 6 7-2 -1
b) LMDz, Tcold, PLIOmodernveg-CTRL
-15 -10 -5 0 5 10 15 20 2530
32
34
36
38
40
42
44
46
48
50
52
54
56
58
60
0 1 2 3 4 5 6 7-2 -1
c) LMDz, Twarm, PLIOmodernveg-CTRL
-15 -10 -5 0 5 10 15 20 2530
32
34
36
38
40
42
44
46
48
50
52
54
56
58
60
0 450-600 -150 300 750-300 150 600-450
d) LMDz, Pann, PLIOmodernveg-CTRL
-15 -10 -5 0 5 10 15 20 2530
32
34
36
38
40
42
44
46
48
50
52
54
56
58
60
0-30 355-25 4010-20 4515-15 5020-10 25-5 30
e) LMDz, E/PE, PLIOmodernveg-CTRL
-15 -10 -5 0 5 10 15 20 2530
32
34
36
38
40
42
44
46
48
50
52
54
56
58
60
f) Sites location
-15 -10 -5 0 5 10 15 20 2530
32
34
36
38
40
42
44
46
48
50
52
54
56
58
60
Susteren
LaLonde
St-Isidore
Garraf
Tarragone
Andalucia
OuedGalaaHabibas
RioMaior
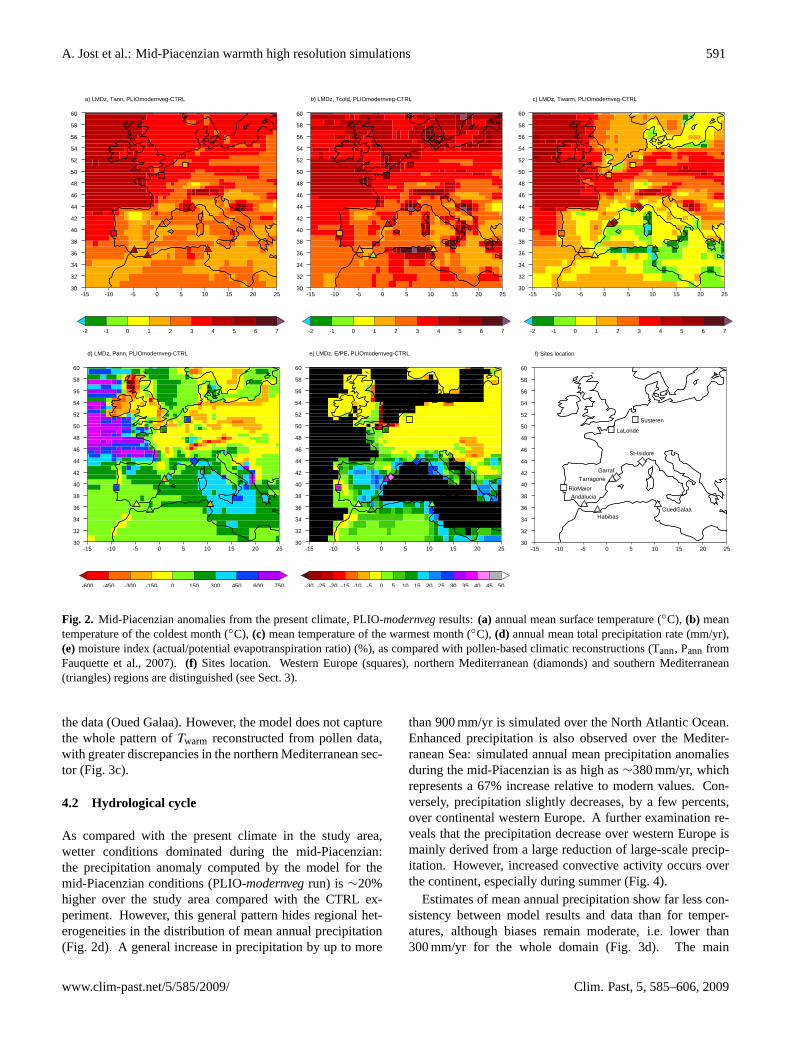
Fig. 2. Mid-Piacenzian anomalies from the present climate, PLIO-modernveg results:(a) annual mean surface temperature (◦C), (b) meantemperature of the coldest month (◦C), (c) mean temperature of the warmest month (◦C), (d) annual mean total precipitation rate (mm/yr),(e) moisture index (actual/potential evapotranspiration ratio) (%), as compared with pollen-based climatic reconstructions (Tann, Pann fromFauquette et al., 2007).(f) Sites location. Western Europe (squares), northern Mediterranean (diamonds) and southern Mediterranean(triangles) regions are distinguished (see Sect. 3).
the data (Oued Galaa). However, the model does not capturethe whole pattern ofTwarm reconstructed from pollen data,with greater discrepancies in the northern Mediterranean sec-tor (Fig. 3c).
4.2 Hydrological cycle
As compared with the present climate in the study area,wetter conditions dominated during the mid-Piacenzian:the precipitation anomaly computed by the model for themid-Piacenzian conditions (PLIO-modernveg run) is∼20%higher over the study area compared with the CTRL ex-periment. However, this general pattern hides regional het-erogeneities in the distribution of mean annual precipitation(Fig. 2d). A general increase in precipitation by up to more
than 900 mm/yr is simulated over the North Atlantic Ocean.Enhanced precipitation is also observed over the Mediter-ranean Sea: simulated annual mean precipitation anomaliesduring the mid-Piacenzian is as high as∼380 mm/yr, whichrepresents a 67% increase relative to modern values. Con-versely, precipitation slightly decreases, by a few percents,over continental western Europe. A further examination re-veals that the precipitation decrease over western Europe ismainly derived from a large reduction of large-scale precip-itation. However, increased convective activity occurs overthe continent, especially during summer (Fig. 4).
Estimates of mean annual precipitation show far less con-sistency between model results and data than for temper-atures, although biases remain moderate, i.e. lower than300 mm/yr for the whole domain (Fig. 3d). The main
www.clim-past.net/5/585/2009/ Clim. Past, 5, 585–606, 2009

592 A. Jost et al.: Mid-Piacenzian warmth high resolution simulations
Fig. 3. Mid-Piacenzian anomalies from the present climate, PLIO-modernveg results:(a) annual mean surface temperature (◦C), (b) meantemperature of the coldest month (◦C), (c) mean temperature of the warmest month (◦C), (d) annual mean total precipitation rate (mm/yr),(e)moisture index (actual/potential evapotranspiration ratio) (%). Models results (x-axis) are compared with pollen-based indicators (y-axis).At the bottom right of each plot, numbers indicate mean absolute errors from the best estimates, for the whole domain and for each citedregion (western Europe (squares), northern Mediterranean (diamonds) and southern Mediterranean (triangles)). Horizontal bars representmodel standard deviations of interannual variability and vertical bars climatic intervals estimated from fossil pollen assemblages.
discrepancy concerns the latitudinal distribution of the pre-cipitation. Indeed, in western Europe and the northernMediterranean area, model results underestimate the wetterconditions depicted by pollen data (except at Saint-Isidore).Conversely, throughout the southern Mediterranean sector,positive PLIO−CTRL anomalies are indicated by model re-sults, which only correspond to the reconstructions at one outof the four southern Mediterranean sites. The precipitation atthe other 3 sites is actually decreasing by up to 200 mm/yr,which is not at all reproduced by the model.
Model estimates of hydrological variables such as theavailable moisture show a similar PLIO−CTRL anomaliesdistribution to that of the mean annual precipitation (Fig. 2evs. 2d). Terrestrial areas of northern Europe display a mid-Piacenzian E/PE ratio similar to the modern one in northernEurope, in agreement with the data. The mid-Piacenzian ex-periment predicts an increase in available moisture all aroundthe Mediterranean basin that however does not reach thehigh levels indicated by pollen data along the Spanish coast(Figs. 2e and 3e).
4.3 Mid-Piacenzian vegetation distribution andvegetation-induced effects on climate
4.3.1 Mid-Piazencian vegetation as simulated byORCHIDEE
The DGVM ORCHIDEE provides insights into the distribu-tion and character of the mid-Piacenzian vegetation coveras a consequence of warmer climate. During the mid-Piacenzian, Europe is dominated by temperate broad-leaved(western Europe and Mediterranean) or needle-leaved (east-ern Europe) evergreen forest, in general combined with alesser fractional coverage of grassland. Some tropical plantfunctional types are predicted along the southern Atlanticand Mediterranean coasts, which are absent from this regiontoday. In response to a cooler modern climate, this vege-tation cover has been mainly replaced by temperate broad-leaved deciduous forest in Europe and predominant herba-ceous plants in the south, associated with an increased ofbare soil in North Africa, as suggested for instance by the
Clim. Past, 5, 585–606, 2009 www.clim-past.net/5/585/2009/

A. Jost et al.: Mid-Piacenzian warmth high resolution simulations 593
0 450-600 -150 300 750-300 150 600-450
a) LMDz, Plarge-scale, PLIOmodernveg-CTRL
-15 -10 -5 0 5 10 15 20 2530
32
34
36
38
40
42
44
46
48
50
52
54
56
58
60
0 450-600 -150 300 750-300 150 600-450
b) LMDz, Pconvective, PLIOmodernveg-CTRL
-15 -10 -5 0 5 10 15 20 2530
32
34
36
38
40
42
44
46
48
50
52
54
56
58
60
Fig. 4. (a) Large-scale precipitation and(b) convective precipitation, in mm/yr. Mid-Piacenzian anomalies from the present climate, PLIO-modernveg results.
estimate of Potential Natural Vegetation (PNV) adapted toPFTs from the Sterling and Ducharne (2008) comprehensivedata set.
The lack of coherence between the combination of PFTsused by land surface models and land cover classes providedin maps or biomes from pollen data usually hampers the com-parison of vegetation distributions. The major vegetationchanges simulated by ORCHIDEE are nonetheless broadlyconsistent with other reconstructions of mid-Piacenzian veg-etation (Dowsett et al., 1999; Favre, 2007; Salzmann et al.,2008). Pollen data and vegetation simulations are generallyin good agreement, especially concerning the expansion of awarm-temperate forest in Europe, despite few discrepancies.For instance, pollen data show for southern Spain and NorthAfrica an open subdesertic landscape dominated by grasses,indicating arid conditions. However, arboreal pollen grainsare also present, indicating that trees were certainly devel-oping on reliefs. Another noticeable difference is the pres-ence of tropical PFTs simulated by ORCHIDEE, whereasonly subtropical plants are recorded in pollen data. Thereis actually no subtropical PFT categorie in the PFT schemefrom ORCHIDEE, only tropical, temperate or boreal frac-tional coverage. To the East, the fractional coverage of 10 to30% of boreal broad-leaved trees predicted by ORCHIDEEmay be overestimated compared to pollen data, which onlyshow the presence of boreal needle-leaved species in easternEurope, most probably at altitude.
As compared to the modern anthropogenic vegetation dis-tribution used in the PLIO-modernveg simulation (Fig. 5), theORCHIDEE results for the PRISM Time Slab are even more
different. The main vegetation differences that may have animpact on the simulated climatology in the PLIO-paleovegexperiment include a general expansion of temperate forestcover in Europe and the Mediterranean region for the mid-Piacenzian (predicted fractional coverage of more than 90%over 20% of the land, up to 45% for all tree types), whereasthe major part of the present vegetal cover consists of crops,and a reduced coverage of arid desert in North Africa (by20%).
4.3.2 Vegetation-induced effects on climate
As far as the vegetation impact on climate is concerned,the main differences in experiment PLIO-paleoveg comparedwith the PLIO-modernveg run are shown on Fig. 6. The spa-tial average of the mean annual temperature difference overthe region of interest is on the order of a tenth of a degreebetween the two simulations over continental Europe. ThePLIO-paleoveg−CTRL Tann anomalies are thus very simi-lar to the previous PLIO-modernveg−CTRL one. The ad-dition of the paleovegetation produces few statistically sig-nificant changes in the modelled climate, except over someareas such as North Africa where an annual mean coolingthat reaches more than 1◦C is simulated and in a few othercases, such as over northwestern Europe (British Isles) andthe Alps that are slightly, up to around 0.5◦C, warmer (notshown). The model’s sensitivity to Late Pliocene land covercharacterization is therefore limited in terms of 2-m meanannual temperature changes over the studied area.
www.clim-past.net/5/585/2009/ Clim. Past, 5, 585–606, 2009

594 A. Jost et al.: Mid-Piacenzian warmth high resolution simulations
0 100704010 805020 906030
a) grass, modernveg
-15 -10 -5 0 5 10 15 20 2530
32
34
36
38
40
42
44
46
48
50
52
54
56
58
60
0 100704010 805020 906030
b) trees, modernveg
-15 -10 -5 0 5 10 15 20 2530
32
34
36
38
40
42
44
46
48
50
52
54
56
58
60
0 100704010 805020 906030
c) grass, paleoveg
-15 -10 -5 0 5 10 15 20 2530
32
34
36
38
40
42
44
46
48
50
52
54
56
58
60
0 100704010 805020 906030
d) trees, paleoveg
-15 -10 -5 0 5 10 15 20 2530
32
34
36
38
40
42
44
46
48
50
52
54
56
58
60
Fig. 5. Maximum percentage of herbaceous and arboreal coverage, i.e. the fraction calculated as the combination of grasses and crops and thesum of the arboreal PFTs, respectively, in the modern vegetation and simulated by ORCHIDEE for the mid-Piacenzian epoch:(a) modernherbaceous fraction,(b) modern arboreal fraction,(c) mid-Piacenzian herbaceous fraction,(d) mid-Piacenzian arboreal fraction.
The vegetation impact on the simulated climate mainly oc-curs during the summer season (Fig. 6). Simulated tempera-tures of the warmest month (Fig. 6a) are reduced by 0.9◦C onaverage on the studied area, cooler by 1 to 2◦C over westernEurope and North Africa, and as much as 3◦C over easternEurope, as compared with PLIO-modernveg. The most sig-nificant variations are observed over the latter regions. Theycorrespond to a reduced summer warming over Europe andcoolerTwarm over North Africa at mid-Piacenzian times, rel-ative to the present. In winter, the vegetation-induced coolingis not significative.
As regards the model-data comparison, the effect of themore realistic vegetation treatment is quite negligible anddoes not induce any improvement of the simulated mean an-nual cycle of 2-m air temperature (Fig. 7). The lack of obser-vations located further inland in areas displaying statisticallysignificant differences prevents from evaluating the accuracyof the summer temperature anomalies trend provided by thePLIO-paleoveg experiment.
Examining model diagnostics for the annual precipita-tion (not shown) indicates average conditions that are ratherdrier than the PLIO-modernveg pattern, with negative lo-cal disparities, from 50 to−250 mm/yr, between the two
Clim. Past, 5, 585–606, 2009 www.clim-past.net/5/585/2009/
A. Jost et al.: Mid-Piacenzian warmth high resolution simulations 595
-1.5 -0.5 2.00.5 1.0-2 1.5-1.0 0.0
a) LMDz, Twarm, PLIOpaleoveg-PLIOmodernveg
-15 -10 -5 0 5 10 15 20 2530
32
34
36
38
40
42
44
46
48
50
52
54
56
58
60
0 100-250 200-150 -50 50 150-200 250-100
b) LMDz, P, JJA, PLIOpaleoveg-PLIOmodernveg
-15 -10 -5 0 5 10 15 20 2530
32
34
36
38
40
42
44
46
48
50
52
54
56
58
60
0-20 -18 -16 -14 -12 -10 -8 -6 -4 -2
c) LMDz, Albedo, PLIOpaleoveg-PLIOmodernveg
-15 -10 -5 0 5 10 15 20 2530
32
34
36
38
40
42
44
46
48
50
52
54
56
58
60
0 100-250 200-150 -50 50 150-200 250-100
d) LMDz, ET, JJA, PLIOpaleoveg-PLIOmodernveg
-15 -10 -5 0 5 10 15 20 2530
32
34
36
38
40
42
44
46
48
50
52
54
56
58
60
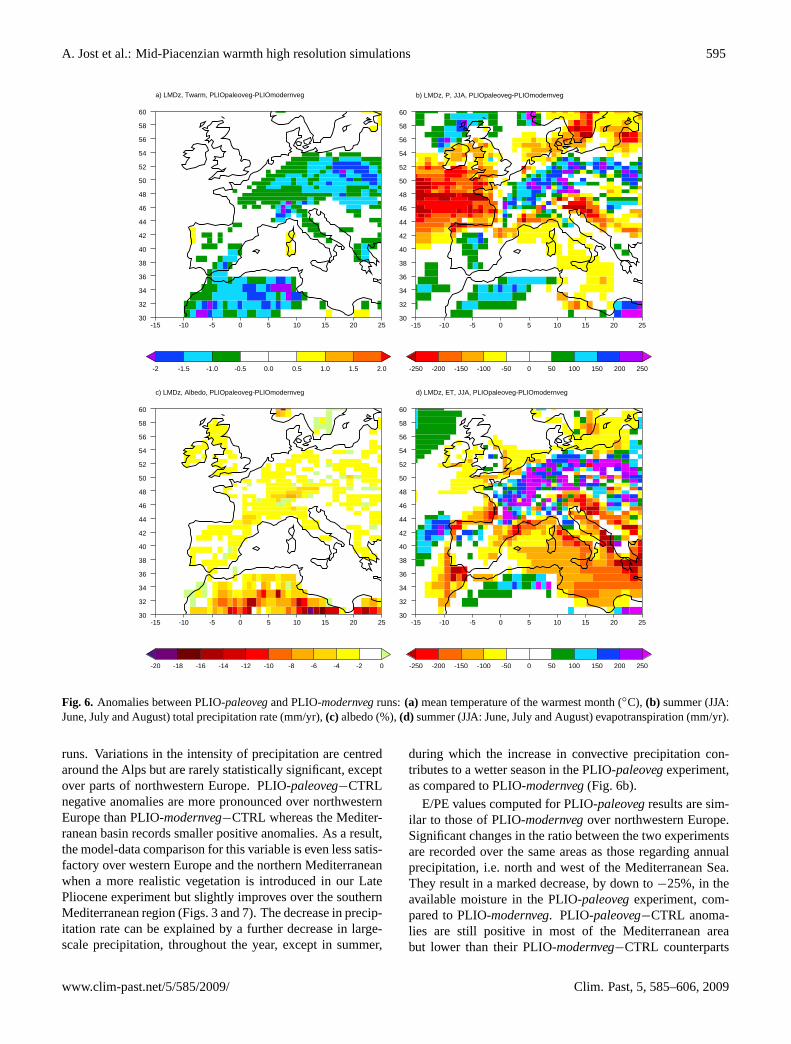
Fig. 6. Anomalies between PLIO-paleoveg and PLIO-modernveg runs: (a) mean temperature of the warmest month (◦C), (b) summer (JJA:June, July and August) total precipitation rate (mm/yr),(c) albedo (%),(d) summer (JJA: June, July and August) evapotranspiration (mm/yr).
runs. Variations in the intensity of precipitation are centredaround the Alps but are rarely statistically significant, exceptover parts of northwestern Europe. PLIO-paleoveg−CTRLnegative anomalies are more pronounced over northwesternEurope than PLIO-modernveg−CTRL whereas the Mediter-ranean basin records smaller positive anomalies. As a result,the model-data comparison for this variable is even less satis-factory over western Europe and the northern Mediterraneanwhen a more realistic vegetation is introduced in our LatePliocene experiment but slightly improves over the southernMediterranean region (Figs. 3 and 7). The decrease in precip-itation rate can be explained by a further decrease in large-scale precipitation, throughout the year, except in summer,
during which the increase in convective precipitation con-tributes to a wetter season in the PLIO-paleoveg experiment,as compared to PLIO-modernveg (Fig. 6b).
E/PE values computed for PLIO-paleoveg results are sim-ilar to those of PLIO-modernveg over northwestern Europe.Significant changes in the ratio between the two experimentsare recorded over the same areas as those regarding annualprecipitation, i.e. north and west of the Mediterranean Sea.They result in a marked decrease, by down to−25%, in theavailable moisture in the PLIO-paleoveg experiment, com-pared to PLIO-modernveg. PLIO-paleoveg−CTRL anoma-lies are still positive in most of the Mediterranean areabut lower than their PLIO-modernveg−CTRL counterparts
www.clim-past.net/5/585/2009/ Clim. Past, 5, 585–606, 2009

596 A. Jost et al.: Mid-Piacenzian warmth high resolution simulations
Fig. 7. Same as for Fig. 3 but PLIO-paleoveg results.
and exhibit negative values over southeastern Europe.The model-data comparison therefore slightly deteriorates(Fig. 7).
5 Discussion
In this study, we have first investigated the ability of the highresolution zoomed version of the LMDz AGCM to repro-duce the warmer and slightly wetter conditions of the mid-Piacenzian by means of a quantitative model – pollen datacomparison over Europe and the Mediterranean area. Thenwe have considered the relative impact of the reconstructedvegetation on the simulated climatic response at the regionalscale.
5.1 High resolution climate modelling in a warmercontext
5.1.1 A good agreement for near surface temperatures
For the mean annual near surface temperature field, the sim-ulated mid-Piacenzian warming relative to the present isbroadly consistent with previous modelling studies, partic-
ularly that of Haywood et al. (2000b) for the study area,and with the quantitative paleoclimatic reconstructions (Fau-quette et al., 2007). For most sites, the discrepancy is smallgiven both the interannual variability of the model and thelarge and less precise entire climatic intervals surroundingthe most likely values reconstructed by the pollen indicators(Fig. 3a).
Some biases remain, i.e. underestimatedTann, which is notunexpected since our experimental design does not encom-pass all of the forcings that are possible for this epoch, par-ticularly the changing CO2 levels. But the consequence ofa ∼85 ppmv lower value of the atmospheric CO2 concen-tration should be modest because the dominant part of theireffect is already incorporated in the prescribed SSTs. Thedirect physiological impact of higher than today CO2 con-centrations on vegetation is not accounted for either in thepaleoclimate reconstructions themselves, which may lead tosignificant bias (Wu et al., 2007). For the colder period ofthe Last Glacial Maximum, a better agreement between sim-ulated and reconstructed winter cooling over western Europeand the Mediterranean area has been mainly achieved by ex-plicitly accounting for the CO2 decrease in the new climatereconstructions (Ramstein et al., 2007).
Clim. Past, 5, 585–606, 2009 www.clim-past.net/5/585/2009/
A. Jost et al.: Mid-Piacenzian warmth high resolution simulations 597
Inconsistencies between simulated and reconstructed sea-sonal temperatures could reflect the inadequation betweenSSTs over the Mediterranean Sea and pollen data that arelocated along the coast. The increase in summer SSTs be-tween mid-Piacenzian and CTRL is too low as compared totheTwarm anomalies depicted by pollen data over the north-ern Mediterranean but too high in winter as compared to theTcold anomalies according to pollen data over the southernMediterranean. As model results are influenced to a largeextent by the SST forcing (see Kageyama et al. (2005) fora similar result in a glacial context), it would be worth test-ing the range of this forcing within the PRISM time-slab.Over the Mediterranean Sea, maximum and minimum warm-ing SST reconstructions indicate a possible∼1◦C change(Dowsett et al., 2005). A representation of the SST pat-tern consistent with ocean-atmospheric fluxes could also besimulated by a high resolution model of the MediterraneanSea locally coupled with a global atmosphere model, suchas the Sea Atmosphere Mediterranean Model (SAMM) (So-mot et al., 2008). Moreover, the introduction of an activeMediterranean Sea significantly amplifies the 21st climatechange response over large parts of Europe, with respectto its corresponding Atmosphere Regional Climate Model.Indeed, climate change projections based on many globaland regional models agree about a pronounced warming ofseveral degrees for the end of the 21st century over theMediterranean region, with a maximum in the summer sea-son (Giorgi and Lionello, 2008). This region might be es-pecially vulnerable to future global climate change. Thegreater warmth experienced during the mid-Piacenzian pe-riod is comparable to what is projected over the Mediter-ranean area, although seasonal temperature patterns may dif-fer. It would therefore be worth examining the influence ofan interactive Mediterranean Sea or a fully coupled ocean inthe mid-Piacenzian context.
5.1.2 A clear discrepancy for hydrological values
As regards estimates of precipitation values, the main dis-crepancy seems to be the underestimation of continental pre-cipitation in much of northern Europe, whereas the precipi-tation rate is overestimated over the southern Mediterranean,despite a robust pollen data signal. The presence of an exten-sive wet zone in northwestern and central Europe is moreoversuggested by other proxies (small mammals for instance,vanDam, 2006). In this respect, the latitudinal gradient of precip-itation indicated by pollen data resembles the general trendthat emerges from a review of climate change projections forthe 21st century (Meehl et al., 2007). Global warming isexpected to cause a large decline of precipitation over theMediterranean region, except for the northern areas in winter(Giorgi and Lionello, 2008), following what has already beenobserved during the 20th century (Lionello et al., 2006).
These data-model inconsistencies show a general diffi-culty to simulate regional hydrologic processes, even when
using a refined-grid numerical model. Salzmann et al. (2008)also identified many discrepancies when comparing precip-itation estimates from the HadAM3 GCM and literature forselected regions including the Mediterranean area. The useof a finer resolution model, with a better description of boththe orography and small scale dynamics, does not help toprovide a simulated precipitation field in better agreementwith the data, as it did for the LGM at the European scale(Jost et al., 2005). Thus, the fact that the orography of themid-Piacenzian is not described properly (e.g. the weakerconstraints on the elevation of the Alps and the Pyrenees)may be part of the explanation of this different behaviour. Inthis respect, the sensitivity to the Alps and Pyrenees elevationwould be worth studying.
One of the factors which could explain the continental pre-cipitation underestimation over western Europe is the sim-ulated decrease of large-scale precipitation. In the model,large-scale precipitation is defined as the part of the pre-cipitation related to moisture convergence due to large-scaleatmospheric circulation, as opposed to convective precipita-tion, which is related to instable atmospheric vertical profiles.Large-scale mid-latitude precipitation is therefore largely re-lated to the development of synoptic scale perturbations overthe oceans, especially in winter. Total precipitation notablyincreases over the warm ocean regions of the North Atlantic,rising by more than 30% as compared with the present-daycontrol case as an annual mean. This increase is attributableto preponderant moist convective precipitation events, whichoutweigh a diminished large-scale precipitation pattern. In-deed, the former represents 60% of the total precipitation sig-nal in the PLIO experiment for only 20% in the CTRL one.High levels of evaporation are also simulated for the NorthAtlantic and are responsible for a large increase in latent heatfluxes.
These major changes in evaporation and convective pre-cipitation are positively correlated with the prescribed SSTs,one of the main factors determining the mid-Piacenzian cli-mate together with a reduced sea ice extent (Jiang et al.,2005). The pattern of greatest warming with increasing lat-itude was recently confirmed by the re-evaluation of mid-Piacenzian North Atlantic SST estimates by means of a mul-tiproxy analysis (Robinson et al., 2008). The North Atlanticis nonetheless the region that encompasses the greastesttemporal variability within the mid-Piacenzian warm period(Dowsett et al., 2005), of the order of±2–3◦C. Additionalexperiments including these new SST reconstructions arenecessary to investigate in detail the impact of the SST dis-tribution over the North Atlantic on the European continentalclimate. The sensitivity of the European climate to North At-lantic SSTs has already been pointed out for a glacial con-text by Pinot et al. (1999) from AGCM experiments and byKageyama et al. (2006) for coupled ocean-atmosphere ex-periments. In a mid-Piacenzian ocean-atmosphere coupledexperiment (Haywood and Valdes, 2004; Haywood et al.,2007), total precipitation rates are reduced over the North
www.clim-past.net/5/585/2009/ Clim. Past, 5, 585–606, 2009

598 A. Jost et al.: Mid-Piacenzian warmth high resolution simulations
100
a) LMDz, Humidity transport, PLIOmodernveg-CTRL
-60 -50 -40 -30 -20 -10 0 10 20 30 40
75
45
60
30
5
b) LMDz, 10m wind, PLIOmodernveg-CTRL
-60 -50 -40 -30 -20 -10 0 10 20 30 40
75
45
60
30
Fig. 8. (a) Humidity transport and(b) surface wind vectors (m/s) over North Atlantic. Mean annual mid-Piacenzian anomalies from thepresent climate, PLIO-modernveg results.
Atlantic compared to the fixed SST experiment, particularlyin winter, because of lower SSTs predicted by the modelover this region. Indeed, the inclusion of an interactive oceanwould allow a further examination of the potential feedbackfrom the oceans, as it is supposed to have a significant influ-ence on atmospheric dynamics, on ocean-atmosphere fluxesand hence on total precipitation rates. In particular, it wouldallow a better representation of the possible enhanced merid-ional ocean heat transport, which could compensate the sim-ulated decrease in intensity of the large-scale atmosphericcirculation due to the smaller meridional temperature gradi-ent of the mid-Piacenzian.
The resultant reduced ability of the atmosphere to carrymoisture evaporated from the ocean over the continent(Fig. 8a), especially during summer, can therefore accountfor the fact that the aforesaid additional oceanic humiditysupply is not converted into precipitation over the northwest-ern European continent. A slight weakening of zonal windspeeds, by 1–2 m/s over North Atlantic and up to a maxi-mum of 3 m/s, is also simulated over the northwestern Euro-pean continent (Fig. 8b). This westerly wind pattern is nev-ertheless not supported by the data either, as suggested bythe development of Ericaceae moors along the European At-lantic coast (Suc et al., 1995a,b) which would rather point toan intensification of the wind strength.
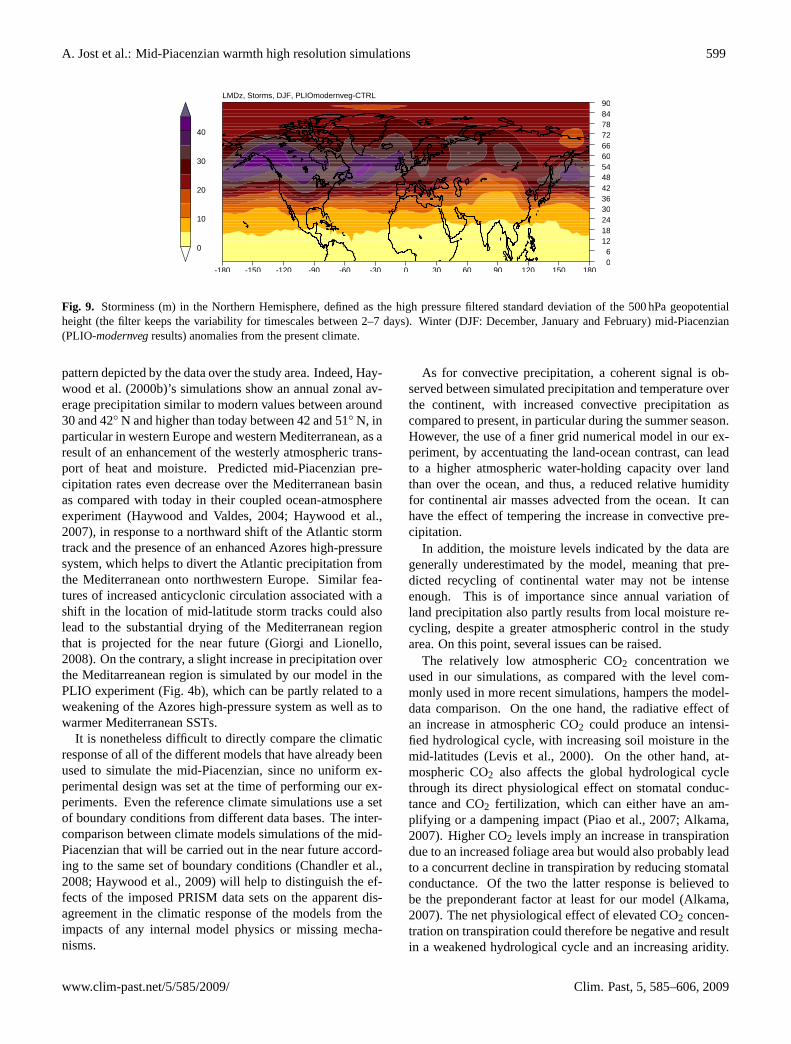
According to basic baroclinic theory (Eady, 1949), theweaker meridional temperature gradient in the North Atlanticshould have the effect of decreasing the storminess. How-ever, this is not the case in our PLIO simulations (Fig. 9).Other factors are therefore playing an important role in mid-latitude transient eddies. These could develop thanks to moreavailable latent heat flux over the warmer oceans (Hoskinsand Valdes, 1990; Laıne et al., 2009). Also, the lower Rock-ies could modify the connection between the Pacific andAtlantic storm-tracks, favouring more feeding of Atlanticstorms by Pacific perturbation remnants (Lunt et al., 2008).The role of these different factors could only be evaluatedthrough dedicated sensitivity experiments (e.g. changing thetopography only or the SSTs only compared to the pre-industrial conditions). The simulated PLIO large-scale pre-cipitation decrease is all the more surprising since strongerstorm-track activity should favour this type of precipitation.It could be, however, that in a case of a warmer ocean such asin PLIO, the increase in storm-track activity favours convec-tive precipitation, to the detriment of large-scale precipita-tion. This calls for a more detailed study and additional sen-sitivity experiments which are out of the scope of the presentpaper.
These results are in contrast with those of other GCMs,which predict weaker storm tracks (Chandler et al., 1994;Sloan et al., 1996). As for the simulated precipitation field,the UKMO AGCM has been able to capture the general
Clim. Past, 5, 585–606, 2009 www.clim-past.net/5/585/2009/
A. Jost et al.: Mid-Piacenzian warmth high resolution simulations 599
0
10
20
30
40
LMDz, Storms, DJF, PLIOmodernveg-CTRL
-180 -150 -120 -90 -60 -30 0 30 60 90 120 150 18006
1218243036424854606672788490
Fig. 9. Storminess (m) in the Northern Hemisphere, defined as the high pressure filtered standard deviation of the 500 hPa geopotentialheight (the filter keeps the variability for timescales between 2–7 days). Winter (DJF: December, January and February) mid-Piacenzian(PLIO-modernveg results) anomalies from the present climate.
pattern depicted by the data over the study area. Indeed, Hay-wood et al. (2000b)’s simulations show an annual zonal av-erage precipitation similar to modern values between around30 and 42◦ N and higher than today between 42 and 51◦ N, inparticular in western Europe and western Mediterranean, as aresult of an enhancement of the westerly atmospheric trans-port of heat and moisture. Predicted mid-Piacenzian pre-cipitation rates even decrease over the Mediterranean basinas compared with today in their coupled ocean-atmosphereexperiment (Haywood and Valdes, 2004; Haywood et al.,2007), in response to a northward shift of the Atlantic stormtrack and the presence of an enhanced Azores high-pressuresystem, which helps to divert the Atlantic precipitation fromthe Mediterranean onto northwestern Europe. Similar fea-tures of increased anticyclonic circulation associated with ashift in the location of mid-latitude storm tracks could alsolead to the substantial drying of the Mediterranean regionthat is projected for the near future (Giorgi and Lionello,2008). On the contrary, a slight increase in precipitation overthe Meditarreanean region is simulated by our model in thePLIO experiment (Fig. 4b), which can be partly related to aweakening of the Azores high-pressure system as well as towarmer Mediterranean SSTs.
It is nonetheless difficult to directly compare the climaticresponse of all of the different models that have already beenused to simulate the mid-Piacenzian, since no uniform ex-perimental design was set at the time of performing our ex-periments. Even the reference climate simulations use a setof boundary conditions from different data bases. The inter-comparison between climate models simulations of the mid-Piacenzian that will be carried out in the near future accord-ing to the same set of boundary conditions (Chandler et al.,2008; Haywood et al., 2009) will help to distinguish the ef-fects of the imposed PRISM data sets on the apparent dis-agreement in the climatic response of the models from theimpacts of any internal model physics or missing mecha-nisms.
As for convective precipitation, a coherent signal is ob-served between simulated precipitation and temperature overthe continent, with increased convective precipitation ascompared to present, in particular during the summer season.However, the use of a finer grid numerical model in our ex-periment, by accentuating the land-ocean contrast, can leadto a higher atmospheric water-holding capacity over landthan over the ocean, and thus, a reduced relative humidityfor continental air masses advected from the ocean. It canhave the effect of tempering the increase in convective pre-cipitation.
In addition, the moisture levels indicated by the data aregenerally underestimated by the model, meaning that pre-dicted recycling of continental water may not be intenseenough. This is of importance since annual variation ofland precipitation also partly results from local moisture re-cycling, despite a greater atmospheric control in the studyarea. On this point, several issues can be raised.
The relatively low atmospheric CO2 concentration weused in our simulations, as compared with the level com-monly used in more recent simulations, hampers the model-data comparison. On the one hand, the radiative effect ofan increase in atmospheric CO2 could produce an intensi-fied hydrological cycle, with increasing soil moisture in themid-latitudes (Levis et al., 2000). On the other hand, at-mospheric CO2 also affects the global hydrological cyclethrough its direct physiological effect on stomatal conduc-tance and CO2 fertilization, which can either have an am-plifying or a dampening impact (Piao et al., 2007; Alkama,2007). Higher CO2 levels imply an increase in transpirationdue to an increased foliage area but would also probably leadto a concurrent decline in transpiration by reducing stomatalconductance. Of the two the latter response is believed tobe the preponderant factor at least for our model (Alkama,2007). The net physiological effect of elevated CO2 concen-tration on transpiration could therefore be negative and resultin a weakened hydrological cycle and an increasing aridity.
www.clim-past.net/5/585/2009/ Clim. Past, 5, 585–606, 2009

600 A. Jost et al.: Mid-Piacenzian warmth high resolution simulations
Such an additional simulated decrease in soil moisture wouldnot help to reduce model-data discrepancies but match cli-mate change projections over the Mediterranean region forthe 21st century (Giorgi and Lionello, 2008).
In this respect, the representation of physical processessuch as ground hydrology may play a non negligible role.Local soil moisture changes can lead to variations in theregional intensity of the water cycle during the warm sea-son when the convection precipitation regime intensifies. Inour experiment, soils are drying out during the summer inresponse to the warmer ground temperatures. The repre-sentation of subsurface hydrological processes in the cur-rent land surface scheme used in the AGCM is indeed rathersimple. The introduction of a groundwater component withan explicit representation of the water table in the land sur-face model would help to produce much wetter soil moistureprofiles and more dry-period evapotranspiration (Miguez-Macho et al., 2007), in a better agreement with theα data.In addition, it could reinforce the potential for regional recy-cling of water (Anyah et al., 2008). As the orography of themid-Piacenzian was relatively flat, shallow water table con-ditions must have actually occured, leading to significantlywetter soil through the exchanges of water between the un-saturated soil and the underlying aquifer.
Lastly, water recycling also varies according to the veg-etation characteristics. It is therefore worth taking into ac-count a distribution of vegetation boundary conditions con-sistent with the precipitation rates and more generally, withthe mid-Piacenzian climatology. This is the subject of oursecond experiment.
5.2 Evaluating the consequences of vegetation changeson the mid-Piacenzian climate
In response to the climate forcing of the first PLIO-modernveg run, ORCHIDEE simulates a potential vegetationdistribution for the mid-Piacenzian which differs all the morefrom the one used in PLIO-modernveg since this latter cor-responded to a modern (including anthropogenic) vegetationcover. Here we thus carry out a comparison of the impactof a forest-dominated vegetation against a human-dominatedone, in which forests replace crop and pasture areas as wellas expanses of bare soil, in the global warming context ofthe mid-Piacenzian. In this respect, it concurs with a numberof recent studies on the relevance of taking into account theimpact of land use change on surface climate (e.g. Kleidon,2006; Bala et al., 2007; Davin et al., 2007).
5.2.1 Near surface temperatures
The effect of introducing a potential paleovegetation forthe mid-Piacenzian on the simulated surface temperatures isfound to be quite limited, as Jiang et al. (2005) demonstratedin their sensitivity study. In our study area, the vegetationfeedback does not even have a strong impact on the regional
scale, except during summer, when it contributes to a reduc-tion of the seasonality of temperature, as in Haywood andValdes (2006).
Despite the mean land surface temperature not being verysensitive to land cover change, our simulation results pointout that the mid-Piacenzian forest spread results in a surfacecooling in most of western Europe, compared to the PLIO-modernveg experiment. When considering alterations in theland cover, various competitive terms contribute to affectsurface temperature: the radiative forcing due to change inalbedo and water vapour and non-radiative processes, e.g. thealteration of turbulent exchanges of sensible and latent heat(Kleidon, 2006; Davin et al., 2007). In our model simula-tions, modifying the vegetated cover by roughly convertinggrasslands to forests has two main opposite effects on tem-perature. On the one hand, the general reduction in surfacealbedo results in an increased net surface solar absorption,which means warming. Anomalies of the annual mean sur-face albedo of a few percents are produced by the AGCMover the study area (Fig. 6c). On the other hand, convert-ing grasslands to tree-type vegetation tends to increase theland surface evapotranspiration rates. This effect is espe-cially relevant during the summer months in northwesternEurope, with evapotranspiration anomalies between the twomid-Piacenzian simulations reaching 250 mm/yr (Fig. 6d).The subsequent increase in latent heat fluxes, of the orderof a few tens of W/m2 during summer, proportional to evap-oration, explains the cooling of the near-surface atmosphereover land. The increase in latent heat cooling seems to out-weigh the increase in surface solar radiation heating, mean-ing that the non-radiative processes dominate the summer cli-mate response.
The evapotranspiration changes could also result in an in-crease in low-level cloudiness that would further cool thesurface climate since cloud formation tends to limit the so-lar radiation income. Indeed, it has been shown that cloudfeedbacks initiated by evapotranspiration changes may playa major role in determining the overall climatic impact ofland cover change, in the context of deforestation over trop-ical regions (Bala et al., 2007). However, our simulation re-sults do not suggest any increase in low-level cloudiness overthe concerned areas nor any significant relationship betweenevapotranspiration and clouds changes. Thus, the impact ofthe cloud response on the energy balance of the climate sys-tem seems rather limited at such latitudes despite the globallywarmer climate of the mid-Piacenzian as compared with to-day.
5.2.2 Hydrological cycle
Vegetation changes also modify the surface water balance.Our simulation results suggest a weakening of the hydrolog-ical cycle over land in the PLIO-paleoveg run compared withthe PLIO-modernveg one, except during summer.
Clim. Past, 5, 585–606, 2009 www.clim-past.net/5/585/2009/
A. Jost et al.: Mid-Piacenzian warmth high resolution simulations 601
As already observed in the PLIO-modernveg−CTRL com-parison, the model is still particularly sensitive to large-scaleatmospheric effects in the PLIO-paleoveg run. The reductionin winter large-scale precipitation is more pronounced in thelatter run, which accounts for the deterioration of the model-data comparison over land. The further weakening of thewinds, which may be due to increased roughness length be-cause of vegetation change, affects the large-scale transportof heat and moisture. Indeed, the two mid-Piacenzian simu-lations show noticeable differences in regional precipitationminus evaporation rates with a marked decrease of the netatmospheric moisture convergence over land. It means thatbiophysical effects of land-cover change are not only felt atregional scales but may also impact the general atmosphericcirculation and give rise to remote climate changes throughnonlinear feedbacks (Gedney and Valdes, 2000; Chase et al.,2000; Baidya Roy et al., 2003). These changes being morediffuse, their evaluation is all the more complicated at the lo-cal scale, where changes in precipitation result from a com-bined effect of local vegetation changes, as well as in remotelocations, through the atmospheric pathway. This also ap-plies to temperatures.
Besides, a strengthening of moist convective precipitationevents, in frequency or intensity, is simulated in the PLIO-paleoveg run during summer over land and during winterover the ocean, as compared to the PLIO-modernveg exper-iment. This convective rainfall response is linked to an in-tensification of the evapotranspiration, and the associated in-creasing water vapour content in the atmosphere. Mean an-nual precipitation rates therefore increase over the North At-lantic. The enhancement of summer convective rainfall overland is nonetheless not sufficient to counterbalance the de-crease of large-scale precipitation, which occurs over the restof the year (Fig. 6b).
5.2.3 Why do vegetation changes not really contributeto a more accurate simulation of themid-Piacenzian climate, as compared topaleodata?
To conclude, our simulations demonstrate a moderate vegeta-tion impact on temperature extremes and hydrological cycleover Europe and the Mediterranean area but which does notimprove the model-data comparison of our first run (Fig. 7).
Regarding our experimental design, the fact that the veg-etation distribution we use for the PLIO-paleoveg run wasproduced by a model-driven climate means that biases inher-ent in the GCM simulation (e.g. physics, boundary condi-tions, CO2 levels) may lead to biases in the predicted vegeta-tion (Cosgrove et al., 2002; Crucifix and Hewitt, 2005). It istherefore not unexpected that the vegetation distribution pro-duced by ORCHIDEE does not completely match the veg-etation reconstructions depicted by the pollen data. For in-stance, tropical trees may be simulated as a consequence ofthe too warmTcold or simply because the vegetation classi-
fication used by the model is not as specific as the biometypology of pollen data.
Consequently unrealistic vegetation changes may drive in-adequate perturbations in the atmosphere dynamics, whichcan therefore not contribute to improve the mid-Piacenzianclimate simulation. It is nonetheless expected that such adeterioration of the climate signal is quite negligible as weshow that the vegetation impact on climate is moderate inthe European and Mediterranean mid-latitudes.
Furthermore, the climate-vegetation system could be sen-sitive to the initial distribution of vegetation (Claussen,1994), as several stable states may exist by starting the iter-ative process from different initial conditions (Crowley andBaum, 1997). In our case, we have not tested whether wewould obtain the same mid-Piacenzian vegetation startingfrom a vegetation different from the modern, such as thePRISM2 vegetation or a PNV estimate, which would haveat least reintroduced forest rather than grassland to much ofEurope.
We have also assumed that the largest vegetation changeis obtained after the first iteration. As the resulting climatechange appeared to be quite limited in the study area, i.e. theclimatology given to ORCHIDEE is not very different fromthe one including changes made by the vegetation itself, sig-nificant vegetation alteration would probably not occur byextending further the iterative process.
Our field of analysis of past climate-vegetation character-istics is also partly limited by the geographic location of ourstudy area, because vegetation change appears to have quitelittle influence on climate in the mid-latitude regions, result-ing in not very significant results (Bala et al., 2007). Exami-nation of high resolution simulations centred over regions lo-cated in the low or high latitudes could help to better capturepast climate-vegetation feedbacks associated to the warmerclimate of the mid-Piacenzian.
The incomplete simulation design can also be invoked, asit prevents all of the vegetation effects on climate from beingeffective. Running ORCHIDEE in dynamic mode, allowingclimate and vegetation to come into equilibrium, would haveimproved the model-data comparison, as shown in Haywoodand Valdes (2006), although improvements mainly applied intropical regions. Furthermore, conversion of vegetation doesnot only affect the climate system through the surface-energybudget but also through the carbon cycle. Plant-climate inter-actions are sensitive to atmospheric CO2 concentration. Forinstance, water balance depends on vegetation growth con-ditions that are highly CO2-dependent. A poor representa-tion of LAI and stomatal conductance has been shown to dis-turb the hydrologic cycle (Alkama, 2007). Therefore, it ap-pears possible to improve model-data comparison in futuresimulations. This is actually also true for pollen-based cli-mate reconstructions, which do not include either the vege-tation dependence on high mid-Piacenzian atmospheric CO2concentration and are calibrated for pollen originating fromplants growing under modern CO2 levels. Also, as landscape
www.clim-past.net/5/585/2009/ Clim. Past, 5, 585–606, 2009

602 A. Jost et al.: Mid-Piacenzian warmth high resolution simulations
dynamics does not only affect the climate system at local orregional scale but can also have significant global impacts byaltering large-scale circulations, ocean feedbacks will needto be considered.
6 Conclusions
This paper presents the results of a high resolution mod-elling experiment of the mid-Piacenzian climate, focusing onwestern Europe and the areas surrounding the MediterraneanSea. Our motivation was twofold: (1) to evaluate the simu-lated climatologies by comparing them to paleoclimatic re-constructions from pollen records from individual locationsand (2) to assess in detail the effects of altered vegetationboundary conditions, in the context of a climate warmer thantoday.
We find that the AGCM results are consistent with the evi-dence of increased temperatures provided by the data. Simu-lation results further indicate that continental moisture levelswere quite different from today. However, the poor compar-ison of model versus data as regards the annual precipita-tion field or the E/PE pattern raises the issue of the accuracyof the imposed boundary conditions data sets for the mid-Piacenzian, the representation of the internal physics of themodel and the pollen interpretation.
In order to more rigorously address this problem, it is nownecessary to carry out an intercomparison between climatemodels simulations of the mid-Piacenzian according to anuniform experimental design. Such a project is already un-derway as part of Plio-MIP (Pliocene Model IntercomparisonProject) (Chandler et al., 2008; Haywood et al., 2009). Thiswill allow to explore the range of variability of the models’responses to the mid-Piacenzian warming, and to explain thedispersion of the results in terms of differences in the physicsor in the parametrization of physical processes. Our next stepin modelling the mid-Piacenzian climate will involve the useof fully-coupled atmosphere-ocean-vegetation models underprescribed boundary conditions from the PRISM3D data set(Cronin et al., 2005; Dowsett et al., 2006, 2009a; Dowsettand Robinson, 2009b; Robinson et al., 2008; Robinson,in press; Salzmann et al., 2008; Dwyer and Chandler, 2009).This is essential in the exploration of the roles of the oceancirculation, the atmosphere and the land surface changes andtheir contribution to mid-Piacenzian global warmth.
Many sensitivity studies about each PRISM boundary con-dition, such as the test on the vegetation cover carried out inthis paper, have already been achieved. On the basis of ourmodelling results, we show evidence of an influence of thevegetation cover on the regional climate; however, the inclu-sion of a more appropriate vegetation distribution producesfew significant changes at the mid-latitudes investigated inthis study. Further work regarding the description of the hy-drological cycle and relative to its parametrization will helpto better take into account the vegetation impact on climate.
Acknowledgements. We thank H. J. Dowsett and the PRISM groupfor kindly providing the PRISM2 digital data set, A. Laıne for dis-cussion on storm-tracks, M.-N. Woillez for discussion on vegetationmodelling, M. Clet-Pellerin, Z. Zheng, F. Diniz, W. H. Zagjwin andthe Netherlands Geological Survey for the pollen data of La Londe,Saint-Isidore, Rio Maior and Susteren, respectively, and A. M. Hay-wood, H. J. Dowsett and an anonymous referee for useful commentson an earlier version of the manuscript.
This paper is a contribution to the “Environments and EcosystemsDynamic of the Eurasian Neogene” (EEDEN) project of the Euro-pean Science Foundation and to the ECLIPSE II INSU programme:“Quantification de l’impact des forcages climatiques/anthropiquespasses et futurs sur les circulations dans le bassin de Paris”, inpartnership with ANDRA, EDF, GDF and IRSN. This is an ISEMcontribution no. 2009-103.
Edited by: V. Brovkin
The publication of this article is financed by CNRS-INSU.
References
Alkama, R.: Interactions ruissellement-systeme climatique en cli-mats froids et chauds, Ph.D. thesis, UPMC Univ. Paris 06,France, 2007.
Anyah, R., Weaver, C., Miguez-Macho, G., Fan, Y., andRobock, A.: Incorporating water table dynamics in climatemodeling: 3. Simulated groundwater influence on coupledland-atmosphere variability, J. Geophys. Res., 113, D07103,doi:10.1029/2007JD009087, 2008.
Baidya Roy, S., Hurtt, G., Weaver, C., and Pacala, S.: Impact ofhistorical land cover change on the July climate of the UnitedStates, J. Geophys. Res., 108, 4793, doi:10.1029/2003JD003565,2003.
Bala, G., Caldeira, K., Wickett, M., Phillips, T., Lobell, D., Delire,C., and Mirin, A.: Combined climate and carbon-cycle effectsof large-scale deforestation, P. Natl. Acad. Sci. USA, 104, 6550–6555, 2007.
Beaudouin, C., Suc, J.-P., Escarguel, G., Arnaud, M., and Charmas-son, S.: The significance of pollen signal in present-day marineterrigenous sediments: the example of the Gulf of Lions (westernMediterranean Sea), Geobios, 40, 159–172, 2007.
Bessais, E. and Cravatte, J.: Lesecosystemes vegetaux pliocenes deCatalogne meridionale, Variations latitudinales dans le domainenord-ouest mediterraneen, Geobios, 21, 49–63, 1988.
Berggren, W., Kent, D., Swisher, C., and Aubry, M. P.: Arevised Cenozoic geochronology and chronostratigraphy, in:Geochronology, time scales and global stratigraphic correlation,edited by: Berggren, W., Kent, D., Aubry, M. P., and Hardenbol,J., Society for Sedimentary Geology Special Publication, Tulsa,129–212, 1995.
Clim. Past, 5, 585–606, 2009 www.clim-past.net/5/585/2009/
A. Jost et al.: Mid-Piacenzian warmth high resolution simulations 603
Cambon, G., Suc, J.-P., Aloısi, J. C., Giresse, P., Monaco, A.,Touzani, A., Duzer, D., and Ferrier, J.: Modern pollen deposi-tion in the Rhone delta area (lagoonal and marine sediments),France, Grana, 36, 105–113, 1997.
Chandler, M., Dowsett, H., and Haywood, A.: The PRISMmodel/data cooperative: mid-Pliocene data-model comparisons,PAGES News, 16, 24–25, 2008.
Chandler, M., Rind, D., and Thompson, R.: Joint investigationsof the Middle Pliocene climate II: GISS GCM Northern Hemi-sphere results, Global Planet. Change, 9, 197–219, 1994.
Chase, T., Pielke Sr., R., Kittel, T., Nemani, R., and Running, S.:Simulated impacts of historical land cover changes on global cli-mate in northern winter, Clim. Dynam., 16, 93–105, 2000.
Claussen, M.: On coupling global biome models with climate mod-els, Climate Res., 4, 203–221, 1994.
Clet, M. and Huault, M. F.: Les depots lagunaires du Reuveriendans les argiles de la Londe (Normandie, France), B. Assoc. Fr.Etud. Quaternaire, 4, 195–202, 1987.
Cosgrove, B., Barron, E., and Pollard, D.: A simple interactivevegetation model coupled to the GENESIS GCM, Global Planet.Change, 32, 253–278, 2002.
Cronin, T.: Pliocene shallow water paleoceanography of the NorthAtlantic ocean based on marine ostracods, Quaternary Sci. Rev.,10, 175–188, 1991.
Cronin, T., Dowsett, H., Dwyer, G., Baker, P., and Chandler, M.:Mid-Pliocene deep-sea bottom water temperatures based on os-tracode Mg/Ca ratios, Mar. Micropaleontol., 54, 249–261, 2005.
Crowley, T.: Pliocene climates: the nature of the problem, Mar.Micropaleontol., 27, 3–12, 1996.
Crowley, T. and Baum, S.: Effect of vegetation on an ice-age cli-mate model simulation, J. Geophys. Res., 102, 16463–16480,1997.
Crucifix, M. and Hewitt, C.: Impact of vegetation changes on thedynamics of the atmosphere at the Last Glacial Maximum, Clim.Dynam., 25, 447–459, 2005.
Davin, E., de Noblet-Ducoudre, N., and Friedlingstein, P.: Im-pact of land cover change on surface climate: relevanceof the radiative concept, Geophys. Res. Lett., 34, L13702,doi:10.1029/2007GL029678, 2007.
Diniz, F.: Apports de la palynologiea la connaissance du Plioceneportugais. Rio Maior: un bassin de reference pour l’histoire dela flore, de la vegetation et du cimat de la facade atlantique del’Europe meridionale, Habilitation thesis, Univ. Montpellier 2,France, 1984a.
Diniz, F.: Etude palynologique du bassin pliocene de Rio Maior,Paleobiologie Continentale, 14, 259–267, 1984b.
Dowsett, H.: The PRISM Palaeoclimate Reconstruction andPliocene Sea-Surface Temperature, in: Deep-time perspectiveson climate change: marrying the signal from computer modelsand biological proxies, edited by: Williams, M., Haywood, A.,Gregory, F., and Schmidt, D., The Micropaleontological Society,Special Publications, The Geological Society, London, 459–480,2007.
Dowsett, H., Barron, J., and Poore, R.: Middle Pliocene sea surfacetemperatures: a global reconstruction, Mar. Micropaleontol., 27,13–26, 1996.
Dowsett, H., Barron, J., Poore, R., Thompson, R., Cronin, T., Ish-man, S., and Willard, D.: Middle Pliocene paleoenvironmentalreconstruction: PRISM2, US Geological Survey, Open file re-
port, http://pubs.usgs.gov/openfile/of99-535, 99–535, 1999.Dowsett, H., Chandler, M., Cronin, T., and Dwyer, G.: Middle
Pliocene sea surface temperature variability, Paleoceanography,20, PA2014, doi:10.1029/2005PA001133, 2005.
Dowsett, H., Chandler, M., and Robinson, M.: Surface tempera-tures of the Mid-Pliocene North Atlantic Ocean: implications forfuture climate, Philos. T. Roy. Soc. A, 367, 69–84, 2009a.
Dowsett, H. and Cronin, T.: Preface, Quaternary Sci. Rev., 10, v–vi,1991.
Dowsett, H., Cronin, T., Poore, R., Thompson, R., Whatley, R.,and Wood, A.: Micropaleontological evidence for increasedmeridional heat-transport in the North Atlantic Ocean during thePliocene, Science, 258, 1133–1135, 1992.
Dowsett, H. and Robinson, M.: Mid-Pliocene equatorial Pacific seasurface temperature reconstructions: a multi-proxy perspective,Philos. T. Roy. Soc. A, 367, 109–125, 2009b.
Dowsett, H., Robinson, M., Dwyer, G., Chandler, M., and Cronin,T.: PRISM 3 DOT1 Atlantic Basin Reconstruction, US Geologi-cal Survey Data Series, 189, 2006.
Dowsett, H., Thompson, R., Barron, J., Cronin, T., Fleming, R., Ish-man, S., Poore, R., Willard, D., and Holtz, T.: Joint investigationsof the Middle Pliocene climate I, PRISM paleoenvironmental re-constructions, Global Planet. Change, 9, 169–195, 1994.
Ducoudre, N., Laval, K., and Perrier, A.: SECHIBA, a new setof parameterizations of the hydrologic exchanges at the land-atmosphere interface within the LMD atmospheric general cir-culation model, J. Climate, 6, 248–273, 1993.
Dwyer, G. and Chandler, M.: Mid-Pliocene sea-level and continen-tal ice volume based on coupled benthic Mg/Ca palaeotempera-tures and oxygen isotopes, Philos. T. Roy. Soc. A, 367, 157–168,2009.
Eady, E.: Long waves and cyclone waves, Tellus, 1, 33–52, 1994.Fauquette, S., Guiot, J., and Suc, J.-P.: A method for climatic re-
construction of the Mediterranean Pliocene using pollen data,Palaeogeogr. Palaeocl., 144, 183–201, 1998a.
Fauquette, S., Quezel, P., Guiot, J., and Suc, J.-P.: Significationbioclimatique de taxons-guides du Pliocene mediterraneen, Geo-bios, 31, 151–169, 1998b.
Fauquette, S., Suc, J.-P., Guiot, J., Diniz, F., Feddi, N., Zheng, Z.,Bessais, E., and Drivaliari, A.: Climate and biomes in the WestMediterranean area during the Pliocene, Palaeogeogr. Palaeocl.,152, 15–36, 1999.
Fauquette, S., Suc, J.-P., Jimenez-Moreno, G., Micheels, A., Jost,A., Favre, E., Bachiri-Taoufiq, N., Bertini, A., Clet-Pellerin, M.,Diniz, F., Farjanel, G., Feddi, N., and Zheng, Z.: Latitudinal cli-matic gradients in Western European and Mediterranean regionsfrom the Mid-Miocene (∼15 Ma) to the Mid-Pliocene (∼3.5 Ma)as quantified from pollen data, in: Deep-time perspectives on cli-mate change: marrying the signal from computer models and bi-ological proxies, edited by: Williams, M., Haywood, A., Gre-gory, F., and Schmidt, D., The Micropaleontological Society,Special Publications, The Geological Society, London, UK, 481–502, 2007.
Favre, E.: Evolution de la vegetation de l’Europe et du pour-tour mediterraneen au Neogene dans les contextes clima-tique global et geographique regional. Approches statistiqueset elaboration de cartes de vegetation a partir des donneespolliniques, Ph.D. thesis, UCB Univ. Lyon 1, France, 262 pp.,2007.
www.clim-past.net/5/585/2009/ Clim. Past, 5, 585–606, 2009
604 A. Jost et al.: Mid-Piacenzian warmth high resolution simulations
Gedney, N. and Valdes, P.: The effect of Amazonian deforestationon the Northern Hemisphere circulation and climate, Geophys.Res. Lett., 27, 3053–3056, 2000.
Giorgi, F. and Lionello, P.: 21st Climate change projections for theMediterranean region, Global Planet. Change, 63, 90–104, 2000.
Haywood, A., Chandler, M., Valdes, P., Salzmann, U., Lunt, D., andDowsett, H.: Comparison of Mid-Pliocene climate predictionsproduced by the HadAM3 and GCMAM3 General CirculationModels, Global Planet. Change, 66, 208–224, 2009.
Haywood, A., Sellwood, B., and Valdes, P.: Regional warming:Pliocene (3 Ma) paleoclimate of Europe and the Mediterranean,Geology, 28, 1063–1066, 2000b.
Haywood, A., Valdes, P., and Sellwood, B.: Global scale palaeo-climate reconstruction of the Middle Pliocene climate using theUKMO GCM: initial results, Global Planet. Change, 25, 239–256, 2000a.
Haywood, A., Valdes, P., Sellwood, B., Kaplan, J., and Dowsett, H.:Modelling Middle Pliocene warm climates of the USA, Palaeon-tol. Electron., 4, 5, 21 pp., 2001.
Haywood, A. and Valdes, P.: Modelling Middle Pliocene warmth:contribution of atmosphere, oceans and cryosphere, Earth Planet.Sc. Lett., 218, 363–377, 2004.
Haywood, A. and Valdes, P.: Vegetation cover in a warmer worldsimulated using a dynamic global vegetation model for the Mid-Pliocene, Palaeogeogr. Palaeocl., 237, 412–427, 2006.
Haywood, A., Valdes, P., and Peck, V.: A permanent El Nino-like state during the Pliocene?, Paleoceanography, 22, PA1213,doi:10.1029/2006PA001323, 2007.
Heusser, L.: Pollen distribution in marine sediments on the conti-nental margin of northern California, Mar. Geol., 80, 131–147,1988.
Hoskins, B. and Valdes, P.: On the existence of storm-tracks, J.Atmos. Sci., 47, 1854–1864, 1990.
Jansen, E., Overpeck, J., Briffa, K., Duplessy, J.-C., Joos, F.,Masson-Delmotte, V., Olago, D., Otto-Bliesner, B., Peltier, W.,Rahmstorf, S., Ramesh, R., Raynaud, D., Rind, D., Solomina, O.,Villalba, R., and Zhang, D.: Palaeoclimate, in: Climate Change2007: The Physical Science Basis, Contribution of WorkingGroup I to the Fourth Assessment Report of the Intergovenmen-tal Panel on Climate Change, edited by: Solomon, S., Qin, D.,Manning, M., Chen, Z., Marquis, M., Averyt, K., Tignor, M.,and Miller, H., Cambridge University Press, Cambridge and NewYork, 433–498, 2007.
Jiang, D., Wang, H., Ding, Z., Lang, X., and Drange, H.:Modeling the Middle Pliocene climate with a global atmo-spheric general circulation model, J. Geophy. Res., 110, D14107,doi:10.1029/2004JD005639, 2005.
Jost, A., Lunt, D., Kageyama, M., Abe-Ouchi, A., Peyron, O.,Valdes, P., and Ramstein, G.: High-resolution simulations of thelast glacial maximum climate over Europe: a solution to discrep-ancies with continental palaeoclimatic reconstructions?, Clim.Dynam., 24, 577–590, 2005.
Kageyama, M., Combourieu-Nebout, N., Sepulchre, P., Peyron, O.,Krinner, G., Ramstein, G., and Cazet, J.-P.: The Last GlacialMaximum and Heinrich Event 1 in terms of climate and vegeta-tion around the Alborean Sea: a preliminary model-data compar-ison, C. R. Geosci., 337, 983–992, 2005.
Kageyama, M., Laıne, A., Abe-Ouchi, A., Braconnot, P., Cortijo,E., Crucifix, M., de Vernal, A., Guiot, J., Hewitt, C., Kitoh, A.,
Kucera, M., Marti, O., Ohgaito, R., Otto-Bliesner, B., Peltier, W.,Rosell-Mele, A., Vettoretti, G., Weber, S., Yu, Y., and MARGOProject Members: Last Glacial Maximum temperatures overthe North Atlantic, Europe and Western Siberia: a comparisonbetween PMIP models, MARGO sea-surface temperatures andpollen-based reconstructions, Quaternary. Sci. Rev., 25, 2082–2102, 2006.
Kleidon, A.: The climate sensitivity to human appropriation ofvegetation productivity and its thermodynamic characterization,Global Planet. Change, 54, 109–127, 2006.
Krinner, G., Viovy, N., de Noblet-Ducoudre, N., Ogee, J., Polcher,J., Friedlingstein, P., Ciais, P., Sitch, S., and Prentice, I.:A dynamic global vegetation model for studies of the cou-pled atmosphere-biosphere system, Global Biogeochem. Cy., 19,GB1015, doi:10.1029/2003GB002199, 2005.
Kurschner, W., van der Burgh, J., Visscher, H., and Dilcher, D.:Oak leaves as biosensors of late Neogene and early Pleistocenepaleoatmospheric CO2 concentrations, Mar. Micropaleontol., 27,299–312, 1996.
Laıne, A., Kageyama, M., Salas-Melia, D., Ramstein, G., Planton,S., Denvil, S., and Tyteca, S.: An energetics study of winter-time Northern Hemisphere storm tracks under 4CO2 conditionsin two ocean-atmosphere coupled models, J. Climate, 22, 819–839, 2009.
Leroy, S., Wrenn, J. H., and Suc, J.-P.: Global setting to compara-tive charts of regional events, in: The Pliocene: Time of change,edited by: Wrenn, J. H., Suc, J.-P., and Leroy, S., American As-sociation of Stratigraphic Palynologists Foundation, 1–12, 1998.
Levis, S., Foley, J., and Pollard, D.: Large-scale vegetation feed-backs on a doubled CO2 climate, J. Climate, 13, 1313–1325,2000.
Li, L., Bozec, A., Somot, S., Beranger, K., Bouruet-Aubertot, P.,Sevault, F., and Crepon, M.: Regional atmospheric, marine pro-cesses and climate modelling, in: Mediterranean Climate Vari-ability, edited by: Lionello, P., Malanotte, P., and Boscolo, R.,Elsevier B. V., Amsterdam, The Netherlands, 373–397, 2006.
Li, L. and Conil, S.: Transient response of an atmospheric GCM toNorth Atlantic SST anomalies, J. Climate, 16, 3993–3998, 2003.
Lionello, P., Malanotte-Rizzoli, P., Alpert, P., Artale, V., Boscolo,R., Li, L., Luterbacher, J., May, W., Trigo, R., Tsimplis, M.,Ulbrich, U., and Xoplaki, E.: MedCLIVAR: Mediterranean CLI-mate VARiability, CLIVAR Exchanges, 11, 3–5, 2006.
Lunt, D., Foster, G., Haywood, A., and Stone, E.: Late PlioceneGreenland glaciation controlled by a decline in atmospheric CO2levels, Nature, 454, 1102–1106, 2008a.
Lunt, D., Haywood, A., Foster, G., and Stone, E.: The Arcticcryosphere in the Mid-Pliocene and the future, Philos. T. Roy.Soc. A, 367, 49–67, 2009.
Lunt, D., Valdes, P., Haywood, A., and Rutt, I.: Closure of thePanama Seaway during the Pliocene, implications for climateand Northern Hemisphere glaciation, Clim. Dynam., 30, 1–18,2008b.
Marti, O., Braconnot, P., Bellier, J., Benshila, R., Bony, S., Brock-mann, P., Cadule, P., Caubel, A., Denvil, S., Dufresne, J. L., Fair-head, L., Filiberti, M. A., Foujols, M. A., Fichefet, T., Friedling-stein, P., Goosse, H., Grandpeix, J. Y., Hourdin, F., Krinner, G.,Levy, C., Madec, G., Musat, I., de Noblet, N., Polcher, J., andTalandier, C.: The new IPSL climate system model: IPSL-CM4,Note du Pole de Modelisation 26, Institut Pierre Simon Laplace,
Clim. Past, 5, 585–606, 2009 www.clim-past.net/5/585/2009/
A. Jost et al.: Mid-Piacenzian warmth high resolution simulations 605
Paris, France, 84 pp., 2005.Meehl, G., Stocker, T., Collins, W., Friedlingstein, P., Gaye, A.,
Gregory, J., Kitoh, A., Knutti, R., Murphy, J., Noda, A., Raper,S., Watterson, I., Weaver, A., and Zhao, Z.-C.: Global climateprojections, in: Climate Change 2007: The Physical Science Ba-sis, Contribution of Working Group I to the Fourth AssessmentReport of the Intergovenmental Panel on Climate Change, editedby: Solomon, S., Qin, D., Manning, M., Chen, Z., Marquis, M.,Averyt, K., Tignor, M., and Miller, H., Cambridge UniversityPress, Cambridge and New York, 747–846, 2007.
Miguez-Macho, G., Fan, Y., Weaver, C., Walko, R., and Robock,A.: Incorporating water table dynamics in climate modeling:2. Formulation, validation, and soil moisture simulation, J. Geo-phys. Res., 112, D13108, doi:10.1029/2006JD008112, 2007.
Molnar, P. and Cane, M.: El Nino’s tropical climate and teleconnec-tions as a blue-print for pre-Ice Age climates, Paleoceanography,17, 1021, doi:10.1029/2001PA000663, 2002.
New, M., Hulme, M., and Jones, P.: Representing twentieth-centuryspace-time climate variability: I. Development of a 1961–90mean monthly climatology, J. Climate, 12, 829–856, 2002.
de Noblet, N.: Modelling late-Quaternary palaeoclimates andpalaeobiomes, in: Past and future rapid environmental changes:The spatial and evolutionary responses of terrestrial biota, editedby: Huntley, B., Cramer, W., Morgan, A., Prentice, H., andAllen, J., NATO ASI Series I 47, Springer-Verlag, Berlin Hei-delberg, Germany, 523 pp., 1997.
Pearson, P. and Palmer, M.: Atmospheric carbon dioxide concen-trations over the past 60 million years, Nature, 406, 695–699,2000.
Piao, S., Friedlingstein, P., Ciais, P., de Noblet-Ducoudre, N., Labat,D., and Zaehle, S.: Changes in climate and land use have a largerdirect impact than rising CO2 on global river runoff trends, P.Natl. Acad. Sci. USA, 104, 15242–15247, 2007.
Pinot, S., Ramstein, G., Harrison, S., Prentice, C., Guiot, J., Stute,M., and Joussaume, S.: Tropical paleoclimates at the Last GlacialMaximum: comparison of Paleoclimate Modeling Intercompari-son Project (PMIP simulations and paleodata, Clim. Dynam, 15,857–874, 1999.
Poore, R. and Sloan, L.: Climates and climate variability of thePliocene, Mar. Micropaleontol., 27, 1–2, 1996.
Ramstein, G., Kageyama, M., Guiot, J., Wu, H., Hely, C., Krinner,G., and Brewer, S.: How cold was Europe at the Last GlacialMaximum? A synthesis of the progress achieved since the firstPMIP model-data comparison, Clim. Past, 3, 331–339, 2007,http://www.clim-past.net/3/331/2007/.
Raymo, M., Grant, B., Horowitz, M., and Rau, G.: Mid-Pliocenewarmth: stronger greenhouse and stronger conveyor, Mar. Mi-cropaleontol., 27, 313–326, 1996.
Rind, D. and Chandler, M.: Increased ocean heat transports andwarmer climate, J. Geophys. Res., 96, 7437–7461, 1991.
Robinson, M., Dowsett, H., Dwyer, G., and Lawrence, K.: Reeval-uation of mid-Pliocene North Atlantic sea surface temperatures,Paleoceanography, 23, PA3213, doi:10.1029/2008PA001608,2008.
Robinson, M.: New quantitative evidence of extreme warmth in thePliocene Arctic, Stratigraphy, in press, 2009.
Salzmann, U., Haywood, A., and Lunt, D.: The past is a guide to thefuture? Comparing Middle Pliocene vegetation with predictedbiome distributions for the twenty-first century, Philos. T. Roy.
Soc. A, 367, 189–204, 2009.Salzmann, U., Haywood, A., Lunt, D., Valdes, P., and Hill, D.: A
new global biome reconstruction and data-model comparison forthe Middle Pliocene, Global Ecol. Biogeogr., 17, 432–447, 2008.
Sepulchre, P., Ramstein, G., Kageyama, M., Vanhaeren, M., Krin-ner, G., Sanchez-Goni, M. F., and d’Errico, F.: H4 abrupt eventand late Neanderthal presence in Iberia, Earth Planet. Sci. Lett.,258, 283–292, 2007.
Sitch, S., Smith, B., Prentice, C., Arneth, A., Bondeau, A., Cramer,W., Kaplan, J., Levis, S., Lucht, W., Sykes, M., Thonicke, K., andVenevsky, S.: Evaluation of ecosystem dynamics, plant geogra-phy and terrestrial carbon cycling in the LPJ dynamic vegetationmodel, Global Change Biol., 9, 161–185, 2003.
Sloan, L., Crowley, T. and Pollard, D.: Modeling of MiddlePliocene climate with the NCAR GENESIS general circulationmodel, Mar. Micropaleontol., 27, 51–61, 1996.
Somot, S., Sevault, F., Deque, M., and Crepon, M.: 21st cen-tury climate change scenario for the Mediterranean using a cou-pled atmosphere-ocean regional climate model, Global Planet.Change, 63, 112–126, 2008.
St. John, K. E. K. and Krissek, L. A.: The Late Miocene to Pleis-tocene ice-rafting history of southeast Greenland, Boreas, 31,28–35, 2002.
Sterling, S. and Ducharne, A.: Comprehensive data set of globalland cover change for land surface model applications, GlobalBiogeochem. Cy., 22, GB3017, doi:10.1029/2007GB002959,2008.
Suc, J.-P.: Distribution latitudinale etetagement des associa-tions vegetales au Cenozoıque superieur dans l’aire ouest-mediterraneenne, Bull. Soc. Geol. France, 8, 541–550, 1989.
Suc, J.-P. and Cravatte, J.: Etude palynologique du Pliocene de Cat-alogne (Nord-est de l’Espagne), Palobiol. Cont., 13, 1–31, 1982.
Suc, J.-P., Bertini, A., Combourieu-Nebout, N., Diniz, F., Leroy, S.,Russo-Ermolli, E., Zheng, Z., Bessais, E., and Ferrier, J.: Struc-ture of West Mediterranean and climate since 5.3 Ma, Acta Zoo-logica Cracovia, 38, 3–16, 1995a.
Suc, J.-P., Diniz, F., Leroy, S., Poumot, C., Bertini, A., Dupont,L., Clet, M., Bessais, E., Zheng, Z., Fauquette, S., and Fer-rier, J.: Zanclean (∼Brunssumian) to early Piacenzian (∼early-midlle Reuverian) climate from 4◦ to 54◦ north latitude (WestAfrica, West Europe and West Mediterranean areas), Meded. Ri-jks Geol. Dienst, 52, 43–56, 1995b.
Suc, J.-P., Fauquette, S., Bessedik, M., Bertini, A., Zheng, Z., Clau-zon, G., Suballyova, D., Diniz, F., Quezel, P., Feddi, N., Clet,M., Bessais, E., Bachiri Taoufiq, N., Meon, H., and Combourieu-Nebout, N.: Neogene vegetation changes in West European andWest circum-Mediterranean areas, in: Hominid Evolution andClimate in Europe, 1, Climatic and Environmental Change in theNeogene of Europe, edited by: Agusti, J., Rook, L., and An-drews, P., Cambridge University Press, Cambridge, UK, 370–385, 1999.
Taylor, K., Williamson, D., and Zwiers, F.: AMIP II sea surfacetemperature and sea ice concentration boundary conditions,Lawrence Livermore National laboratory, Open file report,http://www-pcmdi.llnl.gov/projects/amip/AMIP2EXPDSN/BCS/amip2bcs.php, 2001.
van Dam, J. A.: Geographic and temporal patterns in the late Neo-gene (12-3 Ma) aridification of Europe: The use of small mam-mals as paleoprecipitation proxies, Palaeogeogr. Palaeocl., 238,
www.clim-past.net/5/585/2009/ Clim. Past, 5, 585–606, 2009
606 A. Jost et al.: Mid-Piacenzian warmth high resolution simulations
190–218, 2006.Wang, C. W.: The Forest of China (with a survey of grassland and
desert vegetation), Maria Moors Cabot Foundation, Harvard Uni-versity, 313 pp., 1961.
Williams, M., Haywood, A., Hillenbrand, C., and Wilkinson, I.:Efficacy ofδ18O data from Pliocene planktonic foraminifer cal-cite for spatial sea surface temperature reconstruction: compari-son with a fully coupled ocean-atmosphere GCM and fossil as-semblage data for the mid-Pliocene, Geol. Mag., 142, 399–417,2005.
Wu, H., Guiot, J., Brewer, S., and Guo, Z.: Climatic changesin Eurasia and Africa at the last glacial maximum and mid-Holocene: reconstruction from pollen data using inverse vege-tation modelling, Clim. Dynam., 29, 211–229, 2007.
Zachos, J., Pagani, M., Sloan, L., Thomas, E., and Billups, K.:Trends, rhythms, and aberrations in global climate 65 Ma topresent, Science, 292, 686–693, 2001.
Zachos, J., Dickens, G., and Zeebe, R.: An early Cenozoic perspec-tive on greenhouse warming and carbon-cycle dynamics, Nature,451, 279–283, 2008.
Zagwijn, W.: Aspects of the Pliocene and early Pleistocene veg-etation in the Netherlands, Mededelingen van de GeologischeStichting, 3, 1–78, 1960.
Zheng, Z.: Vegetations et climats neogenes des Alpes maritimesfranco-italiennes d’apres les donnees de l’analyse palynologique,Paleobiol. Cont., 17, 217–244, 1990.
Zhou, T.-J. and Li, Z.-X.: Simulation of the East Asian SummerMonsoon using a variable resolution atmopsheric GCM, Clim.Dynam., 19, 167–180, 2002.
Clim. Past, 5, 585–606, 2009 www.clim-past.net/5/585/2009/