high quality protein sequence alignment by combining
TRANSCRIPT

Teichert et al. BMC Bioinformatics 2010, 11:251http://www.biomedcentral.com/1471-2105/11/251
Open AccessR E S E A R C H A R T I C L E
Research articleHigh quality protein sequence alignment by combining structural profile prediction and profile alignment using SABERTOOTHFlorian Teichert1,2, Jonas Minning1, Ugo Bastolla*2 and Markus Porto*1,3
AbstractBackground: Protein alignments are an essential tool for many bioinformatics analyses. While sequence alignments are accurate for proteins of high sequence similarity, they become unreliable as they approach the so-called 'twilight zone' where sequence similarity gets indistinguishable from random. For such distant pairs, structure alignment is of much better quality. Nevertheless, sequence alignment is the only choice in the majority of cases where structural data is not available. This situation demands development of methods that extend the applicability of accurate sequence alignment to distantly related proteins.
Results: We develop a sequence alignment method that combines the prediction of a structural profile based on the protein's sequence with the alignment of that profile using our recently published alignment tool SABERTOOTH. In particular, we predict the contact vector of protein structures using an artificial neural network based on position-specific scoring matrices generated by PSI-BLAST and align these predicted contact vectors. The resulting sequence alignments are assessed using two different tests: First, we assess the alignment quality by measuring the derived structural similarity for cases in which structures are available. In a second test, we quantify the ability of the significance score of the alignments to recognize structural and evolutionary relationships. As a benchmark we use a representative set of the SCOP (structural classification of proteins) database, with similarities ranging from closely related proteins at SCOP family level, to very distantly related proteins at SCOP fold level. Comparing these results with some prominent sequence alignment tools, we find that SABERTOOTH produces sequence alignments of better quality than those of Clustal W, T-Coffee, MUSCLE, and PSI-BLAST. HHpred, one of the most sophisticated and computationally expensive tools available, outperforms our alignment algorithm at family and superfamily levels, while the use of SABERTOOTH is advantageous for alignments at fold level. Our alignment scheme will profit from future improvements of structural profiles prediction.
Conclusions: We present the automatic sequence alignment tool SABERTOOTH that computes pairwise sequence alignments of very high quality. SABERTOOTH is especially advantageous when applied to alignments of remotely related proteins. The source code is available at http://www.fkp.tu-darmstadt.de/sabertooth_project/, free for academic users upon request.
BackgroundProtein alignment tools are key in many protein scienceapplications. For very closely related proteins the align-ment problem can easily be solved as a fuzzy string
search in the sequences. However, with growing evolu-tionary distance more sophisticated techniques have tobe applied to detect similarities. At about 25% sequenceidentity, when the alignment problem enters the so-called'twilight zone' [1], related and unrelated proteins cannotbe distinguished reliably by sequence based measures. Acommonly applied strategy for this regime consists inexploiting not only the sequences that are to be aligned,but also evolutionary background information extractedfrom large sequence databases. This is achieved through
* Correspondence: [email protected], [email protected] Centro de Biología Molecular "Severo Ochoa", (CSIC-UAM), Cantoblanco, 28049 Madrid, Spain1 Institut für Festkörperphysik, Technische Universität Darmstadt, Hochschulstr. 6-8, 64289 Darmstadt, GermanyFull list of author information is available at the end of the article
BioMed Central© 2010 Teichert et al; licensee BioMed Central Ltd. This is an Open Access article distributed under the terms of the Creative CommonsAttribution License (http://creativecommons.org/licenses/by/2.0), which permits unrestricted use, distribution, and reproduction inany medium, provided the original work is properly cited.

Teichert et al. BMC Bioinformatics 2010, 11:251http://www.biomedcentral.com/1471-2105/11/251
Page 2 of 14
analysis of multiple alignments from which one canobtain a suitable statistical description of the correspond-ing protein family. Especially for very distantly relatedsequences, the site-specific amino acid profiles or posi-tion-specific scoring matrices (PSSMs) obtained in thisway increase the reliability of alignments by taking intoaccount their evolutionary context.
Since protein structure evolves much more slowly thansequence, protein structure alignments are usually muchmore accurate for distantly related proteins and, hence,preferable if structural data is available. However, for themajority of cases only sequence information is available.A possible strategy for such cases would be to predict theunknown structures from their sequences and to performa structure alignment using these predictions. Unfortu-nately, the accurate prediction of 3D coordinates is ingeneral not possible yet and results are limited in quality[2]. Nevertheless, coarser descriptions of the proteinstructure than the one based on coordinates give suffi-cient information for many applications, and a number ofalgorithms exists that allow predicting structural charac-teristics of proteins such as secondary structure, residue-wise contact order, or solvent accessibility, to name but afew. Here we consider a reduced description of proteinstructures based on the contact vector (CV), whose i-thcomponent represents the number of sites with whichsite i is in contact. The CV is strongly correlated withmore complex descriptions such as solvent accessibilityand effective connectivity of the contact matrix. Weshowed in previous work [3,4], that the CV, despite givinga very simplified description of a protein structure, is suf-ficient for obtaining state-of-the-art protein structurealignments.
Results and DiscussionWe previously developed the SABERTOOTH algorithmfor performing protein structure alignments by aligningprofiles that represent the protein structure [3,4]. In thiswork, we apply this algorithm to aligning structural pro-files predicted from the protein sequence alone, therebyobtaining protein sequence alignments.
We adopted a structural profile based on the contactvector (CV) described above, which produces structuralalignments of high quality and is simple to predict. Con-tact vector prediction is an active field of research: Bas-tolla et al. [5] described a very simple prediction methodthat defines typical hydrophobicity values per amino acidresidue type assuming independent sites. The resultinghydrophobicities can be shown to correlate with typicalCV components per residue type. A more elaborateapproach is discussed by Vullo et al. [6] who employ anartificial neural network (ANN) to include correlationsbetween amino acid sites along the sequence. An alterna-tive approach to consider these correlations is described
by Kinjo and Nishikawa [7] who run PSI-BLAST to com-pute position-specific scoring matrices (PSSMs) that arethen input into a so-called critical random network(CRNPRED). The prediction scheme used here follows anidea introduced by Jones [8] to predict secondary struc-ture propensities using an ANN with protein familyinformation encoded in PSSMs. We modify this approachto predict the contact vector from protein sequence (seeMethods).
The alignments produced by our algorithm followingthe strategy described above and detailed in the Methodssection were then compared with some of the most com-monly used sequence alignments programs, which weclassified in three main classes: (1) Programs that take asonly input the two sequences to be aligned; (2) Programsthat take an additional input in form of a large database ofknown protein sequences and extract from it two familiesof proteins evolutionarily related with the query proteins;(3) Programs that, in addition to taking a sequence data-base as input, build a probabilistic description of the pro-tein families as a Hidden Markov model (HMM). Asreference tools of the first class we chose the programsClustal W [9], MUSCLE [10], and T-Coffee [11]. Thesetools are commonly used to compute multiple sequencealignments. In the present work, we assess their perfor-mances in building pairwise alignments, since we com-pare them with our new pairwise algorithm. Theconstruction of all-vs-all pairwise alignments is alwaysthe first step in building multiple alignments, and theaccuracy of this first step strongly influences the finalresult. We expect that the quality achieved in the pairwisestep will also benefit multiple alignments based on it. Inaddition, the construction of the multiple alignmentdepends on the choice of the set of sequences to bealigned. Influences of this set of sequences have to beruled out in order to compare to the pairwise SABER-TOOTH alignments. PSI-BLAST [12] was selected as arepresentative of the second class of programs, whichmake use of sequence databases to collect a large set ofevolutionarily related proteins for each of the querysequences. SABERTOOTH and PSI-BLAST use the sameinput data, since SABERTOOTH uses PSSMs derived byPSI-BLAST as alignment parameters as well as for pre-dicting the structural profiles, permitting a fair compari-son between the two programs. As a representative of thethird class of programs we considered the algorithmHHpred [13], which also uses as input the set of evolu-tionarily related proteins obtained through PSI-BLASTsearch and obtains from them a powerful probabilisticdescription of the protein family in terms of a HiddenMarkov Model.
To compare the quality of sequence alignments, weadopted a new method that scores the structure similarityderived from alignments of proteins with known struc-

Teichert et al. BMC Bioinformatics 2010, 11:251http://www.biomedcentral.com/1471-2105/11/251
Page 3 of 14
ture. In fact, measures of sequence similarity are notmeaningful for distantly related proteins, and their use inthe assessment could lead to circular results, since manysequence alignment algorithms are based on the optimi-zation of sequence similarity. Moreover, for many practi-cal applications, such as homology modelling andfunction prediction, sequence alignments are used toinfer a structure alignment, which is the real aim. Thesearguments have motivated the practice to assess the qual-ity of sequence alignments by using structure alignmentsas a 'gold standard', either computed by a structure align-ment tool or taken from databases like BAliBase [14] orHOMSTRAD [15]. However, the problem to find theoptimal structure alignment for a pair of proteins has nounique solution [16]. Existing algorithms differ in howthey address this problem and have different biases thatwould inevitably influence the assessment based uponthem. Therefore, the only way to obtain an unbiasedassessment of alignment accuracy is to renounce usingany supposed gold standard. However, this does notmean that we also have to renounce applying powerfulstructure similarity scores. Here we directly computestructure similarity scores from the sequence alignment.For instance, the optimal spatial superimposition corre-sponding to a given alignment can be obtained throughthe MaxSub algorithm [17], and the contact overlap canbe directly computed from the alignment, without havingto optimally superimpose the structures. In this way, wecan objectively quantify the alignment quality withoutthe need of a gold standard. As we show below, the quali-tative results of a large scale comparison are quite clear,and they do not change when we use different structuresimilarity scores.
As an objective measure of structural similarity weadopt the contact overlap. We find this measure prefera-ble to others because of three reasons: (1) It does notrequire to compute a structure superimposition, avoidingthe influence of the choices necessary for defining anoptimal rotation matrix; (2) It effectively weights morethe sites that belong to the protein core due to the largernumber of contacts found here; (3) In the important casesof conformation changes in which one subdomain of theprotein moves with respect to the other one, for whichsuperimposition-based measures underestimate thestructural relatedness, the contact overlap only penalizesa small number of inter-subdomains contacts that do notmatch in the two structures, while superimposition-based scores also penalize intra-subdomain contacts. Wealso consider as additional similarity measure the TM-score [18], a well-known structural similarity measurebased on structure superimposition. It is reassuring thatthe TM-score supports the results of the contact overlap.For comparative purposes, we also consider the sequence
similarity measure. The definitions of these measures aregiven in the Methods section.
In Fig. 1, we report the structural quality of over 15thousand alignments assessed through the similaritymeasures described above. As a reference set we use arepresentative set of pairs of related proteins from theASTRAL40 database of structural domains [19]. These
Figure 1 Comparison of Alignment Accuracy in Terms of Contact Overlap, TM-score, and Sequence similarity. Comparison of align-ment accuracy measured in contact overlap, TM-score, and sequence similarity for SABERTOOTH (red), Clustal W (green), T-Coffee (brown), MUSCLE (magenta), PSI-BLAST on BLOSUM62 (blue), and HHpred (cy-an). The black curves mark the 'best of' set. All alignments are sorted by increasing contact overlap of the 'best of' set from left to right. The ab-scissa is the resulting alignment number and the ordinates indicate the respective similarity measure with a running average of window size 100 applied to improve readability. SABERTOOTH structure alignment (orange) is added for illustrative purposes, but it is not included in the comparison. The SCOP level labels shown do not represent sharp bor-ders, since the real assignments can overlap in this depiction.
fold superfamily family
�a�
0 5000 10000 150000.0
0.2
0.4
0.6
0.8
AAAqcontacto
verlap
ZZZq
�b�
0 5000 10000 15000
0.2
0.4
0.6
0.8
AAAqTM�scoreZZZq
�c�
0 5000 10000 15000
0.0
0.5
1.0
alignment number
AAAqsequence
similarityZZZq
Teichert et al. BMC Bioinformatics 2010, 11:251http://www.biomedcentral.com/1471-2105/11/251
Page 4 of 14
are challenging alignments below the threshold of 40%sequence identity, ranging from the family level of strongevolutionary and probable functional relationships,through the superfamily level of more elusive evolution-ary relationships, to the fold level of proteins structurallybut not necessarily evolutionarily related. Curves in theplot depict the similarity measures of the alignmentsobtained through SABERTOOTH (red) and through thereference tools. For each pair of proteins, we select thealignment with largest contact overlap produced by allreference tools ('best of ' set) and use the correspondingcontact overlap to rank the alignments from difficult toeasy ones. Therefore, the left part of the plots corre-sponds to distantly related pairs of proteins and the rightpart corresponds to closely related pairs. Loosely speak-ing, we call the left, middle and right part of the plots the"fold", "superfamily" and "family" range of similarity,respectively. Nevertheless, not all of the alignmentsincluded in each range belong to the correspondingSCOP level. For purposes of comparison, we also repre-sent the best similarity measure produced by all referencetools ('best of ' set) and the one produced throughSABERTOOTH structure alignment by making directuse of structural information. The ranking of the align-ment algorithms is consistent over the three ranges ofsimilarity, with important differences discussed below,and using both structure similarity measures, as one cansee comparing the top and middle plot of Fig. 1. In partic-ular, PSI-BLAST produces the least accurate alignmentsexcept in the family region, where it is comparable orslightly better than the three references Clustal W, T-Cof-fee, and MUSCLE. The decrease of contact overlap andTM-score for PSI-BLAST is partly an artifact of thereduced percentage of aligned residues that result fromthe fact that PSI-BLAST outputs only the aligned seg-ments that it considers relevant. The use of different sub-
stitution matrices with PSI-BLAST does not change thispicture, in fact, we found only very slightly differentresults for BLOSUM45, BLOSUM62, and BLOSUM80, sothat in the plots we only show results based onBLOSUM62. The three references Clustal W, T-Coffee,and MUSCLE are very similar in quality over the wholerange of structural similarity, and their placing in theranking is just above PSI-BLAST. Then we find SABER-TOOTH, whose sequence similarity scores are betterthan those of the above mentioned tools except for veryhigh similarity, where basically all tools achieve a similarquality. HHpred is unambiguously identified as the toolproducing the best quality alignments over the wholerelatedness range, and it even approaches the accuracy ofstructure alignment algorithms. One sees that the bestreference almost exactly coincides with the HHpredresults. Nevertheless, for very distantly related align-ments SABERTOOTH reaches a quality even higher thanthat of HHpred. The mean values of the structural qualitymeasures for alignments in the family, superfamily andfold range are reported in Table 1 for all programs. Thelists of the alignments used for quality assessments atSCOP family, superfamily and fold level are reported inthe Additional file 1.
In the bottom plot in Fig. 1 we show results of sequencesimilarity, maintaining the same colouring scheme of thetools and the same ordering of the alignments as in theplots above. The sequence similarity values agree with thecontact overlap and the TM-score, in the sense that, foreach tool, alignments endowed with larger structure sim-ilarity also display higher sequence similarity, asexpected. However, the ranking of the tools is now com-pletely different. The structure alignment provides thelowest sequence similarity, and the two algorithms thatyield the highest structure similarity, namely HHpred andSABERTOOTH, output the lowest sequence similarity
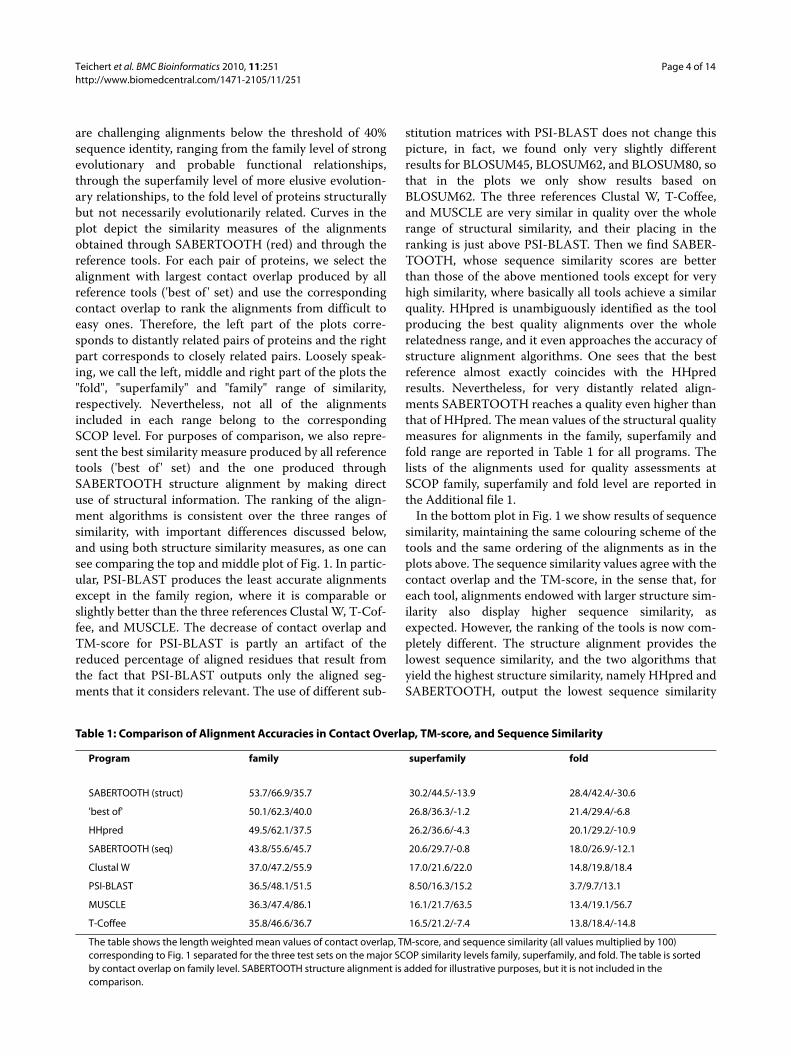
Table 1: Comparison of Alignment Accuracies in Contact Overlap, TM-score, and Sequence Similarity
Program family superfamily fold
SABERTOOTH (struct) 53.7/66.9/35.7 30.2/44.5/-13.9 28.4/42.4/-30.6
'best of' 50.1/62.3/40.0 26.8/36.3/-1.2 21.4/29.4/-6.8
HHpred 49.5/62.1/37.5 26.2/36.6/-4.3 20.1/29.2/-10.9
SABERTOOTH (seq) 43.8/55.6/45.7 20.6/29.7/-0.8 18.0/26.9/-12.1
Clustal W 37.0/47.2/55.9 17.0/21.6/22.0 14.8/19.8/18.4
PSI-BLAST 36.5/48.1/51.5 8.50/16.3/15.2 3.7/9.7/13.1
MUSCLE 36.3/47.4/86.1 16.1/21.7/63.5 13.4/19.1/56.7
T-Coffee 35.8/46.6/36.7 16.5/21.2/-7.4 13.8/18.4/-14.8
The table shows the length weighted mean values of contact overlap, TM-score, and sequence similarity (all values multiplied by 100) corresponding to Fig. 1 separated for the three test sets on the major SCOP similarity levels family, superfamily, and fold. The table is sorted by contact overlap on family level. SABERTOOTH structure alignment is added for illustrative purposes, but it is not included in the comparison.

Teichert et al. BMC Bioinformatics 2010, 11:251http://www.biomedcentral.com/1471-2105/11/251
Page 5 of 14
measures, together with T-Coffee. The three tools thatshow nearly identical performances in matters of contactoverlap display very different sequence similarities. MUS-CLE finds unrealistically high sequence similarity valuesstill for very distantly related pairs deep in the fold levelregion. Also Clustal W and PSI-BLAST assign positivevalues in this region, in contradiction to SCOP's defini-tion of the fold level. Surprisingly, HHpred's sequencesimilarity values slightly increase again for very low simi-larities which might reveal a tendency to over-optimisa-tion of spurious sequence similarities in this area.
Comparing the results in matters of sequence similarityto those found with SABERTOOTH structure alignment[3,4] we can see that SABERTOOTH, HHpred and T-Coffee assign more realistic sequence similarity valuesthan the other tools that cross zero sequence similarity inthe early superfamily area. This analysis points out thatall tools tend to overestimate sequence similarity withrespect to structure alignment, whose quality is unambig-uously better as measured in terms of contact overlap orTM-score and systematically lower when measured interms of sequence similarity. This behaviour reveals aninherent bias of sequence alignment tools in this respect.This tendency is even more pronounced considering thatthe structure alignment of SABERTOOTH yields highersequence similarities than other well known alignmenttools [20].
As a second test, we evaluate the ability of the align-ment programs to detect relevant relationships betweenthe aligned proteins based on the significance measuresthey output. This is an important application, sincesequence alignments are often used to predict whethertwo proteins share a similar function, have a close evolu-tionary relationship, or a similar structure, so that e.g.one can be used as a template for the other. As a test set ofrelevant relationships, we again consider the SCOP clas-sification at family, superfamily and fold level. Althoughthe SCOP classification is not fully consistent with quan-titative measures of structural similarity, it provides alarge number of mostly valid relationships that constitutea suitable benchmark.
The results of this analysis mostly agree with the firsttest, as shown in the ROC plots in Fig. 2. The larger thearea under the curve of the ROC plot, the better the abil-ity of the corresponding significance score to identifyrelationships at the given level. The structure alignmentshave the best performance at all levels, with their advan-tage with respect to sequence alignment growing fromthe family level to the fold level. However, not even struc-ture similarity is perfect at detecting SCOP relationships,which is due to the fact that SCOP is an expert classifica-tion not entirely consistent with structure similarity mea-sures. Of the sequence aligners, the best performances
are once again obtained by HHpred at superfamily level,with SABERTOOTH's significance score consistentlyperforming second-best and PSI-BLAST being the thirdbest, despite its structure similarity measure being lowerthan that of Clustal W, MUSCLE and T-Coffee. However,SABERTOOTH gets almost equal to HHpred at familylevel, and performs slightly better than it at detectingrelationships at fold level, consistent with SABER-TOOTH's improved structure similarity in this range.This is consistent with the insight that alignment qualityas assessed from structure and on evolutionary relation-ships are intimately related. The output sequence similar-ity, in contrast to that, is unrelated with the ability todetect significant evolutionary relationships. We alsoshow in Fig. 2, right panels, the ROC plots in log-linearscale in order to focus on the region of very low false pos-itive rate. It can be seen that, surprisingly, for the familyand the superfamily level the significance scores derivedfrom structure alignments have a lower true positive rateat very low false positive rate than those derived fromsequence alignments. Numerical values for the areaunder curve in the ROC plots can be found in Table 2.The list of the 123,753 alignments used for significancescore assessment is reported in Additional file 2.
Finally, we assessed the accuracy of the prediction of
the structural profile that SABERTOOTH uses for
sequence alignment. The predicted profile was compared
with the profile measured over a test set of 9420 protein
domains, disjoint from the training set used. For each
domain, we measured the correlation between the pre-
dicted and the measured contact vector, finding a length
weighted correlation coefficient of r(CV, predCV) = 0.72.
This comparison is in part affected by the fact that single
chains and single domains are considered in the test set,
so that the observed number of contacts does not include
inter-chain and inter-domain contacts, thus underesti-
mating the observed number of contacts with respect to
the case in which the whole multi-chain protein is consid-
ered. We also measured the variance of the predicted
contact vector for each domain, and compared it with the
observed variance. The predicted variance is systemati-
cally underestimated and not very well predicted, as indi-
cated by the weak correlation coefficient r(varCV,
varpredCV) = 0.385. This suggests that it is still possible to
improve the performance of SABERTOOTH by improv-

Teichert et al. BMC Bioinformatics 2010, 11:251http://www.biomedcentral.com/1471-2105/11/251
Page 6 of 14
Figure 2 Comparison of Significance Scores' Compliance with SCOP. ROC plots for prediction of SCOP fold, superfamily and family relationships using the significance scores output by different programs. In the left panels the ROC plots are shown in standard linear scale, in the right panels the ROC plot are shown in log-linear scale in order to better appreciate the behaviour at low false positive rate. The colour code is as follows: SABERTOOTH (red), the thick line refers to the rPSSM,B62 based Z-score, while the thin line is relative to the seqSimB62 based Z-score, Clustal W (green), T-Coffee (brown), PSI-BLAST on BLOSUM62 (blue), and HHpred (cyan). SABERTOOTH structure alignment (orange) is added for illustrative purposes, but it is not included in the comparison.
�10 �5 0
0.0
5
10
15
20
1.0�10 �5 0
true
positiv
erate
SCOP fold
0.0 0.2 0.4 0.6 0.8 1.0
0.0
0.2
0.4
0.6
0.8
1.00.0 0.2 0.4 0.6 0.8 1.0
true
positiv
erate
�10 �5 0
0.0
5
10
15
20
1.0�10 �5 0
true
positiv
erate
SCOP superfamily
0.0 0.2 0.4 0.6 0.8 1.0
0.0
0.2
0.4
0.6
0.8
1.00.0 0.2 0.4 0.6 0.8 1.0
true
positiv
erate
�10 �5 0
0.0
5
10
15
20
1.0�10 �5 0
ln�false positive rate�
true
positiv
erate
SCOP family
0.0 0.2 0.4 0.6 0.8 1.0
0.0
0.2
0.4
0.6
0.8
1.00.0 0.2 0.4 0.6 0.8 1.0
false positive rate
true
positiv
erate

Teichert et al. BMC Bioinformatics 2010, 11:251http://www.biomedcentral.com/1471-2105/11/251
Page 7 of 14
ing the prediction of the contact vector. The quantity rel-
evant for the alignment algorithm is the penalty that has
to be paid for aligning the observed and predicted contact
vector, (see Methods). We
measured this quantity for each domain in the test set,
and plotted it versus chain length in Fig. 3. Each point in
the plot represents a protein domain from the test set.
One can see that the penalties are low and that they are
almost uncorrelated with chain length.
ConclusionsThe SABERTOOTH algorithm can align vectorial repre-sentations of protein structures. This was first applied tocases in which the protein structures are known, so thatthe algorithm produces a structure alignment. In thepresent paper, we apply the same algorithm to aligningvectorial representations predicted based on sequencealone, obtaining high quality sequence alignments. Thisnew approach to sequence alignment is made possiblebecause we adopt a very simple structural representation,the contact vector, which can be predicted relatively eas-ily based on sequence, and it presents three main advan-tages: First, the predicted contact vectors are expected tocapture structural features that are more conserved inevolution than the sequence itself, which leads to anincreased sensitivity when comparing remotely relatedproteins. Second, we perform sequence alignment byaligning the same structural profiles that we adopt forstructure alignment, which enables us to treat structureand sequence alignment with the same formalism and thesame algorithm. Third, sequence alignment quality isexpected to further improve through improvements inthe profile prediction scheme and adding other types ofstructure description such as secondary structure. As acaveat, we warn that the application of SABERTOOTHshould be limited to proteins predicted to be globular,since the strategy that we apply is not suitable for thealignment of disordered proteins.
Our results show that the approach to combine struc-tural profile prediction from sequence with our genericalignment program SABERTOOTH leads to sequencealignment quality better than those of most widely usedalgorithms we compare with, with the exception ofHHpred, which shows the best performance but is alsocomputationally more expensive than SABERTOOTH. Itis interesting to notice that SABERTOOTH shows
c ci i
pobserved predicted aligne−
Table 2: Comparison of the Compliance of Significance Scores with the SCOP Classification
Program family superfamily fold
SABERTOOTH (struct) 96.85 91.54 90.29
SABERTOOTH (seq) 95.05 85.06 79.04
HHpred 94.84 89.55 75.69
PSI-BLAST B62 93.22 81.32 68.99
PSI-BLAST B80 92.53 81.88 69.74
PSI-BLAST B45 91.64 80.70 69.21
SABERTOOTH (seq/seqSim) 89.96 76.16 64.61
Clustal W 75.79 60.52 47.96
T-Coffee 68.01 52.87 47.65
The table shows the area under curve (AUC) in percentage for all programs and SCOP levels shown in Fig. 2, sorted by the first column. For 'SABERTOOTH (seq/seqSim)' significance is measured using the less accurate seqSim instead of the PSSM score, data is added for illustration. SABERTOOTH structure alignment is added for illustrative purposes, but it is not included in the comparison.
Figure 3 Contact Vector Prediction Quality. The contact vector pre-
diction quality is shown, plotting the penalty for aligning the corre-sponding observed contact vectors,
, which is relevant
for the alignment algorithm, versus chain length. The figure shows a dot for each domain in the ASTRAL40 set of 9420 protein domains. The correlation of this quantity with chain length r = 0.0516 is rather weak.
200 400 600 800 1000 1200
0.1
0.2
0.3
0.4
0.5
0.6
chain length
d�c,cp
red�
d N c ci ii
N p( , ) /c c pred pred aligne= −=∑1
1
Teichert et al. BMC Bioinformatics 2010, 11:251http://www.biomedcentral.com/1471-2105/11/251
Page 8 of 14
slightly better quality than HHpred for aligning very dis-tantly related pairs, a difficult and important task for thefield of homology modelling. Therefore, the use ofSABERTOOTH is anticipated to be advantageous at leastfor these difficult alignments, whereas for less distantalignments users should balance the better quality ofHHpred with its heavier computational burden. Theseimproved performances for distantly related alignmentscan exploit the fact that protein structure is more con-served in evolution than protein sequence, and that thealignment algorithm and parameters used were designedand trained to align contact vectors derived from coordi-nates. This reduces the bias to overemphasize sequencesimilarity, which tends to become insignificant at largeevolutionary distance, and which is overestimated bymost other sequence alignment algorithms. In fact, com-paring the quality of the structural similarity measure andthe sequence similarity measure for various sequencealigners, we see that the alignment algorithms that outputthe highest sequence similarity in the region of distantlyrelated proteins also tend to produce the worst results interms of structure similarity. This tendency is particularlyclear when structural aligners are included in the com-parison. Moreover, three reference methods output align-ments that are of very similar quality as assessed throughtheir structural similarity score, but their sequence simi-larity scores yield very different values. This implies thatabsolute sequence similarity values depend strongly onthe algorithm used and are therefore not very informativefor quantifying the relatedness of distantly related pro-teins. Consistently, the performances of these algorithmsfor recognising distant evolutionary or structural rela-tionships are comparable or even worse than random, asthe ROC analysis shows. This suggests that sequencesimilarity values output by sequence alignment programsare not very meaningful for distantly related proteins, andthey are not comparable between different programs.
The improved alignment accuracy has a cost in compu-tational complexity. The runtime of our alignment rou-tine cannot compete with highly optimized tools evenwhen we pre-compute the profile predictions. While theruntime of the neural network for the prediction of theprofiles can be neglected, the computation of the PSSMby PSI-BLAST is quite lengthy, heavily depending on thenumber of amino acids in the query sequence, PSI-BLAST parameters, and the sequence database used. Theruntime of the alignment routine with pre-computedprofiles takes approximately as long as the fastest struc-ture alignment tools existing today. Including the compu-tation of the profiles, SABERTOOTH and PSI-BLAST arecomparable in computation time, while HHpred is aboutthree times slower due to the larger number of iterationsused to compute the PSI-BLAST PSSMs that also underly
HHpred's alignments. Taking accuracy and computationtime into account, we envisage the application of SABER-TOOTH to studies in which a large number of sequencealignments have to be performed, so that HHpred andsimilar methods would be too costly, but high accuracy isnevertheless required, and to studies that deal with thecomparison of very distantly related proteins. Further-more, there is still room for improving SABERTOOTH intwo directions. First, it is possible to improve the qualityof the contact vector predictions. If these were perfect,the quality of the produced alignments would be compa-rable to those obtained with HHpred. Second, it is possi-ble to consider structural information such as predictedsecondary structure. Finally, SABERTOOTH facilitatesanalyses that make use of different types of alignments,since the same program can be used not only forsequence alignment but also for structure alignment [4]and sequence-to-structure alignment without changes.The latter application will be treated in a later publica-tion.
MethodsStructural Representation
In this work, we use the contact vector as
structural representation of the protein, where N is the
length of the protein sequence, and the contact matrix Cij
is a binary symmetric matrix with components equal to
one if the corresponding amino acids are in contact in the
3D structure and zero otherwise. Therefore, the contact
vector counts the number of contacts that site i has with
all other sites in the protein. For convenience, the struc-
tural profile that we align consist of the normalized con-
tact vector ci, defined as
where 7vi8 = 7ivi/N, so that its average value is one forall proteins.
Here we define a contact if the Cα atoms of residues iand j are closer than dth = 17 Å Pairs of sites ij with |i - j| <3 correspond to non-informative contacts, and their Cijare explicitly set to zero. These parameters were selectedbecause their performances are close to optimal for struc-tural alignments [4]. The normalized contact vector'scomponent ci represents the contact density or connec-tivity of amino acid i within the structure. For our pur-pose here, we aim to predict the contact vector using an
v Ci ijj
N= =∑ 1
cvivi
i = (1)

Teichert et al. BMC Bioinformatics 2010, 11:251http://www.biomedcentral.com/1471-2105/11/251
Page 9 of 14
artificial neural network approach. The predictionscheme is discussed in more detail below.
SABERTOOTH Alignment AlgorithmThe algorithm minimizes a penalty function based oncommonly used substitution penalties as well as insertionand extension of gaps. The alignment of two amino acidsis penalized by the difference of the sites' structuraldescriptors, plus a contribution for amino acid substitu-tion. Opening gaps is penalized by a term that dependson the components of the structural vector betweenwhich the chain has to be 'broken', while extending a gapis modelled by summing over all components oppositethat gap. The algorithm, the penalty function, and param-eters to perform sequence alignments are identical tothose used already for structure alignments before [3,4].
All possible alignments output by SABERTOOTH canbe created by inserting an arbitrary number of gaps ofarbitrary lengths into one or the other sequence in thealignment. In this way the sequences stay intact and repe-tition, mirroring, or exchange of fragments are not per-mitted. All alignments complying with this definition canbe displayed as paths through an alignment matrix Aij,analogous in shape to a dot matrix, that start in the toprow (or left column) and end in the right column (or bot-tom row). In the steps though Aij, moving to the right(down) inserts or extends a gap in sequence 1 (sequence2) while moving right-down in a diagonal step depictsalignment of the respective amino acids. A penalty isadded if amino acids of different connectivities arealigned, i.e. component values of the contact vector, and/or different amino acid residue types, and for the inser-tion or extension of gaps. The penalty function is dividedinto four terms that depend on the contact vectors ci andcj, and the protein sequences Ai, with Ai one of the twentynatural amino acids types.
Aligned components of the structural profiles, corre-
sponding to position i (j) in the first (second) profile, are
penalized by a term Mij that grows with their absolute dif-
ference raised to a suitable power whose value was
optimized in a previous study,
Substitution of amino acids is less likely for pairs withvery different physiochemical properties just like used insequence alignments,
with the parameters and and with
for the substitution probability connecting
amino acids and . The substitution probabili-
ties were recovered from BLOSUM62 using the program
lambda by Eddy [21].Breaking chain s between residues i and i + 1 is penal-
ized by
with parameters and and with s 8 {1,2}
labelling the chain into which the gap is inserted.
An insertion of length nj into chain s at position j + 1
opposite to a gap in the other chain, consisting of the
components , is penalized by
with parameters and and with s 8 {1,2}
selecting the chain.The total penalty function F combines all these contri-
butions,
where is the set of all aligned pairs of amino acids,
V(s) the set of all positions i after which chain s is broken,
and ?(s) the set of all insertions of length n after position j
in chain s. The alignment result is determined by the path
through alignment matrix Aij that globally minimizes
penalty function F, Eq. (6). It corresponds to the optimal
alignment, given penalty parameters and proper defini-
tion of F. The parameters used in F are shown in Table 3.
paligne
M c cij i j
p= −( ) ( ) .1 1 aligne (2)
S p P A Aij i j
p= ⋅ −( )AAsubst f
AAsubste1 1 2( , )( ) ( ) (3)
pAAsubst f peAAsubst
P A Ai j( , )( ) ( )1 2
Ai( )1 A j
( )2
B Pcis ci
s
is
p
( )( ) ( )
= ⋅+ +
⎛
⎝
⎜⎜⎜
⎞
⎠
⎟⎟⎟
break f
breake
12
(4)
pbreak fp
ebreak
c cjs
j ns
+ +⎡⎣
⎤⎦1
( ) ( )…
I p cjs
ks
k j
j n p( ) ( )= ⋅
= +
+
∑insert f
inserte
1
(5)
pinsert f peinsert
F M S
B B
I
ij
i j
ij
i j
i
i
i
i
j
= + +
+ +
∀ ∈ ∀ ∈
∀ ∈ ∀ ∈
∑ ∑∑ ∑( , ) ( , )
( ) ( )
( ) ( )
P P
B B
1 2
1 2
,,( )
,( )
( ) ( )n
j
j n
jj j
I1 2
1 2∀ ∈ ∀ ∈∑ ∑+I I
(6)
P
Teichert et al. BMC Bioinformatics 2010, 11:251http://www.biomedcentral.com/1471-2105/11/251
Page 10 of 14
They were optimized for structure alignment and have
not been changed for the present purpose.Different algorithms can be used to find this optimal
path very efficiently, our implementation uses Dijkstra'sshortest path algorithm. A more detailed description ofthe full alignment algorithm is given in [3], the specificimplementation using the contact vector as structuralprofile is discussed in [4].
Structural Profile PredictionThe CV is predicted here using an artificial neural net-work (ANN) scheme based on position-specific scoringmatrices (PSSMs) computed by PSI-BLAST. Relying onPSSMs we follow an idea already employed by Jones [8] topredict secondary structure propensities.
Formally the PSSM components characterized proba-bilities propensities to find a specific amino acid of type aat site i of the given protein family, where the index a 8{1, 20} labels the twenty natural amino acids. The matrixentries are defined as
where Qi(a) quantifies the probability to find the aminoacid a at site i in a sequence belonging to the same pro-tein family and P(a) characterizes the background distri-bution, independent of the position in the sequence.
We used the non-redundant sequence database 'NR'from NCBI (6th Feb. 2009) after filtering out biasedregions using pfilt by Jones and Swindells [22]. Theresulting database 'nrfilt' contains 5,884,546 sequences or2,028,361,679 residues.
The ANN implements the very basic feed-forwardscheme in which the flow of information is unidirec-tional, starting in the 15·21 neurons of the input layer thataccounts for correlations along the sequence over a fif-
teen sites wide window, for each of the twenty aminoacids and an additional terminal marker, leading throughonly one hidden layer with 40 neurons to the output layerconsisting of a single neuron. An ANN with only one hid-den layer can be described by a single non-linear functionas
with neuron state vector and layer sizes N1 = 21·15 =
315 and N2 = 40.The parameters υij and ωij were trained on a set of about
3000 sequences randomly selected from rank-1 of a PDBclusters set at 50% sequence identity level. We excludedfrom this set all sequences that were not resolved by X-ray, that are transmembrane according to pdbtm [23] orshorter than 30 or longer than 300 residues. Furthermore,non-globular structures were sorted out by the ad hoccriterion introduced by Bastolla et al. [24]. We split thewhole set into training and validation sets of equal sizes.For parameter training we used online learning, minimis-ing the quadratic distance between prediction and struc-ture derived contact vector, in combination with earlystopping. The ANN parameter window size in the inputlayer, number and size of hidden layer, choice of functionand training criterion were selected by extensive testing.Cross-validation was used to make sure that the pre-dicted parameters are not over-fitted.
The contact vector prediction scheme does not prop-erly predict the scale of the output vectors, so that theirmean values are not fixed and the variance of the vectorshas only very low correlation with the targets. While themean value can be set to one simply by dividing by themean component value, the variance needs to be pre-dicted independently. In fact, the variance is systemati-cally underestimated by the predictor, a behaviour thatcan possibly be explained by the very broad distributionof contact values around their residue type specificmeans. The ANN tends to introduce a bias that shifts thepredicted components to their mean values, attenuatingthe variance of the predicted vectors.
In order to compensate this effect we aim to predict thevariance in an additional computation in dependence ofamino acid composition and length of the sequence. Thepredicted variance value is than stamped on the formerlypredicted vector by scaling its components. To do so, werely on an ansatz similar to the one used by Kinjo et al.[25]. Sequence information enters the scheme throughthe 20 mean values, one for each amino acid residue type,computed over the given sequence-specific PSSM that
Pi aQi aP a, log( )( )
=⎛
⎝⎜
⎞
⎠⎟ (7)
f x xi
i
N
j
j
N
j i� �( ) = ⋅ ⋅ +
⎛
⎝
⎜⎜
⎞
⎠
⎟⎟
+= =∑ ∑w w u u2
1 1
1 1 2
2 1
tanh (8)
x�
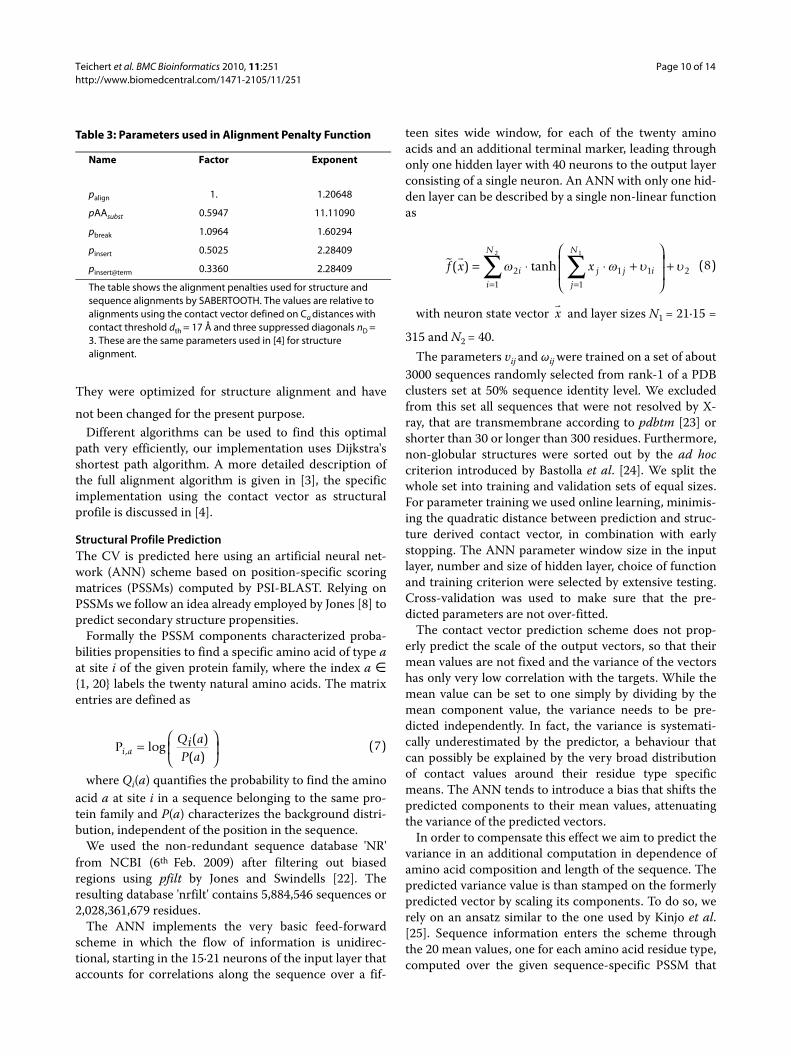
Table 3: Parameters used in Alignment Penalty Function
Name Factor Exponent
palign 1. 1.20648
pAAsubst 0.5947 11.11090
pbreak 1.0964 1.60294
pinsert 0.5025 2.28409
pinsert@term 0.3360 2.28409
The table shows the alignment penalties used for structure and sequence alignments by SABERTOOTH. The values are relative to alignments using the contact vector defined on Cα distances with contact threshold dth = 17 Å and three suppressed diagonals nD = 3. These are the same parameters used in [4] for structure alignment.

Teichert et al. BMC Bioinformatics 2010, 11:251http://www.biomedcentral.com/1471-2105/11/251
Page 11 of 14
was already used as input to the ANN. The length depen-dence of the variance is fitted by
consisting of a term that describes the scattering of thevariance (with the amino acid specific fit parameters fiand length parameter a) and by modelling the lengthdependent mean value of the variance as a power law(with parameters b and c). Furthermore, a lower boundvalue vãrmin = 0.05 is used to suppress artificially low vari-ance values.
Assessment of the CV PredictionWe evaluated the accuracy of the predicted structuralprofiles by comparing the predicted CVs with those com-puted directly from protein structure. The test set com-prises the whole ASTRAL40 (version 1.73) with 9420protein domains.
Assessment of the Alignment QualityThe quality of the alignments produced by SABER-TOOTH and by the reference tools described below wasassessed on three sets of alignments from the major levelsof SCOP family (5238 alignments), superfamily (5180),and fold (5097). Pairs in the sets were chosen randomlyfrom the ASTRAL40 subset of SCOP domains that haveless than 40% pairwise sequence identity. The fold leveltest set consists of alignments from the same fold but dif-ferent superfamilies, and the superfamily test consists ofalignments from the same superfamily but different fami-lies. We assessed only the alignments for which all refer-ence tools output results, which reduced the sets by abouthalf a percentage in size. SABERTOOTH outputs align-ments for all examples in all sets.
The alignment quality was quantified using as struc-tural similarity measure the contact overlap q that quanti-fies the similarity between the contact matrices of twoprotein structures, normalized with the geometric meanof their number of contacts in such a way that q = 1 foridentical contact matrices
As an additional measure of structural similarity we
used the TM-score [18] that quantifies the closeness of
the protein's backbone atoms after optimal spatial super-
imposition using a MaxSub rotation [17]. This mea-
sure is highly correlated to other similarity measures
based on superimposition, such as the Percentage of
Structural Identity (PSI) or the Global Distance Test
(GDT) scores [26].The sequence similarity
with the BLOSUM62 constitutes a local
measure describing the precision in the details if contact
overlap values of the same alignment are reasonably high.
Definition of Significance Scores
SABERTOOTH outputs two different significance scores
implemented as Z-scores, assuming Gaussian distri-
bution of the underlying scores ,
The mean and the standard deviation of the scores thatare used in the above formula depend on the lengths ofthe compared proteins N1 and N2. For simplicity, we con-sider in the following that this dependence only actsthrough the smaller of the two lengths, N = min(N1, N2).This length dependence is assumed to be of power-lawtype, and the parameters are obtained by fitting power-laws on a set of alignments of non-related proteins, con-sisting of 723,217 alignments of domains from differentSCOP classes that were tested to have MAMMOTH[27]Z-score below 0.75 and TM-align TM-score [18]below 0.25 to make sure to exclude even distantly relatedproteins.
The first similarity score is derived from the samePSSMs already utilized for predicting the structural pro-files. It is computed as a sum over Pearson correlationcoefficients r of the PSSM columns for every pair ofaligned sites, normalized by shorter chain length,
with power-law fits resulting to
varpredCV PSSM= ⋅⎛
⎝⎜⎜
⎞
⎠⎟⎟
⋅ + ⋅=∑ i i
i
a cf l b l1
20
(9)
q C CCijaCij
bi j
Cija
i j Cijb
i j
a b( , ) .=<∑
<∑ <∑(10)
R
seqSimB62
A
==∑1
1 2
1 2
1min( , )
( , )( ) ( )
N NS A Ai i
i
N
(11)
S A Ai i( , )( ) ( )1 2
ZS
S
ZN N
N NSS S
S=
− ( , )
( , ).1 2
1 2s(12)
r P PPSSM B
A
, ,( )
,( )
min( , )62
1
1 21
1 2= ( )
=∑N N
rii
N
i a i a(13)
rPSSM B,.. min( , )62 1 2
0 1720 261= ⋅ −N N (14)

Teichert et al. BMC Bioinformatics 2010, 11:251http://www.biomedcentral.com/1471-2105/11/251
Page 12 of 14
The second score is much less significant, and it ismainly kept for reasons of comparison. It is derived fromsimple sequence similarity, Eq. (11), computed using aBLOSUM62 and normalized on the length of the shorterchain. The power-law fits result to
Assessment of the Significance ScoresWith all tools, with the exception of MUSCLE that doesnot output any significance score, we computed signifi-cance scores for the all-vs-all alignments of 498 struc-tures that were randomly selected from the 97 mostpopulated folds in ASTRAL40 (version 1.73), leading to123,753 alignments. Using these significance scores, wecomputed Receiver Operating Characteristic (ROC)curves that graphically quantify the agreement of the sig-nificance score with the SCOP classification. To createthe ROC plots, a cutoff for the respective score Zcutoff isshifted from its minimum to its maximum value, count-ing the number of alignments with Z >Zcutoff at each valueof Zcutoff. All alignments above the threshold that are alsoin the same cluster of SCOP, represent true positives TP,i.e. they agree with the classification. All those below thethreshold but nevertheless in the same cluster of SCOPare counted as false positives FP that disagree with theclassification. The assessment is split into independentanalyses on the three major SCOP levels fold, superfam-ily, and family.
The ROC curves show the ratios of TP/P over FP/N,with the total numbers of positives P and negatives N,respectively. The further the curves reach to the left handside of the plot, the less positives are assigned low valuesof significance, while pushing the curve up means thatmore positives are correctly assigned high significance.Hence, the larger the area under the curve (AUC), thebetter the performance of the significance score outputby the respective program in recognising evolutionaryand structural relationships given by SCOP. This can alsobe understood as measuring sensitivity and coverage. Thediagonal marks the result for a random score.
Sequence Alignment Reference ToolsWe chose standard parameters for all alignment tools.Every modification in the parameters would infer previ-ous knowledge about the set of sequences to be aligned.An expert for a specific program with in-depth informa-
tion about the alignment set could, hence, achieve betterresults than found here. In this sense, we only assess themost general alignments but with fair chances for allalgorithms. SABERTOOTH does not use any specificparameter set either, its sequence dependent alignmentpenalties rely on the all purpose substitution matrixBLOSUM62, and the profile prediction routine uses theidentical PSI-BLAST PSSMs that were also used for thePSI-BLAST alignments.Clustal W, T-Coffee, MUSCLEAll three multiple sequence alignment programs ClustalW (v1.83) [9], T-Coffee (v5.65) [11], and MUSCLE (v3.7)[10] start by computing the all-vs-all pairwise alignmentsof the input sequences. The resulting similarity scores arethen used to build a tree that guides the order in whichsequences are progressively aligned to build a multiplealignment. Here we only consider the initial pairwisealignments, whose quality strongly in uences the result-ing multiple alignment.
Clustal W, T-Coffee, and MUSCLE were run with stan-dard parameters. For Clustal W that implies in particularto compute 'SLOW' alignments with full dynamic pro-gramming for maximum accuracy. T-Coffee was usedwith the non-standard parameter '-do_normalize 0' tosuppress normalisation of the output score which doesnot change the resulting alignment but improves thescore's performance in the classification test.PSI-BLASTThe alignment program PSI-BLAST (v2.2.18) [12] followsa fundamentally different strategy than the first threetools. It massively aligns the query sequence against agiven database of sequences. After the first round of one-vs-all alignments the used substitution matrix is modifiedin order to better fit the query sequence in the next itera-tion. This recipe can be repeated several times refiningthe so-called position-specific scoring matrix (PSSM).The crucial points are the similarity measure and cutoffvalue, as well as the number of iterations that define theset of sequences that contribute to the PSSM. PSI-BLASTis designed to achieve much improved alignment qualityespecially for distantly related sequences in comparisonto the other references.
Since PSI-BLAST aligns a single sequence to a databaseits alignments are intrinsically asymmetric, depending onthe choice of query sequence. To eliminate this ambiguityin our application we perform two separate alignments.After computing PSSMs for both sequences, we alignsequence A with a database containing sequence B usingthe PSSM computed for A, and vice versa. The alignmentwith higher PSI-BLAST E-value is selected as the finalalignment referred to in both evaluations. We found thatthis choice leads to improved performance in the detec-tion of evolutionary relationships than selecting the
s rPSSM B,. min( , ) ..
620 148 1 2
0 229= ⋅ −N N (15)
SeqSimB62 1 20 4581 514= − ⋅ −. min( , ) .N N (16)
s seqSimB622 661 1 2
0 538= ⋅ −. min( , ) ..N N (17)

Teichert et al. BMC Bioinformatics 2010, 11:251http://www.biomedcentral.com/1471-2105/11/251
Page 13 of 14
alignment with lower E-value or just a random one, asexpected. Note that this procedure gives PSI-BLAST aslight advantage over all other tools evaluated here.
In order to assess the influence of the substitutionmatrix employed, we used PSI-BLAST with three differ-ent matrices: (1) BLOSUM62 with gapopen = 11 andgapextend = 1, the standard parameter set, (2)BLOSUM45 with gapopen = 14 and gapextend = 2, and(3) BLOSUM80 with gapopen = 10 and gapextend = 1.The gap penalty values relative to the choice of BLOSUMwere taken from the PSI-BLAST help on EBI's web pageat http://www.ebi.ac.uk/Tools/PSIBLAST/. It turned outthat results found with the different BLOSUMs differonly very slightly. The results shown are for BLOSUM62.HHpredHHpred (v.1.5.0) constructs Hidden Markov Models(HMM) from alignments of the non-redundant database'NR' from NCBI against a query sequence. These align-ments are obtained by PSI-BLAST. HHpred then com-putes the final alignment, maximising a score based onthe coemission probability of the two HMMs and pre-dicted secondary structure. For the alignment overlaptest, we used the global alignment mode of HHpred whilewe used the local alignment mode for the fold recognitiontest, thus yielding the best results for the respective analy-sis. The local alignment mode performs worse in thealignment overlap test because it aligns residues in theconserved core, only. Please note that this proceeding isto the advantage of HHpred in comparison to all otheralignment tools used here, since all other tools use identi-cal sets of alignments for both tests.
Data SetsAlignment Quality AssessmentThe data set used for alignment quality assessment con-sists of a random selection of pairs from the ASTRAL40subset of SCOP domains that have less than 40% pairwisesequence identity. It contains three sets of alignmentsfrom the major levels of SCOP family (5238 alignments),superfamily (5180), and fold (5097). All alignments fromthe different similarity levels are from different clusters ofthe underlying level, i.e. alignments from the same foldare from different superfamilies and so on.SABERTOOTH Significance Score TrainingStatistics over 723,217 alignments, randomly selectedfrom different SCOP classes, were used to fit the lengthdependent mean and standard deviation values used inthe SABERTOOTH significant scores. Alignments withMAMMOTH [27]Z-score below 0.75 or TM-align TM-score [18] below 0.25 were sorted out to make sure thatall examples represent alignments of reasonably unre-lated proteins.Significance Score AssessmentThe 123,753 alignments underlying the ROC curve analy-ses include the all-vs-all alignments of 498 structures that
were randomly selected from the 97 most populated foldsin ASTRAL40 (version 1.73).Contact Vector PredictionFor the contact vector prediction we selected at randomabout 3000 sequences from a PDB clusters set at 50%sequence identity level (rank 1) with chain lengthsbetween 30 and 300 residues. Only X-ray resolved struc-tures not classified as transmembrane according topdbtm [23] were accepted. Furthermore, non-globularstructures were sorted out by the ad hoc criterion intro-duced by Bastolla et al. [24].Contact Vector Prediction AssessmentFor the assessment of the contact vector prediction thewhole ASTRAL40 (version 1.73) database with 9420 pro-tein domains was applied. This test set is disjunct fromthe training set used.
Availability and RequirementsProject name: SABERTOOTH Sequence Alignment
Project home page: http://www2.fkp.tu-darmstadt.de/bioinf/sabertooth_project/
Licence: Source code available on request to academicusers, free of charge.
Additional material
AbbreviationsANN: Artificial Neural Network; AUC: Area Under Curve; BLOSUM: BLOcks SUb-stitution Matrix; CRN: Critical Random Network; CV: Contact Vector; HMM: Hid-den Markov Models; PSI: Percentage of Structural Identity; PSSM: Position-Specific Scoring Matrix; ROC: Receiver Operating Characteristic; SCOP: Struc-tural Classification Of Proteins.
Authors' contributionsMP and UB designed research; FT and MP developed the alignment algorithm;FT coded and tested the alignment algorithm; MP and JM developed the pro-file prediction scheme; JM coded and tested the profile prediction scheme; FT,JM, UB, and MP analysed results; FT, JM, UB, and MP wrote the paper. Allauthors read and approved the final manuscript.
AcknowledgementsWe gratefully acknowledge fruitful discussions with Ángel Ortiz in the early stages of this work, and with David Abia and Alberto Pascual.
Additional file 1 Alignment Quality Test Set. The zip archive includes the three test sets used for alignment quality assessment in this work: 5238 alignments at SCOP family level, 5180 alignments at SCOP superfamily level and 5097 alignments at SCOP fold level. Each line identifies an alignment through two domain identifiers relative to SCOP version 1.73. PDB-format-ted files for these domains can be found in the ASTRAL40 domain database version 1.73 at http://astral.berkeley.edu/. A more detailed description of the composition of the test sets is given in the Methods section.Additional file 2 Significance Score Assessment Set. The file contains the set of 123,753 alignments used for significance score assessment in this work. The alignments comprise the all-vs-all combination of 497 ASTRAL40 domains (version 1.73). Each row describing one alignment, the columns list the following information that allows retracing the SCOP classification: ASTRAL identifiers for first and second domain in the alignment, chain length of the first and the second. After that, in pairs of columns relative to the first and the second domain, the SCOP classification is listed: class (cl), fold (cf ), superfamily (sf ), family (fa), domain (dm), and species (sp) identifi-ers. A more detailed description of the composition of the set is given in the Methods section.

Teichert et al. BMC Bioinformatics 2010, 11:251http://www.biomedcentral.com/1471-2105/11/251
Page 14 of 14
FT and MP gratefully acknowledge generous financial support from the Deutsche Forschungsgemeinschaft via project PO 1025/1 and from the Deutscher Akademischer Austauschdienst via project D/06/12858. UB acknowledges financial support from the Spanish Science and Innovation Min-istry through the Ramón y Cajal program and the grant no. BIO2008-04384 and Consolider Ingenio CSD2006-23 and through the Acciones Integradas pro-gram.
Author Details1Institut für Festkörperphysik, Technische Universität Darmstadt, Hochschulstr. 6-8, 64289 Darmstadt, Germany, 2Centro de Biología Molecular "Severo Ochoa", (CSIC-UAM), Cantoblanco, 28049 Madrid, Spain and 3Institut für Theoretische Physik, Universität zu Köln, Zülpicher Str. 77, 50937 Köln, Germany
References1. Doolittle R: Of URFs and ORFs: A primer on how to analyze derived amino acid
sequences University Science Books; 1986. 2. Moult J, Fidelis K, Kryshtafovych A, Rost B, Hubbard T, Tramontano A:
Critical assessment of methods of protein structure prediction - Round VII. Proteins 2007, 69(Suppl 8):3-9.
3. Teichert F, Bastolla U, Porto M: SABERTOOTH: protein structural alignment based on a vectorial structure representation. BMC Bioinformatics 2007, 8:425 [http://www.fkp.tu-darmstadt.de/sabertooth/].
4. Teichert F, Bastolla U, Porto M: Protein Structure Alignment through a Contact Topology Profile using SABERTOOTH. Proceedings of the German Conference on Bioinformatics GCB 2008, Lecture Notes in Informatics No. P-136, Gesellschaft für Informatik e.V 2008:75-84.
5. Bastolla U, Porto M, Roman HE, Vendruscolo M: The principal eigenvector of contact matrices and hydrophobicity profiles in proteins. Proteins 2005, 58:22-30.
6. Vullo A, Walsh I, Pollastri G: A two-stage approach for improved prediction of residue contact maps. BMC Bioinformatics 2006, 7:180.
7. Kinjo A, Nishikawa K: CRNPRED: highly accurate prediction of one-dimensional protein structures by large-scale critical random networks. BMC Bioinformatics 2006, 7:401.
8. Jones D: Protein secondary structure prediction based on position-specific scoring matrices. J Mol Biol 1999, 292(2):195-202.
9. Thompson J, Higgins D, Gibson T: CLUSTAL W: improving the sensitivity of progressive multiple sequence alignment through sequence weighting, position-specific gap penalties and weight matrix choice. Nucleic Acids Research 1994, 22:4673-4673.
10. Edgar R: MUSCLE: multiple sequence alignment with high accuracy and high throughput. Nucleic Acids Research 2004, 32(5):1792-1797.
11. Notredame C, Higgins D, Heringa J: T-coffee: a novel method for fast and accurate multiple sequence alignment. J Mol Biol 2000, 302:205-217.
12. Altschul S, Madden T, Schaffer A, Zhang J, Zhang Z, Miller W, Lipman D: Gapped BLAST and PSI-BLAST: a new generation of protein database search programs. Nucleic Acids Research 1997, 25(17):3389-3402.
13. Soding J: Protein homology detection by HMM-HMM comparison. Bioinformatics 2005, 21(7):951-60.
14. Thompson J, Plewniak F, Poch O: BAliBASE: a benchmark alignment database for the evaluation of multiple alignment programs. Bioinformatics 1999, 15:87-88.
15. Mizuguchi K, Deane C, Blundell T, Overington J: HOMSTRAD: a database of protein structure alignments for homologous families. Protein Science 1998, 7(11):2469.
16. Godzik A: The structural alignment between two proteins: Is there a unique answer? Protein Science 1996, 5:1325-1338.
17. Siew N, Elofsson A, Rychlewski L, Fischer D: MaxSub: An automated measure for the assessment of protein structure prediction quality. Bioinformatics 2000, 16(9):776-785.
18. Zhang Y, Skolnick J: TM-align: a protein structure alignment algorithm based on the TM-score. Nucleic Acids Research 2005, 33(7):2302-2309.
19. Chandonia J, Hon G, Walker N, Lo Conte L, Koehl P, Levitt M, Brenner S: The ASTRAL compendium in 2004. Nucleic Acids Research 2004, 32(Suppl 1):D189-D192.
20. Teichert F: Protein Sequence and Structure Comparison based on vectorial Representations. In PhD thesis Technische Universität Darmstadt; 2009.
21. Eddy S: Where did the BLOSUM62 alignment score matrix come from? Nature Biotechnology 2004, 22(8):1035-1036.
22. Jones D, Swindells M: Getting the most from PSI-BLAST. TRENDS in Biochemical Sciences 2002, 27(3):161-164.
23. Tusnády G, Kalmár L, Simon I: TOPDB: topology data bank of transmembrane proteins. Nucleic Acids Research 2007, 36(Suppl 1):D234-D239.
24. Bastolla U, Porto M, Roman HE, Vendruscolo M: A protein evolution model with independent sites that reproduces site-specific amino acid distributions from the Protein Data Bank. BMC Evolutionary Biology 2006, 6:43.
25. Kinjo A, Horimoto K, Nishikawa K: Predicting absolute contact numbers of native protein structure from amino acid sequence. Proteins: Structure, Function, and Bioinformatics 2005, 58:158-165.
26. Zemla A: LGA: a method for finding 3D similarities in protein structures. Nucleic Acids Research 2003, 31(13):3370.
27. Ortiz AR, Strauss CE, Olmea O: MAMMOTH (Matching molecular models obtained from theory): An automated method for model comparison. Protein Science 2002, 11(11):2606-2621.
doi: 10.1186/1471-2105-11-251Cite this article as: Teichert et al., High quality protein sequence alignment by combining structural profile prediction and profile alignment using SABER-TOOTH BMC Bioinformatics 2010, 11:251
Received: 7 August 2009 Accepted: 14 May 2010 Published: 14 May 2010This article is available from: http://www.biomedcentral.com/1471-2105/11/251© 2010 Teichert et al; licensee BioMed Central Ltd. This is an Open Access article distributed under the terms of the Creative Commons Attribution License (http://creativecommons.org/licenses/by/2.0), which permits unrestricted use, distribution, and reproduction in any medium, provided the original work is properly cited.BMC Bioinformatics 2010, 11:251