high poverty hotspots 1 beaverton/aloha, washington county€¦ · · 2015-11-05high poverty...
TRANSCRIPT

High Poverty Hotspots 1 – Beaverton/Aloha, Washington County High poverty hotspots are geographic concentrations of poor residents. This report identifies high poverty hotspots in the city of Beaverton and community of Aloha and provides a profile of their residents using Census Bureau, DHS, and Oregon Employment Department (OED) data. DHS administrative data on SNAP clients were pulled for all clients known to be living in the hotspots in January 2015. SNAP information was used because SNAP is the single largest DHS/OHA program, it has a high participation rate among Oregon’s poor and low income residents, and it has reliable geographic information. Statewide, about 96 percent of SNAP clients have addresses that can be reliably located within a census tract. Once data on SNAP clients within the hotspot were pulled, information about them was assembled from the DHS Integrated Client Services (ICS) data warehouse. ICS contains information on clients from nearly all DHS/OHA programs from January 2000 to present. In addition, Oregon employment and earnings history for all clients has been provided by OED and incorporated into ICS. The purpose of this report is to identify high poverty areas and describe residents and SNAP clients living in them. Characteristics of the hotspots are compared with each other, the county, and Oregon. Data are presented in a series of tables that follow. Bullet points are provided when there is pertinent information not included in the tables. Data in this report should be considered a means to illustrate the lives of hotspot residents with respect to family structure, geographic mobility, employment history, and to identify potential barriers to self-sufficiency. Knowledge about local high poverty hotspots can be useful when designing and locating programs and services targeted to low income people. Poverty concentrations also pose a number of challenges for local public schools. Four areas in Beaverton/Aloha are high poverty hotspots. Other Washington County hotspots in Forest Grove, Hillsboro, and Tualatin are covered in separate reports. According to Census Bureau and DHS data, 8 percent of Washington County’s population, 16 of its poor, and 14 percent of its SNAP clients live in the areas described below.
1 Hotspot: The Census Bureau’s definition of a poverty area is a tract with a poverty rate of 20 percent or more. We define a high poverty hotspot as a census tract or contiguous group of tracts with poverty rates of 20 percent or more for two consecutive measurements. Poverty rates were measured in the Census Bureau’s 2009-2013 and 2008-2012 American Community Surveys (ACS).
Oregon DHS Office of Forecasting, Research, & Analysis May 2015

Figure 1: Poverty hotspot: Central Beaverton
• Central Beaverton (Census tracts 312, 313, and 314, Figure 1) Location: portions of Beaverton’s Central neighborhood Boundaries: North: SW Canyon, Walker, and Jenkins roads South: Tualatin Valley Highway, SW Farmington Road, SW Allen Boulevard, and SW Beaverton- Hillsdale Highway East: SW Murray and Hall boulevards and SW 91st Avenue West: The Westside Regional Trail and electric transmission intertie, SW 148th Avenue, SW Murray and SW Cedar Hills boulevards
Oregon DHS Office of Forecasting, Research, & Analysis May 2015

Figure 2: Poverty hotspot: Five Oaks
• Five Oaks (Census Tract 316.13, Figure 2)
Location: A portion of Beaverton’s Five Oaks/ Triple Creek neighborhood Boundaries: North: SW Walker and W Baseline roads and SW Pheasant and Augusta lanes South: SW Tualatin Valley Highway East: The Westside Regional Trail and electric transmission intertie West: SW 185th, SW 170th, and SW 158th avenues
Oregon DHS Office of Forecasting, Research, & Analysis May 2015
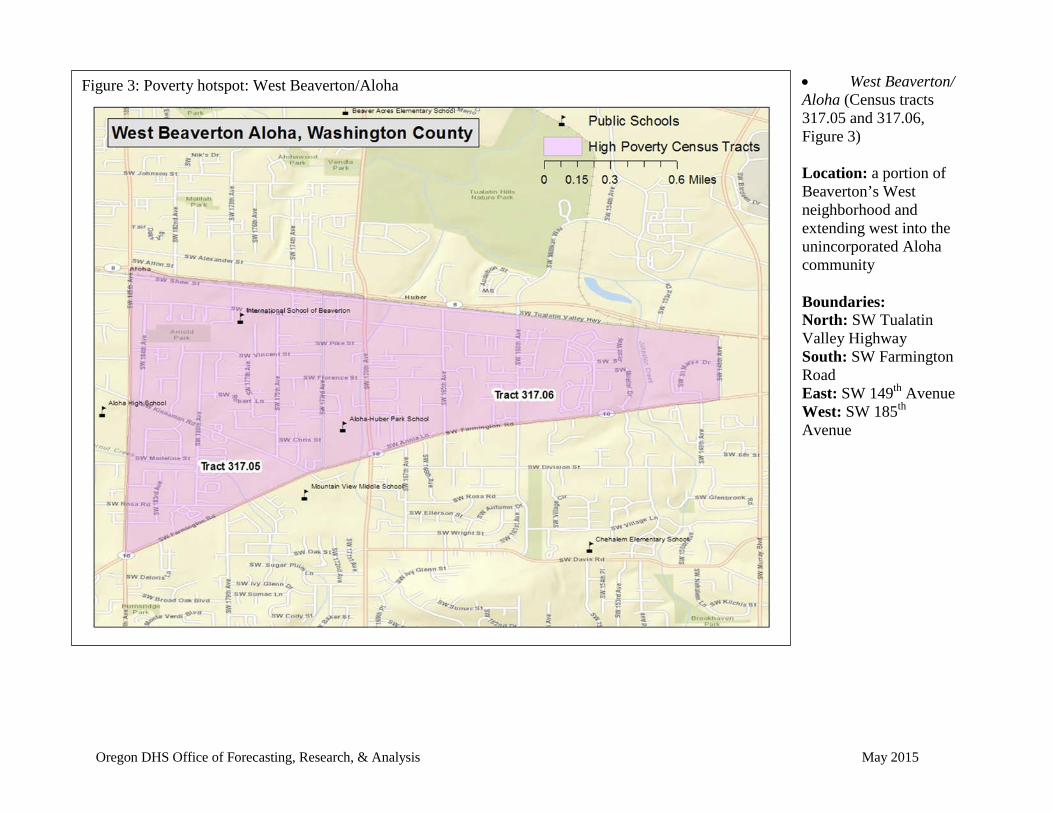
Figure 3: Poverty hotspot: West Beaverton/Aloha
• West Beaverton/ Aloha (Census tracts 317.05 and 317.06, Figure 3) Location: a portion of Beaverton’s West neighborhood and extending west into the unincorporated Aloha community Boundaries: North: SW Tualatin Valley Highway South: SW Farmington Road East: SW 149th Avenue West: SW 185th Avenue
Oregon DHS Office of Forecasting, Research, & Analysis May 2015

Figure 4: Poverty hotspot: Greenway
• Greenway (Census Tract 316.06, Figure 4) Location: Beaverton’s Greenway neighborhood Boundaries: North: SW Hart Road and SW Hall Boulevard South: SW Brockman and SW Scholls Ferry roads East: Union Pacific Railroad tracks West: SW Sorrento Road and SW 125th Avenue
Oregon DHS Office of Forecasting, Research, & Analysis May 2015

Table 1 Beaverton/Aloha hotspots: neighborhood characteristics from the Census Bureau1
Census measures compared to the county and state (Table 1) • In the West Beaverton/Aloha hotspot, the poverty rate was 28 percent in tract 317.05 and 21 percent in tract 317.06. • In the Central Beaverton hotspot, the poverty rate was 25 percent in tracts 312 and 314.02 and 23 percent in tract 313.
• Among all Oregon hotspots, clients in Greenway had the 11th highest rate of households headed by single mothers.
Oregon DHS Office of Forecasting, Research, & Analysis May 2015
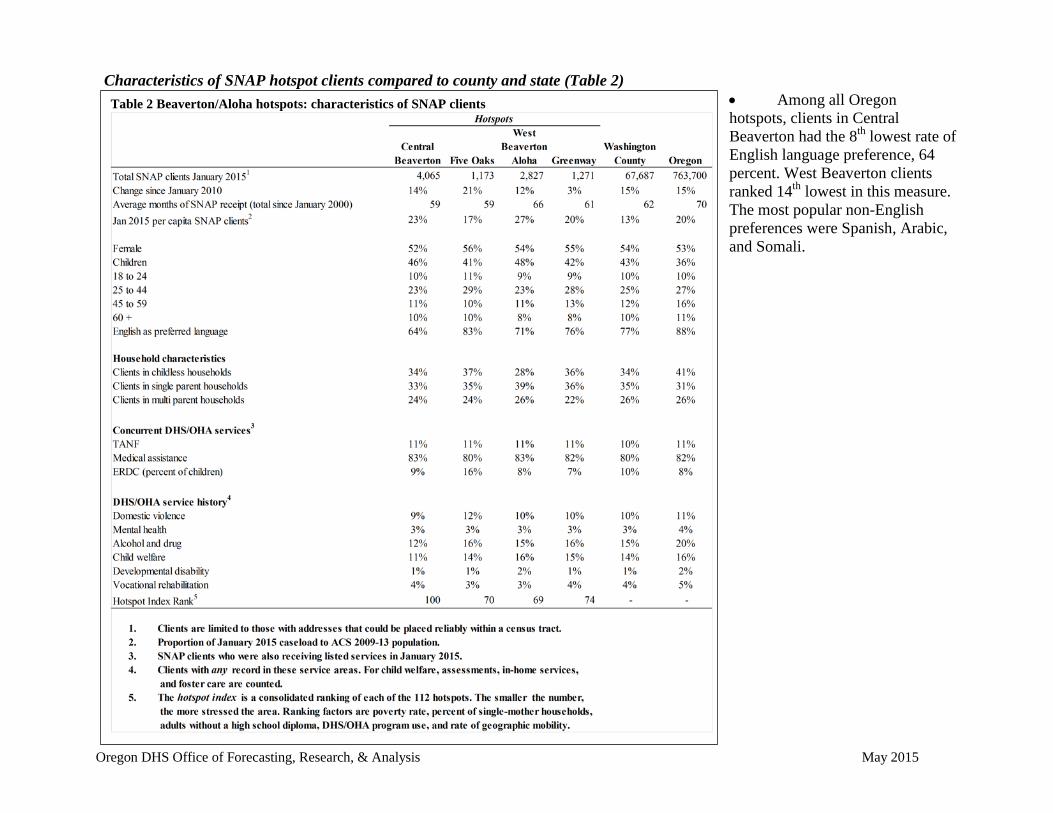
Table 2 Beaverton/Aloha hotspots: characteristics of SNAP clients
Characteristics of SNAP hotspot clients compared to county and state (Table 2) • Among all Oregon hotspots, clients in Central Beaverton had the 8th lowest rate of English language preference, 64 percent. West Beaverton clients ranked 14th lowest in this measure. The most popular non-English preferences were Spanish, Arabic, and Somali.
Oregon DHS Office of Forecasting, Research, & Analysis May 2015

Table 3 Beaverton/Aloha hotspots: employment history for adult SNAP clients1
Employment characteristics of adult SNAP hotspot clients compared to county and state (Table 3) • The largest employment gain by far was in the administrative services sector. More than half of client employment in this sector was in temporary help agencies.
Oregon DHS Office of Forecasting, Research, & Analysis May 2015

Table 4 Beaverton/Aloha hotspots: address history for SNAP clients1,2
Geographic mobility (Table 4) Measuring the number of moves registered by SNAP households is important because low income families often move as a response to job loss, a change in household composition, or eviction. Children who move frequently are more likely to experience academic and social challenges in school.2 The overwhelming majority of moves among SNAP clients are short-distance, but patterns vary in rural versus urban areas. Census tracts are larger in rural areas and distances are longer between urban areas in largely rural counties. Clients in rural areas are more likely to move within the same census tract or move to a different county than are clients in urban areas. Due to the smaller size of urban census tracts, clients in urban areas are more likely to move to a different tract within the same county than are rural clients.
• Client migration patterns for these four hotspots were urban, with most movers relocating from other tracts within Washington County. • Fifteen percent of all moves involved relocating from one hotspot to another within Washington County.
• For those relocating from another county, the overwhelming majority came from Multnomah County, followed by Clackamas County.
2 The negative effects on low income children associated with frequent moves and school changes are well documented in peer-reviewed literature.
Oregon DHS Office of Forecasting, Research, & Analysis May 2015