high performance web pages - billwscott.com
TRANSCRIPT

High Performance Web Pages
Real World Examples: Netflix Case Study
Bill ScottCS193H. Fall 2008.Stanford University
1

The Situation
All attention was focused on server sideMost pages 200 - 300 ms
Savings of 20 ms celebrated
Server side is a tiny fraction of the performance pie
Typical Netflix page:
Server Side Client Side
2
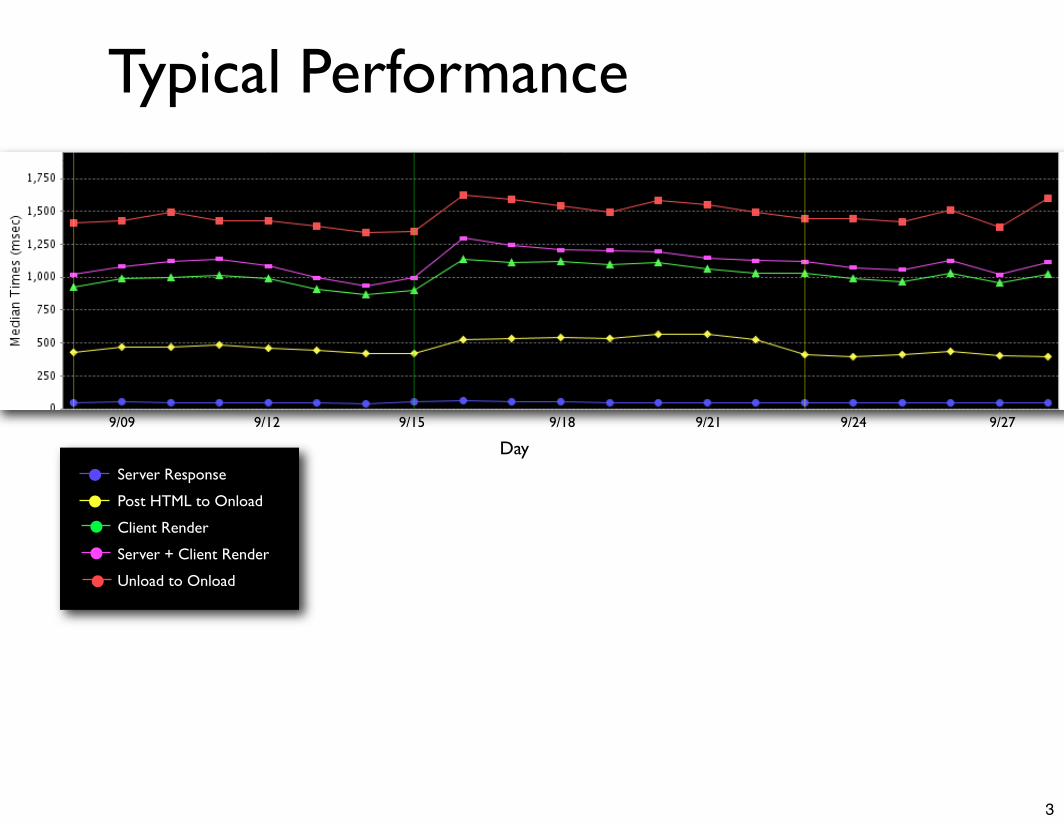
Typical Performance
9/09 9/12 9/15 9/18 9/21 9/24 9/27
DayServer Response
Post HTML to Onload
Client Render
Server + Client Render
Unload to Onload
3

Same Profile on Member Home
Total response/render times:75% of customers experience less than10 seconds (which means 25% are experiencing greater than 10 seconds)
42% less than 5 seconds
29% less than 3 seconds
Server response times:Appear to be only at a maximum 4% of total response/render time
75% of server response times are less than 1.15 seconds
Conclusion: Lots of room for client side improvement
4

Goal
Measure request-to-response cycleGets at what the user actually experiences
Improve end user performanceImplement Steve Souder’s performance rules
5

The PlanMetrics Capture (round trip tracing)
Apache - gzip, ffe, etag configuration, Proxy cache configuration
Integrate new Starbar into website
Better minification for JS & CSS (yui minifier)
Sprite Bob Graphic Images
Sprite Header Graphics
Sprite Queue graphic images
Configure CDN image assets to use FFE & create image version push system
Move JS to the bottom, CSS to the top, better JS/CSS packaging
Switch from graphics based buttons to CSS/Text based buttons
Switch vignettes from graphics based to CSS/Text based graphic
Lighter weight BOB, QACL, Menu Nav
Reduce number of CDN cnames in use
6

Metrics Capture
7
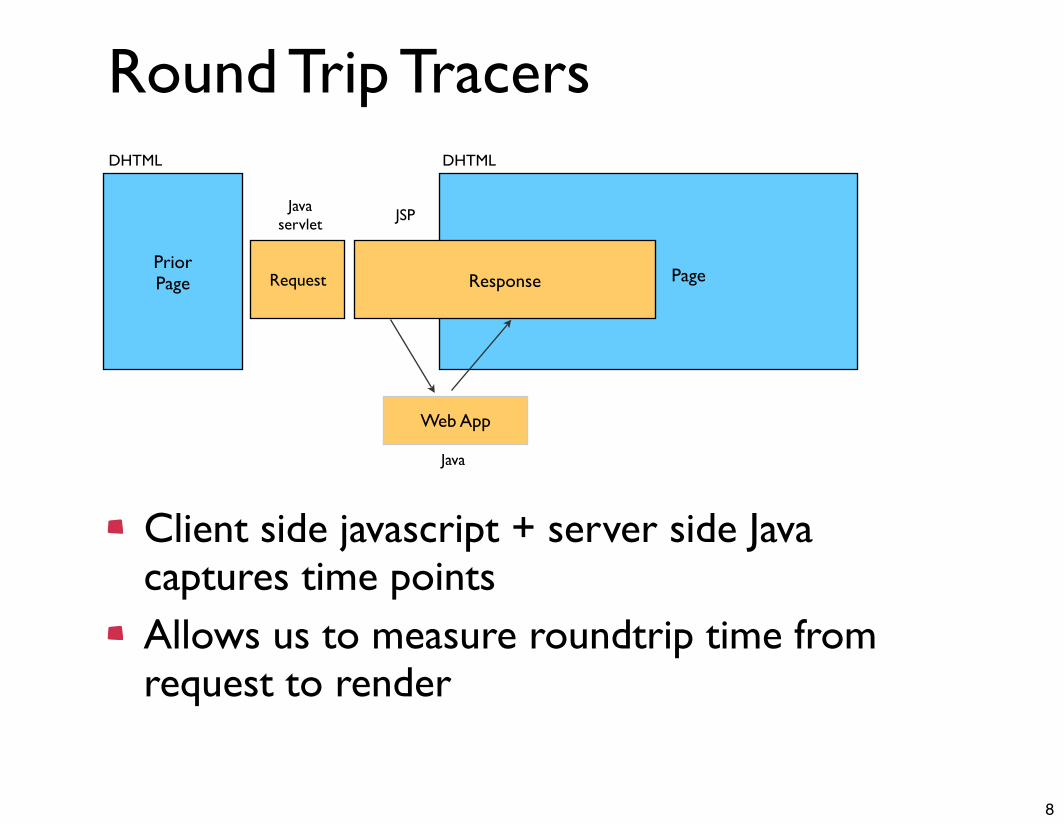
Round Trip Tracers
Client side javascript + server side Java captures time pointsAllows us to measure roundtrip time from request to render
PriorPage PageResponseRequest
Web App
Javaservlet
JSP
Java
DHTML DHTML
8
PriorPage
PageResponseRequest
Web App
js:unload()
Ajs:load()
G<HEAD> </BODY>
FD
CB Eservice()
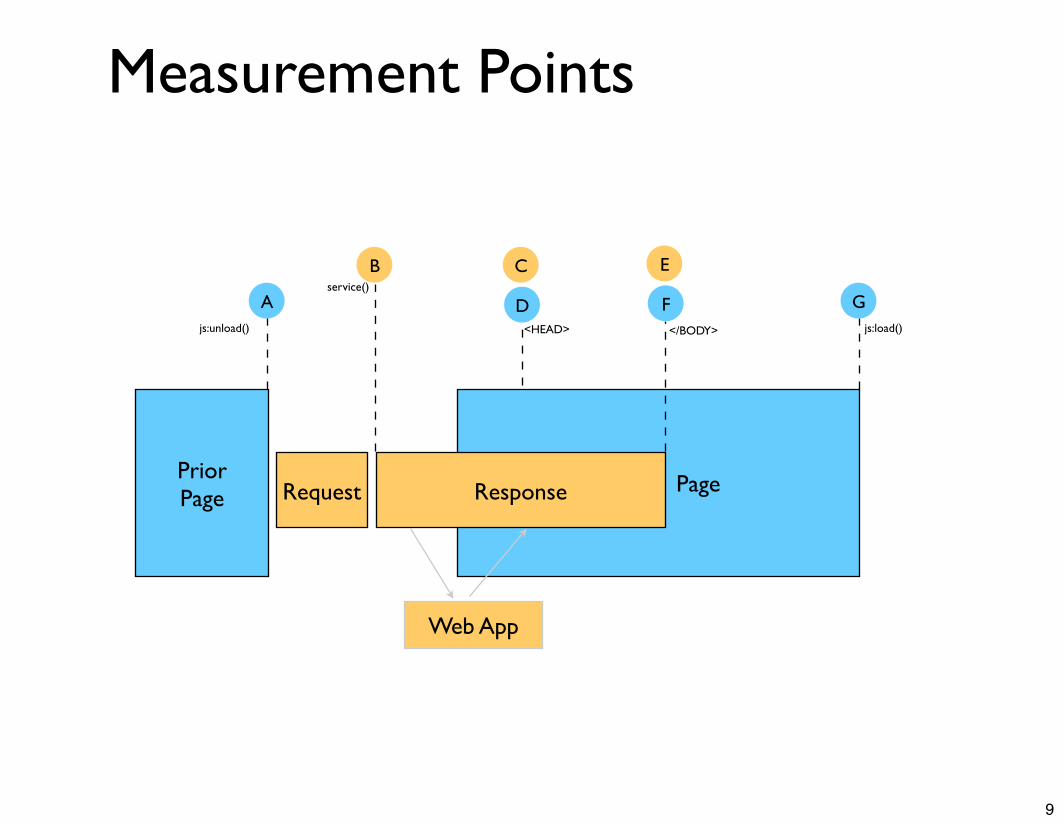
Measurement Points
9

PriorPage
PageResponseRequest
Web App
js:unload()
Ajs:load()
G<HEAD> </BODY>
FD
CB Eservice()
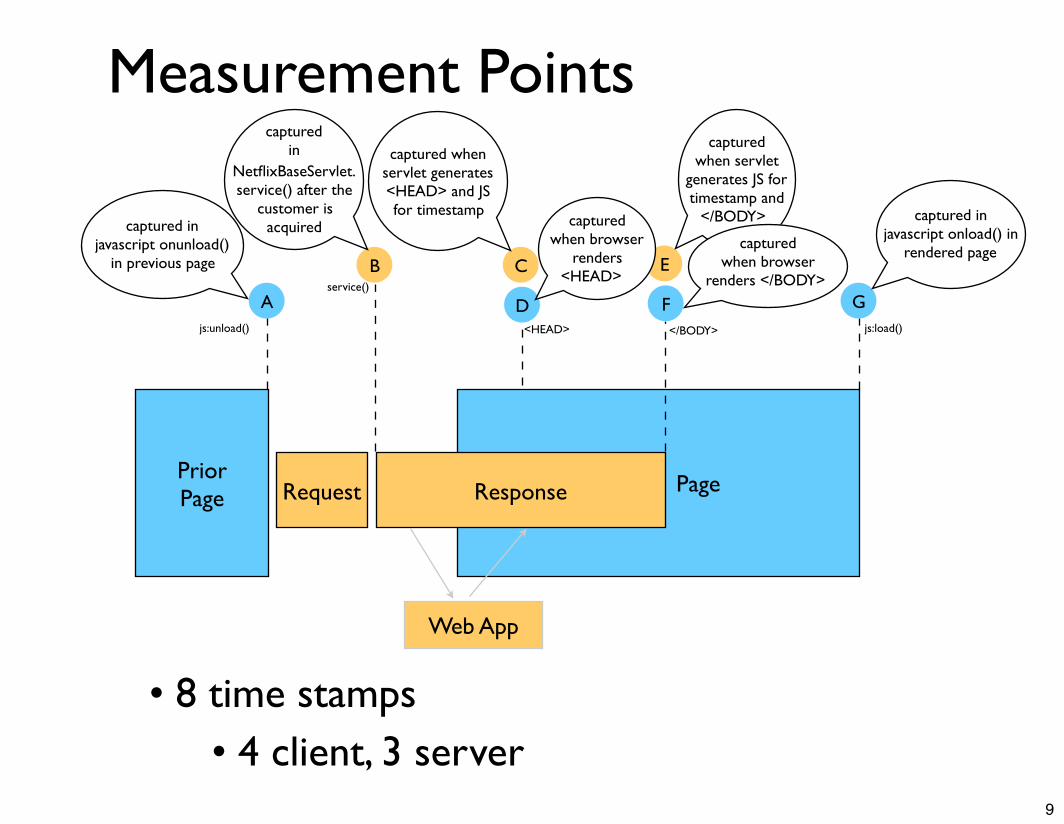
• 8 time stamps• 4 client, 3 server
Measurement Points
9
PriorPage
PageResponseRequest
Web App
js:unload()
Ajs:load()
G<HEAD> </BODY>
FD
CB Eservice()
• 8 time stamps• 4 client, 3 server
captured in
NetflixBaseServlet.service() after the
customer is acquiredcaptured in
javascript onunload() in previous page
captured when servlet generates <HEAD> and JS for timestamp
captured when servlet
generates JS for timestamp and
</BODY> captured in javascript onload() in
rendered page
captured when browser
renders <HEAD>
captured when browser
renders </BODY>
Measurement Points
9

PriorPage
PageResponseRequest
Web App
js:unload()
Ajs:load()
GF
CB E
D<HEAD>getTime()
getTime()</BODY>
emits <HEAD>
emits </BODY>service()
browser render time
10

PriorPage
PageResponseRequest
Web App
js:unload()
Ajs:load()
GF
CB E
D<HEAD>getTime()
getTime()</BODY>
emits <HEAD>
emits </BODY>service()
browser render time
• C&D and E&F are don’t happen together• servlet generation time vs browser
render time10

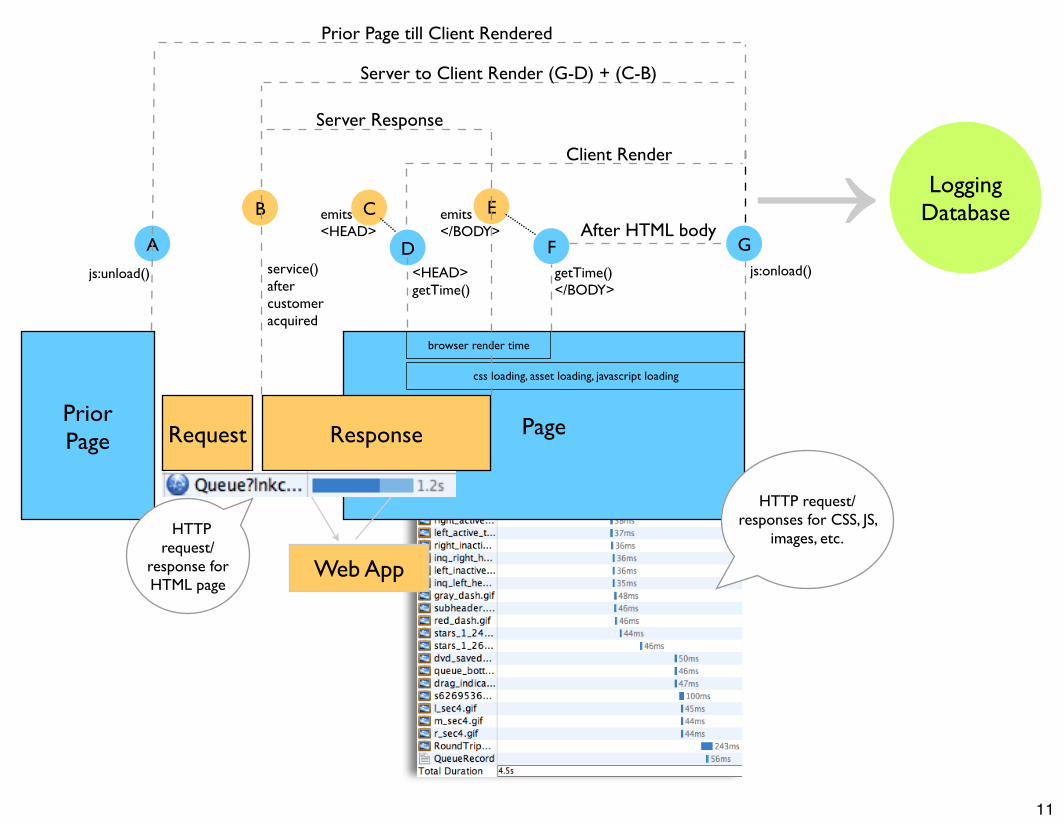
←
PriorPage
PageResponseRequest
Web App
js:unload() js:onload()<HEAD>getTime()
getTime()</BODY>
service()after customeracquired
emits <HEAD>
emits </BODY>
GFA D
CB E
browser render time
css loading, asset loading, javascript loading
Server Response
Client Render
After HTML body
Server to Client Render (G-D) + (C-B)
Prior Page till Client Rendered
LoggingDatabase
11

←
PriorPage
PageResponseRequest
Web App
js:unload() js:onload()<HEAD>getTime()
getTime()</BODY>
service()after customeracquired
emits <HEAD>
emits </BODY>
GFA D
CB E
HTTP request/
response for HTML page
browser render time
css loading, asset loading, javascript loading
Server Response
Client Render
After HTML body
Server to Client Render (G-D) + (C-B)
Prior Page till Client Rendered
LoggingDatabase
11
←
PriorPage
PageResponseRequest
Web App
js:unload() js:onload()<HEAD>getTime()
getTime()</BODY>
service()after customeracquired
emits <HEAD>
emits </BODY>
GFA D
CB E
HTTP request/responses for CSS, JS,
images, etc.HTTP
request/response for HTML page
browser render time
css loading, asset loading, javascript loading
Server Response
Client Render
After HTML body
Server to Client Render (G-D) + (C-B)
Prior Page till Client Rendered
LoggingDatabase
11

PriorPage
PageResponseRequest
Web App
js:unload() js:load()
GFservice()
C
elapsed_server_response (E-B)
elapsed_client_render (G-D)
elapsed_client_render_post_server (G-F)
elapsed_server_plus_client (G-D) + (C-B)
B E
D<HEAD>getTime()
getTime()</BODY>
emits <HEAD>
emits </BODY>
browser render time
elapsed_client_request (G-A)
A
12

PriorPage
PageResponseRequest
Web App
js:unload() js:load()
GFservice()
C
elapsed_server_response (E-B)
elapsed_client_render (G-D)
elapsed_client_render_post_server (G-F)
elapsed_server_plus_client (G-D) + (C-B)
B E
D<HEAD>getTime()
getTime()</BODY>
emits <HEAD>
emits </BODY>
browser render time
• 5 metric values; 2 on client, 2 on server, 1 timed on both (G-D) + (C-B)... there is a gap however
elapsed_client_request (G-A)
A
12
PriorPage
PageResponseRequest
Web App
Ajs:load()
GFservice()after customeracquired
C
elapsed_server_response = 691
elapsed_client_render = 2338
elapsed_client_render_post_server = 1425
elapsed_server_plus_client (G-D) + (C-B) = 2996 + D-C gap?
B E
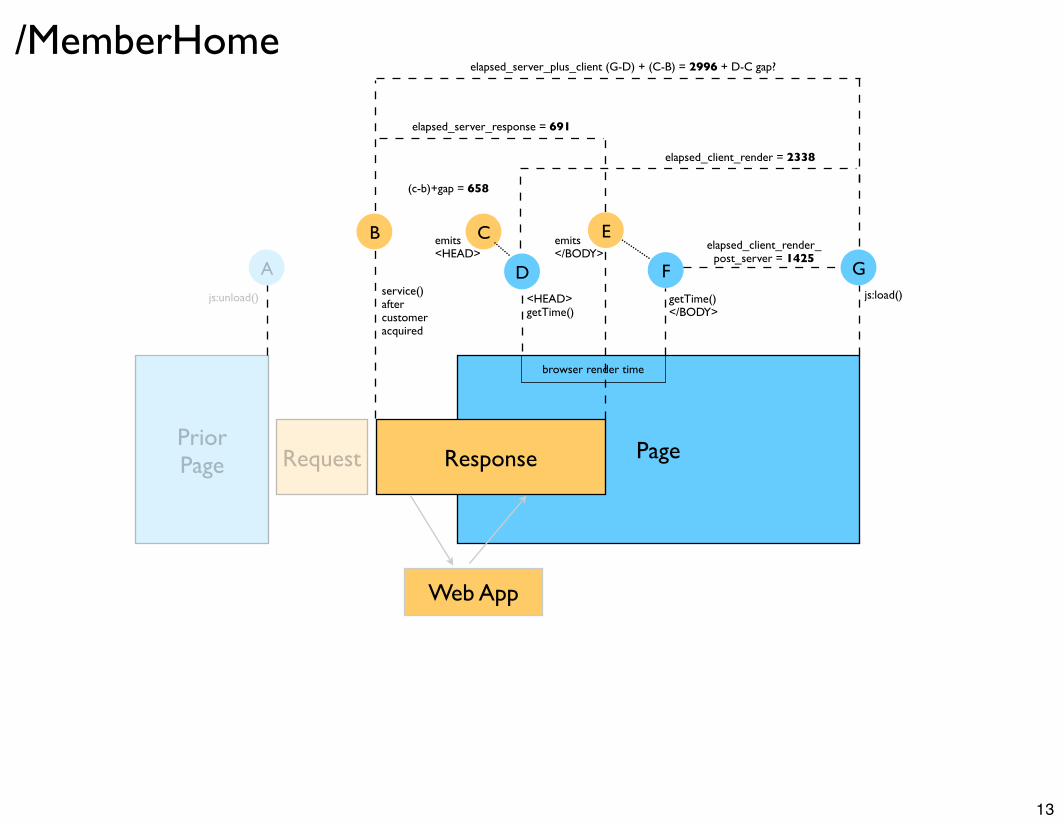
/MemberHome
D
(c-b)+gap = 658
<HEAD>getTime()
getTime()</BODY>
emits <HEAD>
emits </BODY>
browser render time
js:unload()
13

PriorPage
PageResponseRequest
Web App
Ajs:load()
GFservice()after customeracquired
C
elapsed_server_response = 691
elapsed_client_render = 2338
elapsed_client_render_post_server = 1425
elapsed_server_plus_client (G-D) + (C-B) = 2996 + D-C gap?
B E
/MemberHome
D
(c-b)+gap = 658
<HEAD>getTime()
getTime()</BODY>
emits <HEAD>
emits </BODY>
browser render time
js:unload()
• Navigated directly from another site (no G-A) available
13

PriorPage
PageResponseRequest
Web App
js:unload() js:onload()
G
<HEAD>getTime()
getTime()</BODY>
Fservice()after customeracquired
elapsed_server_response = 684
elapsed_client_render = 3091
elapsed_client_render_post_server = 533
elapsed_server_plus_client (G-D) + (C-B) = 3491 + D-C gap?
(c-b)+gap = 400
4310
819
browser render time
A
css loading, asset loading, javascript loading
emits <HEAD>
emits </BODY>
D
CB E
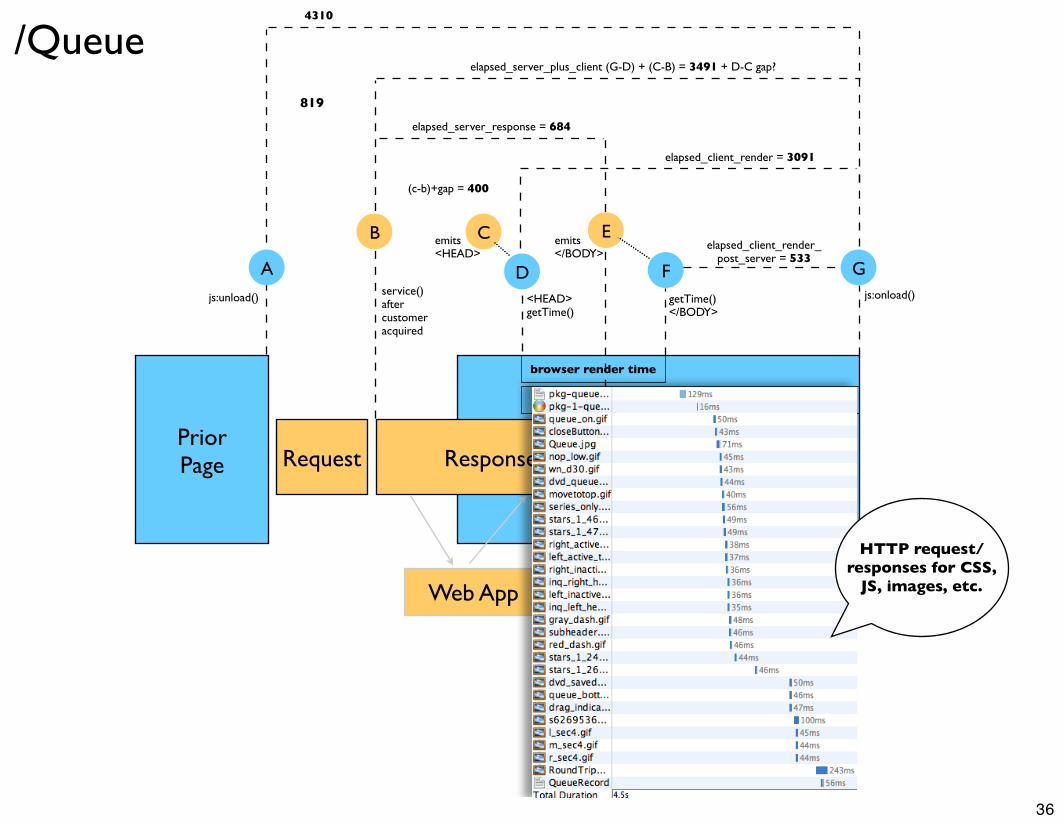
/Queue
14

PriorPage
PageResponseRequest
Web App
js:unload() js:onload()
G
<HEAD>getTime()
getTime()</BODY>
Fservice()after customeracquired
elapsed_server_response = 684
elapsed_client_render = 3091
elapsed_client_render_post_server = 533
elapsed_server_plus_client (G-D) + (C-B) = 3491 + D-C gap?
(c-b)+gap = 400
4310
819
browser render time
A
css loading, asset loading, javascript loading
emits <HEAD>
emits </BODY>
D
CB E
/Queue
HTTP request/
response for HTML page
14

PriorPage
PageResponseRequest
Web App
js:unload() js:onload()
G
<HEAD>getTime()
getTime()</BODY>
Fservice()after customeracquired
elapsed_server_response = 684
elapsed_client_render = 3091
elapsed_client_render_post_server = 533
elapsed_server_plus_client (G-D) + (C-B) = 3491 + D-C gap?
(c-b)+gap = 400
4310
819
browser render time
A
css loading, asset loading, javascript loading
emits <HEAD>
emits </BODY>
D
CB E
/Queue
HTTP request/responses for CSS, JS,
images, etc.
HTTP request/
response for HTML page
• Internal nav (G-A)• Network packets
happen in parallel14

What to Capture
Time-stampCustomer IDPage (logical name)URLReferrerFull round trip request timeServer Reponse timeClient render timeTime from HTML processing to OnloadServer Response + Client Render
15

What to Capture
DetailsIP addressUser agentConnection typeServer nameBrowserOSBandwidth test
16
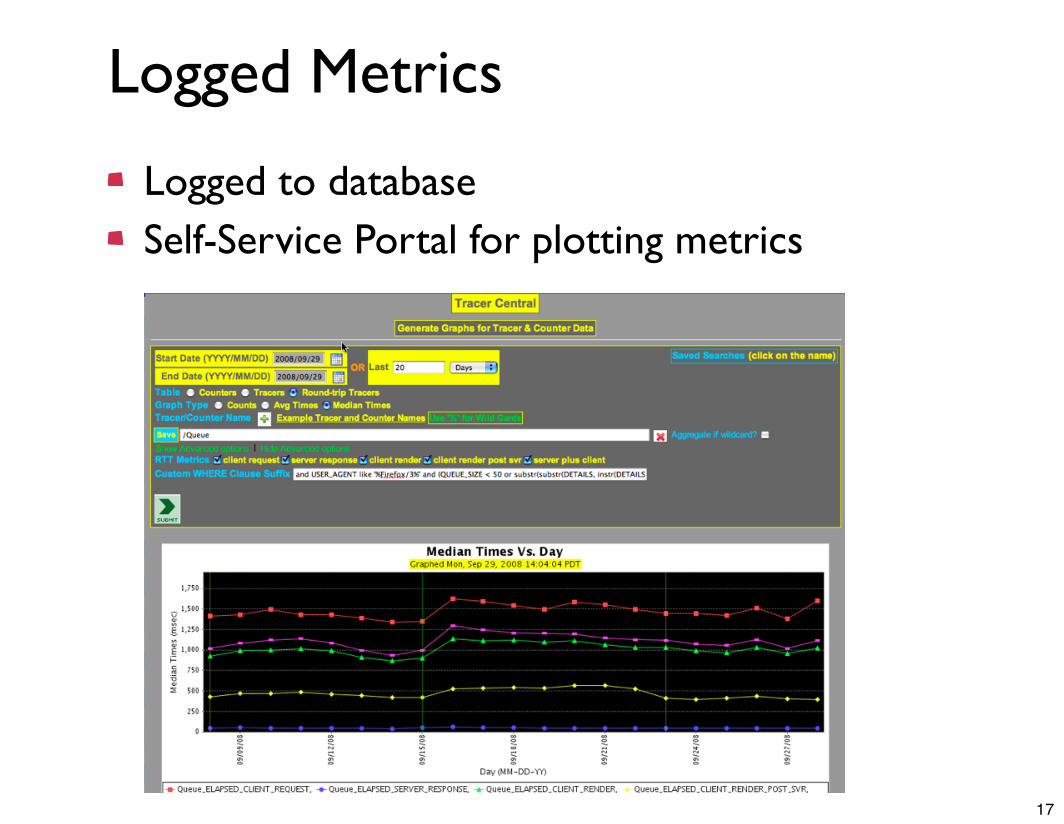
Logged Metrics
Logged to databaseSelf-Service Portal for plotting metrics
17

Firebug Extension
Firebug extension that shows real-time performance measures for a given page
18

Jiffy Firebug Extension
19
Performance Improvements
20

Performance Steps
GZIP HTML, Javascript and CSS(exception old netscape browsers and IE6 gets only compressed HTML)
Far future expires header for Javascript & CSSTurn off etags
These often force unnecessary requests, we don't use them so turning them off can help performance.
Proxy Cache ConfigurationFor browsers behind a proxy cache we tell the proxy server that we are handling this. This prevents some errors that might occur when a proxy cache server tries to serve up cached content for a browser that doesn't expect it (already served the URL to one that did).
21

GZIP
22

23

23
Rewriting Queue
Queue was completely re-written from scratch
Changed from Java generated HTML to JSP generated HTML
Migrated to Struts 2 Framework
Idea was to radically clean up old crusty code
24

Side effect: Larger payload due to whitespace in JSP
Queue Performance Degraded
0
1,250
2,500
3,750
5,000
<=20 21-100 101-250
Before RefactorAfter Refactor
25
Gzip Components
Can Gzip scripts, stylesheets, JSON, XML, etc.Reduces response size by about 70%90% of all traffic is handled by browsers that support gzipFor those browsers that don’t support gzip, apache supports Vary response headers automaticallyRequires apache configuration (mod_gzip or mod_deflate)
26

GZIP: Apache Configuration<Proxy *> SetOutputFilter DEFLATE</Proxy>
<Location /> # GZIP COMPRESSION. # For all browsers turn on html, css and javascript gzip compression # For old browsers turn OFF all gzip compression # For IE6 gzip html only
# Allow gzip compression for html, css, and javascript AddOutputFilterByType DEFLATE text/html text/javascript text/css application/x-javascript
# Netscape 4.x has some problems... BrowserMatch ^Mozilla/4 gzip-only-text/html
# Netscape 4.06-4.08 have some more problems BrowserMatch ^Mozilla/4\.0[678] no-gzip
# MSIE masquerades as Mozilla, but it is fine BrowserMatch \bMSIE\s7 !no-gzip !gzip-only-text/html
# Turn off gzip for images, pdf, zips and swfs SetEnvIfNoCase Request_URI \.(?:gif|jpe?g|png)$ no-gzip dont-vary SetEnvIfNoCase Request_URI \.pdf$ no-gzip dont-vary SetEnvIfNoCase Request_URI \.zip$ no-gzip dont-vary SetEnvIfNoCase Request_URI \.swf$ no-gzip dont-vary
</Location>
27

FFE, Cache Control, eTags<LocationMatch "\.(css$|js$)"> # Far Future Expires for Javascript and CSS Header set Expires "Thu, 15 Apr 2020 20:00:00 GMT"</LocationMatch>
<Location /> Header unset ETag FileETag None
#Header append Vary User-Agent env=!dont-vary Header set Cache-Control "private"
</Location>
28

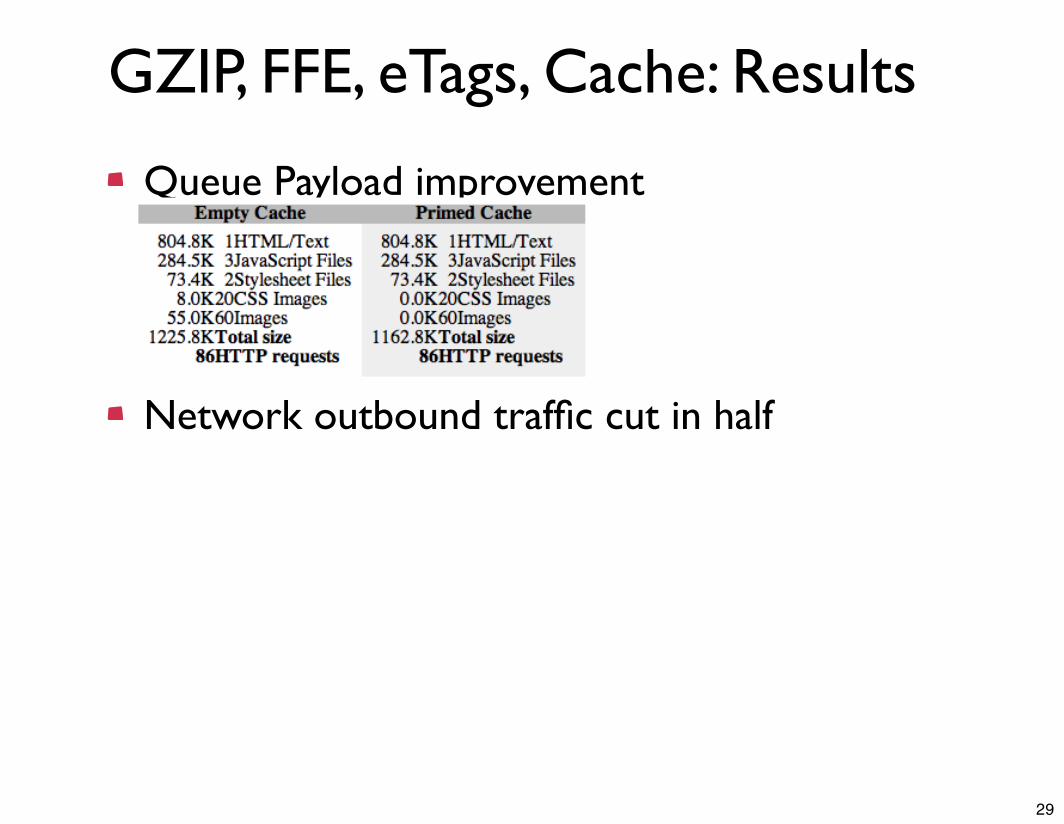
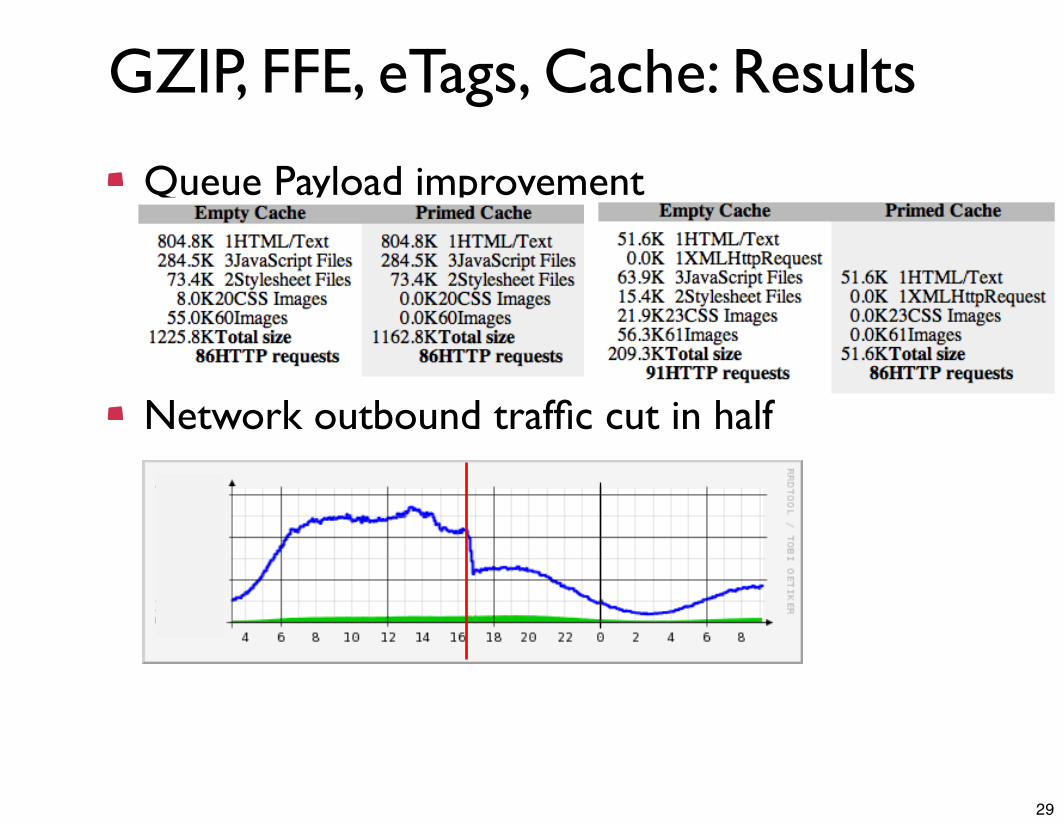
GZIP, FFE, eTags, Cache: Results
Queue Payload improvement
Network outbound traffic cut in half
29
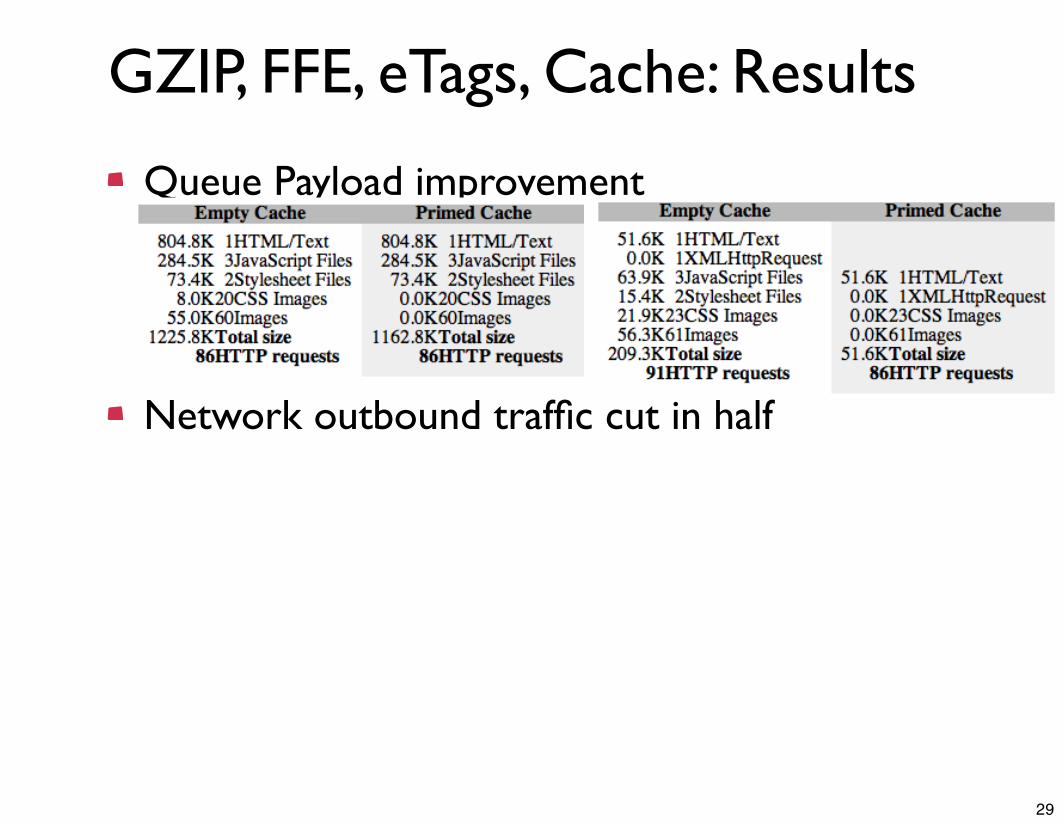
GZIP, FFE, eTags, Cache: Results
Queue Payload improvement
Network outbound traffic cut in half
29
GZIP, FFE, eTags, Cache: Results
Queue Payload improvement
Network outbound traffic cut in half
29
GZIP, FFE, eTags, Cache: Results
Queue Payload improvement
Network outbound traffic cut in half
29

GZIP, FFE, eTags, Cache: Results
Performance improvement: 13-25%
0
1,250
2,500
3,750
5,000
<=20 21-100 101-250
Before Refactor After Refactor After GZIP
30

Far Future Expires
Avoids unnecessary HTTP requestsRequires version naming of files (which we do for some files)Only aids those with an primed cacheWhat % come with empty cache?At Yahoo! it averaged 40-60%
31

How Browser Handles ExpiresWith Empty Cache (component not cached)
GET Request for component
With Primed Cache (component is cached)Has Far Futures Expires Header
- Browser finds in cache
- Determines not stale
- Reads from local cache
No FFE
- Does NOT have Far Future Expires Header
- Browser finds in cache
- Determines it is “stale” (expired)
- Makes a Conditional GET
- If it has not changed
- Reads from Local Cache
- If it has changed
- Performs a GET Request
32

There was an issue (Safari)
For a given HTTP request, the server may respond with a HTTP status of 204. This means ‘no content’ changed.
Used throughout Netflix site
Started in 2000 with first star bars on the web!
Once we turned on gzip, Apache for some reason attempted to compress NO CONTENT responsesSome builds of Safari 3 choked on this
33

Star Bars
34

Star Bars everywhere
35

Web App
PriorPage
PageResponseRequest
js:unload() js:onload()
G
<HEAD>getTime()
getTime()</BODY>
Fservice()after customeracquired
elapsed_server_response = 684
elapsed_client_render = 3091
elapsed_client_render_post_server = 533
elapsed_server_plus_client (G-D) + (C-B) = 3491 + D-C gap?
(c-b)+gap = 400
4310
819
browser render time
A
css loading, asset loading, javascript loading
emits <HEAD>
emits </BODY>
D
CB E
/Queue
36
Web App
PriorPage
PageResponseRequest
js:unload() js:onload()
G
<HEAD>getTime()
getTime()</BODY>
Fservice()after customeracquired
elapsed_server_response = 684
elapsed_client_render = 3091
elapsed_client_render_post_server = 533
elapsed_server_plus_client (G-D) + (C-B) = 3491 + D-C gap?
(c-b)+gap = 400
4310
819
browser render time
A
css loading, asset loading, javascript loading
emits <HEAD>
emits </BODY>
D
CB E
/Queue
HTTP request/responses for CSS,
JS, images, etc.
36

What HTTP requests?Where did the time go (180 item Q) Where did the time go (180 item Q)
Images 57.1% 3873 2500 Images 31.7% 3873
Javascript 7.3% 493 300 Star bars 25.4% 1723
CSS 1.3% 91 Javascript 7.3% 493
HTML 23.9% 1624 CSS 1.3% 91
Redirect 5.2% 356 HTML 23.9% 1624
Other 5.1% 346 Redirect 5.2% 356
6783 Other 5.1% 346
6783
Everthing Else 74.6%
Star bars 25.4% 1723 Everthing Else 74.6%
58%
7%
1%
24%
5%5%
Images
Javascript
CSS
HTML
Redirect
Other
Lots of Time for Star Bars
75%
25%
Everthing Else
Star bars
33%
25%
7%
1%
24%
5%5%
Images
Star bars
Javascript
CSS
HTML
Redirect
Other
37

Image Fetching is Costly
Where did the time go (180 item Q) Where did the time go (180 item Q)
Images 57.1% 3873 2500 Images 31.7% 3873
Javascript 7.3% 493 300 Star bars 25.4% 1723
CSS 1.3% 91 Javascript 7.3% 493
HTML 23.9% 1624 CSS 1.3% 91
Redirect 5.2% 356 HTML 23.9% 1624
Other 5.1% 346 Redirect 5.2% 356
6783 Other 5.1% 346
6783
Everthing Else 74.6%
Star bars 25.4% 1723 Everthing Else 74.6%
58%
7%
1%
24%
5%5%
Images
Javascript
CSS
HTML
Redirect
Other
Lots of Time for Star Bars
75%
25%
Everthing Else
Star bars
33%
25%
7%
1%
24%
5%5%
Images
Star bars
Javascript
CSS
HTML
Redirect
Other
38

Spriting Star BarsOriginally 51 separate images; not spritedNew version single sprite for all star bars
39

Surprising performance hit
40

What went wrong?
Old star bars did inline event attachmentonmouseover=””
generated with the page
New starbars attach events on DomReadywith hundreds of events to attach this can cause a slow down
Solutions (3)generate inline events (yuck)
change to container based event model (lots of global work)
use a flyweight pattern of a single interactive star bar shared across the page
Solution: inline events
41

After inline events: improved
Most members experienced another 10% improvement
42

Other Challenges
43

Large Table
IE7 & IE6 suck when rendering large tablesSome solutions
Break large table into smaller chunks
- Rendering is faster since triggering re-render of smaller table is faster than re-rendering large table
Used fixed layout for table to prevent re-rendering
Use progressive loading
- Either a manual approach to load additional
- Or dynamically load in the background
- Or a combination of both
44

JS at Bottom & CSS at Top
Scripts scattered throughout the pageCauses browsers to block while script code is executed
Queue ExampleTo speed up perceived page rendering time you can pre-load background images specified in CSS
However, this has to be near the top
On IE7 & IE6 this caused significant delays (5-10 seconds on large queue)
Removing the performance hack decreased page load time!<script>if (document.images) { img1 = new Image(); img2 = new Image(); img1.src = "../path/to/image-01.gif"; img2.src = "../path/to/image-02.gif";}</script>
45

Drag and Drop
The sheer number of rows (up to 500) can cause a page to croak for adding drag & drop
IssuesExploding number of event handlers (use container events)
Dynamic cursors in IE6 (avoid)
Class switching (instead use style switching)
Extra calculations for drop targets at drag start (e.g., 500 rows)
- Don’t measure everything. Measure prototypical row. Flag exceptions.
46

jQuery Optimization
Need: find drop targets dynamicallyNormal way was ok
But more obtuse way is faster
$(“td.dtc em”, “#dvd-queue”)
$("em", "#dvd-queue") .filter(function() { return this.parentNode.className === 'dtc'; })
47

Browser Variances
48

Browser Variance
Easy to forget that the experience varies greatly per browserBrowser share
IE7 50%
IE6 20%
FF3 22%
Safari 6%
49

Safari much faster
Queue median times all sizes
50

Crazy Mistakes
51

Oops
Script running got triggered by the loss of a boolean on the pageNotice slightly elevated (before moving JS to bottom)
IE 7> 250 Line returns
almost to normal
52

Oops
Simply removed a <STYLE> block in the middle of the page
IE 7> 250 Line returns
to normal
53

Lessons Learned
54
Lessons
Most of the Yahoo! recommendations are a sure bet (far futures, gzip, etag, etc.)The easiest win is gzipNot all pages are created equalA lot of time is spent fetching imagesNothing beats simple design, separation of concerns, clean architectureIt’s the little stuff multiplied that you have to watch out for
55

Lessons
The surest way to improve performance (and keep improving performance) is to measure, measure, measure
Use some way to capture the full user experience time
Be able to log & graph trends
Median works best
Make sure your numbers are statistically significant
Don’t be surprised by performance degradation when you expected performance improvement
56

Lessons
Browsers are not created equalSome browsers will eat your lunch (read IE)
Tools are essentialFirebug, round trip tracing, self-service dashboard, HammerHead, yslow, Toad, Excel, Jiffy Extension, Round Trip Extension, and old-fashioned instrumentation.
Science is messyE.O. Wilson
57