high performance concrete pavements project summary - federal
TRANSCRIPT
High Performance Concrete Pavements Project Summary
Office of Infrastructure Office of Pavement Technology Washington DC 20590
Publication No FHWA-IF-06-031 February 2006
wwwfhwadotgovpavement
Disclaimer
This document is disseminated under the sponsorship of the Department of Transportation in the interest of information exchange The US Govshyernment assumes no liability for its contents or use thereof This report does not constitute a standard specification or regulation
The US Government does not endorse products or manufacturers Trade or manufacturerrsquos names appear herein only because they are considered essential to the object of this document
Quality Assurance Statement
The Federal Highway Administration (FHWA) provides high-quality inshyformation to serve Government industry and the public in a manner that promotes public understanding Standards and policies are used to ensure and maximize the quality objectivity utility and integrity of its informashytion FHWA periodically reviews quality issues and adjusts its programs and processes to ensure continuous quality improvement
Units of Measure
This document follows the conventions of the reporting States in their use of English units or the International System of Units
ii
Table of Contents
List of Figures XIII
List of Tables XVII
CHAPTER 1 INTRODUCTION 1 Background1 Included Projects 1 Purpose and Overview of Report2 References5
CHAPTER 2 CALIFORNIA 1 (I-10 EL MONTE) 6 Introduction6 Study Objectives6 Project Design and Layout6 State Monitoring Activities6 Preliminary ResultsFindings6 Points of Contact6 References6
CHAPTER 3 COLORADO 1 (SH 121 WADSWORTH COLORADO) 7 Introduction7 Study Objectives7 Project Design and Layout7 State Monitoring Activities7 Preliminary ResultsFindings8 Current Project Status Results and Findings 8 Point of Contact 8 References8
CHAPTER 4 COLORADO 2 (I-25 LOVELAND) AND MICHIGAN 2 (M25 PORT AUSTIN AND I-675 ZILWAUKEE)9 Introduction9 Study Objectives9 Project Design and Layout9
Michigan Concept9 Colorado Concept 10
State Monitoring Activities10 Preliminary ResultsFindings10 Points of Contact11 References11
CHAPTER 5 ILLINOIS 1 (I-55 SB WILLIAMSVILLE) 12 Introduction12 Study Objectives12 Project Design and Layout12 State Monitoring Activities14 Preliminary ResultsFindings15 Interim Project Status Results and Findings15
iii
Current Observations (Gawedzinski 2004) 15 Points of Contact16 References16
CHAPTER 6 ILLINOIS 2 (ROUTE 59 NAPERVILLE) 18 Introduction18 Study Objectives18 Project Design and Layout18 State Monitoring Activities20 Preliminary ResultsFindings 22 Interim Project Status Results and Findings22 Current Observations (Gawedzinski 2004) 24 Points of Contact25 References25
CHAPTER 7 ILLINOIS 3 (US 67 JACKSONVILLE) 26 Introduction26 Study Objectives26 Project Design and Layout26 State Monitoring Activities27 Preliminary ResultsFindings28 Interim Project Status Results and Findings28 Current Observations (Gawedzinski 2004) 29 Points of Contact29 References29
CHAPTER 8 ILLINOIS 4 (ROUTE 2 DIXON)32 Introduction32 Study Objectives32 Project Design and Layout32 State Monitoring Activities32 Points of Contact34 References34
CHAPTER 9 INDIANA 1 (I-65 AT SR-60 CLARK COUNTY) 35 Introduction35 Study Objectives35 Project Design and Layout 35 State Monitoring Activities 36 Preliminary ResultsFindings 36 Points of Contact36 Reference 36
CHAPTER 10 IOWA 1 (A AND B) (HIGHWAY 5 CARLISLE AND US 30 CARROLL) 37 Introduction37 Study Objectives37 Project Design and Layout37 State Monitoring Activities38 ResultsFindings 39
iv
Points of Contact39 References39
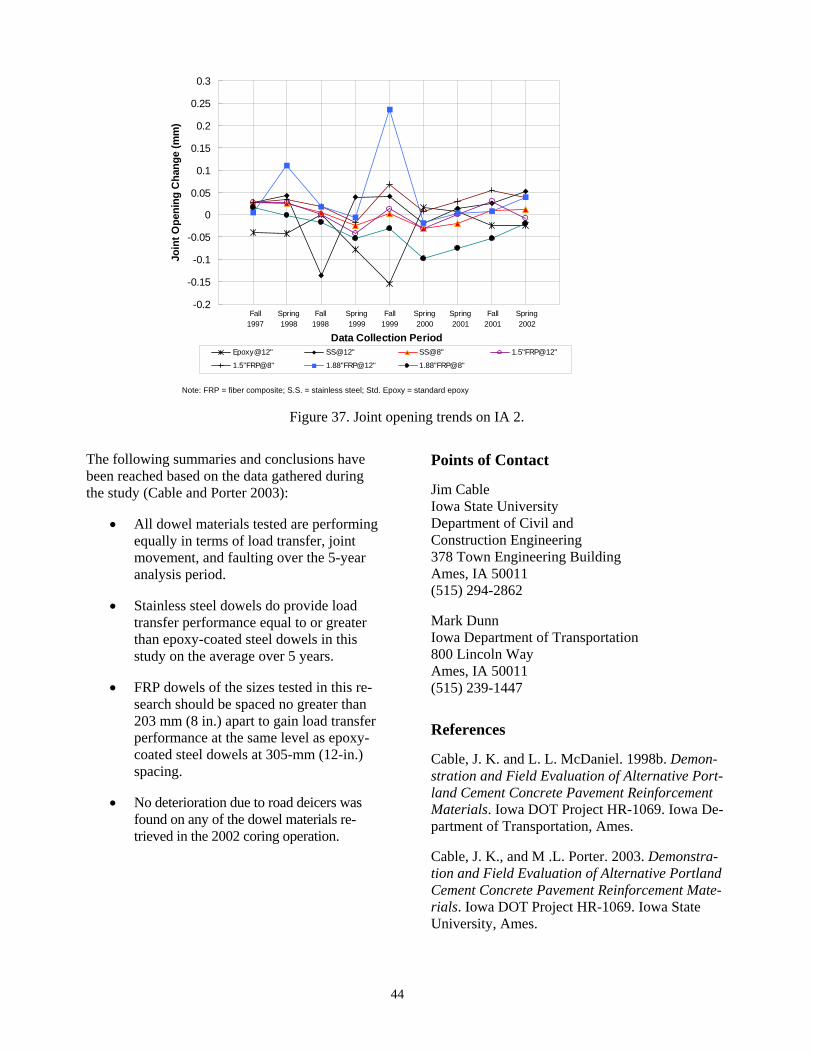
CHAPTER 11 IOWA 2 (US 65 DES MOINES) 40 Introduction40 Study Objectives40 Project Design and Layout40 State Monitoring Activities42 Preliminary ResultsFindings42 Final ResultsFindings 42 Points of Contact44 References44
CHAPTER 12 IOWA 3 (US 151 LYNNJONES COUNTIES) 45 Introduction45 Study Objectives45 Project Design and Layout45 State Monitoring 45 Preliminary ResultsFindings45 Points of Contact46 References46
CHAPTER 13 IOWA 4 (IA 330 JASPER STORY AND MARSHALL COUNTIES) 47 Introduction47 Study Objectives47 Project Design and Layout47 State Monitoring Activities48 Preliminary ResultsFindings48 Points of Contact48 References48
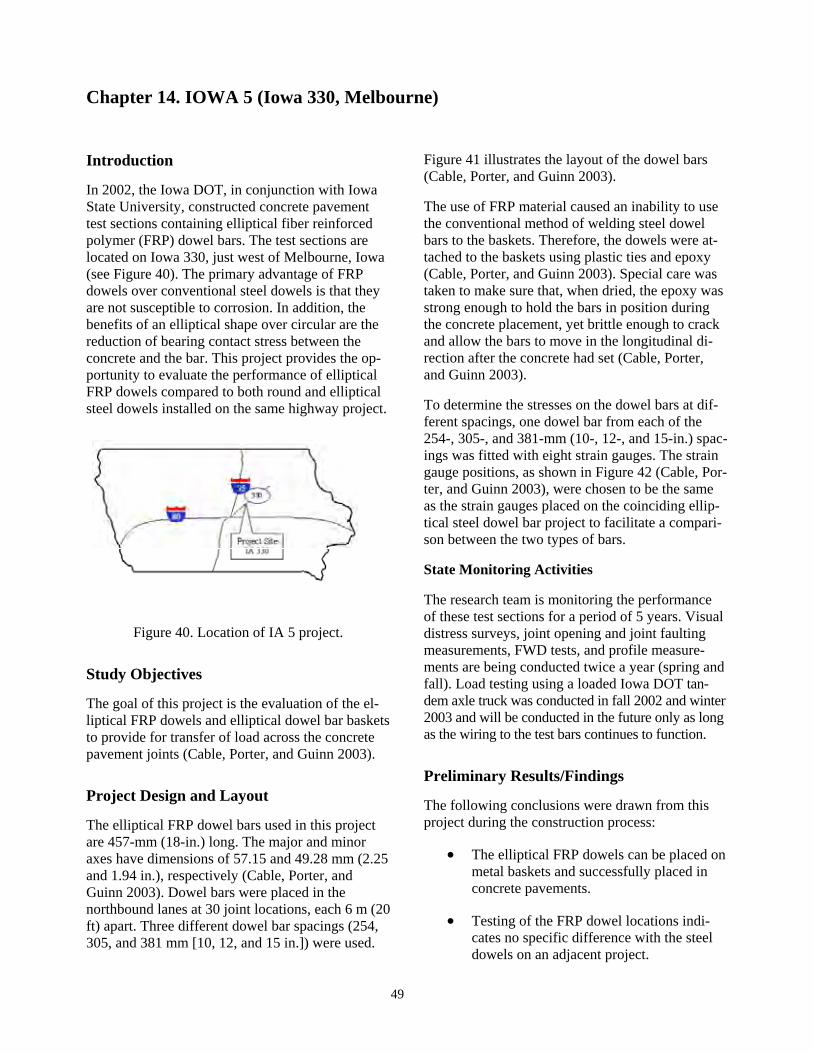
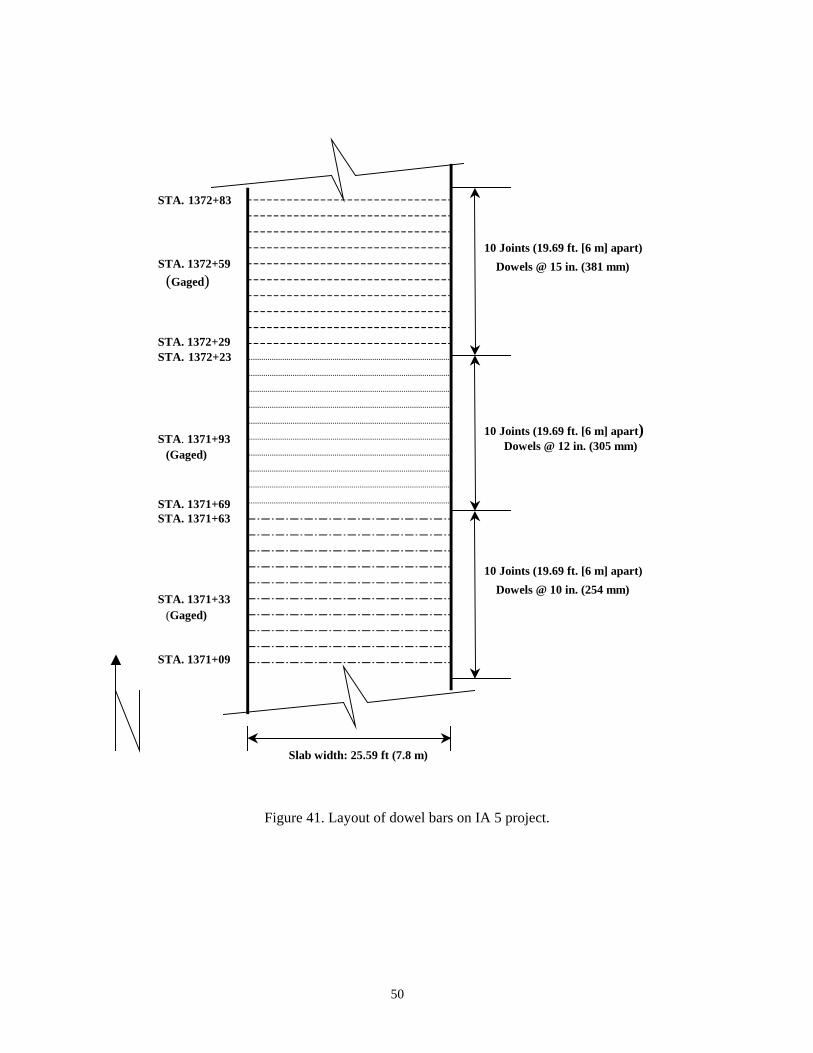
CHAPTER 14 IOWA 5 (IOWA 330 MELBOURNE) 49 Introduction49 Study Objectives49 Project Design and Layout49 Preliminary ResultsFindings49 Points of Contact51 Reference 51
CHAPTER 15 IOWA 6 (VARIOUS LOCATIONS)52 Introduction52 Study Objectives52 Project Design and Layout52 State Monitoring Activities52 Preliminary ResultsFindings52 Points of Contact52 Reference 52
v
CHAPTER 16 IOWA 7 AND MD 2 (IMPLEMENTATION OF TEMP) 53 Introduction53 Study Objectives53 Project Design and Layout53 State Monitoring Activities54 Preliminary ResultsFindings54 Point of Contact 54 References54
CHAPTER 17 KANSAS 1 (HIGHWAY K-96 HAVEN) 55 Introduction55 Study Objectives55 Project Design and Layout55 State Monitoring Activities60
Construction Monitoring60 Early Mix Property Data60 Performance Monitoring60
Preliminary ResultsFindings60 Cost Data61 Early Performance Data63
Interim ResultsFindings64 References64
CHAPTER 18 KANSAS 2 (HUTCHINSON) 67 Introduction67 Study Objectives67 Project Design and Layout67 State Monitoring Activities67 Preliminary ResultsFindings67 Point of Contact 67 References67
CHAPTER 19 MARYLAND 1 (US 50 SALISBURY BYPASS) 68 Introduction68 Study Objectives68 Project Design and Layout68 State Monitoring Activities69 Interim ResultsFindings69 Points of Contact70 References70
CHAPTER 20 MICHIGAN 1 (I-75 DETROIT)71 Introduction71 Study Objectives71 Project Design and Layout71
Section 1mdashMichigan Standard Pavement72 Section 2mdashEuropean Pavement72
State Monitoring Activities75
vi
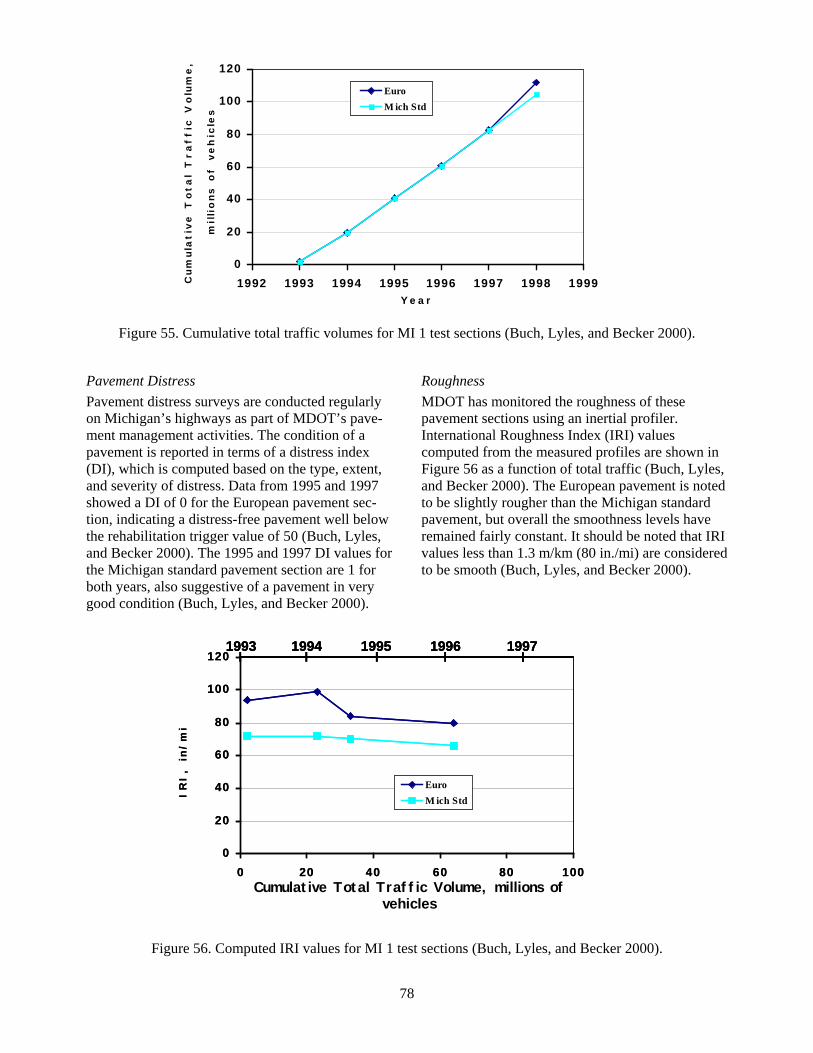
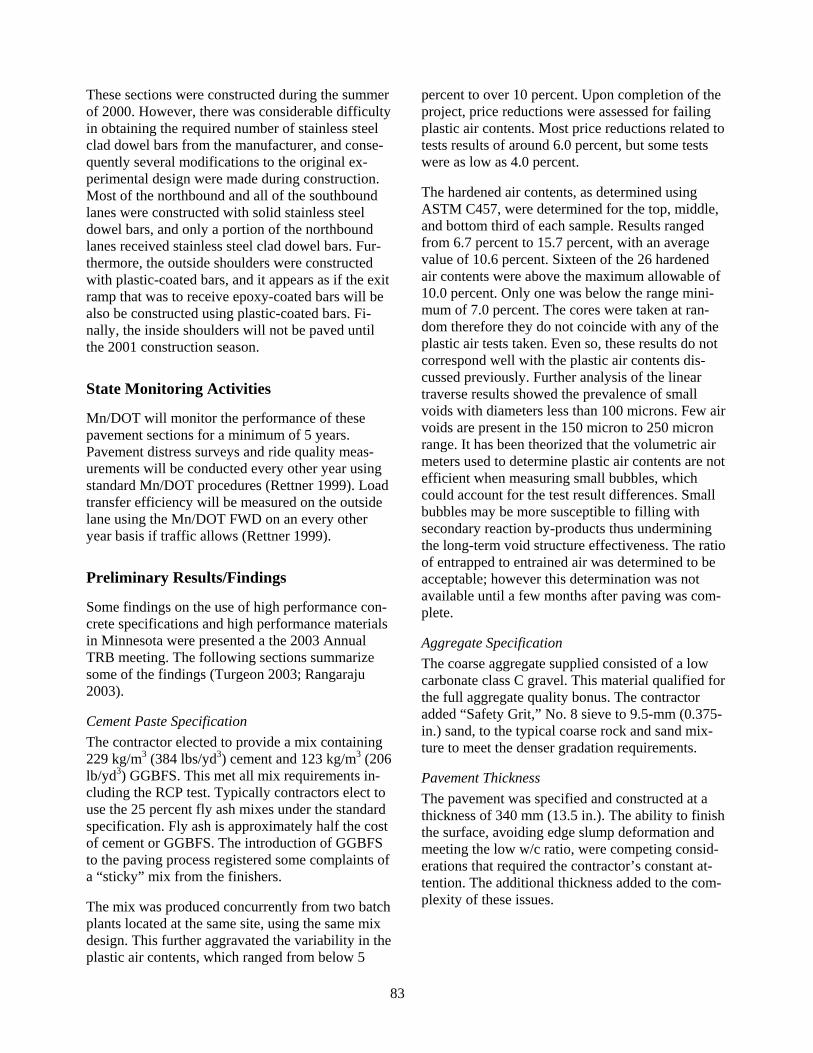
ResultsFindings 76 Initial Construction Findings 76 One-Year Performance Findings 77 Five-Year Performance Findings77 Traffic 77 Pavement Distress78 Roughness 78 Deflection Analysis79 Surface Friction79 Economic Analysis of Pavement Sections79
Point of Contact 80 References80
CHAPTER 21 MINNESOTA 1 (I-35W RICHFIELD) 81 Introduction81 Study Objectives81 Project Design and Layout81 State Monitoring Activities83 Preliminary ResultsFindings83
Cement Paste Specification83 Aggregate Specification83 Pavement Thickness83 Load Transfer84 Cost 84
Point of Contact 84 References84
CHAPTER 22 MINNESOTA 2 (MNROAD LOW-VOLUME ROAD FACILITY) 85 Introduction85 Study Objectives86 Project Design and Layout86 State Monitoring Activities88 Preliminary Results and Findings88 Point of Contact 91 References91
CHAPTER 23 MINNESOTA 3 (MNROAD MAINLINE ROAD FACILITY AND US 169 ALBERTVILLE) 92 Introduction92 Study Objectives92 Project Design and Layout92 State Monitoring Activities96 Preliminary ResultsFindings96 Current Project Status Results and Findings 96
CHAPTER 24 MISSISSIPPI 1 (US 72 CORINTH)98 Introduction98 Study Objectives98 Project Design and Layout98
vii
State Monitoring Activities101 Construction Monitoring101 Performance Monitoring101
Preliminary ResultsFindings101 Point of Contact 102 References102
CHAPTER 25 MISSOURI 1 (I-29 ROCK PORT)103 Introduction103 Study Objectives103 Project Design and Layout103 State Monitoring Activities105 Preliminary ResultsFindings105 Interim ResultsFindings106 Point of Contact 107 References107
CHAPTER 26 NEW HAMPSHIRE HPCP PROJECT108 Introduction108 Study Objectives108 ResultsFindings 108
HPCP Definitions 108 Optimization Computer Program108 Program Availability110
Point of Contact 110 References110
CHAPTER 27 OHIO 1 2 AND 3 (US ROUTE 50 ATHENS) 111 Introduction111 Study Objectives111 Project Design and Layout111
General Design Information 111 Project Layout Information113
OH 1 Evaluation of Ground Granulated Blast Furnace Slag 113 OH 3 Evaluation of Joint Sealing Materials 115
State Monitoring Activities115 ResultsFindings 115
OH 1 Evaluation of Ground Granulated Blast Furnace Slag115 OH 2 Evaluation of Alternative Dowel Bars 117 OH 3 Evaluation of Joint Sealing Materials 118
Points of Contact120 References120
CHAPTER 28 OHIO 4 (US 35 JAMESTOWN) 121 Introduction121 Study Objectives121 Project Design and Layout121 State Monitoring Activities121 ResultsFindings 122
viii
Points of Contact123 Reference 123
CHAPTER 29 PENNSYLVANIA 1 (SR 22 MURRYSVILLE)124 Introduction124 Study Objectives124 Project Design and Layout124 State Monitoring Activities124 Preliminary ResultsFindings124 Point of Contact 125
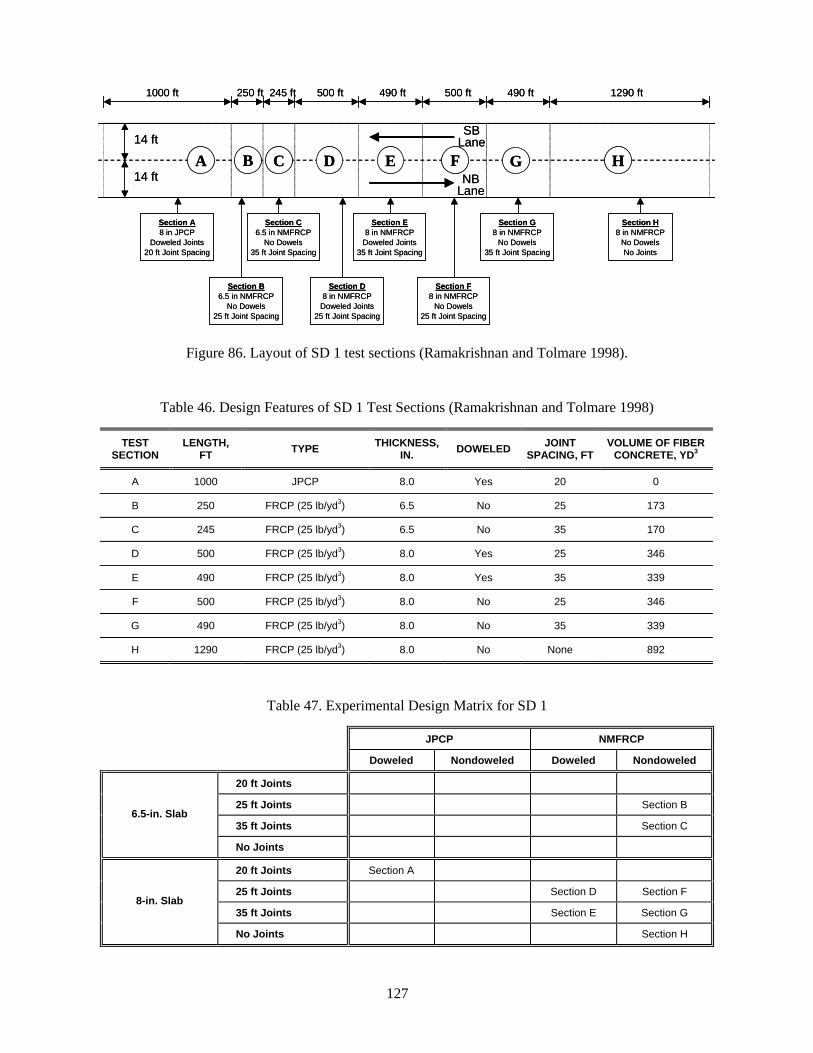
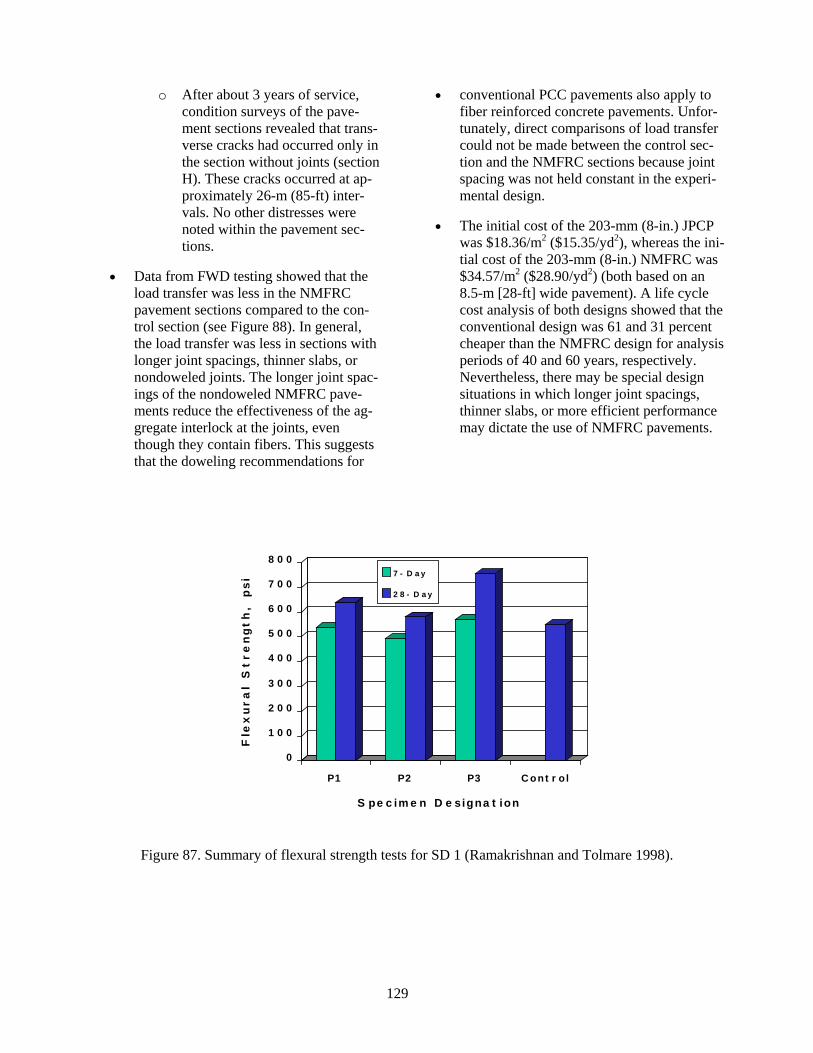
CHAPTER 30 SOUTH DAKOTA 1 (US ROUTE 83 PIERRE)126 Introduction126 Study Objectives126 Project Design and Layout126 Preliminary ResultsFindings128 Interim ResultsFindings130 Points of Contact130 References130
CHAPTER 31 TENNESSEE 1 (I-65 NASHVILLE) 131 Introduction131 Study Objectives131 Project Design and Layout131 State Monitoring Activities131 Preliminary ResultsFindings131 Point of Contact 132 Reference 132
CHAPTER 32 VIRGINIA 1 (I-64 NEWPORT NEWS) 133 Introduction133 Study Objectives133 Project Design and Layout133 State Monitoring Activities135 Preliminary ResultsFindings137 Project Status 137 Point of Contact 137 References137
CHAPTER 33 VIRGINIA 2 (ROUTE 288 RICHMOND) AND VIRGINIA 3 (US 29 MADISON HEIGHTS)138 Introduction138 Study Objectives138 Project Design and Layout138 State Monitoring Activities138 Preliminary ResultsFindings138 Point of Contact 138
ix
CHAPTER 34 WASHINGTON 1 (SR 395 KENNEWICK)139 Introduction139 Study Objectives139 Project Design and Layout139
Public Relations and Traffic Management 139 Concrete Mixture Properties 139 Construction140
ResultsFindings 142 Points of Contact142 Reference 142
CHAPTER 35 WEST VIRGINIA 1143 Introduction143 Study Objectives143
GFRP Dowel Study143 Moisture Diffusion Study 143 GFRP Rebars in CRCP Study143
Project Design and Layout144 GFRP Dowel Study144 Moisture Diffusion Study 144 GFRP Rebars in CRCP Study144
Current Project Status Results and Findings 144 Findings from GFRP Dowel Study144 Findings from GFRP CRCP Study 145
Points of Contact146 References146
CHAPTER 36 WISCONSIN 1 (HIGHWAY 29 ABBOTSFORD)147 Introduction147 Study Objectives147 Project Design and Layout147
New Wisconsin Sections148 Additional Analysis Sections148 Additional Wisconsin Sections 148 Colorado Sections 149 Iowa Sections 149 Michigan Sections 149 Minnesota Sections 149 North Dakota Sections 149
State Monitoring Activities150 ResultsFindings 150 Points of Contact152 References152
x
CHAPTER 37 WISCONSIN 2 (HIGHWAY 29 OWEN) AND WISCONSIN 3 (HIGHWAY 29 HATLEY)154 Introduction154 Study Objectives154 Project Design and Layout154
Wisconsin 2154 Wisconsin 3157
State Monitoring Activities159 Preliminary ResultsFindings159
Construction Monitoring159 Dowel Bar Location Study159 FWD Testing160 Distress Surveys160 Ride Quality Surveys 160
Points of Contact161 References161
CHAPTER 38 WISCONSIN 4 (I-90 TOMAH) 163 Introduction163 Study Objectives163 Project Design and Layout163 State Monitoring Activities164 Preliminary ResultsFindings164 Points of Contact165 Reference 165
CHAPTER 39 FEDERAL HIGHWAY ADMINISTRATION 1 (FHWArsquoS PAVEMENT TEST FACILITY MCLEAN VA) 166 Introduction166 Study Objectives166 Project Design and Layout166 State Monitoring Activities167 Preliminary ResultsFindings167 Current Project Status Results and Findings 167 Point of Contact 168 References169
CHAPTER 40 VARIOUS STATES MIT SCAN-2170 Introduction170 Study Objectives170 Project Design and Layout171 Preliminary ResultsFindings171
Literature Review Summary 171 Laboratory Testing Results 171 Field Testing Results171
Point of Contact 172 Reference 172
xi
APPENDIX A TE-30 PROJECT SUMMARY TABLE174
APPENDIX B 179
BIBLIOGRAPHIC LISTING OF PROJECT REFERENCES BY STATE 179 Colorado 179 Illinois 179 Indiana 179 Iowa 179 Kansas180 Maryland180 Michigan 180 Minnesota 180 Mississippi 181 Missouri 181 New Hampshire 181 Ohio 181 South Dakota 182 Tennessee182 Virginia 182 Washington 182 West Virginia182 Wisconsin 183
xii
List of Figures
Figure 1 Location of TE-30 and related projects2
Figure 2 Location of CO 2 project9
Figure 3 Precast panel design for Michigan 10
Figure 4 Precast panel installation in Colorado11
Figure 5 Location of IL 1 project 12
Figure 6 Illinois DOT hinge joint design (IDOT 1989) 13
Figure 7 Layout of IL 1 project 13
Figure 8 Load transfer efficiency on IL 1 (Gawedzinski 2000) 14
Figure 9 Maximum joint deflections on IL 1 (Gawedzinski 2000) 15
Figure 10 Load transfer efficiency vs ESALs (Gawedzinski 2004) 17
Figure 11 Load transfer efficiency vs pavement temperature (Gawedzinski 2004) 17
Figure 13 Layout of IL 2 project 19
Figure 14 Load transfer efficiency on IL 2 (Gawedzinski 2000) 21
Figure 15 Maximum joint deflections on IL 2 (Gawedzinski 2000) 21
Figure 16 Load transfer efficiency vs ESALs for the right lane (Gawedzinski 2004) 23
Figure 17 Load transfer efficiency vs ESALs for the center lane (Gawedzinski 2004) 23
Figure 18 Load transfer efficiency vs ESALs for the left lane (Gawedzinski 2004) 24
Figure 19 Average load transfer efficiency vs pavement temperature for all lanes (Gawedzinski 2004) 25
Figure 20 Location of IL 3 project 26
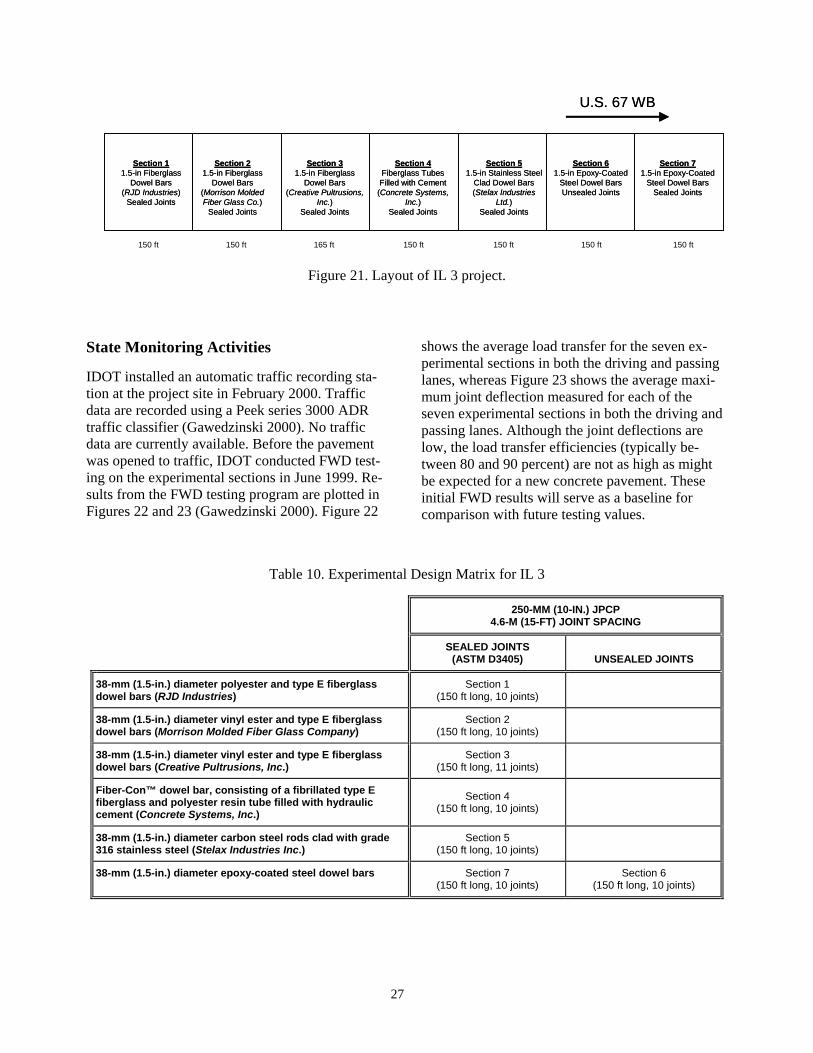
Figure 21 Layout of IL 3 project 27
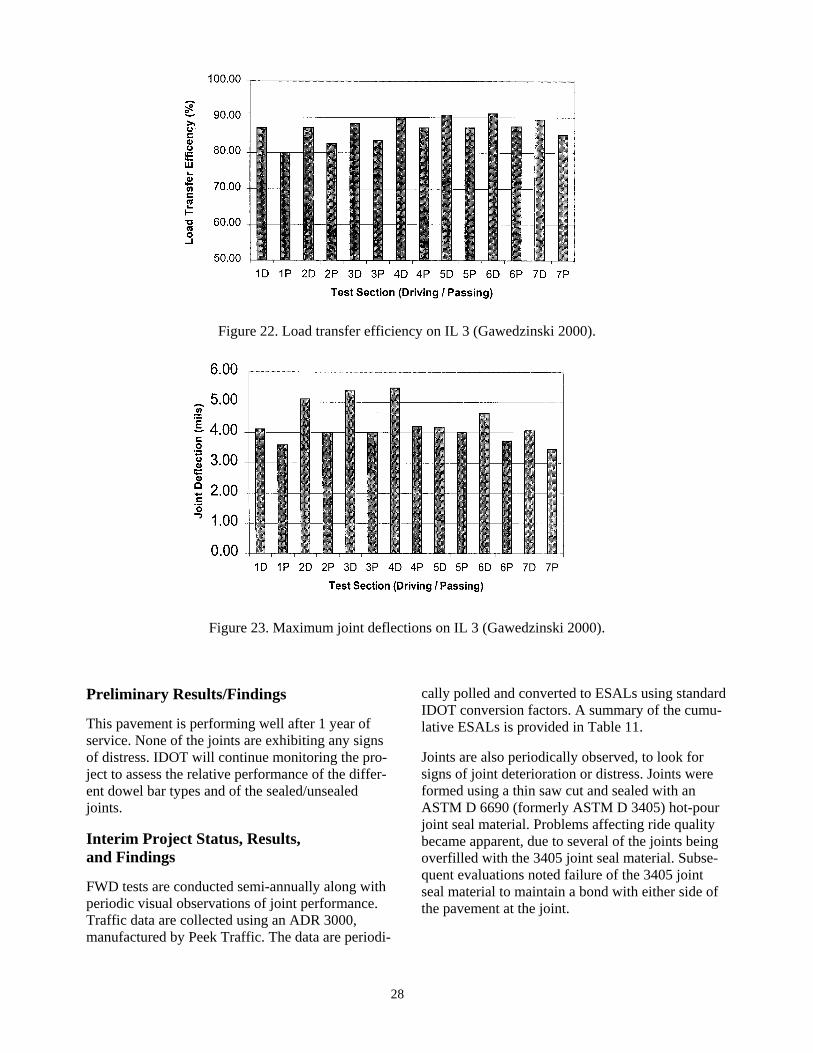
Figure 22 Load transfer efficiency on IL 3 (Gawedzinski 2000) 28
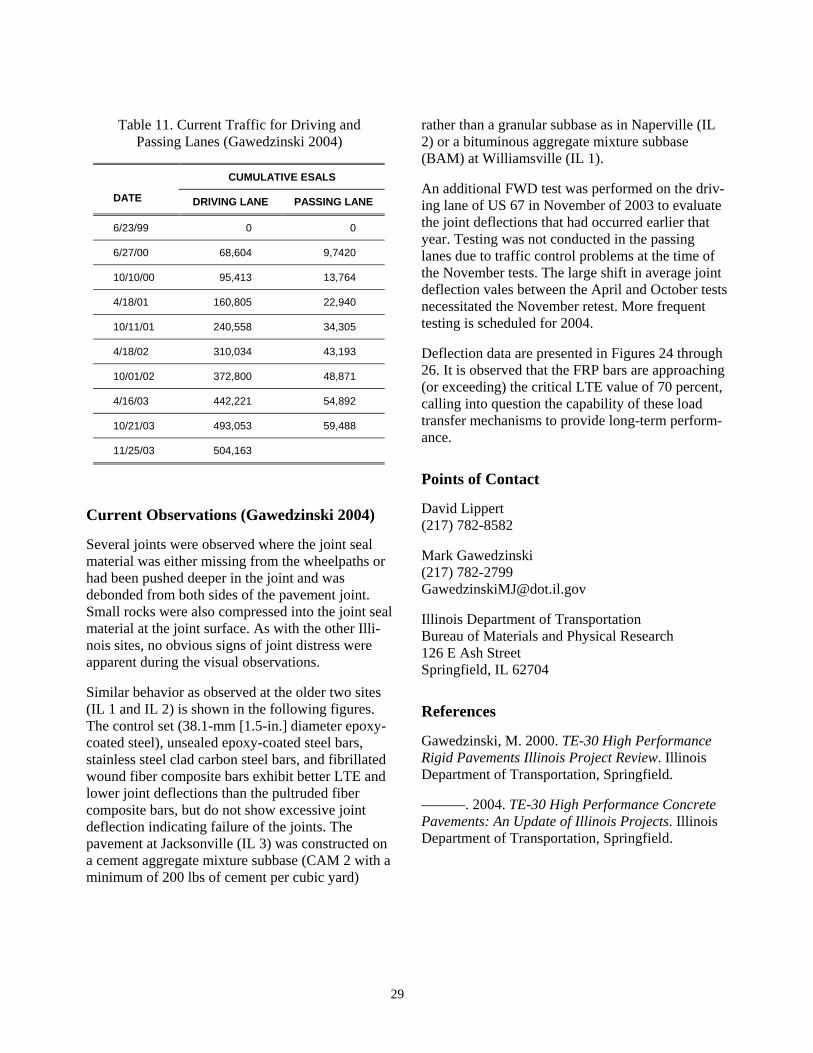
Figure 23 Maximum joint deflections on IL 3 (Gawedzinski 2000) 28
Figure 24 Driving lane load transfer efficiency vs ESALs (Gawedzinski 2004) 30
Figure 25 Passing lane load transfer efficiency vs ESALs (Gawedzinski 2004) 30
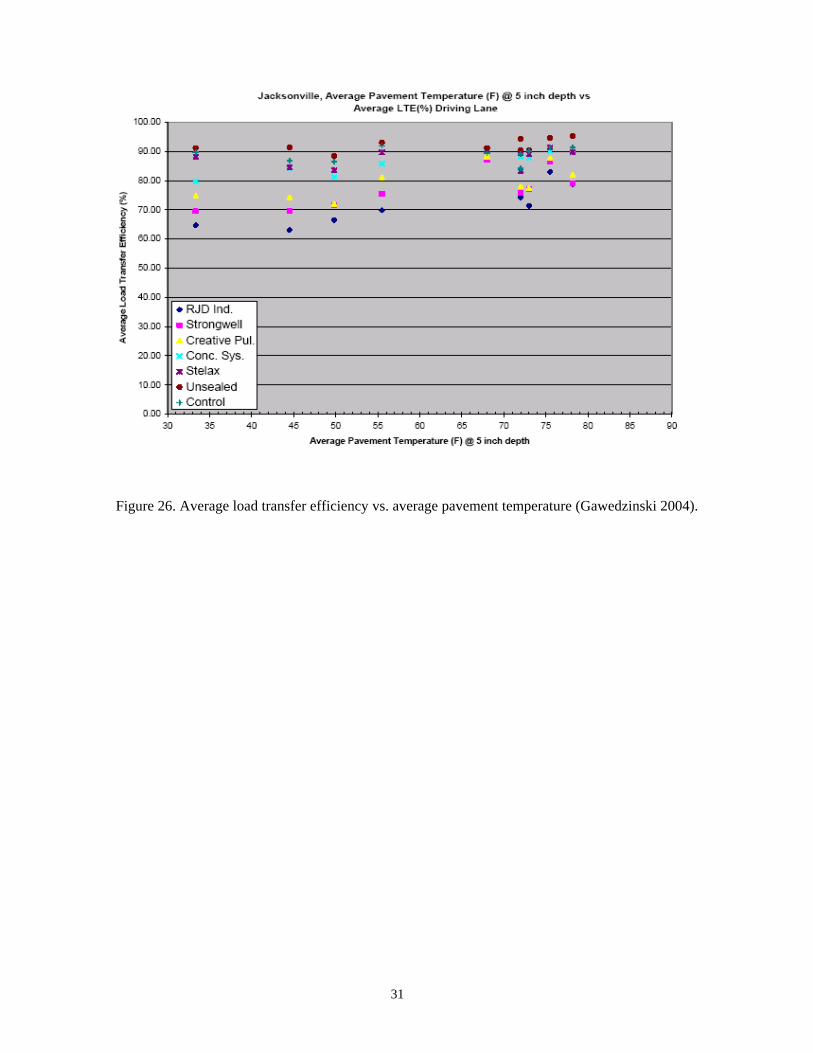
Figure 26 Average load transfer efficiency vs average pavement temperature (Gawedzinski 2004) 31
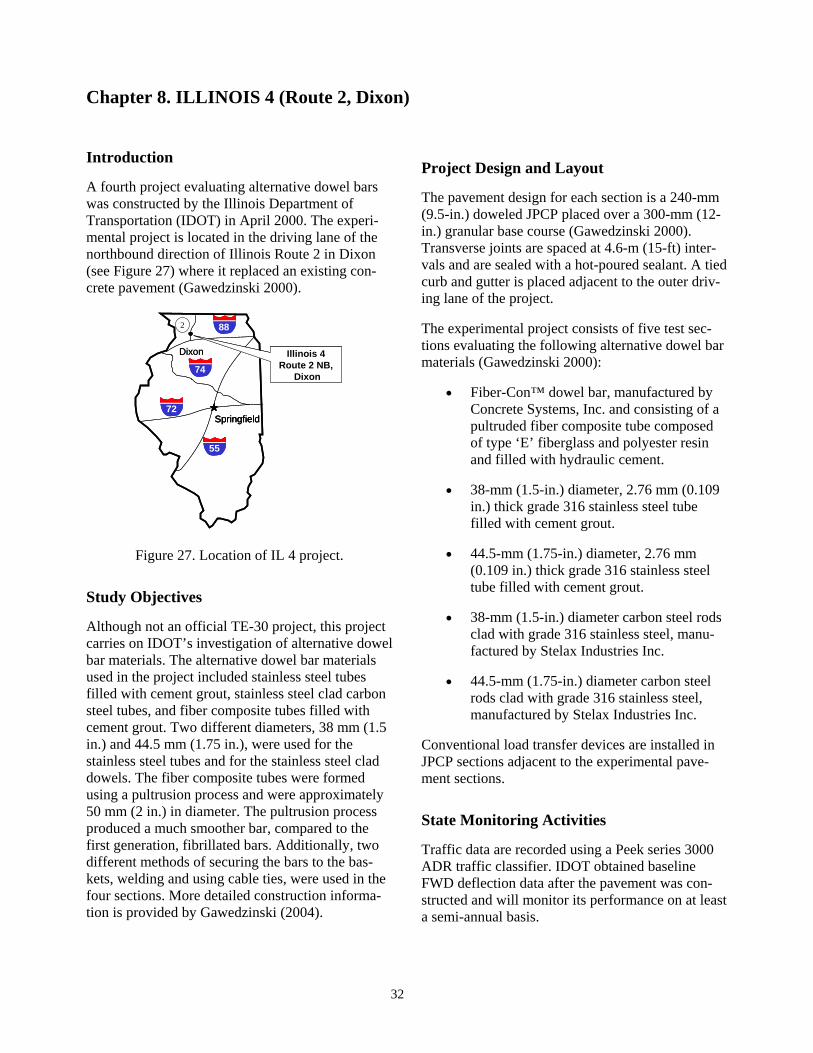
Figure 27 Location of IL 4 project 32
Figure 28 Driving lane load transfer efficiency vs ESALs (Gawedzinski 2004) 33
Figure 29 Average load transfer efficiency vs average pavement temperature (Gawedzinski 2004) 34
xiii
Figure 30 Location of IN 1 project35
Figure 31 Location of IA 1 projects 37
Figure 32 Location of IA 2 project 40
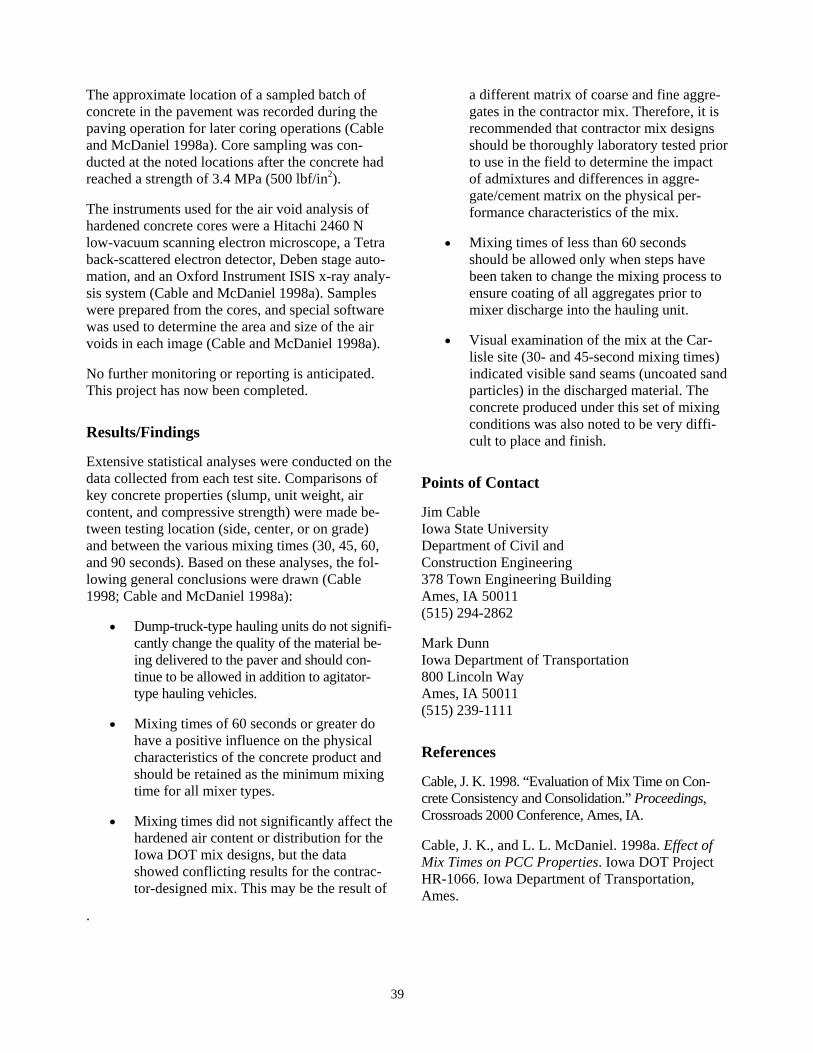
Figure 33 Layout of IA 2 project41
Figure 34 Illustration of dowel bar spacing configurations on IA 241
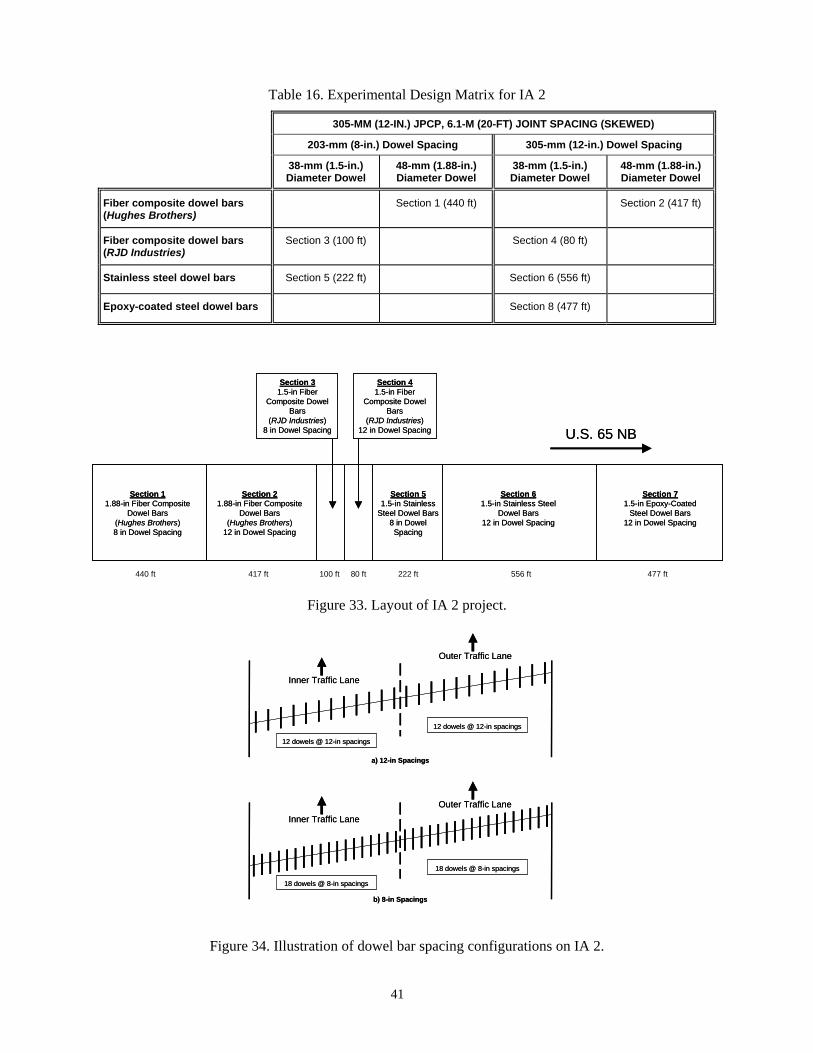
Figure 35 Average load transfer efficiency for IA 2 project 43
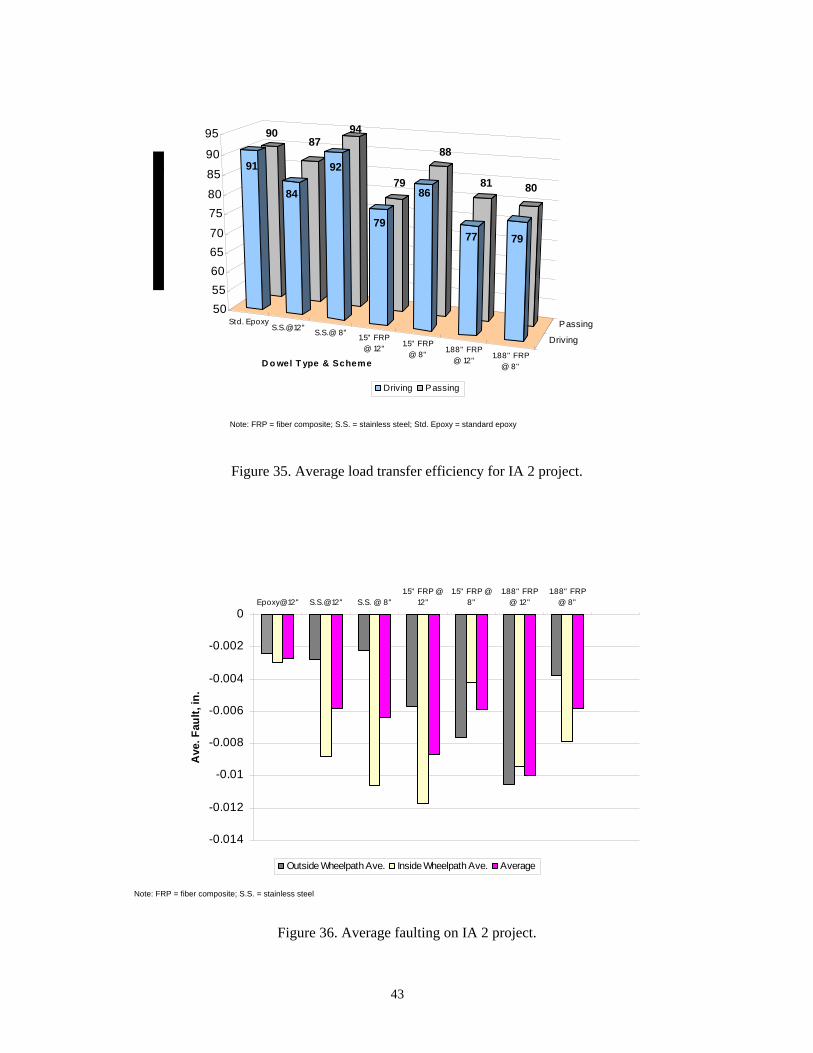
Figure 36 Average faulting on IA 2 project43
Figure 39 Location of IA 4 project 47
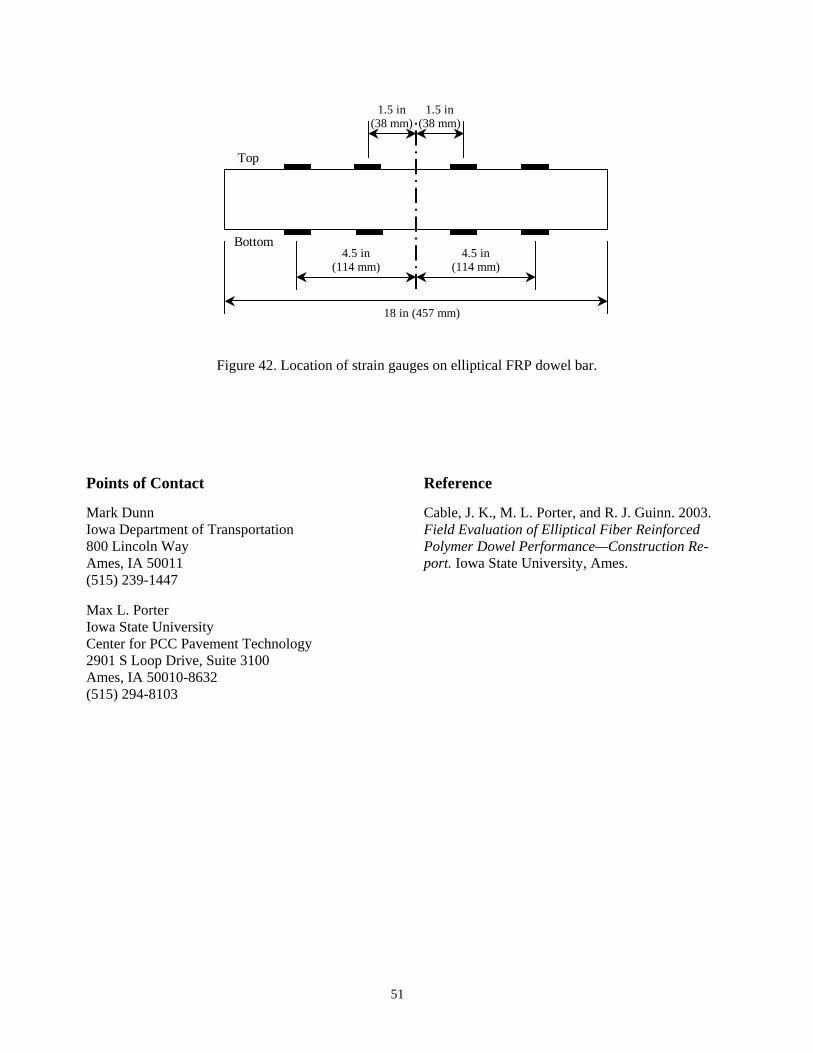
Figure 42 Location of strain gauges on elliptical FRP dowel bar 51
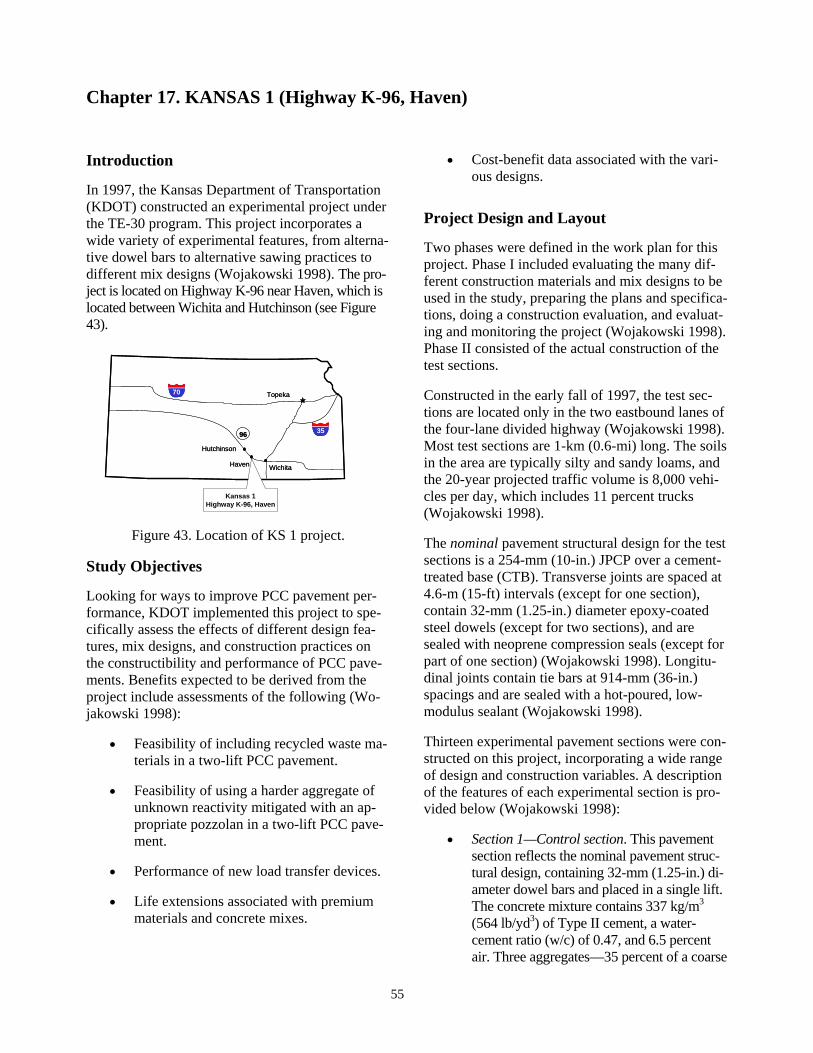
Figure 43 Location of KS 1 project 55
Figure 44 Photo of X-Flextrade load transfer devices 56
Figure 46 Relative construction costs by section for KS 162
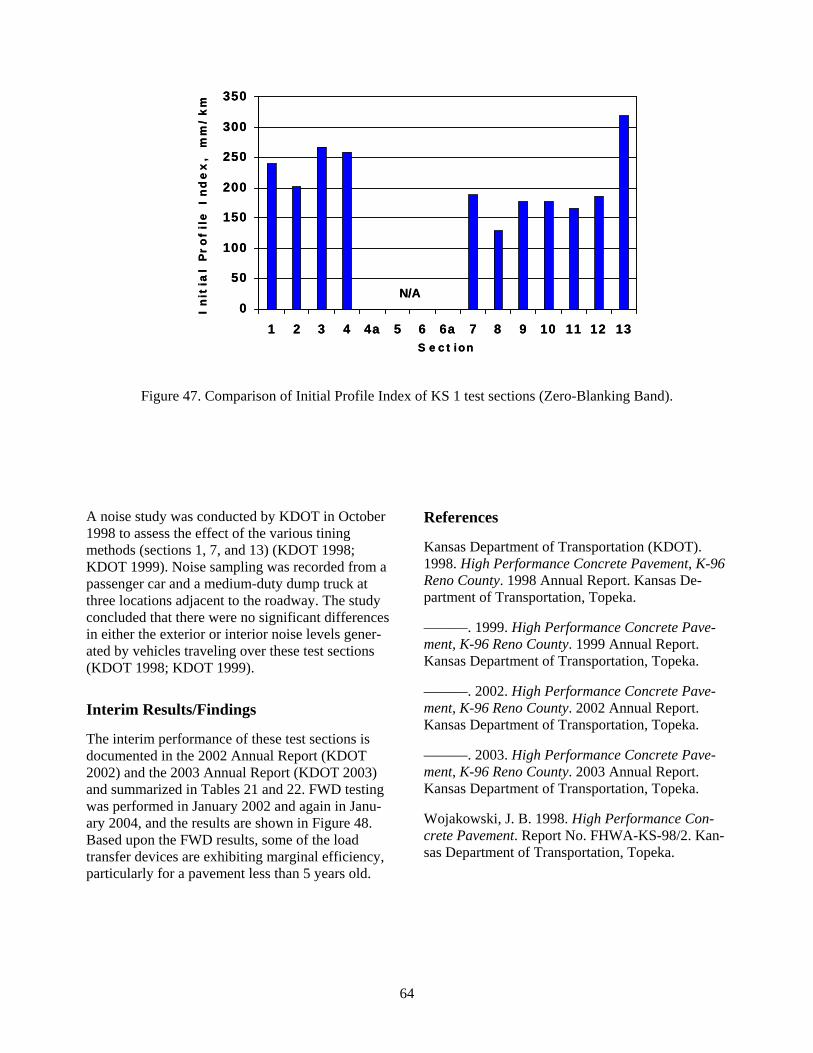
Figure 47 Comparison of Initial Profile Index of KS 1 test sections (Zero-Blanking Band) 64
Figure 49 Location of MD 1 project68
Figure 50 Location of MI 1 project 71
Figure 51 Layout of MI 1 project 72
Figure 52 Cross section for Michigan standard pavement (Smiley 1995) 73
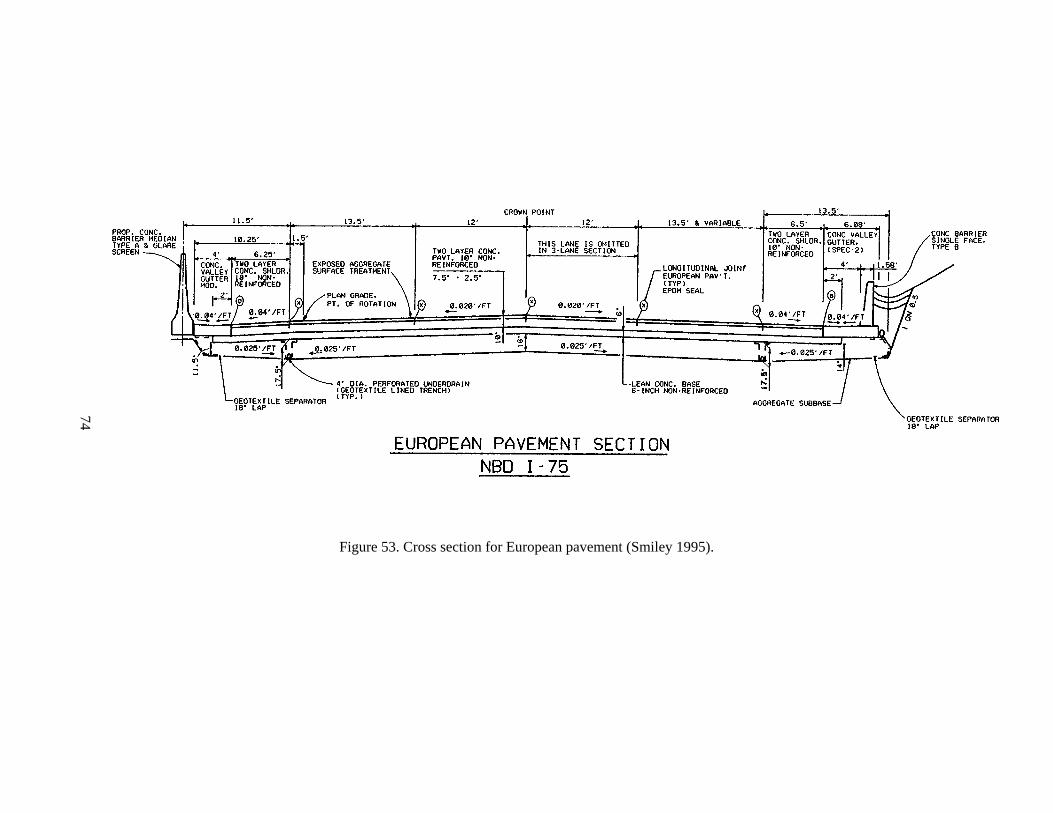
Figure 53 Cross section for European pavement (Smiley 1995) 74
Figure 54 Variable dowel spacings used on European pavement section (Weinfurter Smiley and Till 1994)76
Figure 55 Cumulative total traffic volumes for MI 1 test sections (Buch Lyles and Becker 2000) 78
Figure 56 Computed IRI values for MI 1 test sections (Buch Lyles and Becker 2000)78
Figure 57 Computed friction numbers for MI 1 test sections (Buch Lyles and Becker 2000)80
Figure 58 Location of MN 1 project81
Figure 60 Approximate location of new LVR test sections at MnRoad facility 85
Figure 61 Layout of test sections 52 and 53 for MN 2 project 87
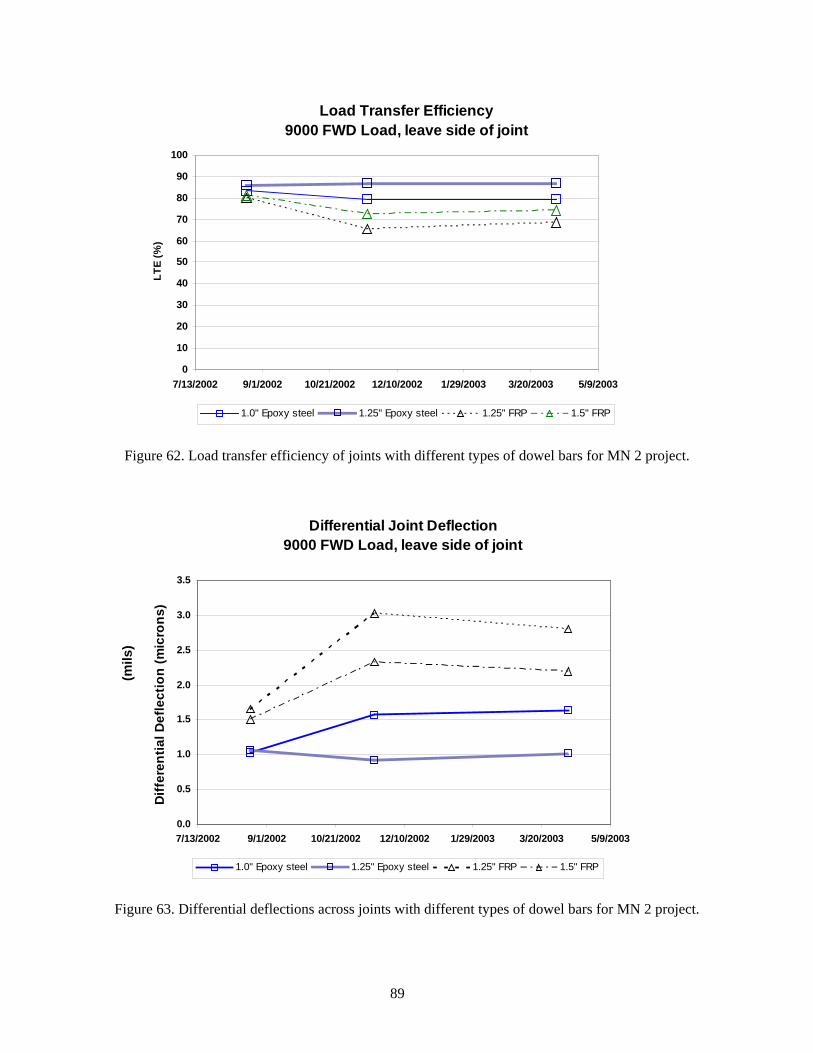
Figure 62 Load transfer efficiency of joints with different types of dowel bars for MN 2 project 89
Figure 63 Differential deflections across joints with different types of dowel bars for MN 2 project89
Figure 64 Transverse profile of unrestrained slab in Cell 53 for MN 2 project (Vandenbossche 2003)90
Figure 65 Diagonal profile of unrestrained slab in Cell 53 for MN 2 project (Vandenbossche 2003)90
xiv
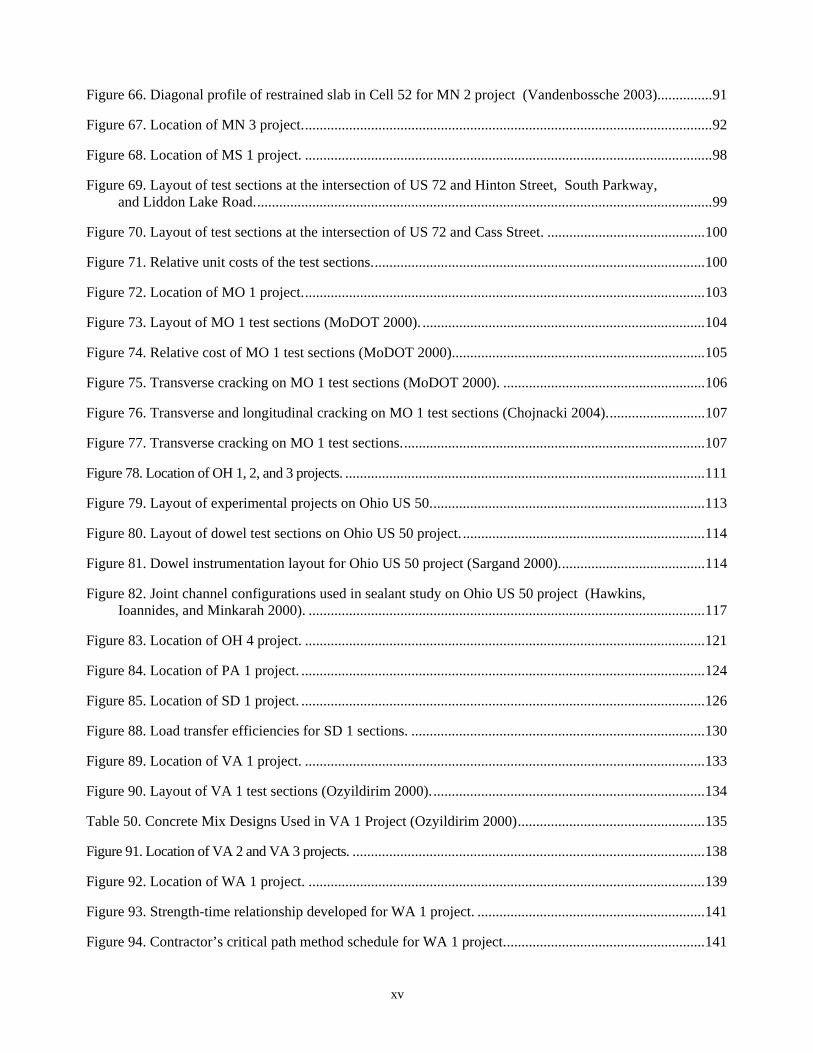
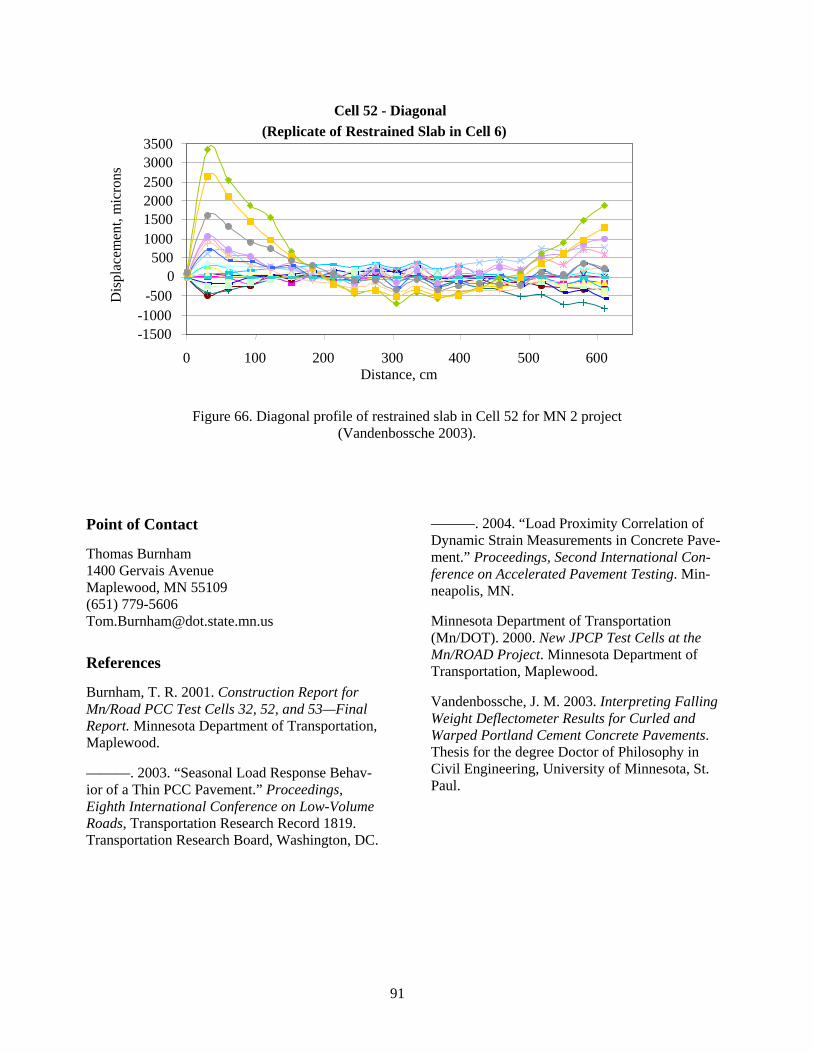
Figure 66 Diagonal profile of restrained slab in Cell 52 for MN 2 project (Vandenbossche 2003)91
Figure 67 Location of MN 3 project92
Figure 68 Location of MS 1 project 98
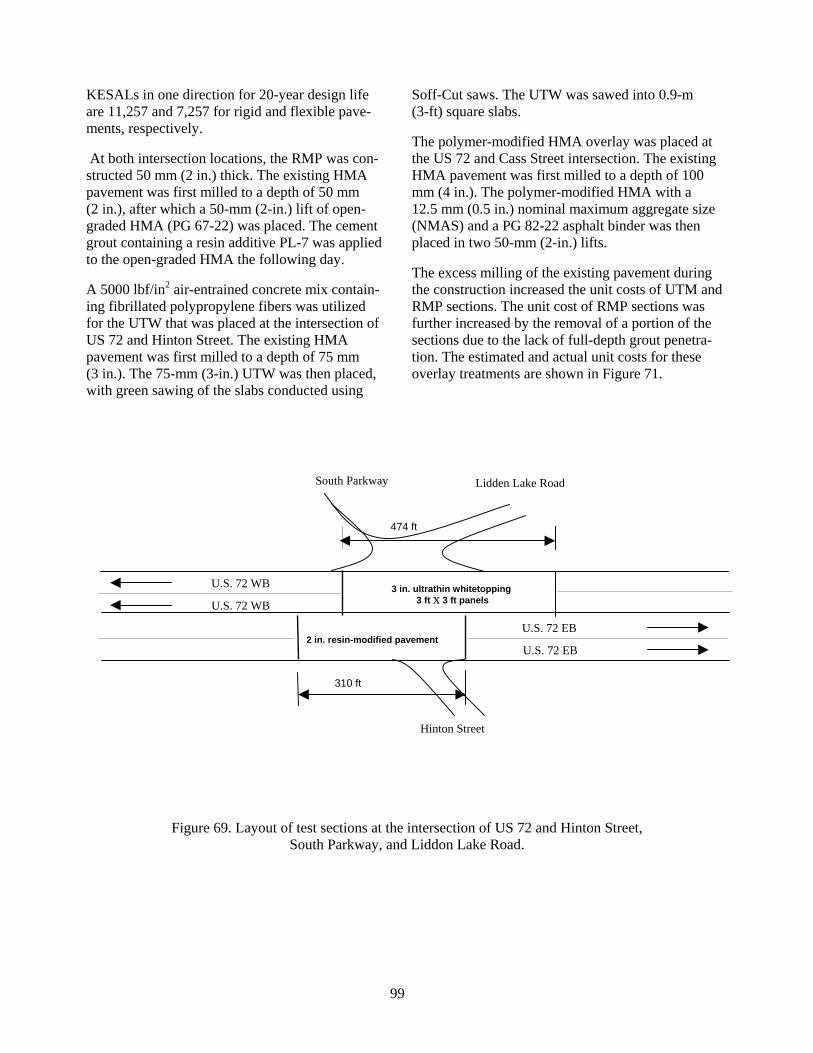
Figure 69 Layout of test sections at the intersection of US 72 and Hinton Street South Parkway and Liddon Lake Road99
Figure 70 Layout of test sections at the intersection of US 72 and Cass Street 100
Figure 71 Relative unit costs of the test sections100
Figure 72 Location of MO 1 project103
Figure 73 Layout of MO 1 test sections (MoDOT 2000) 104
Figure 74 Relative cost of MO 1 test sections (MoDOT 2000)105
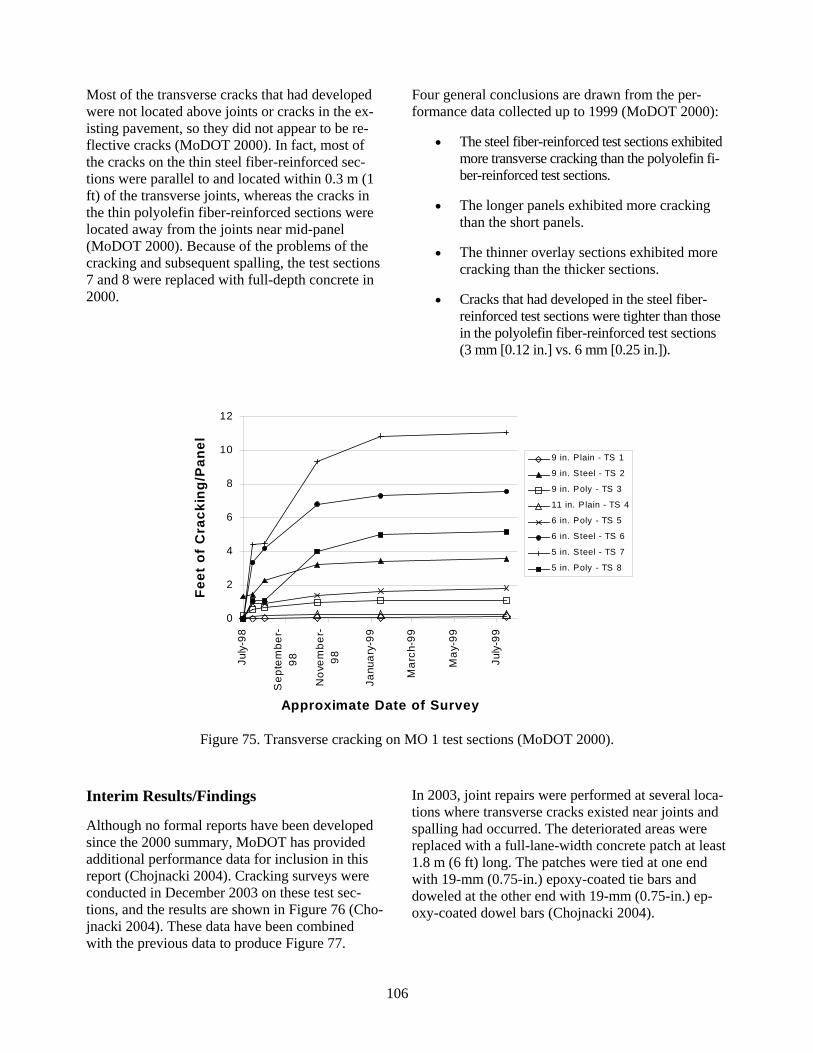
Figure 75 Transverse cracking on MO 1 test sections (MoDOT 2000) 106
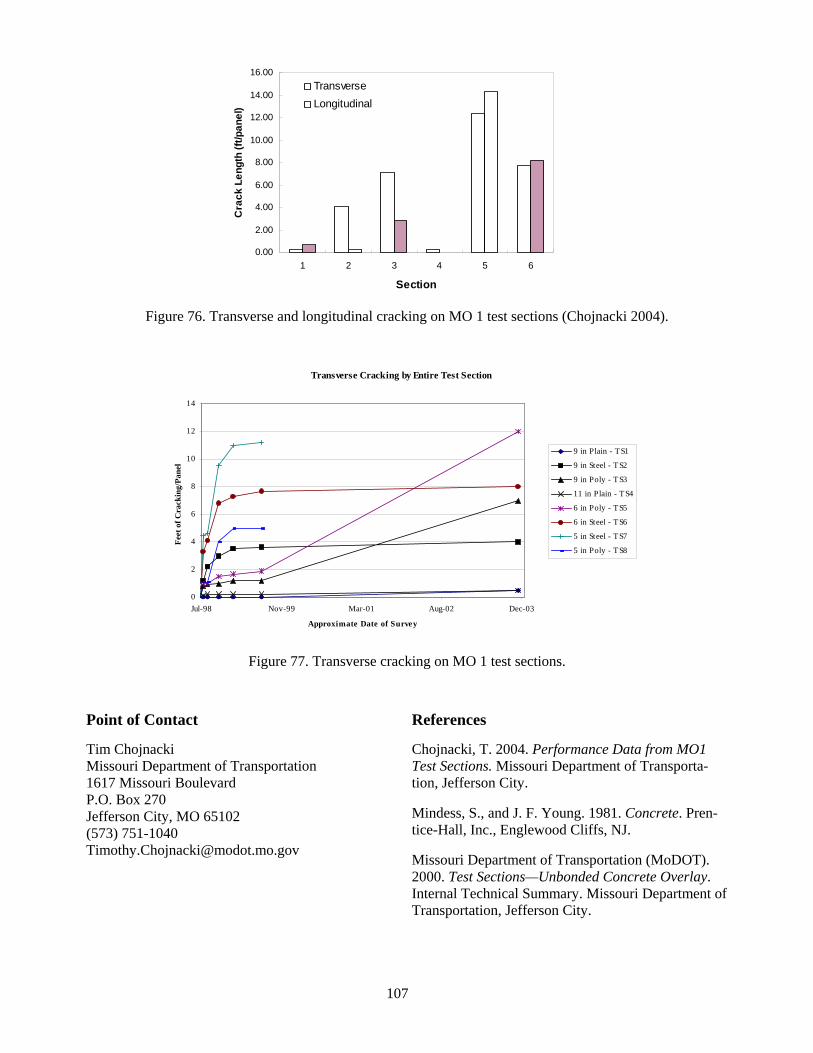
Figure 76 Transverse and longitudinal cracking on MO 1 test sections (Chojnacki 2004)107
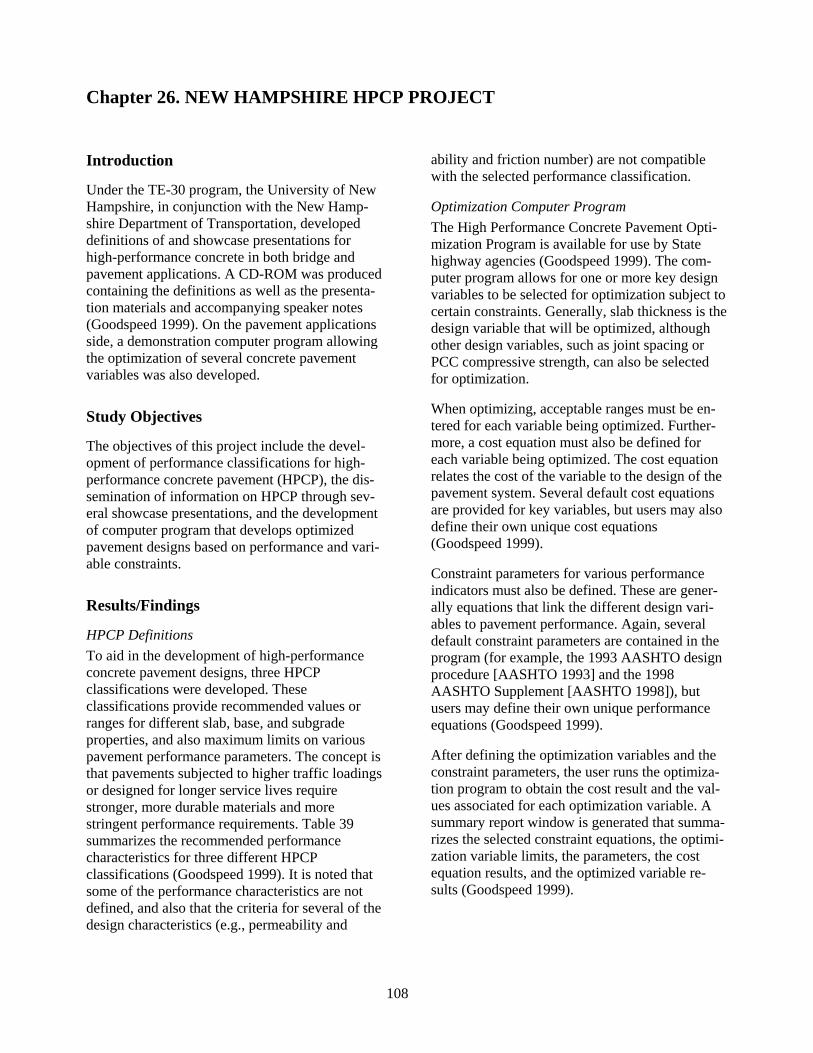
Figure 77 Transverse cracking on MO 1 test sections107
Figure 78 Location of OH 1 2 and 3 projects 111
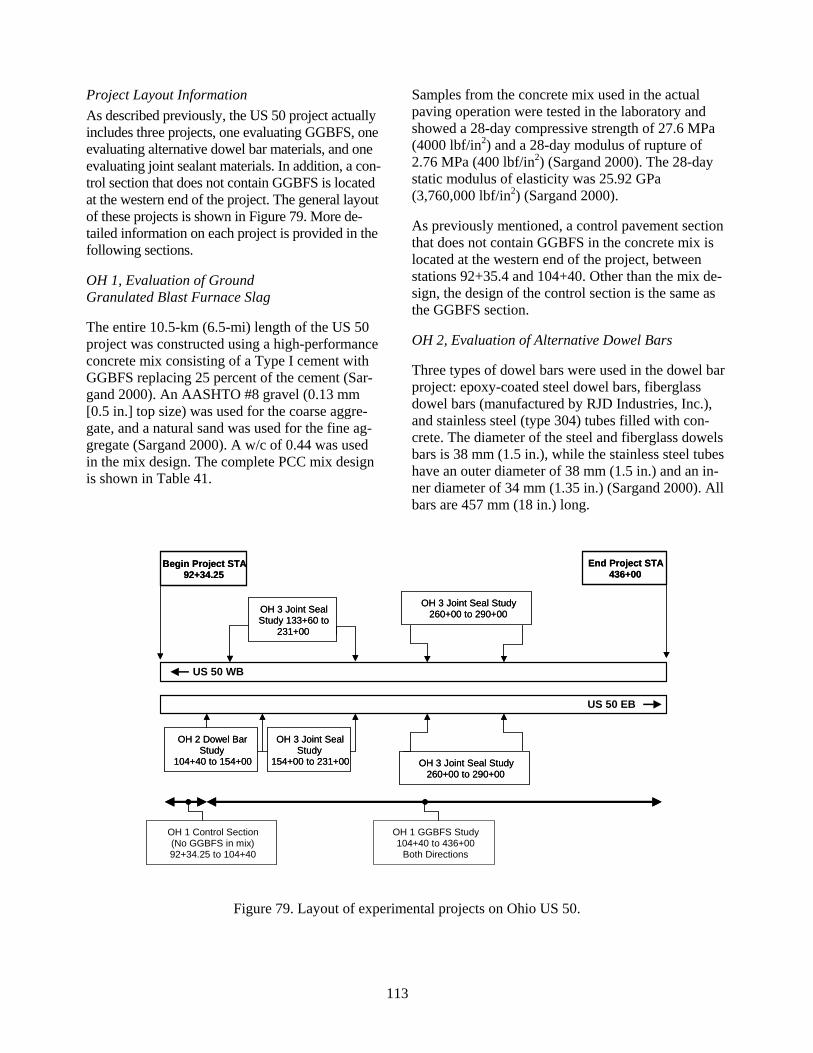
Figure 79 Layout of experimental projects on Ohio US 50113
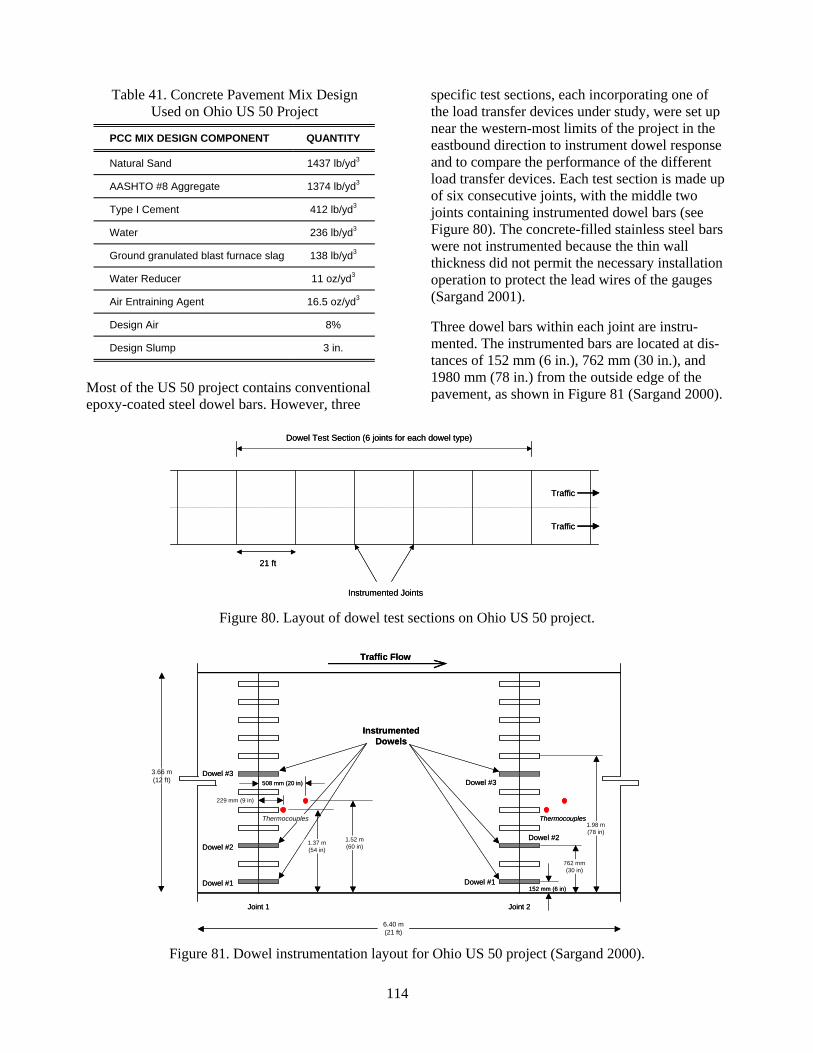
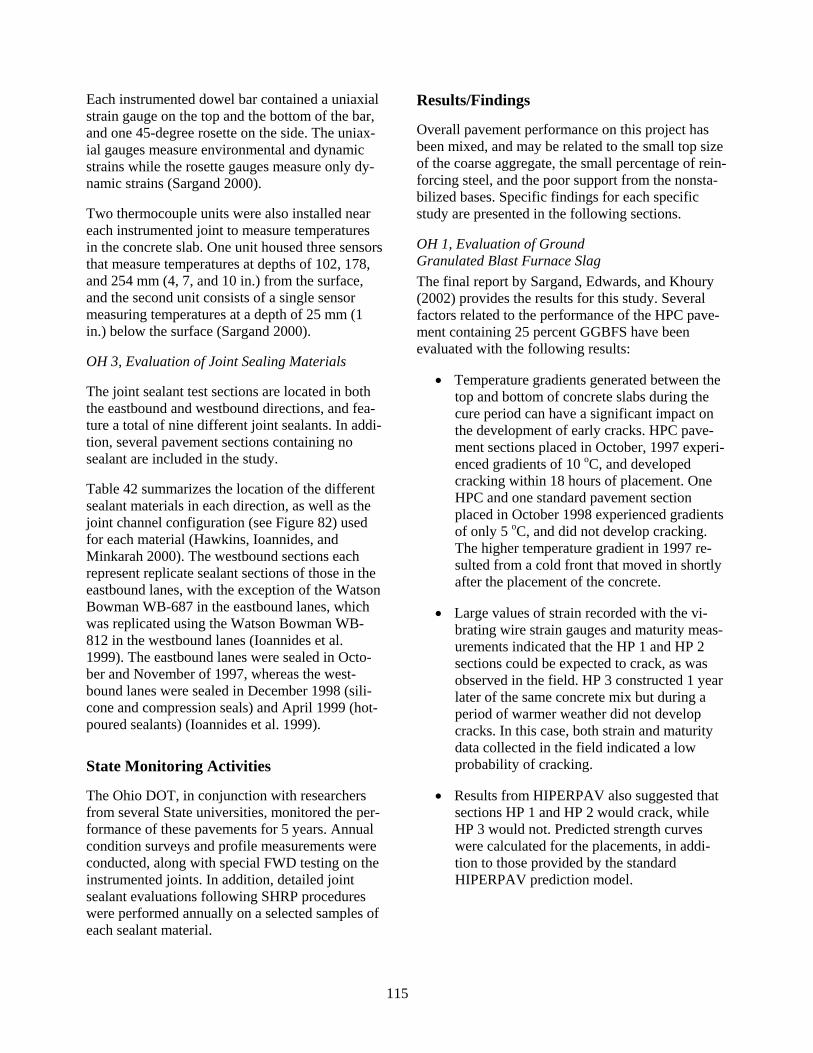
Figure 80 Layout of dowel test sections on Ohio US 50 project 114
Figure 81 Dowel instrumentation layout for Ohio US 50 project (Sargand 2000)114
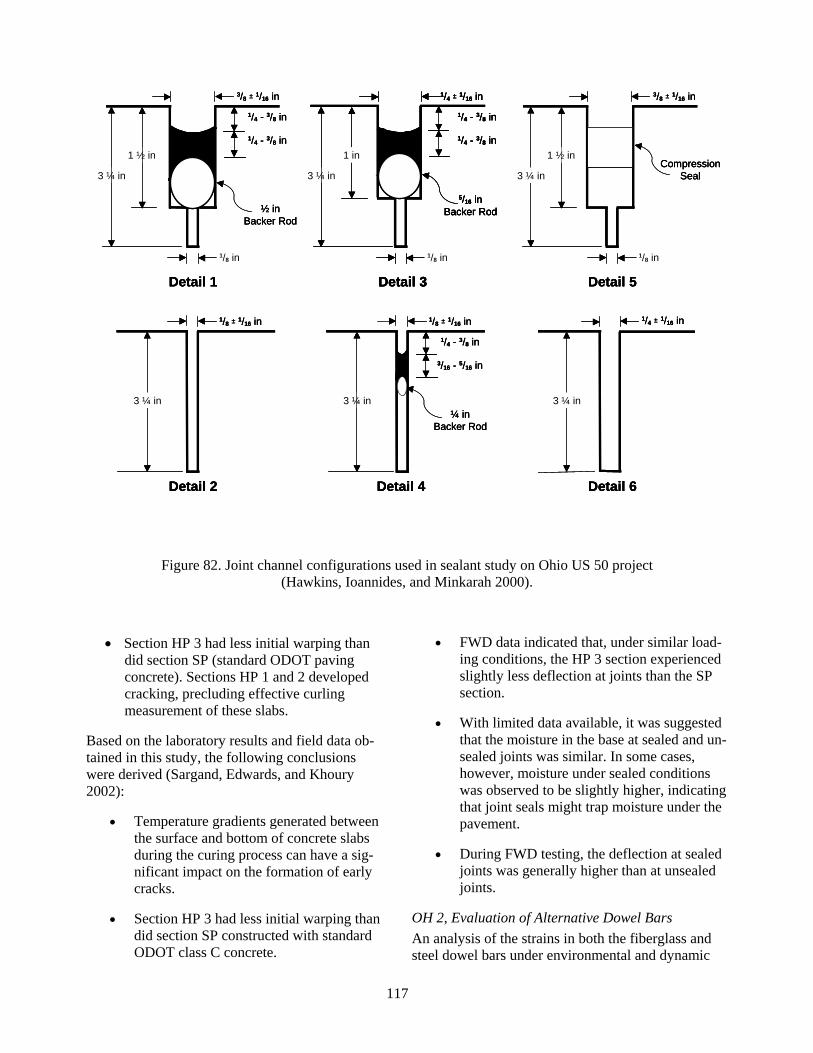
Figure 82 Joint channel configurations used in sealant study on Ohio US 50 project (Hawkins Ioannides and Minkarah 2000) 117
Figure 83 Location of OH 4 project 121
Figure 84 Location of PA 1 project 124
Figure 85 Location of SD 1 project 126
Figure 88 Load transfer efficiencies for SD 1 sections 130
Figure 89 Location of VA 1 project 133
Figure 90 Layout of VA 1 test sections (Ozyildirim 2000)134
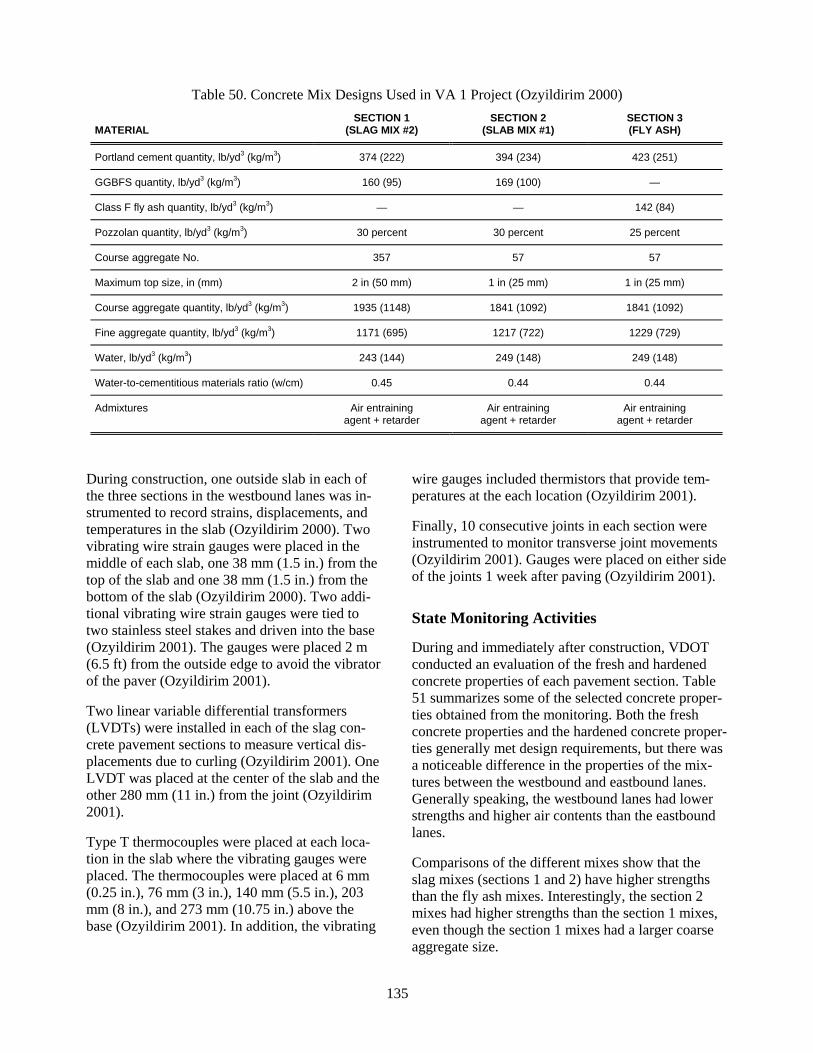
Table 50 Concrete Mix Designs Used in VA 1 Project (Ozyildirim 2000)135
Figure 91 Location of VA 2 and VA 3 projects 138
Figure 92 Location of WA 1 project 139
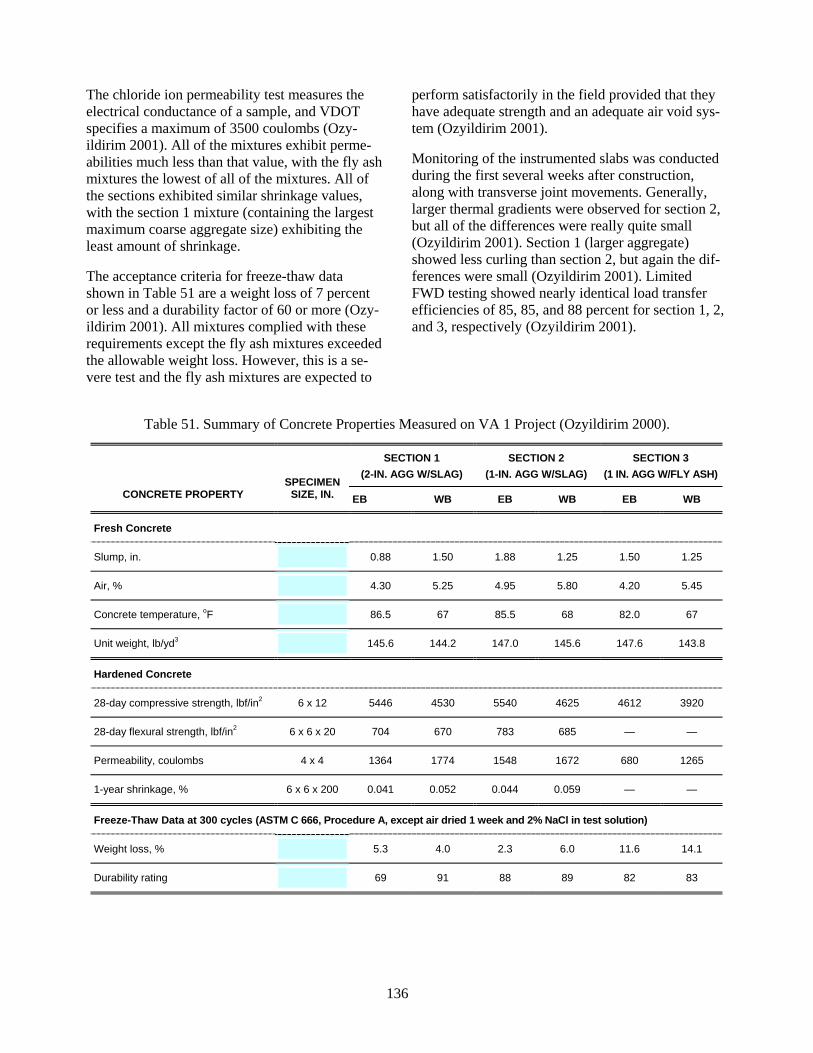
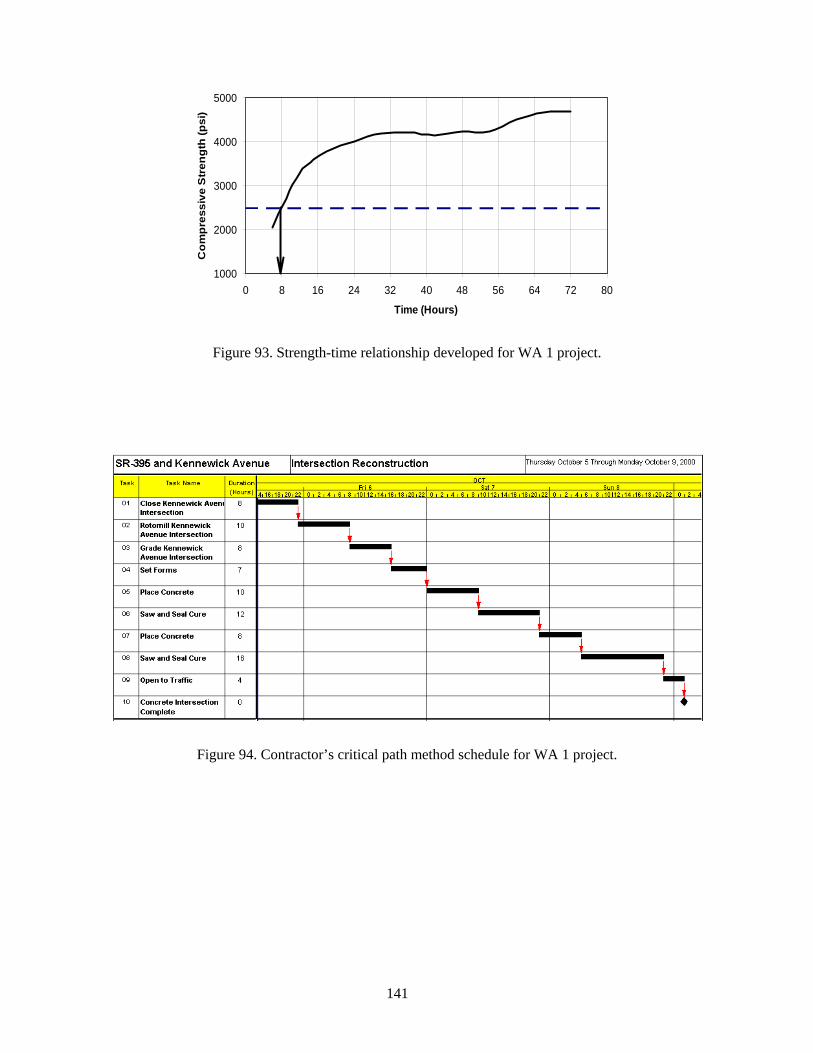
Figure 93 Strength-time relationship developed for WA 1 project 141
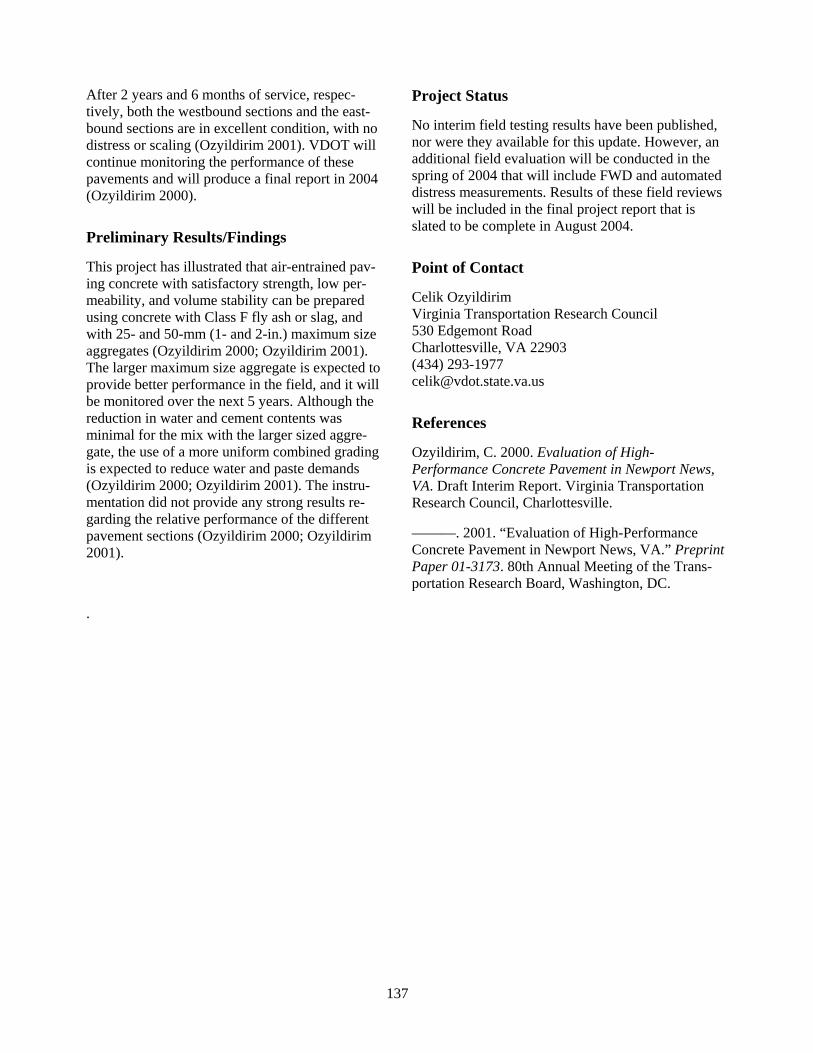
Figure 94 Contractorrsquos critical path method schedule for WA 1 project141
xv
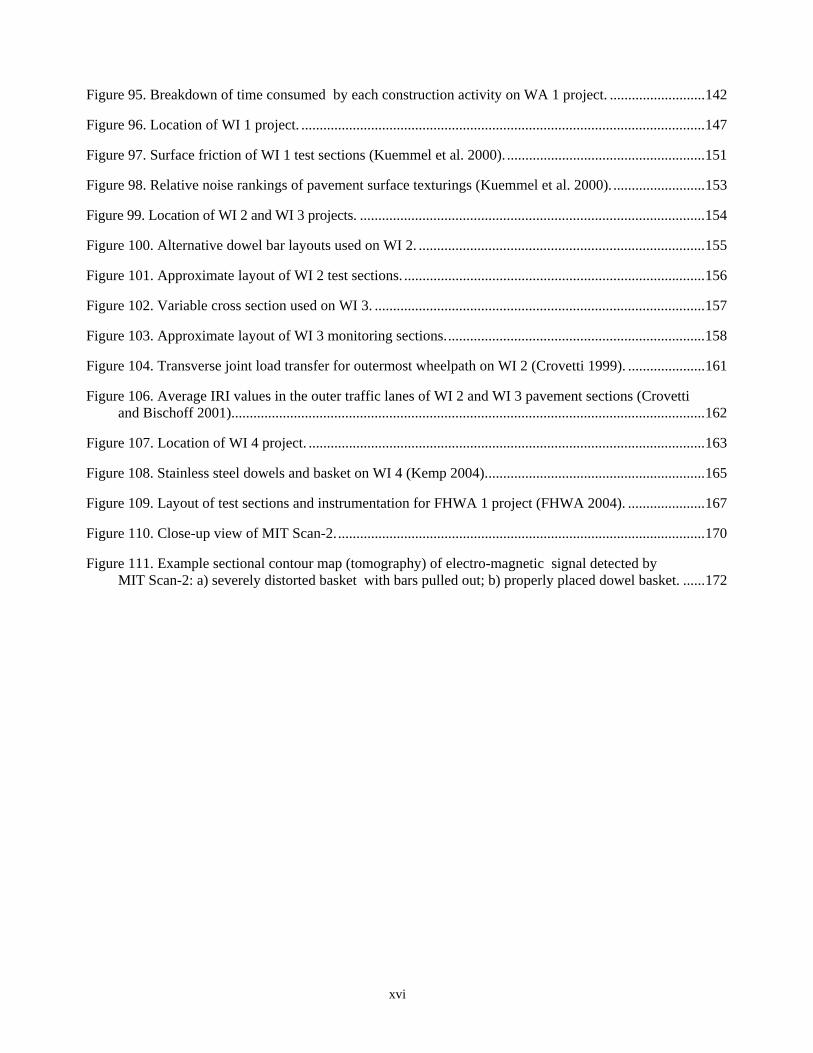
Figure 95 Breakdown of time consumed by each construction activity on WA 1 project 142
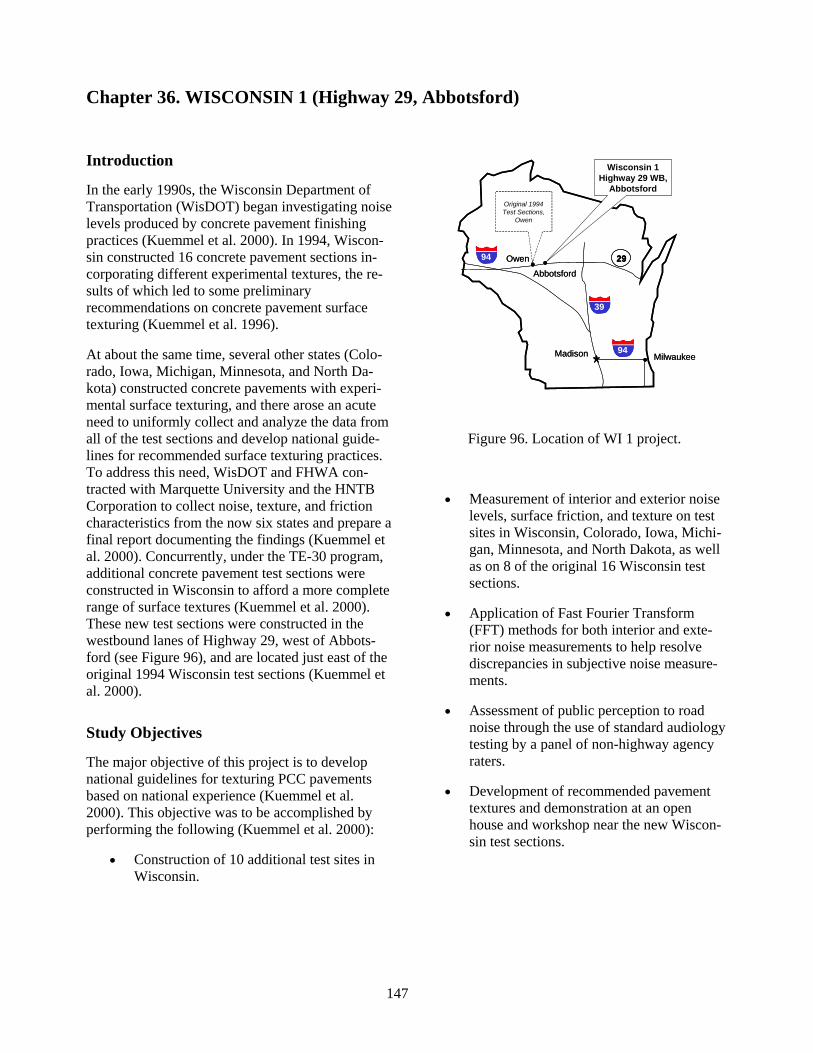
Figure 96 Location of WI 1 project 147
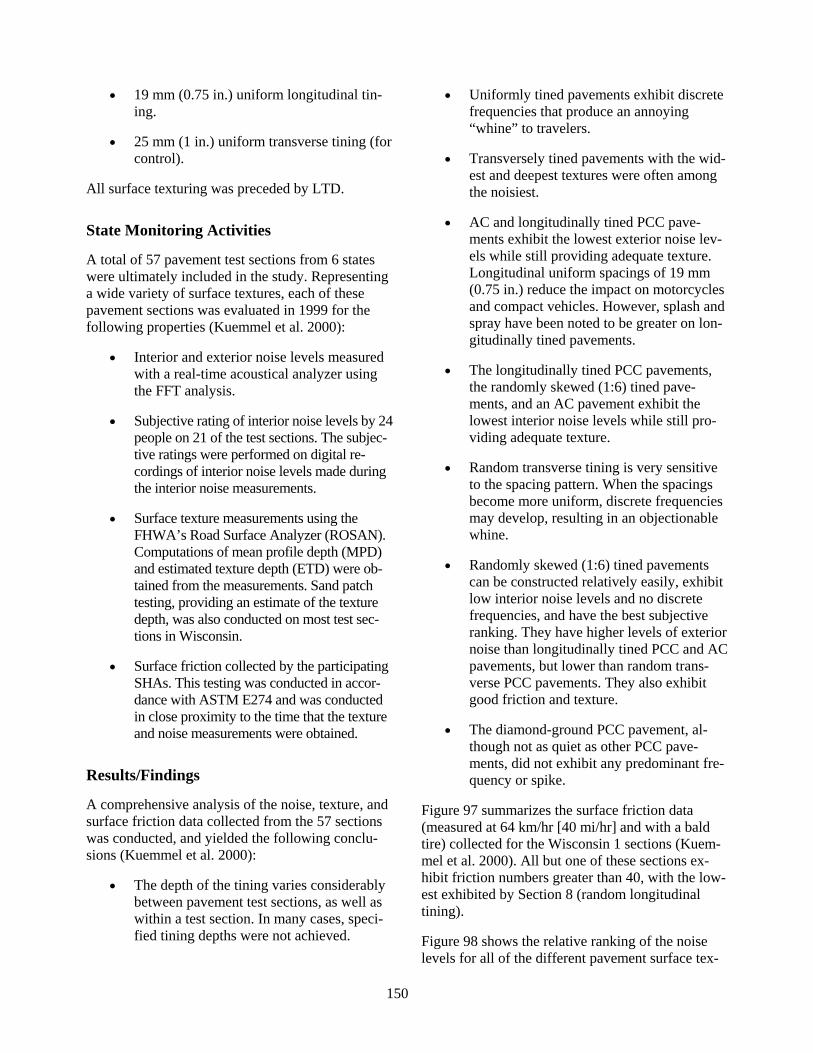
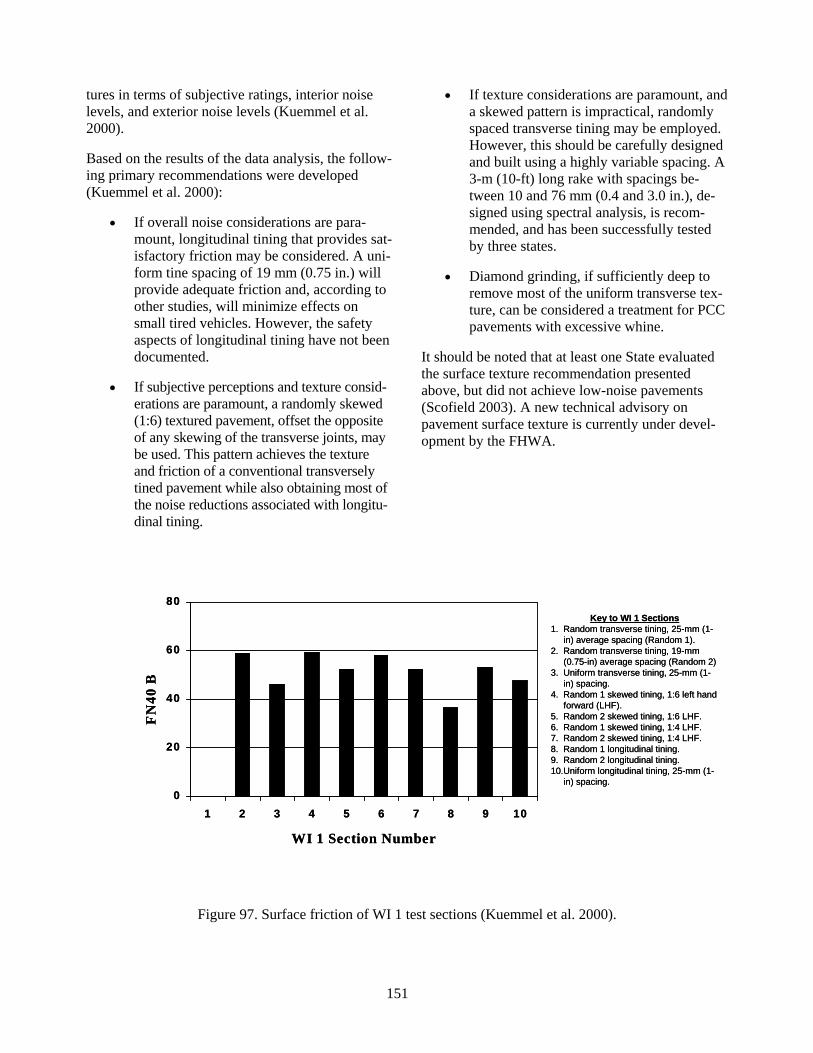
Figure 97 Surface friction of WI 1 test sections (Kuemmel et al 2000) 151
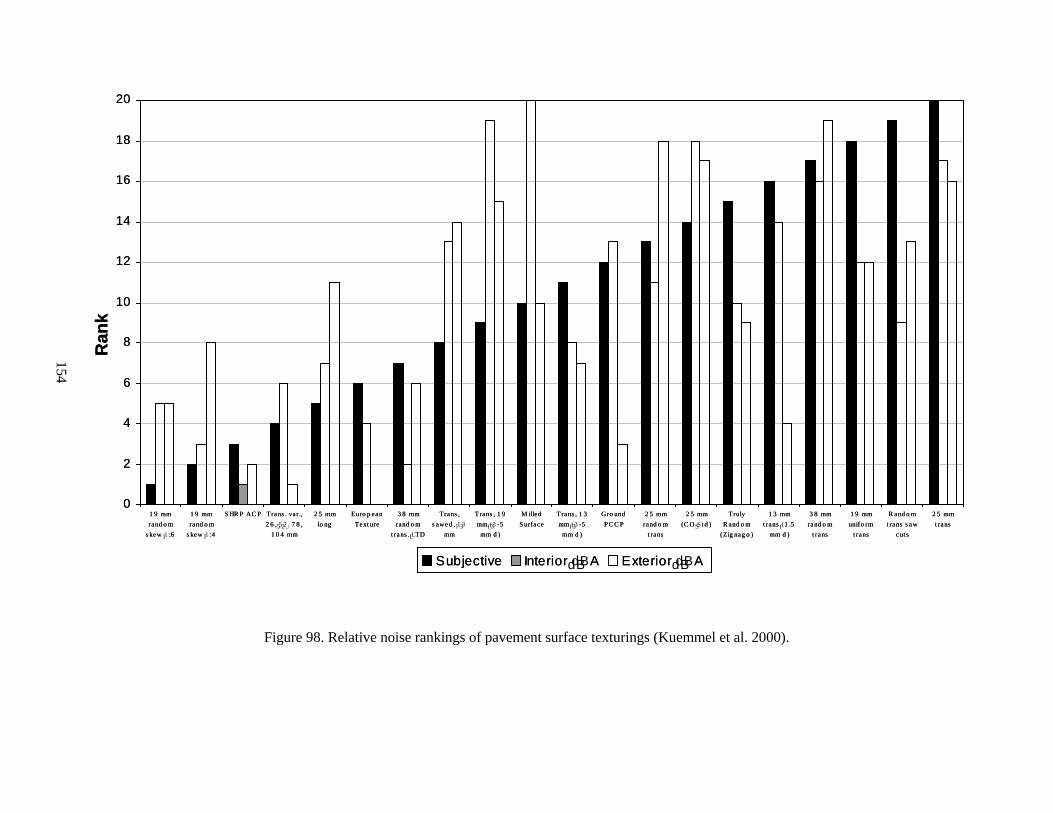
Figure 98 Relative noise rankings of pavement surface texturings (Kuemmel et al 2000) 153
Figure 99 Location of WI 2 and WI 3 projects 154
Figure 100 Alternative dowel bar layouts used on WI 2 155
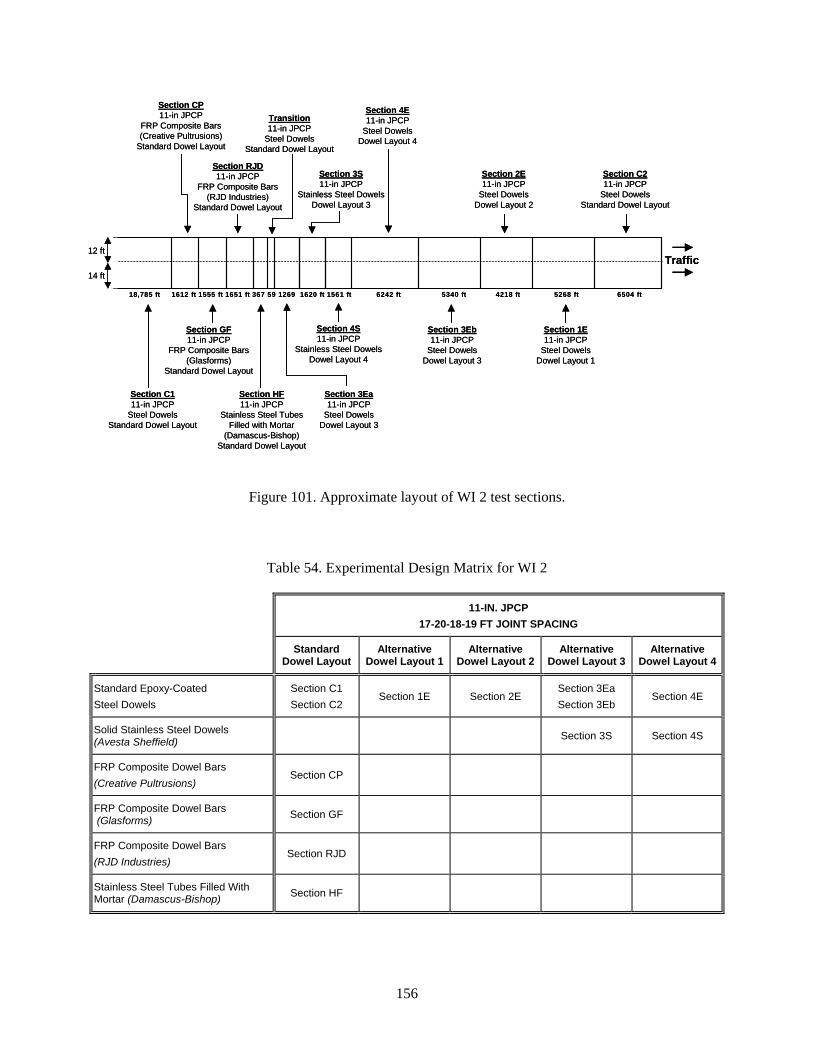
Figure 101 Approximate layout of WI 2 test sections 156
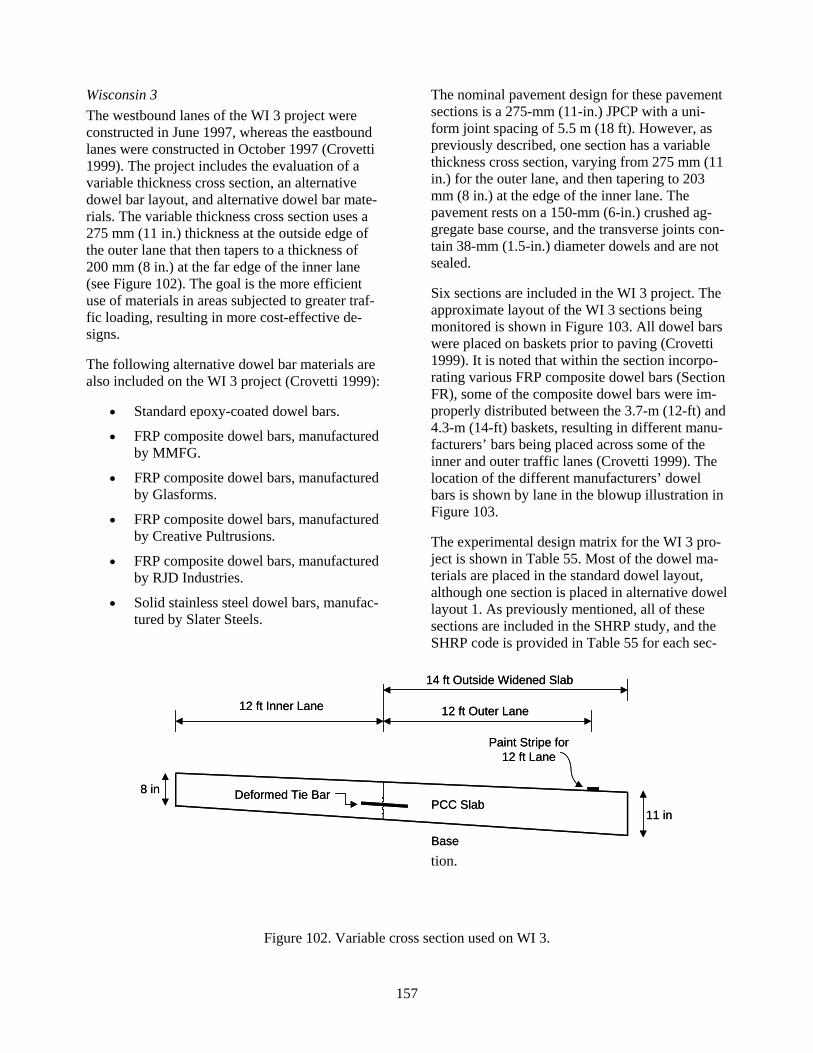
Figure 102 Variable cross section used on WI 3 157
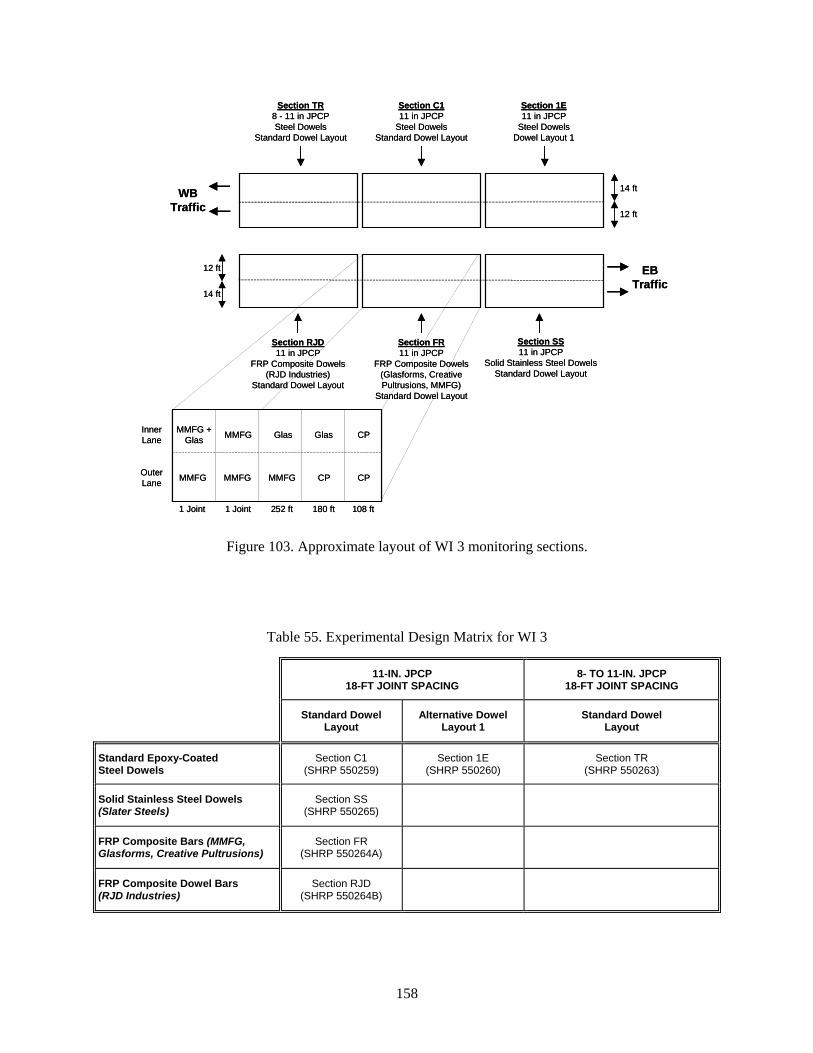
Figure 103 Approximate layout of WI 3 monitoring sections158
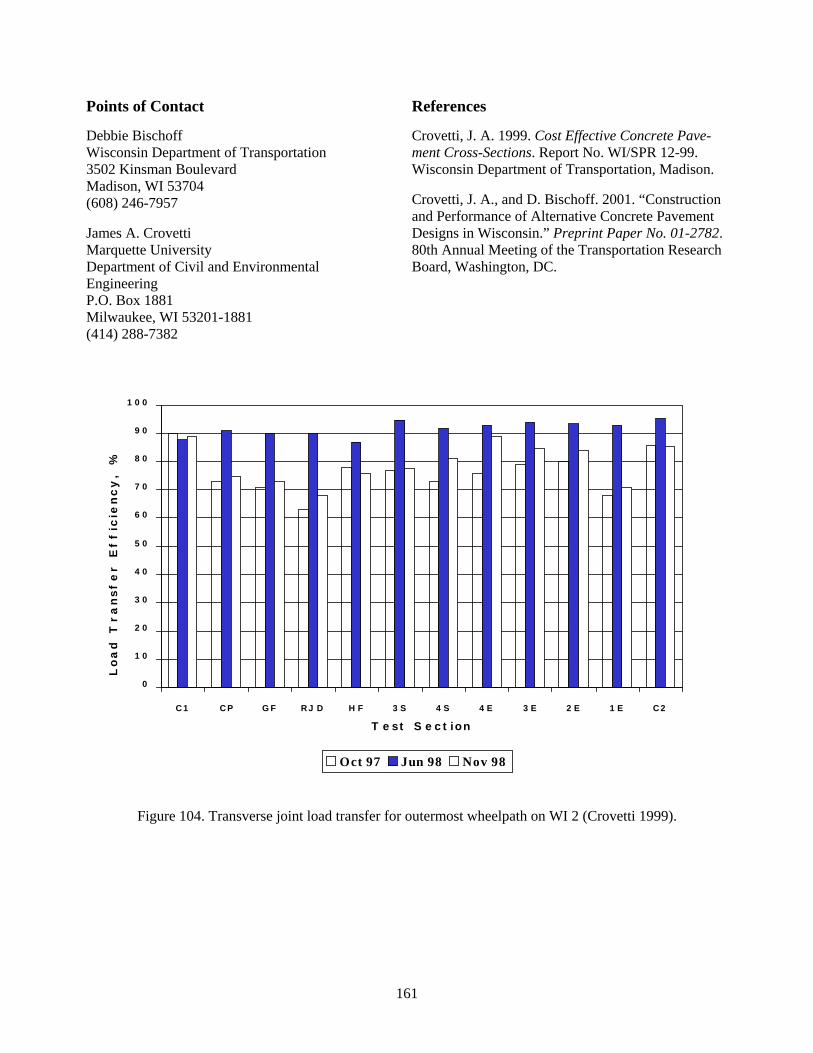
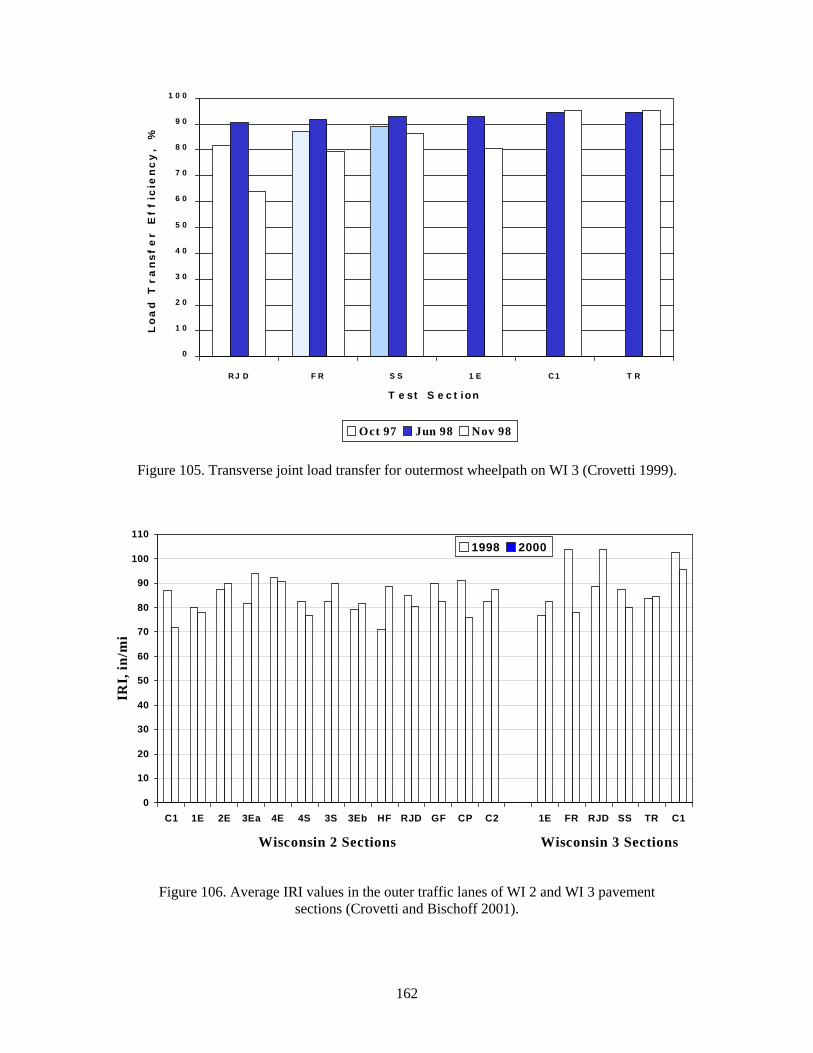
Figure 104 Transverse joint load transfer for outermost wheelpath on WI 2 (Crovetti 1999) 161
Figure 106 Average IRI values in the outer traffic lanes of WI 2 and WI 3 pavement sections (Crovetti and Bischoff 2001)162
Figure 107 Location of WI 4 project 163
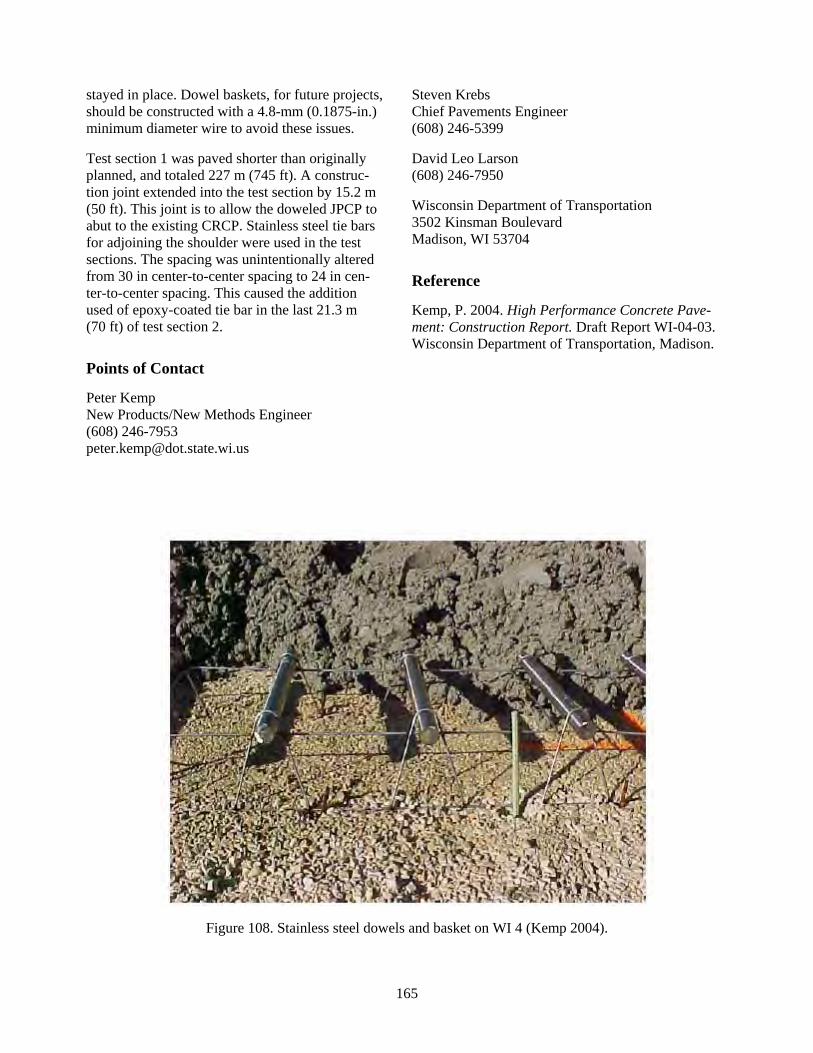
Figure 108 Stainless steel dowels and basket on WI 4 (Kemp 2004)165
Figure 109 Layout of test sections and instrumentation for FHWA 1 project (FHWA 2004) 167
Figure 110 Close-up view of MIT Scan-2170
Figure 111 Example sectional contour map (tomography) of electro-magnetic signal detected by MIT Scan-2 a) severely distorted basket with bars pulled out b) properly placed dowel basket 172
xvi
List of Tables
Table 1 Listing of TE-30 and Related Projects 3
Table 3 Ranges of Edge Stresses Measured Under an 18-Kip Single-Axle Load on the CO 1 Project Test Sections 8
Table 4 Traffic Data for IL 1 (September 1996 to September 1999) (Gawedzinski 2000) 14
Table 6 Gradation of Porous Granular Embankment Subgrade Crushed Stone Material 18
Table 7 Experimental Design Matrix for IL 2 20
Table 8 Traffic Data for IL 2 (September 25 1997 to January 31 2000) (Gawedzinski 2000)21
Table 9 Traffic Data for IL 2 (September 25 1997 to June 16 2003) (Gawedzinski 2004)22
Table 10 Experimental Design Matrix for IL 3 27
Table 11 Current Traffic for Driving and Passing Lanes (Gawedzinski 2004)29
Table 12 Data Collection Date and Cumulative ESALs (Gawedzinski 2004) 33
Table 13 Summary of Proposed Instrumentation (Nantung 2004)36
Table 14 Experimental Design Matrix for IA 137
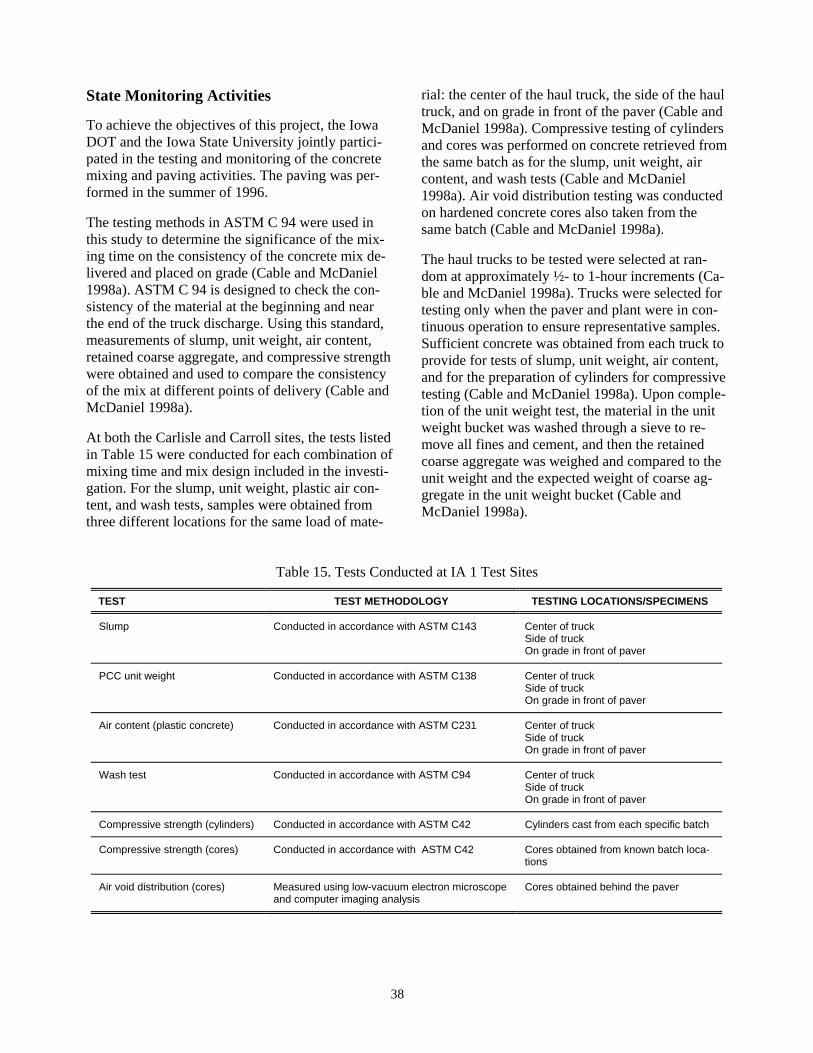
Table 15 Tests Conducted at IA 1 Test Sites38
Table 16 Experimental Design Matrix for IA 241
Table 17 Simplified Experimental Design Matrix for KS 158
Table 18 Summary of Early Mix Properties of KS 1 Test Sections (Wojakowski 1998) 61
Table 19 Summary of Construction Cost Data for KS 1 (Wojakowski 1998) 62
Table 20 Summary of Early Performance Data for KS 1 Project (KDOT 1998 KDOT 1999)63
Table 21 Summary of 2002 Performance Data for KS 1 Project (KDOT 2002)65
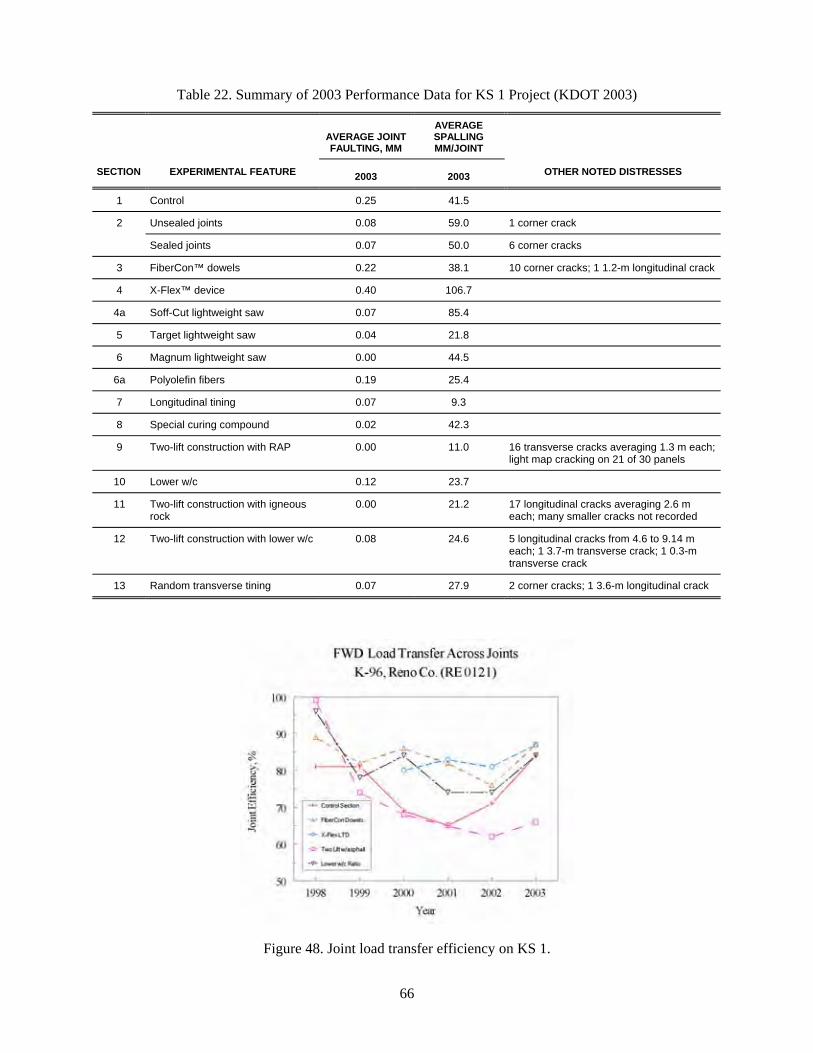
Table 22 Summary of 2003 Performance Data for KS 1 Project (KDOT 2003)66
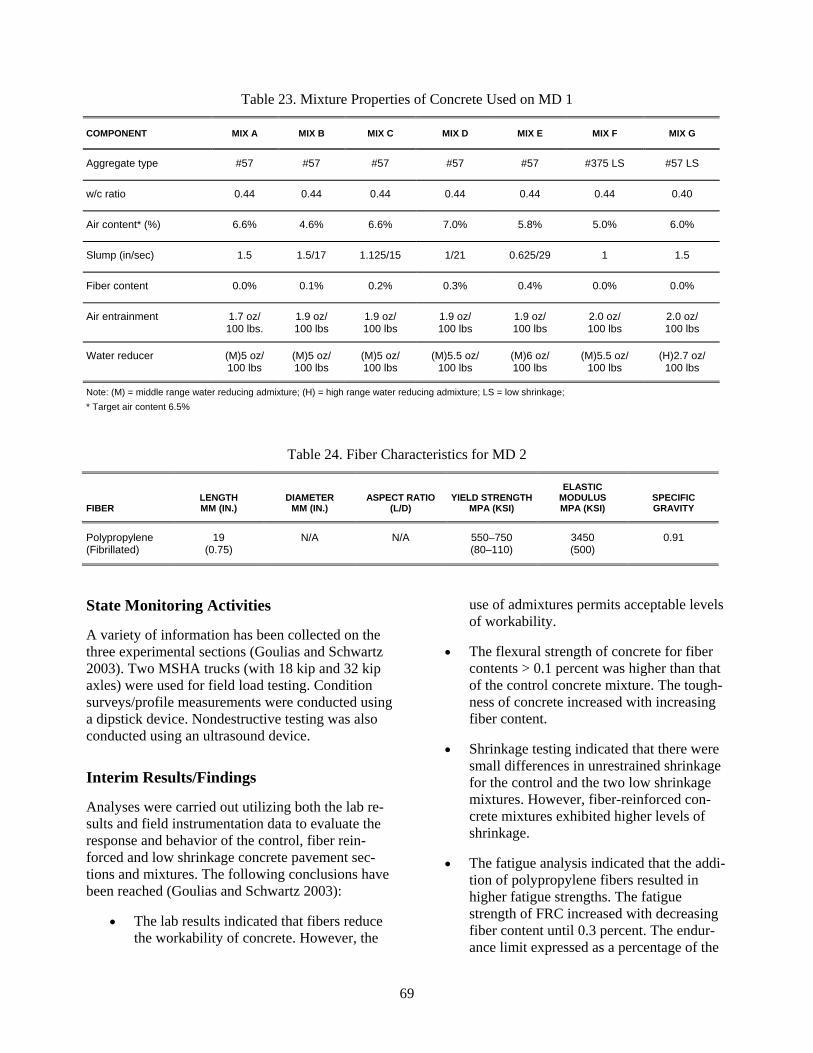
Table 23 Mixture Properties of Concrete Used on MD 169
Table 24 Fiber Characteristics for MD 269
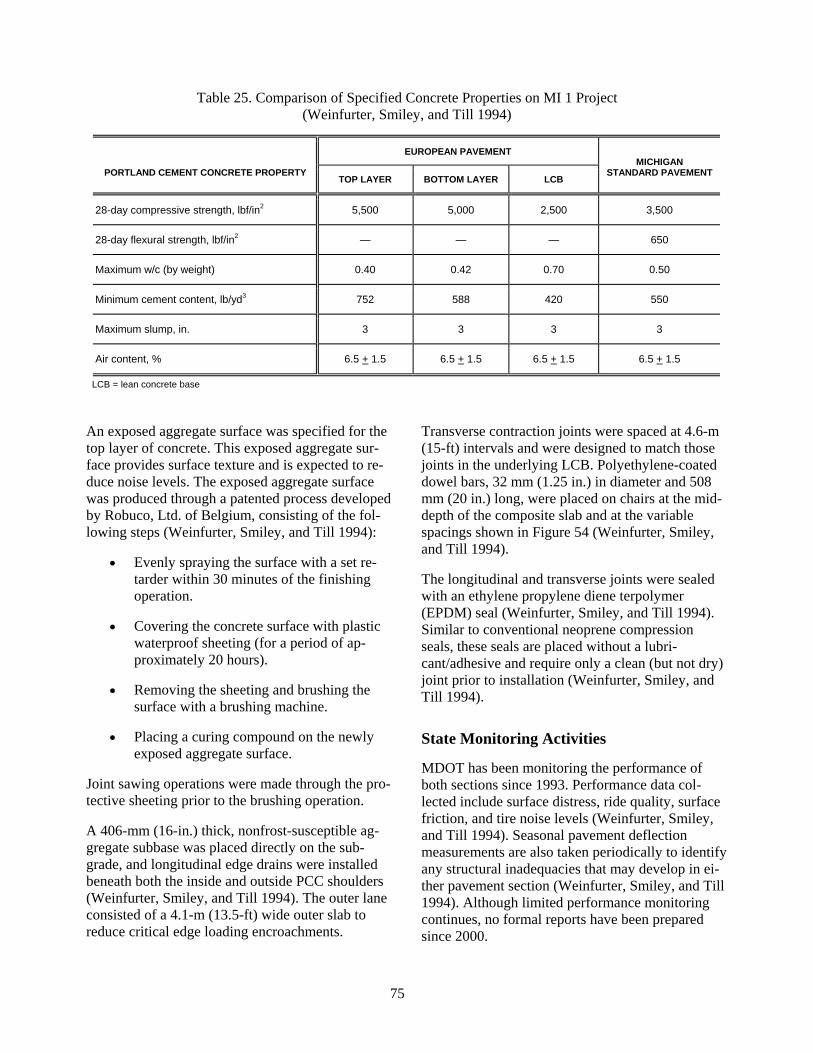
Table 25 Comparison of Specified Concrete Properties on MI 1 Project (Weinfurter Smiley and Till 1994)75
Table 26 Summary of Deflection Testing Results for MI 1 Sections (Buch Lyles and Becker 2000)79
Table 27 Experimental Design Matrix for MN 1 Project 82
Table 29 Sensor Types and Quantities for Test Sections 32 52 and 5388
Table 30 Summary of US 169 Whitetopping Test Sections for MN 3 Project93
xvii
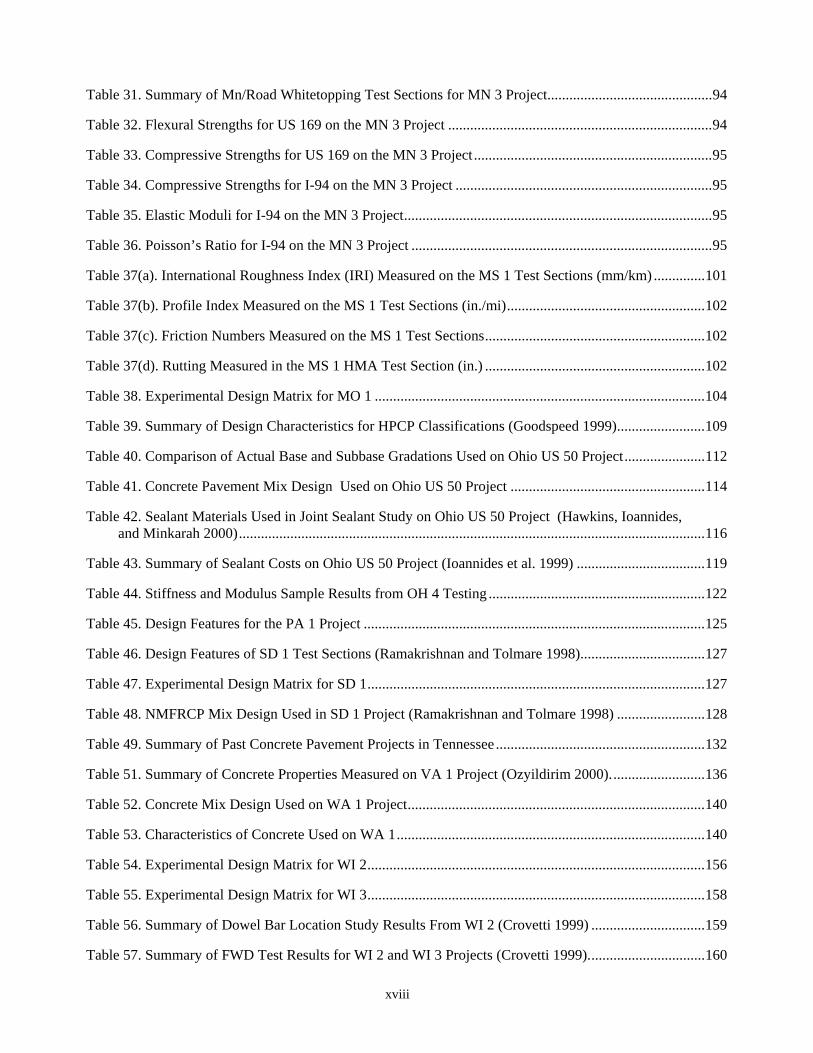
Table 31 Summary of MnRoad Whitetopping Test Sections for MN 3 Project94
Table 32 Flexural Strengths for US 169 on the MN 3 Project 94
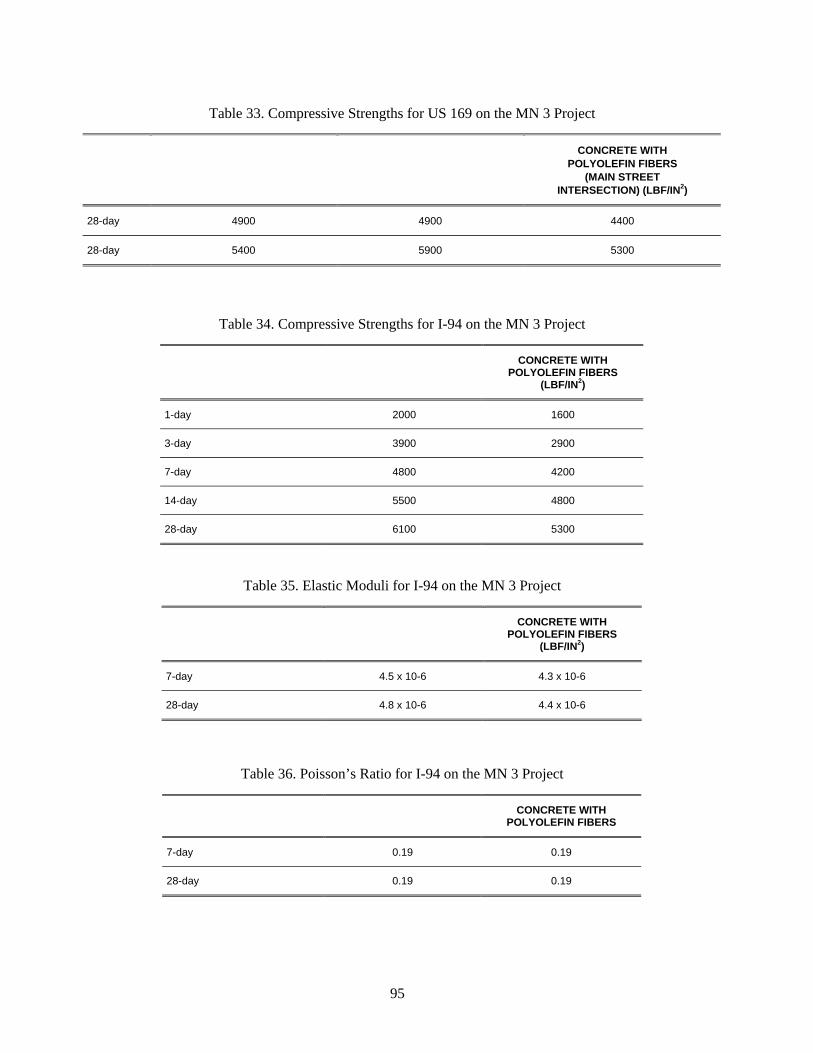
Table 33 Compressive Strengths for US 169 on the MN 3 Project 95
Table 34 Compressive Strengths for I-94 on the MN 3 Project 95
Table 35 Elastic Moduli for I-94 on the MN 3 Project95
Table 36 Poissonrsquos Ratio for I-94 on the MN 3 Project 95
Table 37(a) International Roughness Index (IRI) Measured on the MS 1 Test Sections (mmkm) 101
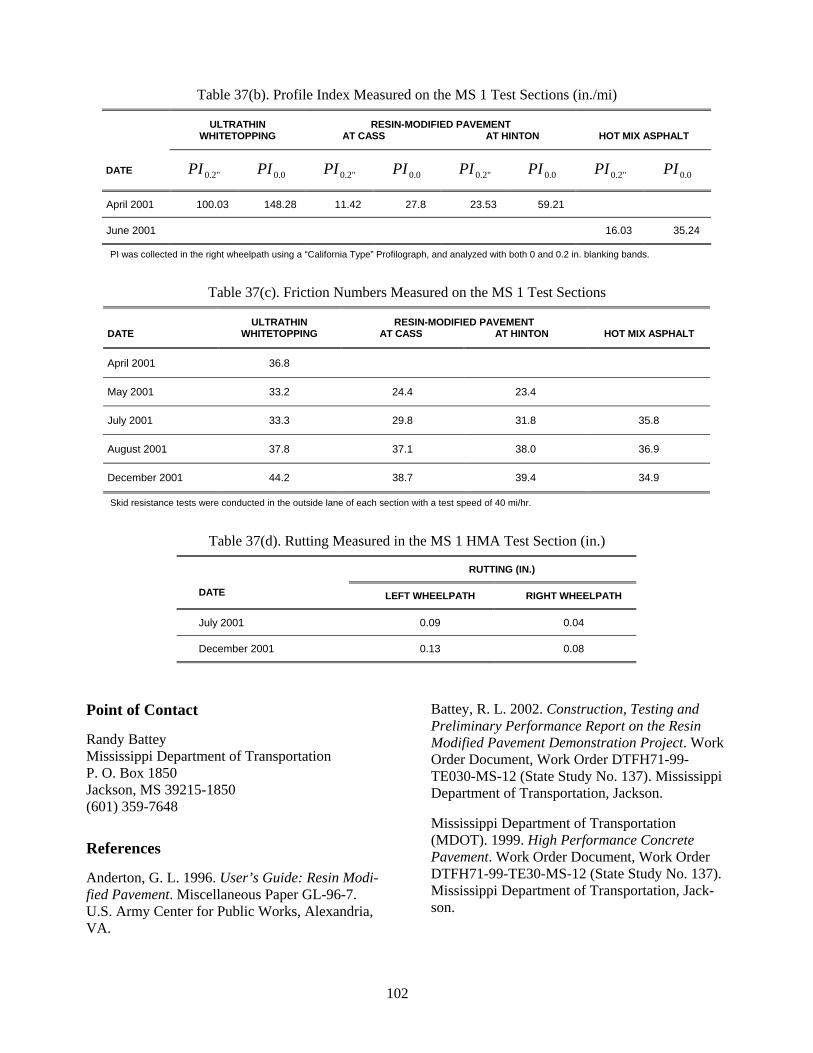
Table 37(b) Profile Index Measured on the MS 1 Test Sections (inmi)102
Table 37(c) Friction Numbers Measured on the MS 1 Test Sections102
Table 37(d) Rutting Measured in the MS 1 HMA Test Section (in) 102
Table 38 Experimental Design Matrix for MO 1 104
Table 39 Summary of Design Characteristics for HPCP Classifications (Goodspeed 1999)109
Table 40 Comparison of Actual Base and Subbase Gradations Used on Ohio US 50 Project112
Table 41 Concrete Pavement Mix Design Used on Ohio US 50 Project 114
Table 42 Sealant Materials Used in Joint Sealant Study on Ohio US 50 Project (Hawkins Ioannides and Minkarah 2000)116
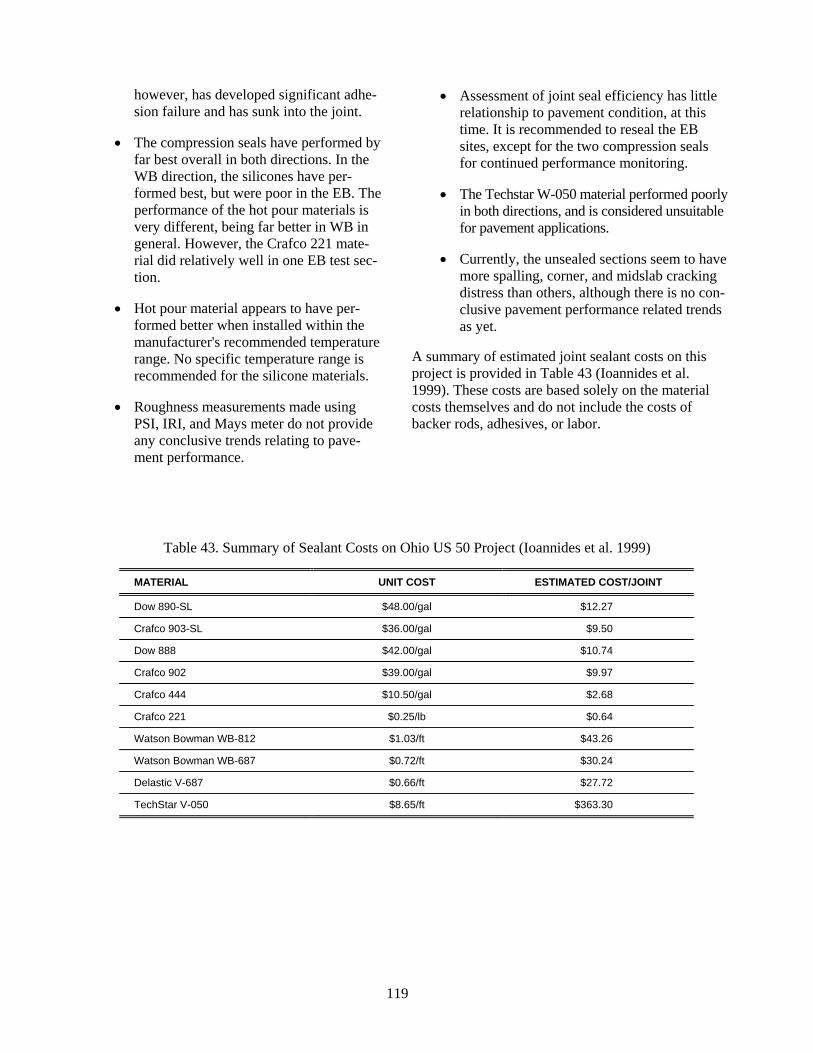
Table 43 Summary of Sealant Costs on Ohio US 50 Project (Ioannides et al 1999) 119
Table 44 Stiffness and Modulus Sample Results from OH 4 Testing 122
Table 45 Design Features for the PA 1 Project 125
Table 46 Design Features of SD 1 Test Sections (Ramakrishnan and Tolmare 1998)127
Table 47 Experimental Design Matrix for SD 1127
Table 48 NMFRCP Mix Design Used in SD 1 Project (Ramakrishnan and Tolmare 1998) 128
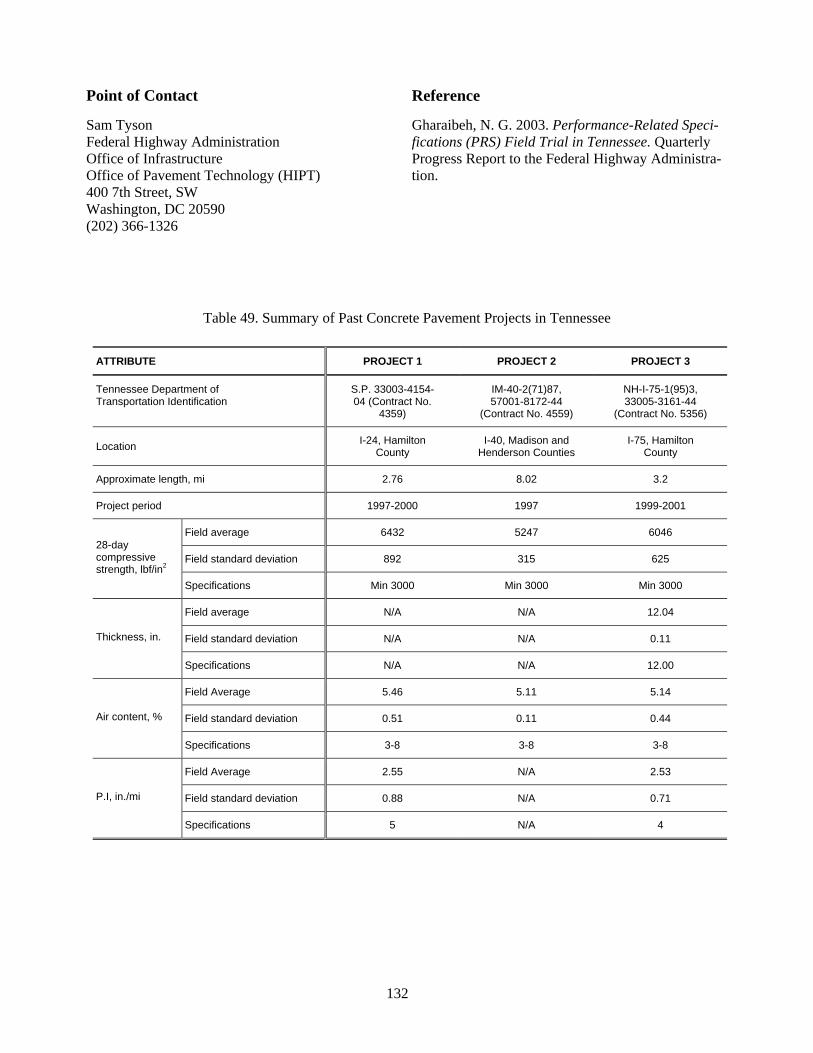
Table 49 Summary of Past Concrete Pavement Projects in Tennessee 132
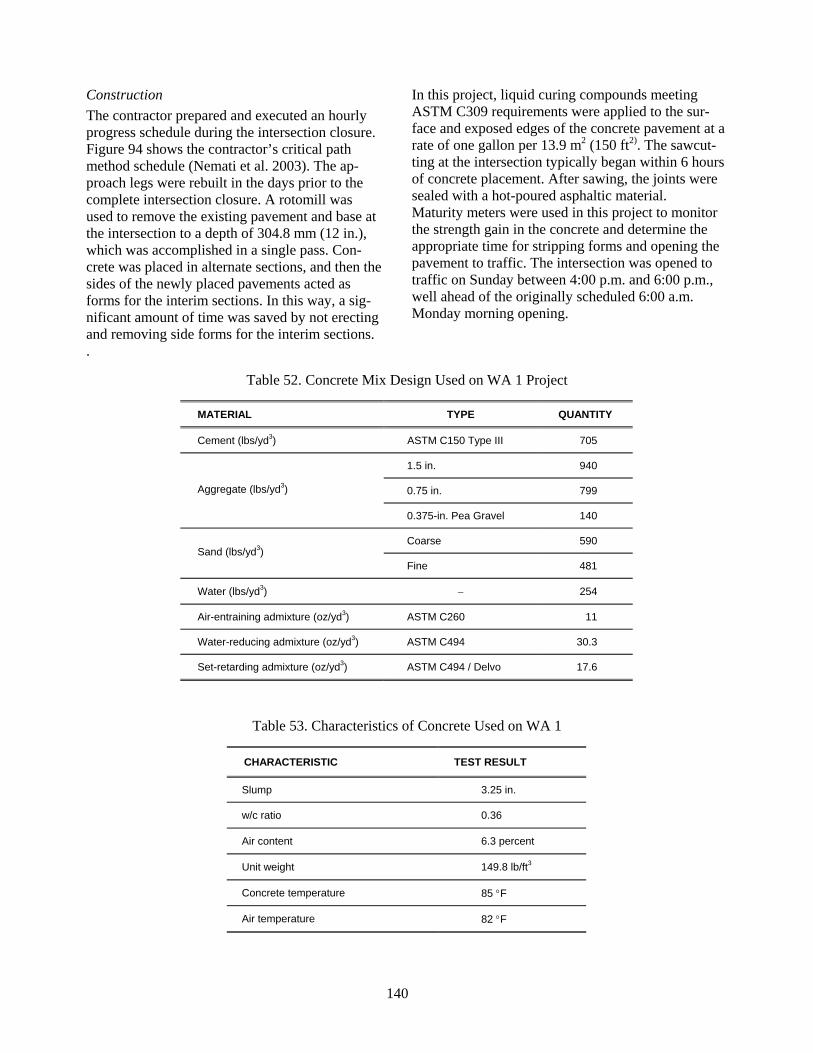
Table 51 Summary of Concrete Properties Measured on VA 1 Project (Ozyildirim 2000)136
Table 52 Concrete Mix Design Used on WA 1 Project140
Table 53 Characteristics of Concrete Used on WA 1140
Table 54 Experimental Design Matrix for WI 2156
Table 55 Experimental Design Matrix for WI 3158
Table 56 Summary of Dowel Bar Location Study Results From WI 2 (Crovetti 1999) 159
Table 57 Summary of FWD Test Results for WI 2 and WI 3 Projects (Crovetti 1999)160
xviii
Table 58 Test Section Design Parameters for FHWA 1 Project (CTL 2001) 166
Table 59 Performance of UTW Test Sections (CTL 2001 FHWA 2004)168
xix
ACKNOWLEDGMENTS
Many individuals contributed to the development of this report by willingly providing research reports work plans internal memos and other documentation on their TE-30 projects The authors gratefully acknowledge the following individuals for providing that assistance
Ahmad Ardani Colorado DOT Mark Gawedzinski Illinois DOT David Lippert Illinois DOT Tommy Nantung Indiana DOT Jim Cable Iowa State University Mark Dunn Iowa DOT John Wojakowski Kansas DOT Dimitrios Goulias University of Maryland David Smiley Michigan DOT Tom Hines Michigan DOT Dave Rettner Minnesota DOT Curt Turgeon Minnesota DOT Tom Burnham Minnesota DOT Randy Battey Mississippi DOT Tim Chojnacki Missouri DOT Charles Goodspeed University of New Hampshire Shad Sargand Ohio University Anastasios Ioannides University of Cincinnati Roger Green Ohio DOT V Ramakrishnan South Dakota School of Mines and Technology
Daniel Strand South Dakota DOT Dave Huft South Dakota DOT Dan Johnston South Dakota DOT Celik Ozyildirim Virginia Transportation Research Council David Kuemmel Marquette University
Jim Crovetti Marquette University
Debbie Bischoff Wisconsin DOT Peter Kemp Wisconsin DOT
xx
Chapter 1 INTRODUCTION
Background
Under Test and Evaluation Project 30 (TE-30) High Performance Concrete Pavement (HPCP) the Federal Highway Administration (FHWA) is exshyploring the applicability of innovative portland ceshyment concrete (PCC) pavement design and conshystruction concepts in the United States These innovative concepts ranging from the use of trapeshyzoidal cross sections to alternative dowel bar mateshyrials to fiber-reinforced concrete all share the same TE-30 goal of providing long-lasting economical PCC pavements that meet the specific performance requirements of their particular application
The TE-30 program actually got its start in May 1992 when a team of State industry and Federal engineers participated in the US Tour of European Concrete Highways (US TECH) (FHWA 1992) During that visit the tour participants were exposed to a wealth of information on concrete pavement materials structural design and construction that could benefit concrete pavements in the United States Followup visits to Germany and Austria in October 1992 (Larson Vanikar and Forster 1993) provided additional information that was used to construct an experimental concrete pavement in the United States consisting of a German structural deshysign (to provide long service life) and an Austrian exposed aggregate surface (to reduce tire paveshyment noise) That pavement a 16-km (1-mi) test section located in the northbound lanes of I-75 (Chrysler Freeway) in downtown Detroit was conshystructed in 1993 (Weinfurter Smiley and Till 1994)
The success of the I-75 project in incorporating European design concepts that hold the promise of long-lasting low maintenance concrete pavements spawned a great interest in pursuing similar proshyjects In 1994 both the FHWA and industry agreed to pursue this effort effectively launching the TEshy30 program Broad functional or performance criteshyria were established so that participating State highway agencies (SHAs) could select the area conshysidered appropriate for improving the performance of concrete pavements in their States
Several innovation areas for the program were sugshygested
bull Increasing the service life
bull Decreasing construction time
bull Lowering life-cycle costs
bull Lowering maintenance costs
bull Constructing ultra-smooth ride quality pavements
bull Incorporating recycled or waste products while maintaining quality
bull Utilizing innovative construction equipshyment or procedures
bull Utilizing innovative quality initiatives
Specific target projects were later added including joint sealing alternatives alternative load transfer devices durable concrete mix designs alternative surface finishing techniques and more cost-effective use of paving materials (such as widened lanes trapezoidal cross sections and two-lift conshystruction)
In each of these applications emphasis is given to an integrated design approach in which site influshyences (traffic loading climate and subgrade) conshycrete mix design structural design joint details and construction are considered together to develop the appropriate pavement design Consequently the term ldquohigh performancerdquo does not necessarily refer to high strength concrete but rather to any of the materials and mix design structural design or conshystruction components of the pavement that are exshypected to contribute to the pavementrsquos long-term performance
Included Projects
The TE-30 Program has funded approximately 25 field projects since 1996 As previously noted these projects were intended to test and evaluate innovashytive concrete pavement technology in ldquoon-the-roadrdquo applications A report (FHWA 2002) summarized
1
the status of the projects initiated through Decemshyber 2001 several topic-specific reports were also prepared based on the results of the original FHWA report (Hoerner and Smith 2002 Smith 2002)
Since the preparation of the original report several additional field projects have been constructed and additional monitoring reports completed Moreover projects originally included in a similar FHWA test and evaluation project Field Trials of Concrete Pavement Product and Process Technology have been or are in the process of being constructed The projects included in this report are those from the previous FHWA report (FHWA 2002) with an addishytional 14 projects included from the Field Trials of Concrete Pavement Product and Process Technolshyogy initiative
The geographical distribution of the included proshyjects is shown in Figure 1 and the projects are listed in Table 1 For each project the table inshycludes information on the design features evaluated the year built the type of concrete pavement (jointed plain concrete pavement [JPCP] jointed reinforced concrete pavement [JRCP] continuously reinforced concrete pavement [CRCP] precast post-tensioned concrete pavement (PPCP) or fiber-reinforced concrete pavement [FRCP]) and whether the project was funded as part of the TE-30 program More detailed information on each project is provided in the relevant chapter and in Appendix A to this report
Purpose and Overview of Report
The previous FHWA report (FHWA 2002) provides the foundation for this report The 24 projects deshyscribed in that original report have been updated where new information was available and an addishytional 15 projects have been included in this report Most of these newer projects have been constructed and since the TE-30 program is ongoing it is necshyessary to ascertain the status of those projects that have been constructed
It is the purpose of this report to document the curshyrent status of the TE-30 projects and the Field Tri-als of Concrete Pavement Product and Process Technology sections as well The authors have also attempted to describe anticipated results from the TE-30 program and to recommend relevant future research activities Chapters 2 through 39 of this report summarize each individual project included to date describing the goals of the project the deshysign features being evaluated and any preliminary results or products
Two appendixes are included in support of this reshyport Appendix A provides a summary table conshytaining general design and construction information on each of the projects Appendix B lists references relevant to each of the projects organized by State
Figure 1 Location of TE-30 and related projects
2
Table 1 Listing of TE-30 and Related Projects
PAVEMENT YEAR PROJECT TE-30 TYPE DESIGN FEATURES EVALUATED BUILT
California 1 No PPCP Precast post-tensioned concrete pavement 2004 I-10 El Monte
Colorado 1 No UTW Ultrathin whitetopping 2001 SH 121 Wadsworth
Colorado 2 No JPCP Precast concrete slabs for full-depth repairs 2004 I-25 Loveland
Illinois 1 No JRCP Alternative dowel bar materials 1996 I-55 SB Williamsville
Illinois 2 Yes JRCP Alternative dowel bar materials 1997 IL 59 Naperville JPCP Sealedunsealed joints
Traffic counters
Illinois 3 Yes JPCP Alternative dowel bar materials 1999 US 67 WB Jacksonville Sealedunsealed joints
Illinois 4 No JPCP Alternative dowel bar materials 2000 SR 2 NB Dixon
Indiana 1 Yes JPCP Factors to reduce curlingwarping 2004 I-65 at SR 60 Clark County
Iowa 1a Yes JPCP PCC mixing times on PCC properties 1996 IA 5 Carlisle
Iowa 1b Yes JPCP PCC mixing times on PCC properties 1996 US 30 Carroll
Iowa 2 Yes JPCP Alternative dowel bar materials 1997 US 65 Bypass Des Moines Alternative dowel bar spacings
Iowa 3 Yes JPCP Fly-ash stabilization of PCC 2001 US 151 LinnJones
Iowa 4 No JPCP Elliptical steel dowel bars 2002 IA 330 Jasper Story and Marshall Counties
Iowa 5 No JPCP Elliptical fiber-reinforced polymer dowel bars 2002 Iowa 330 Melbourne
Iowa 6 No Various Fly-ash stabilization of subgrade for PCC pavements NA Various locations
Iowa 7 No Various Total Environmental Management for Paving (TEMP) NA
Kansas 1 Yes JPCP Alternative dowel bar materials 1997 K-96 Haven FRCP Alternative PCC mix designs (including fiber PCC)
Joint sawing alternatives Joint sealing alternatives Surface texturing Two-lift construction
Kansas 2 Yes JPCP Smoothness monitoring of plastic concrete 2001 Hutchinson
Maryland 1 Yes JPCP PCC mix design 2001 US 50 Salisbury Bypass FRCP Fiber PCC
Michigan 1 No JRCP Two-lift construction 1993 I-75 NB Detroit JPCP Exposed aggregate
Thick foundation Alternative dowel bar materials and spacing
3 Continued on page 4
Continued from page 3
PROJECT TE-30 PAVEMENT
TYPE DESIGN FEATURES EVALUATED YEAR BUILT
Michigan 2 M25 Port Austin I-675 Zilwaukee
No JRCP Precast concrete slabs for full depth repairs 2003
Minnesota 1 Yes JPCP Alternative dowel bars 2000 I-35W Richfield PCC mix design
Minnesota 2 Yes JPCP Alternative dowel bar materials 2000 MnROAD Low Volume Road Facility Albertville
Dowelednondoweled joints PCC mix design
Minnesota 3 MnROAD Mainline Road Facility and US 169 Albertville
No UTW Application of ultrathin whitetopping 1997
Mississippi 1 US 72 Corinth
Yes Resin-Modified
Alternative PCC paving material (resin-modified pavement)
2001
Missouri 1 Yes JPCP Fiber PCC 1998 I-29 SB Rock Port FRCP Slab thickness
Joint spacing
New Hampshire 1 Yes NA HPCP definitions ldquoDesign Optimizationrdquo computer program
NA
Ohio 1 US 50 Athens
Yes JRCP PCC mix design (GGBFS) Evaluation of HIPERPAV
1997shy1998
Ohio 2 Yes JRCP Alternative dowel bar materials 1997 US 50 Athens
Ohio 3 US 50 Athens
Yes JRCP Sealedunsealed joints 1997shy1998
Ohio 4 US 35 Jamestown
Yes JPCP Evaluation of soil stiffness using nondestructive testing devices
2001
Pennsylvania 1 SR 22 Murrysville
Yes JPCP Evaluation of HIPERPAV 2004
South Dakota 1 US 83 Pierre
Yes JPCP FRCP
PCC mix design Joint spacing Dowelednondoweled joints
1996
Tennessee 1 I-65 Nashville
No JPCP Implementation of performance-related specifications 2004
Virginia 1 I-64 Newport News
Yes JPCP PCC mix design 1998shy1999
Virginia 2 VA 288 Richmond
Yes CRCP PCC mix design Steel contents
2004
Virginia 3 US 29 Madison Heights
Yes CRCP PCC mix design Steel contents
2004
Washington 1 SR 395 Kennewick
No JPCP PCC mix design for rapid construction 2000
West Virginia 1 Corridor H Route 219 Elkins University Avenue Routes 857 and 119 Morgantown Route 9 between Martinsburg and Charlestown
No JPCP
JPCP
CRCP
Alternative dowel bar materials size spacing
Alternative dowel bar materials and FRP moisture diffusion FRP versus steel longitudinal reinforcing bars
2002 2002
2006
Wisconsin 1 WI 29 Abbotsford
Yes JPCP Surface texturing 1997
4 Continued on page 5
Continued from page 4
PROJECT TE-30 PAVEMENT
TYPE DESIGN FEATURES EVALUATED YEAR BUILT
Wisconsin 2 Yes JPCP Alternative dowel bar materials 1997 WI 29 Owen Alternative dowel bar spacings
Wisconsin 3 Yes JPCP Alternative dowel bar materials 1997 WI 29 Hatley Alternative dowel bar spacings
Trapezoidal cross section
Wisconsin 4 I-90 Tomah
Yes JPCP Alternative dowel bar materials PCC mix design
2002
FHWA 1 No UTW Ultrathin whitetopping repair techniques 1998shy1999
Various States 1 No JPCP Evaluation of magnetic tomography for dowel bar location (MIT Scan-2)
2003 +
KEY CRCP = continuously reinforced concrete pavement FRCP = fiber-reinforced concrete pavement FRP = fiber-reinforced polymer GGBFS = ground granulated blast furnace slag JPCP = jointed plain concrete pavement JRCP = jointed reinforced concrete pavement PCC = portland cement concrete PPCP = precast post-tensioned concrete pavement
References
Federal Highway Administration (FHWA) 1992 Report on the 1992 US Tour of European Con-crete Highways FHWA-SA-93-012 Federal Highshyway Administration Washington DC
mdashmdashmdash March 2002 High Performance Concrete Pavements Project Summary FHWA-IF-02-026 Federal Highway Administration Washington DC
Hoerner T E and K D Smith 2002 High Per-formance Concrete Pavement Pavement Texturing and Tire-Pavement Noise FHWA-IF-02-020 Fedshyeral Highway Administration Washington DC
Larson R M S Vanikar and S Forster 1993 US Tour of European Concrete Highways (US
TECH) Follow-Up Tour of Germany and Austriamdash Summary Report FHWA-SA-93-080 Federal Highway Administration Washington DC
Smith K D 2002 High Performance Concrete Pavement Alternative Dowel Bars for Load Trans-fer in Jointed Concrete Pavements FHWA-IF-02shy052 Federal Highway Administration Washington DC
Weinfurter J A D L Smiley and R D Till 1994 Construction of European Concrete Pave-ment on Northbound I-75mdashDetroit Michigan Reshysearch Report R-1333 Michigan Department of Transportation Lansing
5
Chapter 2 CALIFORNIA 1 (I-10 EL MONTE)
Introduction
Caltrans has undertaken this project to evaluate the feasibility of using precast post-tensioned concrete pavement for rapid replacement of a deteriorated roadway
Study Objectives
The objectives of the project are to demonstrate the constructibility and cost effectiveness of precast post-tensioned concrete pavements under high-volume urban freeway conditions
Project Design and Layout
The project includes the replacement of a 248-ft section of I-10 in Los Angeles County A total of 31 precast concrete pavement segments were fabrishycated in accordance with the ldquoTexasrdquo design as deshyscribed by Merritt McCullough and Burns (2003) Replacement panels were precast in segments 24 m (8 ft) long 113 m (37 ft) wide and 254 mm (10 in) thick The panels contain formed keyways along the edges normal to the direction of travel Three types of precast panels are fabricated base panels joint panels and central stressing panels The nominal pavement thickness is 254 mm (10 in) with a grade reversal at the outside shoulder with increased thickness at the crown In the construction process the panels are placed and then post tenshysioned in the direction of travel using stressing pockets in the slabs at the mid length of each secshytion
State Monitoring Activities
Under contract with FHWA a research agency is monitoring the performance of the project for a minimum of 1 year If funding allows cracking smoothness and spalling evaluations will also be conducted at years 3 and 5 Other evaluation items
will include expansion joint condition and vertical slab movements
Preliminary ResultsFindings
This experimental project was completed in April 2004 Precasting of the 31 panels began in Decemshyber 2003 and was completed in early January 2004 The panels were then stored until the construction crew was ready for installation The panels were placed in 2 nights followed by 4 days of post-tensioning and grouting Currently a construction video is available from FHWA and a construction report will be completed within the next year
Points of Contact
Kirsten Stahl Pavement Engineer Caltrans District 7 100 S Main Street Los Angeles CA 90012 (213) 897-0470 kirstenstahldotcagov
Jason Dietz FHWA California Division Office 980 9th Street Suite 400 Sacramento CA 95814-2724 (916) 498-5886 jasondietzfhwadotgov
References
Merritt D K B F McCullough and N H Burns 2003 ldquoPrecast Prestressed Concrete Pavement Pilot Project Near Georgetown Texasrdquo Transportation Research Record 1823 Transportation Research Board Washington DC
6
Chapter 3 COLORADO 1 (SH 121 Wadsworth Colorado)
Introduction
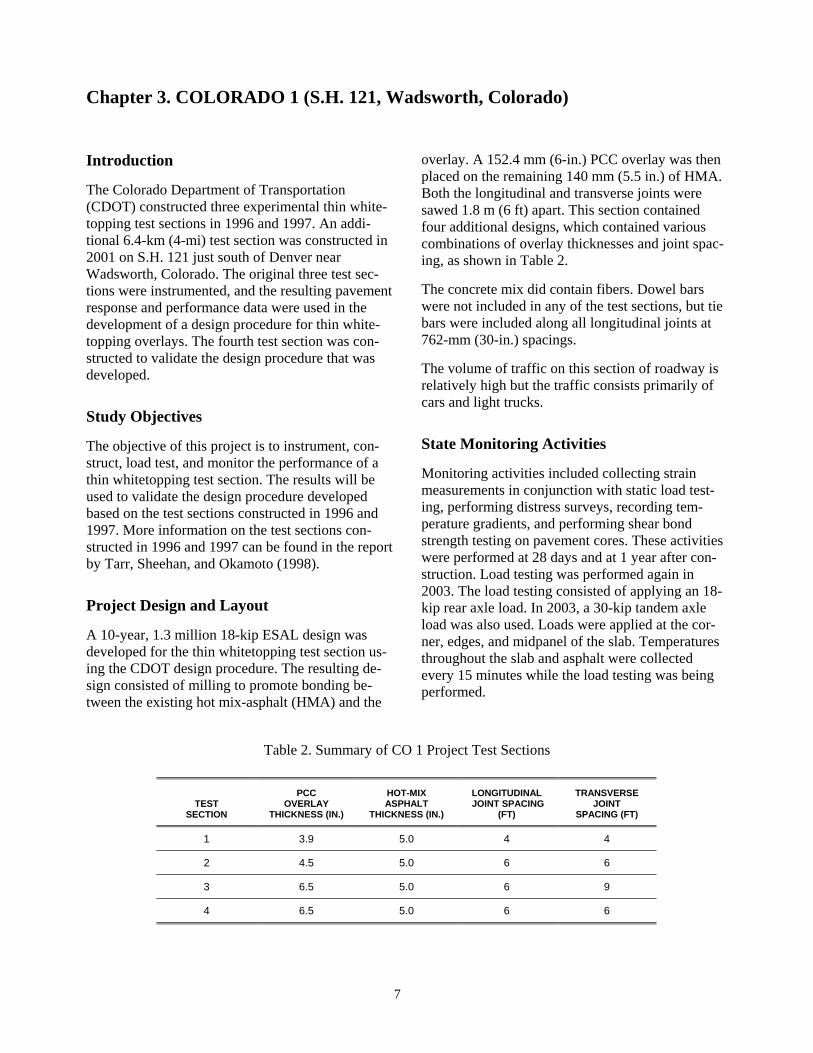
The Colorado Department of Transportation (CDOT) constructed three experimental thin white-topping test sections in 1996 and 1997 An addishytional 64-km (4-mi) test section was constructed in 2001 on SH 121 just south of Denver near Wadsworth Colorado The original three test secshytions were instrumented and the resulting pavement response and performance data were used in the development of a design procedure for thin white-topping overlays The fourth test section was conshystructed to validate the design procedure that was developed
Study Objectives
The objective of this project is to instrument conshystruct load test and monitor the performance of a thin whitetopping test section The results will be used to validate the design procedure developed based on the test sections constructed in 1996 and 1997 More information on the test sections conshystructed in 1996 and 1997 can be found in the report by Tarr Sheehan and Okamoto (1998)
Project Design and Layout
A 10-year 13 million 18-kip ESAL design was developed for the thin whitetopping test section usshying the CDOT design procedure The resulting deshysign consisted of milling to promote bonding beshytween the existing hot mix-asphalt (HMA) and the
overlay A 1524 mm (6-in) PCC overlay was then placed on the remaining 140 mm (55 in) of HMA Both the longitudinal and transverse joints were sawed 18 m (6 ft) apart This section contained four additional designs which contained various combinations of overlay thicknesses and joint spacshying as shown in Table 2
The concrete mix did contain fibers Dowel bars were not included in any of the test sections but tie bars were included along all longitudinal joints at 762-mm (30-in) spacings
The volume of traffic on this section of roadway is relatively high but the traffic consists primarily of cars and light trucks
State Monitoring Activities
Monitoring activities included collecting strain measurements in conjunction with static load testshying performing distress surveys recording temshyperature gradients and performing shear bond strength testing on pavement cores These activities were performed at 28 days and at 1 year after conshystruction Load testing was performed again in 2003 The load testing consisted of applying an 18shykip rear axle load In 2003 a 30-kip tandem axle load was also used Loads were applied at the corshyner edges and midpanel of the slab Temperatures throughout the slab and asphalt were collected every 15 minutes while the load testing was being performed
Table 2 Summary of CO 1 Project Test Sections
TEST SECTION
PCC OVERLAY
THICKNESS (IN)
HOT-MIX ASPHALT
THICKNESS (IN)
LONGITUDINAL JOINT SPACING
(FT)
TRANSVERSE JOINT
SPACING (FT)
1 39 50 4 4
2 45 50 6 6
3 65 50 6 9
4 65 50 6 6
7
Preliminary ResultsFindings
The average bond shear strength was 100 lbfin2 and this appears to be sufficiently high to provide good performance for the overlay designs represhysented on State highway 121
The strains induced by the static 18-kip single-axle load placed along the edge of the slab were conshyverted to stress and are summarized in Table 3 The data show a reduction in stress as the slab thickness increases and the panel size decreases
The stress predicted by the design equations was calculated for the loading conditions in the field The predicted stresses were lower than the stresses determined using the measured strains This is exshypected because the measured strains did not capture curling and warping restraint stresses
Table 3 Ranges of Edge Stresses Measured Under an 18-Kip Single-Axle Load on the
CO 1 Project Test Sections
TEST SECTION
PCC THICKNESS
(IN) PANEL SIZE
(FT)
STRESS RANGE
(LBFIN2)
1 39 4 x 4 80ndash175
2 45 6 x 6 75ndash160
3 65 6 x 9 55ndash110
4 65 6 x 6 60ndash100
Current Project Status Results and Findings
A final report on the revisions to the thin whitetopshyping design procedure (Sheehan Tarr and Tayabji 2004) is available from the Colorado Department of Transportation
Point of Contact
Ahmad Ardani Colorado Department of Transportation 4201 East Arkansas Ave Rm A-100 Denver CO 80222 AhmadArdanidotstatecous (303) 757-9978
References
Sheehan M J S M Tarr and S D Tayabji 2004 Instrumentation and Field Testing of Thin White-topping Pavement in Colorado and Revision of the Existing Colorado Thin Whitetopping Procedure Report No CDOT-DTD-R-2004-12 Colorado Deshypartment of Transportation Denver
Tarr S M M J Sheehan and P A Okamoto 1998 Guidelines for the Thickness Design of Bonded Whitetopping Pavement in the State of Colorado Report No CDOT-DTD-R-98-10 Coloshyrado Department of Transportation Denver
8
Chapter 4 COLORADO 2 (I-25 Loveland) and MICHIGAN 2 (M25 Port Austin and I-675 Zilwaukee)
Introduction
An alternative to conventional cast-in-place conshycrete repairs is the use of precast concrete patches to address issues related to joint and slab deteriorashytion The use of precast panels has the potential to reduce construction time increase long-term paveshyment performance and reduce user delays Howshyever there are limited laboratory or field data on the construction and performance of full-depth precast concrete patches In 2003 Michigan State Univershysity in conjunction with the Michigan and Colorado Departments of Transportation (DOTs) initiated an FHWA-sponsored project to study the feasibility of precast panels as an alternative to cast-in-place conshycrete repairs Sites in both Colorado (Figure 2) and Michigan were selected
Figure 2 Location of CO 2 project
Study Objectives
The objectives of this project are (Buch 2002)
1 Review the literature and document the known practices
2 Conceptualize various construction alternashytives as they relate to precast concrete patches
3 Identify potential concrete pavement restorashytion projects along in-service concrete paveshyments in Colorado and Michigan and install precast concrete patches For the purposes of
poses of comparison control cast-in place full-depth patches will also be installed
4 Investigate the effectiveness and efficiency of precast panels through the development of maintenance performance guidelines
5 Recommend strategies for monitoring the ldquonewlyrdquo installed precast patches
6 Produce step-by-step guidelines for the conshystruction of precast concrete panels
Project Design and Layout
Hundreds of precast panels will be installed and monitored for performance along interstate highshyways in Michigan and Colorado The construction in Michigan will include the installation of 20 preshycast panels 12 along M25 (Port Austin) and 8 along I-675 (Zilwaukee) These 20 panels were slated for installation during the summer of 2003 The reshymaining panels will be installed on I-25 in Colorado beginning summer of 2003 and concluding in 2005 Nearly 450 panels will be installed on I-25 in Coloshyrado
The means of anchoring the precast panels is differshyent between the Michigan studies and the Colorado studies Details of each method are described in the following sections
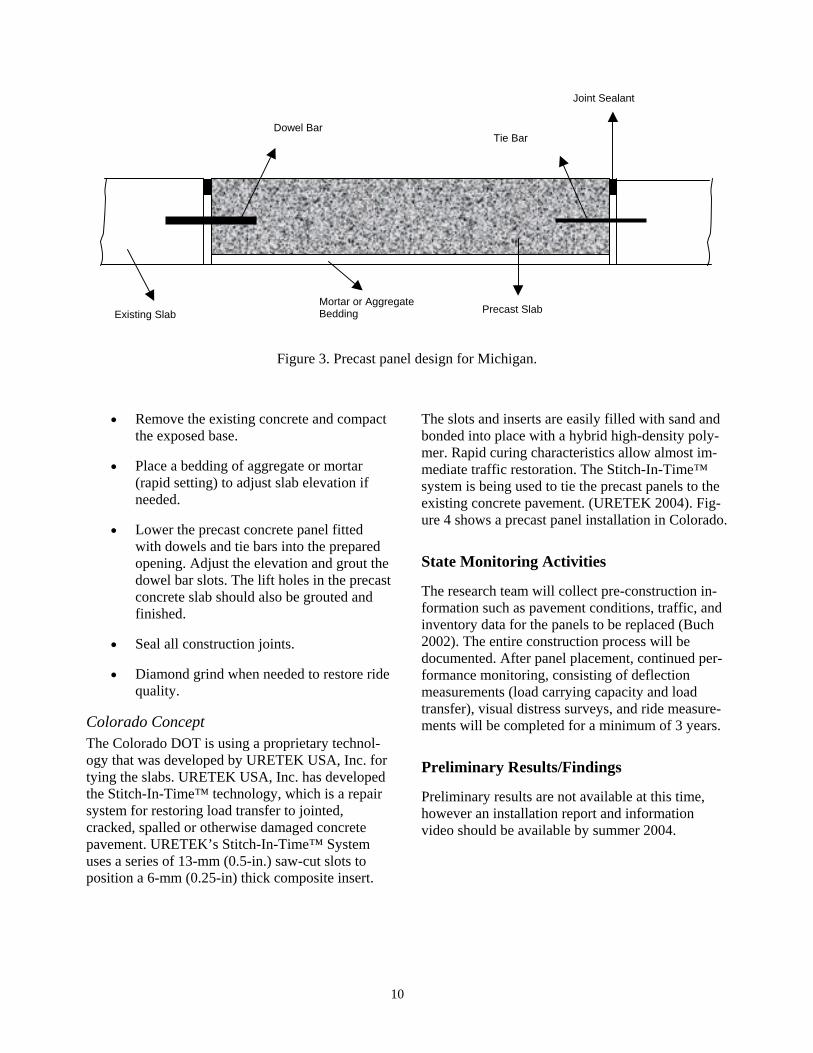
Michigan Concept The concept being used in Michigan is illustrated in Figure 3 and is completed by using the following techniques
bull Mark and saw cut the perimeter (full depth) of the existing deteriorated concrete paveshyment area and allow time for the rest of the slab to ldquorelaxrdquo and relieve stresses The width of the patch should be the same as one of the standard widths for precast conshycrete patches
bull Cut dowel and tie bar slots in the adjoining concrete slabs
9
Joint Sealant
Existing Slab Mortar or Aggregate
Dowel Bar Tie Bar
Precast SlabBedding
Figure 3 Precast panel design for Michigan
bull Remove the existing concrete and compact the exposed base
bull Place a bedding of aggregate or mortar (rapid setting) to adjust slab elevation if needed
bull Lower the precast concrete panel fitted with dowels and tie bars into the prepared opening Adjust the elevation and grout the dowel bar slots The lift holes in the precast concrete slab should also be grouted and finished
bull Seal all construction joints
bull Diamond grind when needed to restore ride quality
Colorado Concept The Colorado DOT is using a proprietary technolshyogy that was developed by URETEK USA Inc for tying the slabs URETEK USA Inc has developed the Stitch-In-Timetrade technology which is a repair system for restoring load transfer to jointed cracked spalled or otherwise damaged concrete pavement URETEKrsquos Stitch-In-Timetrade System uses a series of 13-mm (05-in) saw-cut slots to position a 6-mm (025-in) thick composite insert
The slots and inserts are easily filled with sand and bonded into place with a hybrid high-density polyshymer Rapid curing characteristics allow almost imshymediate traffic restoration The Stitch-In-Timetrade system is being used to tie the precast panels to the existing concrete pavement (URETEK 2004) Figshyure 4 shows a precast panel installation in Colorado
State Monitoring Activities
The research team will collect pre-construction inshyformation such as pavement conditions traffic and inventory data for the panels to be replaced (Buch 2002) The entire construction process will be documented After panel placement continued pershyformance monitoring consisting of deflection measurements (load carrying capacity and load transfer) visual distress surveys and ride measureshyments will be completed for a minimum of 3 years
Preliminary ResultsFindings
Preliminary results are not available at this time however an installation report and information video should be available by summer 2004
10
Figure 4 Precast panel installation in Colorado
Points of Contact References
Ahmad Ardani PE Research Engineer Colorado Department of Transportation 4201 E Arkansas Denver CO 80222 Ph (303) 757-9978 Fax (303) 757-9974 ahmadardanidotstatecous
Neeraj Buch PhD Assistant Professor 3546 Engineering Building Department of Civil and Environmental Engineering Michigan State University East Lansing MI 48821 Ph (517) 432-0012 Fax (517) 432-1827 buchegrmsuedu
Buch N 2002 Field Trials of Concrete Pavement Product and Process TechnologymdashPrecast Panel System for Full Depth Pavement Repairs Technical Proposal Michigan State University East Lansing
URETEK 2004 httpwwwuretekusacom servicesstitch_in_timeindexhtm
11
Illinois 1I-55 SB
Williamsville55
74
88
55
74
88
Chapter 5 ILLINOIS 1 (I-55 SB Williamsville)
Introduction
This project was the first constructed by the Illinois Department of Transportation (IDOT) to evaluate alternative dowel bars for use in jointed concrete pavements Constructed in 1996 the project is loshycated on the exit ramp of a weigh station in the southbound direction of I-55 (milepost 107) near Williamsville just north of Springfield (see Figure 5) Although not a TE-30 project it did serve as a springboard for future IDOT projects evaluating alternative dowel bars under the TE-30 program
Williamsville
SpringfieldIllinois 1 I-55 SB
Williamsville
Williamsville
Springfield
55
74
88
Figure 5 Location of IL 1 project
Study Objectives
On most concrete pavements steel dowel bars are used at transverse joints to provide positive load transfer between adjacent slabs However even if epoxy coated these dowel bars are susceptible to corrosion which can create locked or ldquofrozenrdquo joints that can spall and crack the concrete signifishycantly reducing the service life of the pavement The purpose of this study therefore is to compare the performance of non-corrosive type lsquoErsquo fibershyglass and polyester dowels to the performance of conventional epoxy-coated dowel bars in a side-byshyside field evaluation project
Project Design and Layout
This project was constructed in 1996 and consists of a 280-mm (1125-in) slab placed on a 100-mm (4-in) bituminous aggregate subbase (BAM) (Gawedzinski 2000) In accordance with IDOT practices at the time the jointed concrete paveshyment was constructed as a hinge-joint design in which conventional doweled transverse joints are spaced at 137-m (45-ft) intervals and intermediate ldquohingerdquo joints containing tie bars are placed at 46shym (15-ft) intervals between the doweled joints (see Figure 6) this pavement is essentially a jointed reinforced design with the reinforcing steel conshycentrated at locations where the pavement is exshypected to crack The hinge joints contain number 6 epoxy-coated tie bars 900-mm (36-in) long and placed at 450-mm (18-in) intervals across the joint (Gawedzinski 2000) Preformed compression seals (32-mm [125-in] wide) are placed in the doweled transverse joints and a hot-pour joint seal placed in the tied hinge joints (Gawedzinski 2000)
The pavement was paved 49-m (16-ft) wide and a 30-m (10-ft) tied portland cement concrete (PCC) shoulder was placed adjacent to the mainline exit ramp The shoulders were tied using number 6 epshyoxy-coated tie bars 900 mm (36 in) long and placed at 762-mm (30-in) intervals (Gawedzinski 2000)
Seven joints (excluding hinge joints) are included in the project the layout of which is shown in Figshyure 7 The first two regular transverse joints of the project contain conventional epoxy-coated steel dowel bars (38-mm [15-in] diameter) The next four regular transverse joints contain type lsquoErsquo fishyberglass and polyester bars (38-mm [15-in] diameter and 450-mm [18-in] long) The fiberglass and polyester resin bars were manufactured by RJD Industries of Laguna Hills California The final regular transverse joint in the project contains conventional epoxy-coated steel dowel bars
12
Figure 6 Illinois DOT hinge joint design (IDOT 1989)
45 f45 ftt BetwBetweeeenn CCoontntrraaccttioion Join Joinnttss
FroFromm WWeeigighh StaStattiioonn
2 Hi2 Hingnge Joe Jointintss 15 ft 15 ft
ToTo I-55I-55 SBSB
1616 ftft
JoJoinint 1t 1 ContContrrooll JoJoinintt
1155--inin EpEpoxoxyy--CCooaatteedd
JoJoinint 3t 3 JoJoinint 5t 5 115-5-iinn FFiiberber 115-5-inin FFiibbeerr
CoCompompossititee DoDowewelsls CoCommppoossitite Doe Dowelswels
JJooinint 7t 7 CoContntrol Joirol Joinntt
1515--inin EpEpoxoxyy--CoatedCoated DoDo Joinwelswels Joint 2t 2 JoinJoint 4t 4 JJooinin Dowt 6t 6 Doweellss
ConConttrorol Joinl Jointt 115-i5-inn FiFibeberr 115-5-iinn FFiiberber 1155--in Epin Epoxy-oxy-CCooatedated CoCompositmpositee DowDoweelsls CCoompmpososititee DoDowweelsls
DoDowelwelss
Figure 7 Layout of IL 1 project
13
State Monitoring Activities
IDOT collects traffic data from the sorter scale loshycated at the entrance ramp of the weigh station Traffic totals from the period from September 1996 to September 1999 are summarized in Table 4 (Gawedzinski 2000)
Table 4 Traffic Data for IL 1 (September 1996 to September 1999) (Gawedzinski 2000)
TRUCK TYPE NUMBER OF VEHICLES
ACCUMULATED 18-KIP ESAL
APPLICATIONS
Single unit 95623 31324
Multiple unit 1860542 3056458
TOTALS 1956165 3087783
All seven joints in the project are evaluated at least semi-annually by IDOT to assess their performance This evaluation consists of both distress surveys
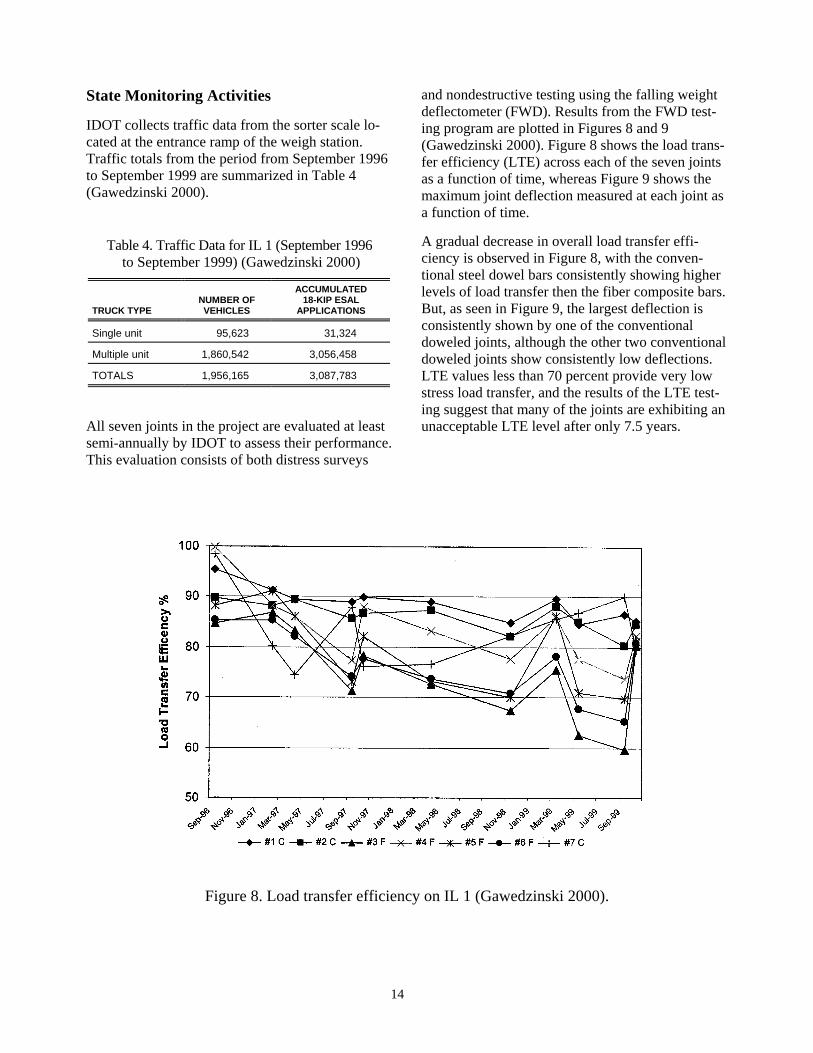
and nondestructive testing using the falling weight deflectometer (FWD) Results from the FWD testshying program are plotted in Figures 8 and 9 (Gawedzinski 2000) Figure 8 shows the load transshyfer efficiency (LTE) across each of the seven joints as a function of time whereas Figure 9 shows the maximum joint deflection measured at each joint as a function of time
A gradual decrease in overall load transfer effishyciency is observed in Figure 8 with the convenshytional steel dowel bars consistently showing higher levels of load transfer then the fiber composite bars But as seen in Figure 9 the largest deflection is consistently shown by one of the conventional doweled joints although the other two conventional doweled joints show consistently low deflections LTE values less than 70 percent provide very low stress load transfer and the results of the LTE testshying suggest that many of the joints are exhibiting an unacceptable LTE level after only 75 years
Figure 8 Load transfer efficiency on IL 1 (Gawedzinski 2000)
14
Figure 9 Maximum joint deflections on IL 1 (Gawedzinski 2000)
Preliminary ResultsFindings
After about 4 years of service this project is pershyforming well None of the joints is exhibiting any signs of distress IDOT will continue monitoring the project to assess the relative performance of the different dowel bar types
Interim Project Status Results and Findings
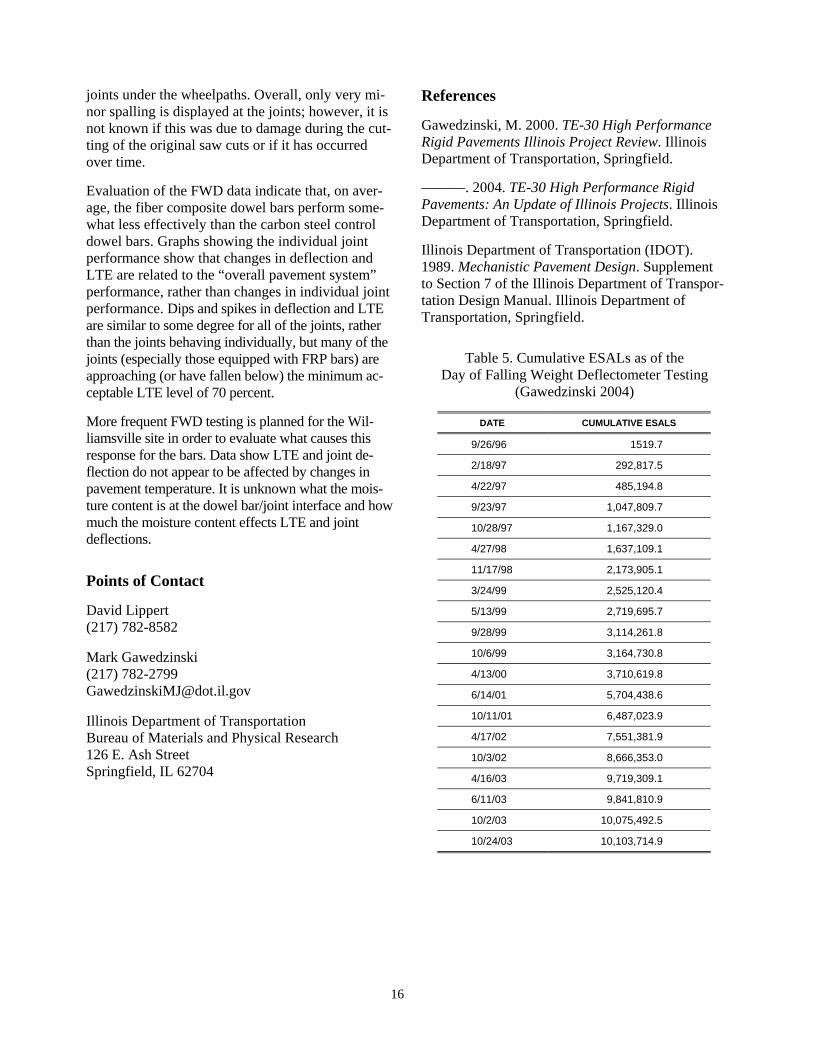
Truck data continues to be gathered from the sorter scale installed in the entrance ramp of the weigh station Equivalent single-axle loads (ESALs) were computed using scale vendor software and standard IDOT design coefficients Reported ESAL counts are lower than actual applied ESALs due to the failure of the hard drive on the sorter scale comshyputer for a 135-month period from January 23 2002 to March 13 2003 ESAL counts for the missing period were projected using the truck data previously gathered from the scale and manual counts obtained from scale operators Cumulative ESAL estimates are provided in Table 5 (Gawedzshyinski 2004)
Visual observations of the joints show no obvious signs of pavement distress neither faulting nor spalling was evident at any of the seven joints The
original construction had the joints sealed with a preformed elastomeric joint seal material comshypressed into a 1575-mm (062-in) wide joint Over time the preformed elastomeric joint material has been pushed deeper into the saw cut especially in the wheelpaths Deflection LTE and joint deflection values were determined for each of the seven paveshyment joints The average values were determined from deflections measured as simulated 4- 8- and 12-kip loads were applied to the pavement on the approach and leave sides of the joints The joints were tested at both inner and outer wheelpaths and at the center of the lane for a total of 18 tests per joint
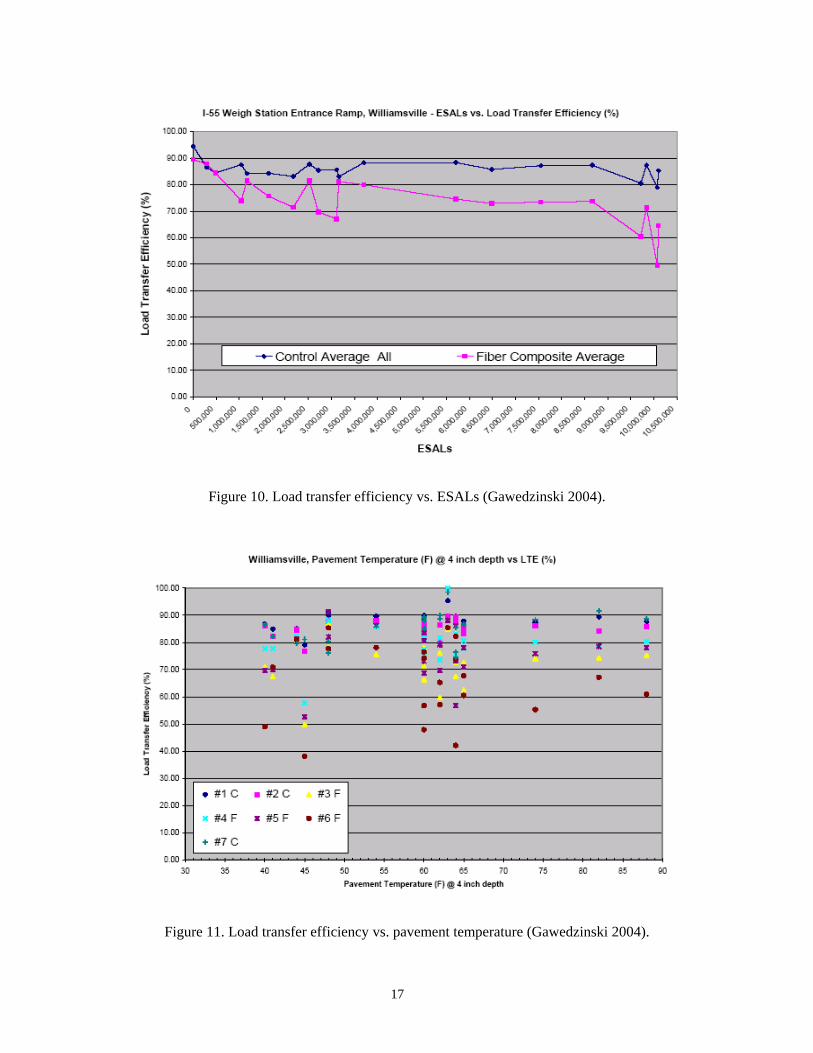
Figure 10 (Gawedzinski 2004) provides a summary of the LTE verses ESALs as measured over time Figure 11 (Gawedzinski 2004) provides a graph of average pavement temperature at a 4-in depth verses LTE
Current Observations (Gawedzinski 2004)
The Williamsville site is 75 years old and has been subjected to over 101 million ESALs The joints at Williamsville show very little sign of distress or damage The preformed elastomeric joint seal is still intact showing only that it is deeper in the
15
joints under the wheelpaths Overall only very mishynor spalling is displayed at the joints however it is not known if this was due to damage during the cutshyting of the original saw cuts or if it has occurred over time
Evaluation of the FWD data indicate that on avershyage the fiber composite dowel bars perform someshywhat less effectively than the carbon steel control dowel bars Graphs showing the individual joint performance show that changes in deflection and LTE are related to the ldquooverall pavement systemrdquo performance rather than changes in individual joint performance Dips and spikes in deflection and LTE are similar to some degree for all of the joints rather than the joints behaving individually but many of the joints (especially those equipped with FRP bars) are approaching (or have fallen below) the minimum acshyceptable LTE level of 70 percent
More frequent FWD testing is planned for the Wilshyliamsville site in order to evaluate what causes this response for the bars Data show LTE and joint deshyflection do not appear to be affected by changes in pavement temperature It is unknown what the moisshyture content is at the dowel barjoint interface and how much the moisture content effects LTE and joint deflections
Points of Contact
David Lippert (217) 782-8582
Mark Gawedzinski (217) 782-2799 GawedzinskiMJdotilgov
Illinois Department of Transportation Bureau of Materials and Physical Research 126 E Ash Street Springfield IL 62704
References
Gawedzinski M 2000 TE-30 High Performance Rigid Pavements Illinois Project Review Illinois Department of Transportation Springfield
mdashmdashmdash 2004 TE-30 High Performance Rigid Pavements An Update of Illinois Projects Illinois Department of Transportation Springfield
Illinois Department of Transportation (IDOT) 1989 Mechanistic Pavement Design Supplement to Section 7 of the Illinois Department of Transporshytation Design Manual Illinois Department of Transportation Springfield
Table 5 Cumulative ESALs as of the Day of Falling Weight Deflectometer Testing
(Gawedzinski 2004)
DATE CUMULATIVE ESALS
92696 15197
21897 2928175
42297 4851948
92397 10478097
102897 11673290
42798 16371091
111798 21739051
32499 25251204
51399 27196957
92899 31142618
10699 31647308
41300 37106198
61401 57044386
101101 64870239
41702 75513819
10302 86663530
41603 97193091
61103 98418109
10203 100754925
102403 101037149
16
Figure 10 Load transfer efficiency vs ESALs (Gawedzinski 2004)
Figure 11 Load transfer efficiency vs pavement temperature (Gawedzinski 2004)
17
59
74
88
55
74
88
55
Chapter 6 ILLINOIS 2 (Route 59 Naperville)
Introduction
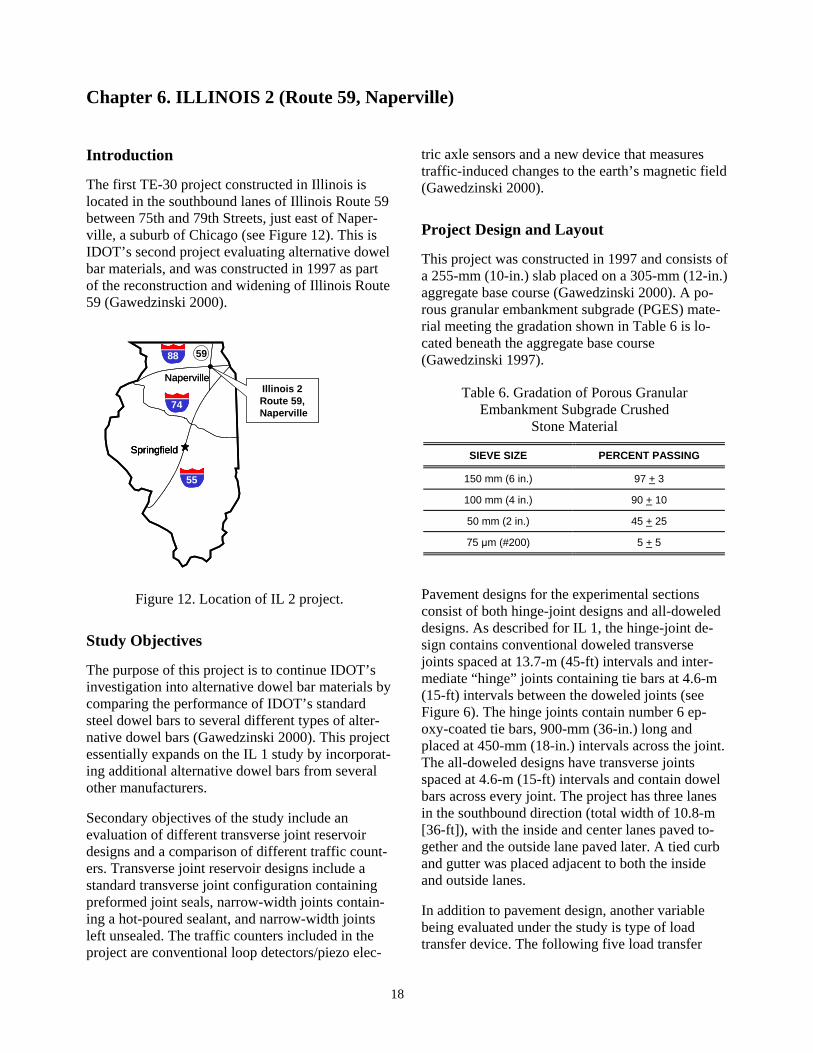
The first TE-30 project constructed in Illinois is located in the southbound lanes of Illinois Route 59 between 75th and 79th Streets just east of Napershyville a suburb of Chicago (see Figure 12) This is IDOTrsquos second project evaluating alternative dowel bar materials and was constructed in 1997 as part of the reconstruction and widening of Illinois Route 59 (Gawedzinski 2000)
Illinois 2Route 59Naperville
Naperville
Springfield
Illinois 2 Route 59 Naperville
59
Naperville
SpringfieldSpringfield
74
88
55
Figure 12 Location of IL 2 project
Study Objectives
The purpose of this project is to continue IDOTrsquos investigation into alternative dowel bar materials by comparing the performance of IDOTrsquos standard steel dowel bars to several different types of altershynative dowel bars (Gawedzinski 2000) This project essentially expands on the IL 1 study by incorporatshying additional alternative dowel bars from several other manufacturers
Secondary objectives of the study include an evaluation of different transverse joint reservoir designs and a comparison of different traffic countshyers Transverse joint reservoir designs include a standard transverse joint configuration containing preformed joint seals narrow-width joints containshying a hot-poured sealant and narrow-width joints left unsealed The traffic counters included in the project are conventional loop detectorspiezo elecshy
tric axle sensors and a new device that measures traffic-induced changes to the earthrsquos magnetic field (Gawedzinski 2000)
Project Design and Layout
This project was constructed in 1997 and consists of a 255-mm (10-in) slab placed on a 305-mm (12-in) aggregate base course (Gawedzinski 2000) A poshyrous granular embankment subgrade (PGES) mateshyrial meeting the gradation shown in Table 6 is loshycated beneath the aggregate base course (Gawedzinski 1997)
Table 6 Gradation of Porous Granular Embankment Subgrade Crushed
Stone Material
SIEVE SIZE PERCENT PASSING
150 mm (6 in)
100 mm (4 in)
50 mm (2 in)
75 μm (200)
97 + 3
90 + 10
45 + 25
5 + 5
Pavement designs for the experimental sections consist of both hinge-joint designs and all-doweled designs As described for IL 1 the hinge-joint deshysign contains conventional doweled transverse joints spaced at 137-m (45-ft) intervals and intershymediate ldquohingerdquo joints containing tie bars at 46-m (15-ft) intervals between the doweled joints (see Figure 6) The hinge joints contain number 6 epshyoxy-coated tie bars 900-mm (36-in) long and placed at 450-mm (18-in) intervals across the joint The all-doweled designs have transverse joints spaced at 46-m (15-ft) intervals and contain dowel bars across every joint The project has three lanes in the southbound direction (total width of 108-m [36-ft]) with the inside and center lanes paved toshygether and the outside lane paved later A tied curb and gutter was placed adjacent to both the inside and outside lanes
In addition to pavement design another variable being evaluated under the study is type of load transfer device The following five load transfer
18
270 ft 450 ft 210 ft 225 ft 150 ft 150 ft 450 ft 450 ft
devices are included (Gawedzinski 1997 Gawedz-inski 2000)
Joint width and joint sealant are other variables that are being evaluated under the study Two of the sections were constructed with 16-mm (062-in) wide transverse joints these were used on the hinge-joint designs only and were sealed with preshyformed elastomeric joint seals conforming to AASHTO M220 (Gawedzinski 2000) The other six sections were constructed with narrow 3-mm (012shyin) transverse joints five of these were sealed with a hot-poured sealant conforming to ASTM D3405 and one section was left unsealed (Gawedzinski 1997)
The layout of the sections is presented in Figure 13 This figure summarizes the main features included in each of the sections The experimental design matrix for this project is shown in Table 7
bull Conventional 38-mm (15-in) diameter epshyoxy-coated steel dowel bars conforming to ASTM M227
bull 38-mm (15-in) diameter polyester and type E fiberglass dowel bars manufactured by RJD Industries
bull 44-mm (175-in) diameter polyester and type E fiberglass dowel bars manufactured by RJD Industries
bull 38-mm (15-in) diameter polyester and type E fiberglass dowel bars manufactured by Corrosion Proof Products Inc
bull 38-mm (15-in) diameter epoxy resin and type E fiberglass dowel bars manufactured by Glasforms Inc
IL Route 59 SB
Section 1Hinge Joint
15-in Steel DowelsWide Joints
Preformed Seal
Section 2Hinge Joint
15-in Fiberglass Dowels(RJD Industries)
Wide JointsPreformed Seal
Section 3All Doweled Joints
15-in Fiberglass Dowels(RJD Industries)
Narrow JointsHot-Poured Sealant
Section 4All Doweled Joints
175-in Fiberglass Dowels(RJD Industries)Narrow Joints
Hot-Poured Sealant
Section 5All Doweled Joints
15-in Fiberglass Dowels(Corrosion Proof Products)
Narrow JointsHot-Poured Sealant
Section 6All Doweled Joints
15-in Fiberglass Dowels(Glasforms Inc)
Narrow JointsHot-Poured Sealant
Section 7All Doweled Joints15-in Steel Dowels
Narrow JointsNo Joint Sealant
Section 8All Doweled Joints15-in Steel Dowels
Narrow JointsHot-Poured Sealant
IL Route 59 SB
Section 1 Hinge Joint
15-in Steel Dowels Wide Joints
Preformed Seal
Section 2 Hinge Joint
15-in Fiberglass Dowels (RJD Industries)
Wide Joints Preformed Seal
Section 3 All Doweled Joints
15-in Fiberglass Dowels (RJD Industries)
Narrow Joints Hot-Poured Sealant
Section 4 All Doweled Joints
175-in Fiberglass Dowels (RJD Industries) Narrow Joints
Hot-Poured Sealant
Section 5 All Doweled Joints
15-in Fiberglass Dowels (Corrosion Proof Products)
Narrow Joints Hot-Poured Sealant
Section 6 All Doweled Joints
15-in Fiberglass Dowels (Glasforms Inc)
Narrow Joints Hot-Poured Sealant
Section 7 All Doweled Joints 15-in Steel Dowels
Narrow Joints No Joint Sealant
Section 8 All Doweled Joints 15-in Steel Dowels
Narrow Joints Hot-Poured Sealant
270 ft 450 ft 210 ft 225 ft 150 ft 150 ft 450 ft 450 ft
Figure 13 Layout of IL 2 project
19
Table 7 Experimental Design Matrix for IL 2
JRCP HINGE-JOINT DESIGN 45-FT JOINT SPACING
JPCP ALL-DOWELED JOINTS 15-FT JOINT SPACING
Preformed Seal
(wide joints)
Hot-Poured Sealant (narrow joints)
No Sealant
Preformed Seal (wide joints)
Hot-Poured Sealant
(narrow joints) No
Sealant
38-mm (15-in) Epoxy-Coated Steel Dowel Bars
Section 1 (270 ft long 6
doweled joints)
Section 8 (450 ft long 30 doweled joints)
Section 7 (450 ft long 30 doweled joints)
38-mm (15-in) Polyes-ter and Type E Fiberglass Dowel Bars (RJD Industries)
Section 2 (450 ft long 10 doweled
joints)
Section 3 (210 ft long 14 doweled joints)
44-mm (175-in) Poly- Section 4 ester and Type E Fi- (225 ft long 15 berglass Dowel Bars doweled joints) (RJD Industries)
38-mm (15-in) Polyes-ter and Type E Fiberglass Dowel Bars (Corrosion Proof Products Inc)
Section 5 (150 ft long 10 doweled joints)
38-mm (15-in) Epoxy- Section 6 Resin and Type E (150 ft long 10 Fiberglass Dowel Bars doweled joints) (Glasforms Inc)
State Monitoring Activities
IDOT collects traffic data for the three southbound and three northbound lanes using two devices bull Peek 241 traffic classifier bull Nu-Metrics Groundhogreg traffic sensors
The Peek 241 uses traditional traffic loop detectors placed in the subbase with piezo electric axle sensors installed in channels sawed in the surface of the pavement (Gawedzinski 1997) The Groundhogreg uses changes in the earthrsquos magnetic field to classify vehishycles and requires only a 178-mm (7-in) diameter hole cored in the new pavement to install the device Howshyever because problems were encountered with the Groundhogreg device no comparisons between the deshyvices are possible (Gawedzinski 2000)
Traffic data for the three experimental southbound lanes are summarized in Table 8 (Gawedzinski 2000) The data are for the period September 25 1997 to January 31 2000 The number of ESALs for each lane
was estimated by applying the percentage of vehicles in each lane to the total number of ESALs that were reported for all three traffic lanes (1515401)
This project is evaluated by IDOT on at least a semishyannual basis Evaluation consists of both distress surshyveys and nondestructive testing using the FWD Reshysults from the FWD testing program are plotted in Figures 14 and 15 for sections 1 through 6 only (Gawedzinski 2000) Figure 14 shows the average load transfer for the six test sections as a function of time whereas Figure 15 shows the average maximum joint deflection measured for the sections as a function of time The best overall load transfer is exhibited by section 1 which contains the conventional steel dowel bars The other sections all vary from about 70 to 85 percent but it is interesting to note how the load transshyfer fluctuates over time presumably because of the season and temperature at the time of testing These LTE values are considered marginal particularly for a pavement that is only a few years old
20
Lo
ad T
ran
sfer
Eff
icie
ncy
()
100
95
90
85
80
75
70
65
60
55
50 S1 S2
Aug-97
Apr-97
Oct-98
Mar-99
Oct-99
S3 S4 S5 S6
T est Section
Jo
int D
efle
ctio
n (m
ils)
900
800
700
600 Aug-97
Apr-97 500 Oct-98
400 Mar-99
Oct-99 300
200
100
000 S1 S2 S3 S4 S5 S6
T est Section
Table 8 Traffic Data for IL 2 (September 25 1997 to January 31 2000) (Gawedzinski 2000)
PROJECT TRAFFIC LANE
TOTAL NUMBER OF VEHICLES OF ALL VEHICLES
ESTIMATED ESALS BASED ON VEHICLE
Outside Lane 1 4687659 286 433404
Middle Lane 2 6040237 368 557668
Center Lane 3 5689235 346 524329
TOTALS 16417687 1000 1515401
Figure 14 Load transfer efficiency on IL 2 (Gawedzinski 2000)
Figure 15 Maximum joint deflections on IL 2 (Gawedzinski 2000)
21
Figure 15 shows that the maximum deflections for all joints is increasing over time with the maximum deshyflection during the October 1999 testing significantly larger for all six sections than the previous maximum deflection values
Preliminary ResultsFindings
After about 3 years of service this project is performshying well None of the joints is exhibiting any signs of distress IDOT will continue monitoring the project to assess the relative performance of the different dowel bar types and of the sealedunsealed joints
One issue for consideration in future installations of fiber composite dowel bars is the method used to seshycure the bar to the basket During construction of the middle and inner lanes of this project it was noted that the fiber composite bars were loose and only partially attached to the upper support wire of the basket (Gawedzinski 1997) A special metal spring clip proshyvided by RJD Industries was ultimately used to secure the dowel bars to the dowel basket and also to provide an additional frictional force to the bar to prevent it from moving as concrete was placed over the basket (Gawedzinski 1997)
Interim Project Status Results and Findings
In August 2002 the Model 241Traffic Classifier was replaced with a Road Reporter manufactured by Intershy
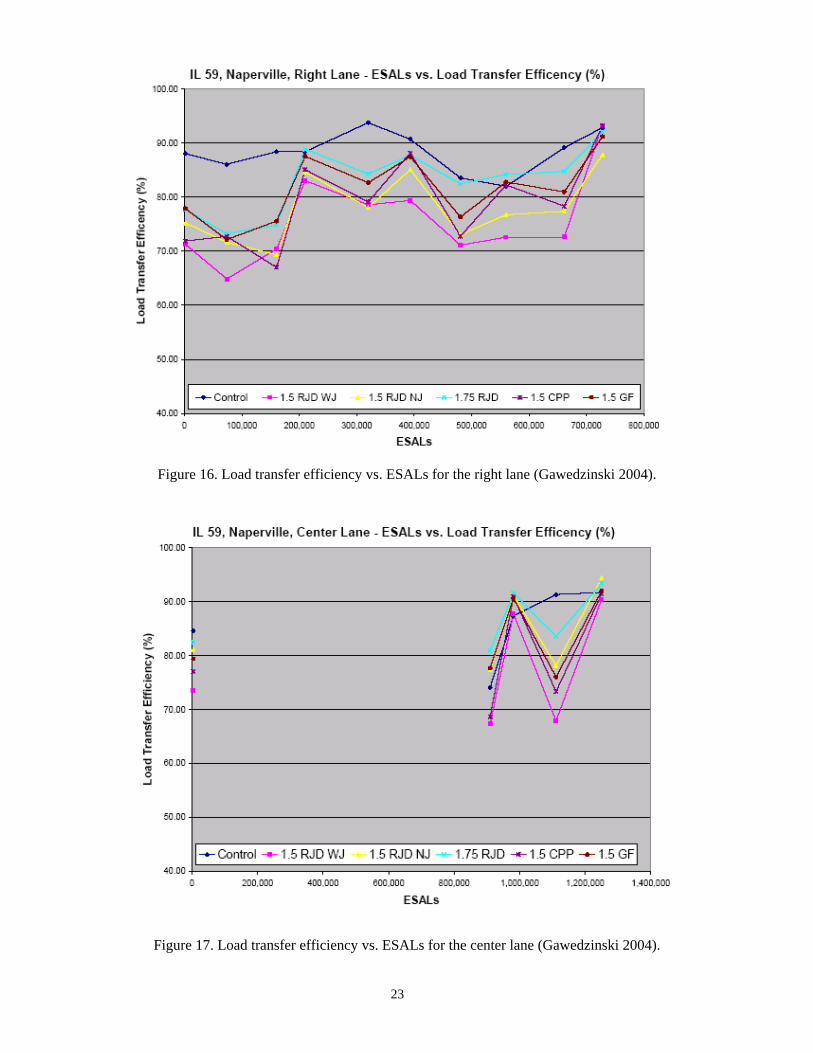
national Traffic CorporationPAT America Inc Daily traffic files are polled periodically and tabulated to provide monthly traffic totals for classification Stanshydard conversion factors used by are used to convert single unit (SU) and multiple unit (MU) truck counts to ESALs In May 2003 land development work on the properties on the east side of IL 59 resulted in an east-west access road intersecting IL 59 at the location of the traffic classifier loops and piezo sensors Traffic signals associated with the new road necessitated reloshycating the traffic classifier site approximately 06 km (04 mi) to the south Work on relocating the site will be complete in 2004 Cumulative ESAL information for each lane as reported by the Illinois Department of Transportation (Gawedzinski 2004) are provided in Table 9
FWD tests are currently performed annually across all of the test sections Certain sections were dropped from the FWD testing for a time due to traffic safety issues These issues were resolved and now FWD results are obtained for both wheelpaths and the center of the lane for all three lanes Visual observations of joint performance are performed periodically noting any changes in the appearance of the pavement Reshysults of the FWD tests are provided in Figures 16 through 18 for the right center and left lanes respecshytively
Table 9 Traffic Data for IL 2 (September 25 1997 to June 16 2003) (Gawedzinski 2004)
CUMULATIVE ESALS
DATE RIGHT LANE CENTER LANE LEFT LANE
82597 1751 4288 1008
4698 73677 146779 33118
101998 160540 306559 71363
32999 210187 412343 95277
101399 319964 614230 141165
42400 393299 761761 173867
101600 480678 909423 212076
51501 560141 981053 280037
5102 661433 1110816 326719
61603 728208 1249667 357084
22
Figure 16 Load transfer efficiency vs ESALs for the right lane (Gawedzinski 2004)
Figure 17 Load transfer efficiency vs ESALs for the center lane (Gawedzinski 2004)
23
Figure 18 Load transfer efficiency vs ESALs for the left lane (Gawedzinski 2004)
Current Observations (Gawedzinski 2004)
Evaluation of the joints shows typical behavior of the joints and the joint sealerfiller material with no obvious signs of spalling or faulting The preformed elastomeric joint sealer remains intact while the ASTM D-6690 (formerly ASTM D-3405) material is acting more as a joint filler in that there are areas across several joints where the material has become debonded from the pavement allowing water and incompressibles into the joint
Observations of the LTE vs time and ESALs graphs as well as the joint deflection vs time and ESALs graphs show somewhat consistent behavior for joint deflection with sections averaging 3 to 5
mils The LTE graphs show behavior consistent with a decrease in joint deflection Figure 19 shows the same type of behavior displayed at the Wilshyliamsville test site (IL 1) Plots of average values show no relationship between LTE or joint deflecshytion and average pavement temperature The control bars (381-mm [15-in] diameter epoxy-coated carshybon steel) have a higher LTE and lower joint deshyflection than any of the fiber composites but the overall performance of the fiber composite bars apshypears to be very close to the behavior of the epoxy-coated steel control set Nevertheless LTE values on the order of 70 to 80 percent after only a few years of service may suggest that the FRP bars are not suitable for long-term performance
24
Figure 19 Average load transfer efficiency vs pavement temperature for all lanes (Gawedzinski 2004)
Points of Contact
David Lippert (217) 782-8582
Mark Gawedzinski (217) 782-2799 GawedzinskiMJdotilgov
Illinois Department of Transportation Bureau of Materials and Physical Research 126 E Ash Street Springfield IL 62704
References
Gawedzinski M 1997 Fiber Composite Dowel Bar Experimental Feature Construction Report Illinois Department of Transportation Springfield
mdashmdashmdash 2000 TE-30 High Performance Rigid Pavements Illinois Project Review Illinois Departshyment of Transportation Springfield
mdashmdashmdash 2004 TE-30 High Performance Concrete Pavements An Update of Illinois Projects Illinois Department of Transportation Springfield
25
72
88
74
55
72
88
74
55
Chapter 7 ILLINOIS 3 (US 67 Jacksonville)
Introduction
The Illinois Department of Transportationrsquos (IDOTrsquos) second TE-30 project and their third evaluating alternative dowel bar materials is loshycated on the two westbound lanes of US Route 67 west of Jacksonville (see Figure 20) This project was constructed in 1999
67
Illinois 3US 67 WBJacksonville
JacksonvilleSpringfield
6767
Illinois 3 US 67 WB Jacksonville
Jacksonville SpringfieldSpringfield
72
88
74
55
Figure 20 Location of IL 3 project
Study Objectives
This project continues IDOTrsquos investigation of alshyternative dowel bar materials and joint sealing efshyfectiveness (Gawedzinski 2000) Several additional fiber composite dowel bars are evaluated in this study that were not included in previous studies and these comparisons are all done using IDOTrsquos now standard all-doweled jointed plain concrete pavement (JPCP) design In addition an unsealed section is included to further investigate the performance of unsealed joints
Project Design and Layout
Constructed in 1999 the basic pavement design for each section is a 250-mm (10-in) thick JPCP placed on a 100-mm (4-in) cement aggregate mixshyture (CAM) base course (Gawedzinski 2000) The existing subgrade was stabilized to a depth of 300 mm (118 in) with lime (Gawedzinski 2000)
Transverse joints are spaced at 46-m (15-ft) intershyvals and tied concrete shoulders are incorporated as part of the construction project
The project consists of seven test sections for evaluating alternative dowel bar materials and unshysealed joints The following load transfer devices are included in the study (Gawedzinski 2000)
bull 38-mm (15-in) diameter polyester and type E fiberglass dowel bars manufactured by RJD Industries
bull 38-mm (15-in) diameter vinyl ester and type E fiberglass dowel bars manufactured by Strongwell (Morrison Molded Fiber Glass Company)
bull 38-mm (15-in) diameter vinyl ester and type E fiberglass dowel bars manufactured by Creative Pultrusions Inc
bull Fiber-Contrade dowel bar manufactured by Concrete Systems Inc and consisting of a fibrillated type E fiberglass and polyester resin tube filled with hydraulic cement
bull 38-mm (15-in) diameter carbon steel rods clad with grade 316 stainless steel manushyfactured by Stelax Industries Inc
bull Conventional 38-mm (15-in) diameter epshyoxy-coated steel dowel bars conforming to ASTM M227
All but one of the sections was sealed with a hot-poured joint sealant conforming to ASTM D 3405 One section was left unsealed to compare the pershyformance of pavements with unsealed joints to that of sealed joints
The layout of the sections is presented in Figure 21 This figure summarizes the main features included in each of the sections The experimental design matrix for this project is shown in Table 10
26
150 ft 150 ft 165 ft 150 ft 150 ft 150 ft 150 ft
UUSS 6677 WWBB
SeSeccttiioonn 11 115-in5-in FFiibbeerglarglassss
DowDoweel Barsl Bars ((RJRJD InD Indudussttrriieess))
SealSealed Joied Joinnttss
SecSecttiioonn 22 115-i5-inn FiFibergbergllassass
DoDowweel Barsl Bars ((MorMorrriissoon Mon Moldldeedd FFiibbeer Gr Gllass Coass Co))
SeSealealedd JoJointsints
SeSectioction 3n 3 115-in F5-in Fiibeberglarglassss
DoDowweell BBaarrss ((CCrreaeatitiveve PuPultltrurusiosionnss
InIncc)) SealSealed Joined Jointsts
SectiSectioon 4n 4 FiFiberglberglass Tass Tubeubess FilFillleded wwiitthh CeCemmentent ((ConConccrete Systrete Systemsems
InIncc)) SeaSealleded JoJointsints
SeSectiction 5on 5 115-5-iinn SSttaaiinlnleessss SStteeeell
ClClaadd DDoowelwel BBaarrss ((StStelelax Inax Industdustrriesies
LtLtdd)) SeSeaalleedd JJooiinntsts
SectiSectioonn 66 115-in5-in EpoEpoxxyy--CoCoatateded
SteelSteel DoDowweell BarsBars UnseUnsealedaled JoJointintss
SecSecttiioonn 77 115-i5-inn EpoxyEpoxy--CoatCoateded
SteeSteel Dowl Doweell BarsBars SeSealealedd JoJointsints
150 ft 150 ft 165 ft 150 ft 150 ft 150 ft 150 ft
Figure 21 Layout of IL 3 project
State Monitoring Activities
IDOT installed an automatic traffic recording stashytion at the project site in February 2000 Traffic data are recorded using a Peek series 3000 ADR traffic classifier (Gawedzinski 2000) No traffic data are currently available Before the pavement was opened to traffic IDOT conducted FWD testshying on the experimental sections in June 1999 Reshysults from the FWD testing program are plotted in Figures 22 and 23 (Gawedzinski 2000) Figure 22
shows the average load transfer for the seven exshyperimental sections in both the driving and passing lanes whereas Figure 23 shows the average maxishymum joint deflection measured for each of the seven experimental sections in both the driving and passing lanes Although the joint deflections are low the load transfer efficiencies (typically beshytween 80 and 90 percent) are not as high as might be expected for a new concrete pavement These initial FWD results will serve as a baseline for comparison with future testing values
Table 10 Experimental Design Matrix for IL 3
250-MM (10-IN) JPCP 46-M (15-FT) JOINT SPACING
SEALED JOINTS (ASTM D3405) UNSEALED JOINTS
38-mm (15-in) diameter polyester and type E fiberglass dowel bars (RJD Industries)
Section 1 (150 ft long 10 joints)
38-mm (15-in) diameter vinyl ester and type E fiberglass dowel bars (Morrison Molded Fiber Glass Company)
Section 2 (150 ft long 10 joints)
38-mm (15-in) diameter vinyl ester and type E fiberglass dowel bars (Creative Pultrusions Inc)
Section 3 (150 ft long 11 joints)
Fiber-Contrade dowel bar consisting of a fibrillated type E fiberglass and polyester resin tube filled with hydraulic cement (Concrete Systems Inc)
Section 4 (150 ft long 10 joints)
38-mm (15-in) diameter carbon steel rods clad with grade 316 stainless steel (Stelax Industries Inc)
Section 5 (150 ft long 10 joints)
38-mm (15-in) diameter epoxy-coated steel dowel bars Section 7 (150 ft long 10 joints)
Section 6 (150 ft long 10 joints)
27
Figure 22 Load transfer efficiency on IL 3 (Gawedzinski 2000)
Figure 23 Maximum joint deflections on IL 3 (Gawedzinski 2000)
Preliminary ResultsFindings
This pavement is performing well after 1 year of service None of the joints are exhibiting any signs of distress IDOT will continue monitoring the proshyject to assess the relative performance of the differshyent dowel bar types and of the sealedunsealed joints
Interim Project Status Results and Findings
FWD tests are conducted semi-annually along with periodic visual observations of joint performance Traffic data are collected using an ADR 3000 manufactured by Peek Traffic The data are periodishy
cally polled and converted to ESALs using standard IDOT conversion factors A summary of the cumushylative ESALs is provided in Table 11
Joints are also periodically observed to look for signs of joint deterioration or distress Joints were formed using a thin saw cut and sealed with an ASTM D 6690 (formerly ASTM D 3405) hot-pour joint seal material Problems affecting ride quality became apparent due to several of the joints being overfilled with the 3405 joint seal material Subseshyquent evaluations noted failure of the 3405 joint seal material to maintain a bond with either side of the pavement at the joint
28
Table 11 Current Traffic for Driving and Passing Lanes (Gawedzinski 2004)
CUMULATIVE ESALS
DATE DRIVING LANE PASSING LANE
62399 0 0
62700 68604 97420
101000 95413 13764
41801 160805 22940
101101 240558 34305
41802 310034 43193
100102 372800 48871
41603 442221 54892
102103 493053 59488
112503 504163
Current Observations (Gawedzinski 2004)
Several joints were observed where the joint seal material was either missing from the wheelpaths or had been pushed deeper in the joint and was debonded from both sides of the pavement joint Small rocks were also compressed into the joint seal material at the joint surface As with the other Illishynois sites no obvious signs of joint distress were apparent during the visual observations
Similar behavior as observed at the older two sites (IL 1 and IL 2) is shown in the following figures The control set (381-mm [15-in] diameter epoxy-coated steel) unsealed epoxy-coated steel bars stainless steel clad carbon steel bars and fibrillated wound fiber composite bars exhibit better LTE and lower joint deflections than the pultruded fiber composite bars but do not show excessive joint deflection indicating failure of the joints The pavement at Jacksonville (IL 3) was constructed on a cement aggregate mixture subbase (CAM 2 with a minimum of 200 lbs of cement per cubic yard)
rather than a granular subbase as in Naperville (IL 2) or a bituminous aggregate mixture subbase (BAM) at Williamsville (IL 1)
An additional FWD test was performed on the drivshying lane of US 67 in November of 2003 to evaluate the joint deflections that had occurred earlier that year Testing was not conducted in the passing lanes due to traffic control problems at the time of the November tests The large shift in average joint deflection vales between the April and October tests necessitated the November retest More frequent testing is scheduled for 2004
Deflection data are presented in Figures 24 through 26 It is observed that the FRP bars are approaching (or exceeding) the critical LTE value of 70 percent calling into question the capability of these load transfer mechanisms to provide long-term performshyance
Points of Contact
David Lippert (217) 782-8582
Mark Gawedzinski (217) 782-2799 GawedzinskiMJdotilgov
Illinois Department of Transportation Bureau of Materials and Physical Research 126 E Ash Street Springfield IL 62704
References
Gawedzinski M 2000 TE-30 High Performance Rigid Pavements Illinois Project Review Illinois Department of Transportation Springfield
mdashmdashmdash 2004 TE-30 High Performance Concrete Pavements An Update of Illinois Projects Illinois Department of Transportation Springfield
29
Figure 24 Driving lane load transfer efficiency vs ESALs (Gawedzinski 2004)
Figure 25 Passing lane load transfer efficiency vs ESALs (Gawedzinski 2004)
30
Figure 26 Average load transfer efficiency vs average pavement temperature (Gawedzinski 2004)
31
2
72
55
74
88
72
55
74
88
Chapter 8 ILLINOIS 4 (Route 2 Dixon)
Introduction
A fourth project evaluating alternative dowel bars was constructed by the Illinois Department of Transportation (IDOT) in April 2000 The experishymental project is located in the driving lane of the northbound direction of Illinois Route 2 in Dixon (see Figure 27) where it replaced an existing conshycrete pavement (Gawedzinski 2000)
Illinois 4Route 2 NB
Dixon
Dixon
Springfield
2
Illinois 4 Route 2 NB
Dixon
Dixon
SpringfieldSpringfield 72
55
74
88
Figure 27 Location of IL 4 project
Study Objectives
Although not an official TE-30 project this project carries on IDOTrsquos investigation of alternative dowel bar materials The alternative dowel bar materials used in the project included stainless steel tubes filled with cement grout stainless steel clad carbon steel tubes and fiber composite tubes filled with cement grout Two different diameters 38 mm (15 in) and 445 mm (175 in) were used for the stainless steel tubes and for the stainless steel clad dowels The fiber composite tubes were formed using a pultrusion process and were approximately 50 mm (2 in) in diameter The pultrusion process produced a much smoother bar compared to the first generation fibrillated bars Additionally two different methods of securing the bars to the basshykets welding and using cable ties were used in the four sections More detailed construction informashytion is provided by Gawedzinski (2004)
Project Design and Layout
The pavement design for each section is a 240-mm (95-in) doweled JPCP placed over a 300-mm (12shyin) granular base course (Gawedzinski 2000) Transverse joints are spaced at 46-m (15-ft) intershyvals and are sealed with a hot-poured sealant A tied curb and gutter is placed adjacent to the outer drivshying lane of the project
The experimental project consists of five test secshytions evaluating the following alternative dowel bar materials (Gawedzinski 2000)
bull Fiber-Contrade dowel bar manufactured by Concrete Systems Inc and consisting of a pultruded fiber composite tube composed of type lsquoErsquo fiberglass and polyester resin and filled with hydraulic cement
bull 38-mm (15-in) diameter 276 mm (0109 in) thick grade 316 stainless steel tube filled with cement grout
bull 445-mm (175-in) diameter 276 mm (0109 in) thick grade 316 stainless steel tube filled with cement grout
bull 38-mm (15-in) diameter carbon steel rods clad with grade 316 stainless steel manushyfactured by Stelax Industries Inc
bull 445-mm (175-in) diameter carbon steel rods clad with grade 316 stainless steel manufactured by Stelax Industries Inc
Conventional load transfer devices are installed in JPCP sections adjacent to the experimental paveshyment sections
State Monitoring Activities
Traffic data are recorded using a Peek series 3000 ADR traffic classifier IDOT obtained baseline FWD deflection data after the pavement was conshystructed and will monitor its performance on at least a semi-annual basis
32
Interim Project Status Results and Findings
Data has been collected on a semi-annual basis for the past 3 years The cumulative ESALs are proshyvided in Table 12 Results of deflection testing are illustrated in Figures 28 and 29
Table 12 Data Collection Date and Cumulative ESALs (Gawedzinski 2004)
DATE CUMULATIVE ESALS
8100 0
5101 20780
10101 50036
42502 62701
10202 76872
4303 93982
10303 125533
Current Observations (Gawedzinski 2004)
At the time of construction all of the test joints were unsealed Visual observations of the joints show all of the joints performing well with slight spalling possibly due to the pavement being cut too early None of the joints show accumulation of inshycompressible materials in the joint or any signifishycant spalling due to the joints ldquolocking uprdquo Addishytional monitoring will continue The LTE and joint deflection graphs show behavior expected for relashytively new pavements
Figure 28 Driving lane load transfer efficiency vs ESALs (Gawedzinski 2004)
33
Figure 29 Average load transfer efficiency vs average pavement temperature (Gawedzinski 2004)
Points of Contact
David Lippert (217) 782-8582
Mark Gawedzinski (217) 782-2799 GawedzinskiMJdotilgov
Illinois Department of Transportation Bureau of Materials and Physical Research 126 E Ash Street Springfield IL 62704
References
Gawedzinski M 2000 TE-30 High Performance Rigid Pavements Illinois Project Review Illinois Department of Transportation Springfield
mdashmdashmdash TE-30 High Performance Concrete Pave-ments An Update of Illinois Projects Illinois Deshypartment of Transportation Springfield
34
Chapter 9 INDIANA 1 (I-65 at SR-60 Clark County)
Introduction
Indiana is interested in building a jointed concrete pavement with an extended performance life Reshysearch has suggested that jointed concrete pavements built with ldquolow slab curvaturerdquo also have extended pavement life This project located on I-65 in Clark County (see Figure 30) includes various construction and materials properties that will be evaluated to asshysess concrete slab response to environment and the resulting stressstrain relationships
Figure 30 Location of IN 1 project
Study Objectives
This project will investigate the relationship between specific construction and materials factors and longshyterm pavement performance by use of an instrumented pavement These experimental sections will have 38 state-of-the-art vibrating wire strain gauges to monitor the strain in the pavement slabs 5 tilt meters to monishytor the curling direction and tendency and 4 time doshymain reflectometers to determine the moisture content in the pavement base and subgrade A total of 186 data acquisition channels and an automated data acshyquisition unit will be employed to monitor the behavshyior of the pavement slabs In addition there will be 75 iButtontrade temperature sensors (sensors in the form of a button that has a processor and battery life of 3 years to process data inside the button) that will monitor the pavement temperature profile inch-by-inch to detershymine the onset of temperature curling in concrete pavement A GroundHog traffic monitoring system
will be also in place to monitor the traffic and vehicle classifications
A weather station to monitor air temperature relative humidity wind speed wind direction precipitation rate of sub-surface temperature and solar radiation will provide data to predict the behavior of the pavement slabs especially the correlation between climatic conshyditions and the pavement behavior response
The results of this experimental project when fully implemented will minimize or eliminate the needs of early pavement rehabilitation and frequent pavement maintenance
Project Design and Layout
Three one-directional lanes featuring a 3556-mm (14shyin) thick slab will be constructed over a 249-km (155-mi) segment of I-65 during the 2004 construcshytion season Data analysis from this project will be directed toward evaluating the following
bull Low built-in curl (controlling temperature gradients during construction)
bull Low sensitivity to moisture warping (low permeability)
bull Low sensitivity to temperature gradients after construction (low thermal coefficients of conshycrete)
bull Fracture properties tensile strength elastic modulus entrained air permeability and thermal expansion from field concrete
bull Materials properties that impact the above properties include low wc aggregate soundshyness and coarse aggregate fracture properties
The estimated time of completion for this project is 36 months The first 12 months will concentrate on a state-of-the practice review of modern instrumentation to measure important parameters that influence the performance of concrete pavement
Static and dynamic sensors will be embedded in the pavement structure at specific locations to measure the
35
appropriate parameters The dynamic sensors are used to measure pavement response to traffic while the static sensors are used to measure the pavement reshysponse to changes of environmental conditions such as variations of temperature moisture and curling during construction after construction and in-service pavement In addition the traffic and weather condishytions will be monitored by using a GroundHog and an RTWin weather station respectively Table 13 sumshymarizes the instrumentation currently being considshyered for installation for this project (Nantung 2004)
The second 12-month period will consist of the data analysis described This period will include laboratory testing in conjunction with the joint project with Purshydue University to complete a finite element analysis damage model slab contact model layered base model and thermal gradient model Data analysis from this project will be analyzed using the new finite element models to determine the damage analysis of two different dimensions of PCC slabs
The final 12 months will include additional analysis and verification of all data analysis to be included in a final report
State Monitoring Activities
Field monitoring will be limited to the first 12 months after construction
Preliminary ResultsFindings
Selection of the state-of-the-art monitoring equipshyment has been completed Currently Indiana DOT is performing laboratory checks on all equipment prior to implementation during construction A summary of the proposed instrumentation for this project is shown in Table 13 (Nantung 2004)
Points of Contact
Lee Gallivan FHWA-Indiana Division 575 N Pennsylvania St Room 254 Indianapolis IN 46204 (317) 226-7493
Tommy E Nantung (765) 463-1521 x248 TNANTUNGindotstateinus
Scott Newbolds (765) 463-1521 x 244
INDOT Research Division 1205 Montgomery PO Box 2279 West Lafayette IN 47906
Reference
Nantung T E 2004 High Performance Concrete Pavement Indiana Public Works News Volume 5 Number 1 Anchor Media Co
Table 13 Summary of Proposed Instrumentation (Nantung 2004)
SENSOR TYPE MEASUREMENT
TYPE PURPOSE
Vibrating Wire Tiltmeter Tilt angle Measure the curling at all four corners of the slab
Time Domain Reflectometer Moisture Measure the moisture content of the soil under the slab
IButtontrade Temperature Measure the temperature profile in the pavement
GroundHogtrade Traffic Measure vehicle volume vehicle speed and length road surface temperature roadway wetdry condition and amount of salt used for anti-icing
RTWintrade Weather Station Weather Measure air temperature relative humidity wind speed wind direction and precipitation
36
80
5
35
Iowa 1bUS 30 Carroll
Iowa 1aHighway 5 Carlisle
80
35
Chapter 10 IOWA 1 (a and b) (Highway 5 Carlisle and US 30 Carroll)
Introduction
The Iowa Department of Transportationrsquos (DOTrsquos) first TE-30 project consists of an evaluation of the effect of concrete mixing time on several critical plastic and hardened concrete properties This inshyvestigation was conducted using several different mix designs for pavements constructed at two difshyferent sites Iowa Highway 5 near Carlisle and US 30 near Carroll (Cable and McDaniel 1998a) The locations of these sites are shown in Figure 31
30
Carroll
Carlisle
Des Moines
80
5
3030
35
Iowa 1b US 30 Carroll
Carroll
Carlisle
Des Moines
Iowa 1a Highway 5 Carlisle
Figure 31 Location of IA 1 projects
Study Objectives
The issue of mixing time has become a concern to the Iowa DOT as several plant manufacturers have claimed consistent and sufficient mixing in as short as 30 seconds (Cable and McDaniel 1998a) Thereshyfore the primary goal of this research project is to
investigate the effect of concrete mixing time on the resultant air content air distribution consolidashytion and workability of concrete used for pavement construction (Cable 1998) Secondary objectives include the evaluation of a contractor-designed concrete mix and the evaluation of an alternative mixer
Project Design and Layout
The investigation of mixing time on concrete propshyerties was conducted at both the Carlisle and Carshyroll test sites Nominal mixing times of 30 45 60 and 90 seconds were selected for evaluation and two different mix designs were used a standard mix developed by the Iowa DOT and a contractor-developed mix (Cable and McDaniel 1998a) No information on the exact composition of the two mixes is available but the contractor mix reportshyedly is a ldquoShilstonerdquo mix containing a uniformly graded aggregate
Two different mixers were also employed in the study A standard 765 m3 (10 yd3) drum mixer was used at the Carlisle project whereas a modified drum mixer employing rotation of blades within the drum was used at the Carroll project (Cable and McDaniel 1998a) The same contractor was emshyployed for the construction of each paving project The experimental design matrix for this study is shown in Table 14
Table 14 Experimental Design Matrix for IA 1
Mixing Time (seconds)
CARLISLE TEST SITE (STANDARD DRUM MIXER)
CARROLL TEST SITE (MODIFIED DRUM MIXER)
Iowa DOT Mix Contractor Mix Iowa DOT Mix Contractor Mix
30 X
45 X X X
60 X X
90 X X
37
State Monitoring Activities
To achieve the objectives of this project the Iowa DOT and the Iowa State University jointly particishypated in the testing and monitoring of the concrete mixing and paving activities The paving was pershyformed in the summer of 1996
The testing methods in ASTM C 94 were used in this study to determine the significance of the mixshying time on the consistency of the concrete mix deshylivered and placed on grade (Cable and McDaniel 1998a) ASTM C 94 is designed to check the conshysistency of the material at the beginning and near the end of the truck discharge Using this standard measurements of slump unit weight air content retained coarse aggregate and compressive strength were obtained and used to compare the consistency of the mix at different points of delivery (Cable and McDaniel 1998a)
At both the Carlisle and Carroll sites the tests listed in Table 15 were conducted for each combination of mixing time and mix design included in the investishygation For the slump unit weight plastic air conshytent and wash tests samples were obtained from three different locations for the same load of mateshy
rial the center of the haul truck the side of the haul truck and on grade in front of the paver (Cable and McDaniel 1998a) Compressive testing of cylinders and cores was performed on concrete retrieved from the same batch as for the slump unit weight air content and wash tests (Cable and McDaniel 1998a) Air void distribution testing was conducted on hardened concrete cores also taken from the same batch (Cable and McDaniel 1998a)
The haul trucks to be tested were selected at ranshydom at approximately frac12- to 1-hour increments (Cashyble and McDaniel 1998a) Trucks were selected for testing only when the paver and plant were in conshytinuous operation to ensure representative samples Sufficient concrete was obtained from each truck to provide for tests of slump unit weight air content and for the preparation of cylinders for compressive testing (Cable and McDaniel 1998a) Upon compleshytion of the unit weight test the material in the unit weight bucket was washed through a sieve to reshymove all fines and cement and then the retained coarse aggregate was weighed and compared to the unit weight and the expected weight of coarse agshygregate in the unit weight bucket (Cable and McDaniel 1998a)
Table 15 Tests Conducted at IA 1 Test Sites
TEST TEST METHODOLOGY TESTING LOCATIONSSPECIMENS
Slump Conducted in accordance with ASTM C143 Center of truck Side of truck On grade in front of paver
PCC unit weight Conducted in accordance with ASTM C138 Center of truck Side of truck On grade in front of paver
Air content (plastic concrete) Conducted in accordance with ASTM C231 Center of truck Side of truck On grade in front of paver
Wash test Conducted in accordance with ASTM C94 Center of truck Side of truck On grade in front of paver
Compressive strength (cylinders) Conducted in accordance with ASTM C42 Cylinders cast from each specific batch
Compressive strength (cores) Conducted in accordance with ASTM C42 Cores obtained from known batch locashytions
Air void distribution (cores) Measured using low-vacuum electron microscope and computer imaging analysis
Cores obtained behind the paver
38
The approximate location of a sampled batch of concrete in the pavement was recorded during the paving operation for later coring operations (Cable and McDaniel 1998a) Core sampling was conshyducted at the noted locations after the concrete had reached a strength of 34 MPa (500 lbfin2)
The instruments used for the air void analysis of hardened concrete cores were a Hitachi 2460 N low-vacuum scanning electron microscope a Tetra back-scattered electron detector Deben stage autoshymation and an Oxford Instrument ISIS x-ray analyshysis system (Cable and McDaniel 1998a) Samples were prepared from the cores and special software was used to determine the area and size of the air voids in each image (Cable and McDaniel 1998a)
No further monitoring or reporting is anticipated This project has now been completed
ResultsFindings
Extensive statistical analyses were conducted on the data collected from each test site Comparisons of key concrete properties (slump unit weight air content and compressive strength) were made beshytween testing location (side center or on grade) and between the various mixing times (30 45 60 and 90 seconds) Based on these analyses the folshylowing general conclusions were drawn (Cable 1998 Cable and McDaniel 1998a)
bull Dump-truck-type hauling units do not signifishycantly change the quality of the material beshying delivered to the paver and should conshytinue to be allowed in addition to agitator-type hauling vehicles
bull Mixing times of 60 seconds or greater do have a positive influence on the physical characteristics of the concrete product and should be retained as the minimum mixing time for all mixer types
bull Mixing times did not significantly affect the hardened air content or distribution for the Iowa DOT mix designs but the data showed conflicting results for the contracshytor-designed mix This may be the result of
a different matrix of coarse and fine aggreshygates in the contractor mix Therefore it is recommended that contractor mix designs should be thoroughly laboratory tested prior to use in the field to determine the impact of admixtures and differences in aggreshygatecement matrix on the physical pershyformance characteristics of the mix
bull Mixing times of less than 60 seconds should be allowed only when steps have been taken to change the mixing process to ensure coating of all aggregates prior to mixer discharge into the hauling unit
bull Visual examination of the mix at the Car-lisle site (30- and 45-second mixing times) indicated visible sand seams (uncoated sand particles) in the discharged material The concrete produced under this set of mixing conditions was also noted to be very diffishycult to place and finish
Points of Contact
Jim Cable Iowa State University Department of Civil and Construction Engineering 378 Town Engineering Building Ames IA 50011 (515) 294-2862
Mark Dunn Iowa Department of Transportation 800 Lincoln Way Ames IA 50011 (515) 239-1111
References
Cable J K 1998 ldquoEvaluation of Mix Time on Conshycrete Consistency and Consolidationrdquo Proceedings Crossroads 2000 Conference Ames IA
Cable J K and L L McDaniel 1998a Effect of Mix Times on PCC Properties Iowa DOT Project HR-1066 Iowa Department of Transportation Ames
39
80
35
Iowa 2US 65 Bypass
Des Moines
80
35
Chapter 11 IOWA 2 (US 65 Des Moines)
Introduction
The Iowa Department of Transportationrsquos second TE-30 project consists of an evaluation of alternashytive dowel bar materials and spacings The experishymental project was constructed in 1997 on the US 65 Bypass near Des Moines (Cable and McDaniel 1998b) Figure 32 shows the location of this project
65Des Moines
80
6565
35
Des Moines
Iowa 2 US 65 Bypass
Des Moines
Figure 32 Location of IA 2 project
Study Objectives
Because of the susceptibility of steel dowel bars to corrosion the Iowa DOT has expressed interest in the use of alternative dowel bar materials to provide load transfer across transverse joints in concrete pavements Therefore one of the goals of this proshyject is the comparative study of concrete pavement joints containing fiber reinforced polymer (FRP) dowel bars stainless steel dowel bars and convenshytional epoxy-coated steel dowel bars under the same design criteria and field conditions (Cable and McDaniel 1998b) Another goal of the project is the investigation of the transverse joint load transfer characteristics of alternative dowel bar spacings (Cable and McDaniel 1998b) This evaluation is a 5-year study being performed through the combined efforts of the Iowa Department of Transportation and the Iowa State University
Project Design and Layout
This project was constructed in 1997 on the northbound lanes of the US 65 Bypass near Des Moines The basic design for the project is a 305shymm (12-in) JPCP on a 152-mm (6-in) granular
base course (Cable and McDaniel 1998b) Transshyverse joints are located at 61-m (20-ft) intervals and are skewed 61 in the counterclockwise direcshytion (Cable and McDaniel 1998b) Both transverse and longitudinal joints are sealed with a hot-poured sealant Number 5 tie bars 914 mm (36 in) long and spaced at 762-mm (30-in) intervals were meshychanically inserted by the paver across the longitushydinal centerline joint (Cable and McDaniel 1998b)
The shoulder for the JPCP is a 203-mm (8-in) asshyphalt concrete (AC) layer paved 24 m (8 ft) wide on the outside edge and 16 m (6 ft) on the inside edge (Cable and McDaniel 1998b) Longitudinal subdrains are located under the outside shoulder and adjacent to the edge of the outside driving lane (Cable and McDaniel 1998b)
Four different load transfer systems are included in the study a fiber composite dowel bar manufacshytured by Hughes Brothers a fiber composite dowel bar manufactured by RJD Industries a solid stainless steel dowel bar and a conventional epoxy-coated steel dowel bar (Cable and McDaniel 1998b) The Hughes Brothers dowel bar is 48 mm (188 in) in diameter whereas the other dowel bars are 38 mm (15 in) in diameter The required dishyameters for the alternative dowel bars were detershymined from laboratory testing and experimental research performed by the manufacturers (Cable and McDaniel 1998b)
A standard spacing of 305 mm (12 in) was used for each load transfer system included in the study In addition sections were constructed using a spacing of 203 mm (8 in) for the alternative dowel bar mashyterials The experimental design matrix for this proshyject is shown in Table 16 and the layout of the test sections is shown in Figure 33 The dowel bar spacshying configurations used on this project are illusshytrated in Figure 34
Fiber composite tie bars were also provided by the fiber composite dowel bar manufacturers for instalshylation in their respective test sections However these fiber composite tie bars had a tendency to ldquofloatrdquo to the top of the surface during or immedishyately after their placement (Cable and McDaniel
40
440 ft 417 ft 100 ft 80 ft 222 ft 556 ft 477 ft
Table 16 Experimental Design Matrix for IA 2
305-MM (12-IN) JPCP 61-M (20-FT) JOINT SPACING (SKEWED)
203-mm (8-in) Dowel Spacing 305-mm (12-in) Dowel Spacing
38-mm (15-in) Diameter Dowel
48-mm (188-in) Diameter Dowel
38-mm (15-in) Diameter Dowel
48-mm (188-in) Diameter Dowel
Fiber composite dowel bars (Hughes Brothers)
Section 1 (440 ft) Section 2 (417 ft)
Fiber composite dowel bars (RJD Industries)
Section 3 (100 ft) Section 4 (80 ft)
Stainless steel dowel bars Section 5 (222 ft) Section 6 (556 ft)
Epoxy-coated steel dowel bars Section 8 (477 ft)
US 65 NB
Section 1188-in Fiber Composite
Dowel Bars(Hughes Brothers)8 in Dowel Spacing
Section 2188-in Fiber Composite
Dowel Bars(Hughes Brothers)
12 in Dowel Spacing
Section 315-in Fiber
Composite DowelBars
(RJD Industries)8 in Dowel Spacing
Section 415-in Fiber
Composite Dowel Bars
(RJD Industries)12 in Dowel Spacing
Section 515-in Stainless
Steel Dowel Bars8 in Dowel Spacing
Section 615-in Stainless Steel
Dowel Bars12 in Dowel Spacing
Section 715-in Epoxy-Coated
Steel Dowel Bars12 in Dowel Spacing
US 65 NB
Section 1 188-in Fiber Composite
Dowel Bars (Hughes Brothers) 8 in Dowel Spacing
Section 2 188-in Fiber Composite
Dowel Bars (Hughes Brothers)
12 in Dowel Spacing
Section 3 15-in Fiber
Composite Dowel Bars
(RJD Industries) 8 in Dowel Spacing
Section 4 15-in Fiber
Composite Dowel Bars
(RJD Industries) 12 in Dowel Spacing
Section 5 15-in Stainless
Steel Dowel Bars 8 in Dowel Spacing
Section 6 15-in Stainless Steel
Dowel Bars 12 in Dowel Spacing
Section 7 15-in Epoxy-Coated
Steel Dowel Bars 12 in Dowel Spacing
440 ft 417 ft 100 ft 80 ft 222 ft 556 ft 477 ft
Figure 33 Layout of IA 2 project
Outer Traffic Lane
Inner Traffic Lane
12 dowels 12-in spacings
12 dowels 12-in spacings
Outer Traffic Lane
Inner Traffic Lane
12 dowels 12-in spacings
12 dowels 12-in spacings
a) 12-ia) 12-inn SpacingSpacingss
Outer Traffic LaneInner Traffic Lane
18 dowels 8-in spacings
18 dowels 8-in spacings
b) 8-in Spacings
Outer Traffic Lane Inner Traffic Lane
18 dowels 8-in spacings
18 dowels 8-in spacings
b) 8-in Spacings
Figure 34 Illustration of dowel bar spacing configurations on IA 2
41
1998b) This was attributed to either an incompatishybility of the automatic tie bar inserter to the smaller diameter of the fiber composite tie bars or to the lighter weight of the fiber composite bars themshyselves (Cable and McDaniel 1998b) After several bars surfaced in succession the epoxy-coated steel tie bars were used on the remainder of the project
State Monitoring Activities
The performance of these test sections was monishytored under a 5-year monitoring program (from the fall of 1997 through the spring of 2003) being conshyducted jointly by the Iowa DOT and the Iowa State University (Cable and Porter 2003) The following monitoring activities were conducted (Cable and Porter 2003)
bull Visual distress survey using LTPP proceshydures As part of these surveys joint openshyings were monitored using PK masonry nails placed along joints in each section and joint faulting was measured using a Georgia Digishytal Faultmeter
bull Deflection testing using a Dynatest Falling Weight Deflectometer (FWD) Within each section deflection testing was performed at three joints and at three center slab locashytions per lane Testing was performed twice a year once in March or April (to represent a ldquoweakrdquo foundation condition) and once in August or September (to represhysent a ldquostrongrdquo foundation condition)
In addition ground penetrating radar (GPR) was used to establish the location (depth and orientashytion) of dowel bars and tie bars (Cable and Porter 2003) At the end of 5 years selected joints in each section were cored and the condition of each dowel bar type was inspected (Cable and Porter 2003)
Preliminary ResultsFindings
During the construction of the project several items were noted to be of importance to future inshystallations of alternative dowel bars in concrete pavements (Cable and McDaniel 1998b)
bull The original method of securing the fiber composite and stainless steel dowel bars to the basket was inadequate To address this plastic zip ties were fastened around each basket brace loop and end of dowel to hold them in place Any excess tie length was cut or turned down to prevent surface finshyishing problems
bull The placement of the stainless steel dowels required three to five people to handle the baskets Future use of stainless steel dowshyels will require ldquoxrdquo braces welded to the basket to prevent side sway and collapse during handling
bull Nails were attached to the bottom of the fishyber composite tie bars to facilitate their loshycation using both cover meters and GPR
bull As stated previously the fiber composite tie bars placed using the automatic tie bar inshyserter on the paver were susceptible to ldquofloatingrdquo to the surface If this is a continushying problem the placement of these bars in tie bar baskets or the use of conventional epshyoxy-coated tie bars may be required
Final ResultsFindings
Project test sections were tested twice a year beshyginning in the fall of 1997 with the final tests in the spring of 2002 (testing could not be performed in the fall of 2000) The results of the FWD testing were interpreted through calculating LTE
The results of the load transfer analysis are illusshytrated in Figure 35 (Cable and Porter 2003) In Figshyure 35 the dowel bars are labeled according to their material and spacing standard epoxy (std epoxy) stainless steel (SS) and fiber composite (FRP) Figure 36 displays the overall average faulting over the period of research (Cable and Porter 2003) Figure 37 illustrates the changes in joint openings over the research period (Cable and Porter 2003) Visual surveys of this project resulted in only mishynor corner cracking being noted immediately after construction There are no visible signs of paveshyment distress that can be associated with joint reinshyforcement or typical highway loading over the 5shyyear monitoring period (Cable and Porter 2003)
42
Std Epoxy SS12 SS 8 15 FRP
12 15 FRP 8 188 FRP
Driving
Passing
90 87
94
79
88
81 80
91
84
92
79
86
77 79
50 55 60 65 70
75 80
85
90
95
188 FRP 12 D o wel T ype amp Scheme 8
Driving Passing
Note FRP = fiber composite SS = stainless steel Std Epoxy = standard epoxy
Figure 35 Average load transfer efficiency for IA 2 project
15 FRP 15 FRP 188 FRP 188 FRP
-0014
-0012
-001
-0008
-0006
-0004
-0002
0 Epoxy12 SS12 SS 8 12 8 12 8
Ave
Fau
lt in
Outside Wheelpath Ave Inside Wheelpath Ave Average
Note FRP = fiber composite SS = stainless steel
Figure 36 Average faulting on IA 2 project
43
Note FRP = fiber composite SS = stainless steel Std Epoxy = standard epoxy
Figure 37 Joint opening trends on IA 2
-02
-015
-01
-005
0
005
01
015
02
025
03
Data Collection Period
Join
t Ope
ning
Cha
nge
(mm
)
Epoxy12 SS12 SS8 15FRP12
15FRP8 188FRP12 188FRP8
Fall 1997
Spring 1998
Fall 1998
Spring 2000
Fall 1999
Spring 1999
Spring 2002
Fall 2001
Spring 2001
The following summaries and conclusions have been reached based on the data gathered during the study (Cable and Porter 2003)
bull All dowel materials tested are performing equally in terms of load transfer joint movement and faulting over the 5-year analysis period
bull Stainless steel dowels do provide load transfer performance equal to or greater than epoxy-coated steel dowels in this study on the average over 5 years
bull FRP dowels of the sizes tested in this reshysearch should be spaced no greater than 203 mm (8 in) apart to gain load transfer performance at the same level as epoxy-coated steel dowels at 305-mm (12-in) spacing
bull No deterioration due to road deicers was found on any of the dowel materials reshytrieved in the 2002 coring operation
Points of Contact
Jim Cable Iowa State University Department of Civil and Construction Engineering 378 Town Engineering Building Ames IA 50011 (515) 294-2862
Mark Dunn Iowa Department of Transportation 800 Lincoln Way Ames IA 50011 (515) 239-1447
References
Cable J K and L L McDaniel 1998b Demon-stration and Field Evaluation of Alternative Port-land Cement Concrete Pavement Reinforcement Materials Iowa DOT Project HR-1069 Iowa Deshypartment of Transportation Ames
Cable J K and M L Porter 2003 Demonstra-tion and Field Evaluation of Alternative Portland Cement Concrete Pavement Reinforcement Mate-rials Iowa DOT Project HR-1069 Iowa State University Ames
44
Chapter 12 IOWA 3 (US 151 LynnJones Counties)
Introduction
This project is located on US 151 in LinnJones Counties (see Figure 38) and is studying the use of fly ash for soil stabilization of subgrades beshyneath concrete pavements The scope of the proshyject includes the use of two different qualities of fly ash and two different qualities of select fill
Figure 38 Location of IA 3 project
Study Objectives
The objective of this research is to evaluate and monitor the performance of pavements conshystructed on treated subgrades with respect to conshytrol sections
Project Design and Layout
The subgrade and pavement for this project are of conventional design and thickness with the only difference in the test sections being the presence of 15 percent fly ash used to treat the subgrade The quantity of fly ash to be used is based upon research performed by Dr Ken Bergeson at Iowa State University (ISU) Two types of fly ash are being evaluated (1) Stoker ash which is a Class C fly ash that has a carbon content too high to be used in concrete mixtures and (2) conventional Class C fly ash (this ash has been used in many stabilization roles and is included as a control) Two types of existing subgrade soils will be evaluated (1) An approved select glacial clay loam and (2) a higher plasticity select glacial clay loam Control sections with untreated soil of both types will also be included Some chemical evaluation of the fly ashes has already been pershyformed at ISU Additional tests from each fly ash
source as delivered will be performed by ISU to monitor chemical variability
The procurement placement and mixing of sub-grade components will be performed by the conshytractor for the project under change order to an existing contract Each test regime will be apshyproximately 16 km (1 mi) long The fly ash will be incorporated into the subgrade using a pulvershyizer and will be placed over the full shoulder-toshyshoulder road width The subgrade will be stabishylized the full width of the pavement and to a depth of 3048 mm (12 in) The base material will be Iowa DOT standard untreated granular drainable base
State Monitoring
The Iowa DOT will perform subgrade modulus tests before during and after placement of the subgrade using a dynamic cone penetrometer Additional bearing tests will be performed after the subgrade has been placed Moisture testing of the soil will be performed on samples taken at the borrow site on grade and from the final mixes Samples of soil will be collected on grade and tested for gradation and soil properties Concrete slump strength and air content will be reported for each test section After paving is complete deflection smoothness and ride testing will be performed annually for 5 years Curling and warpshying will be identified from the smoothness data Deflection differences between slabs exhibiting curling and warping and those without will be investigated The impact of subgrade treatments on curling and warping if any will be noted
Preliminary ResultsFindings
A construction report including photographs and video documentation will be submitted by the Iowa DOT to FHWA A progress report will be submitted after deflection testing is finished summarizing the performance and noting any problems The final report prepared by the Iowa DOT will be due 5 years after completion of the final pavement
45
In January 2004 Iowa DOT indicated that a draft construction report had been completed but it had not yet been made available
Points of Contact
Mark Dunn Research Engineer Materials Office Iowa Department of Transportation 800 Lincoln Way Ames IA 50010 (515) 239-1447
References
None
46
Chapter 13 IOWA 4 (IA 330 Jasper Story and Marshall Counties)
Introduction
The Iowa DOT research project Dowel Bar Optishymization Phase I and II (Porter Guinn and Lundy 2001) and information from other dowel bar reshysearch studies (Porter and Guinn 2002) provided laboratory research results on spacing and bearing stresses for installing conventional round dowels and elliptical dowels Field evaluation and calibrashytion of the results are important to the application of the results to the pavement design process To achieve this goal the Iowa State University in conshyjunction with the Iowa Department of Transportashytion (Iowa DOT) investigated the relative performshyance of elliptical and conventional round dowels in field conditions Test sections were constructed in 2002 on Iowa 330 in Jasper Story and Marshall counties Figure 39 shows the location of this proshyject
Figure 39 Location of IA 4 project
Study Objectives
This project is evaluating the performance of ellipshytical dowels and the constructibility of such devices in an actual construction project Specifically the field research is designed to answer the following questions (Cable Edgar and Williams 2003)
bull What is the relative performance of meshydium- and large-sized elliptical steel dowshyels as compared to that of conventional steel dowels
bull What is the impact of dowel spacing on the relative performance of the elliptical and round dowels in field conditions
bull What is the impact on performance of the various dowel shapes when placed in cut or fill sections of the roadway
bull What constructibility problems if any are associated with the installation of dowel shapes other than round
Project Design and Layout
Two types of elliptical steel dowels (medium and heavy) in addition to conventional 38-mm (15-in) round steel dowels were installed and monitored in this project The specifications of the dowel bars are as follows (Cable Edgar and Williams 2003)
bull Heavy elliptical (major axis is 50013 mm [1969 in] minor axis is 33985 mm [1338 in] area is 1344513 mm2 [2084 in2])
bull Medium elliptical (major axis is 42012 mm [1654 in] minor axis is 38321 mm [1508 in] area is 950321 mm2 [1473 in2])
bull Standard round (diameter is 38 mm [15 in] and area is 1139998 mm2 [1767 in2])
Each type of dowel bar was placed at three differshyent spacings across the transverse joints 305 mm (12 in) 380 mm (15 in) and 460 mm (18 in) Three replicate sections of each dowel size and spacing were placed in cut fill and transition roadway sections
Twelve test sections were constructed where dowel bars were placed only in the wheelpaths A set of four bars at 305-mm (12-in) spacings was installed in each wheelpath Six sections were constructed using elliptical medium dowels and the other six sections using conventional 38-mm (15-in) diameshyter round dowels
Each test section consisted of 20 transverse joints placed at 6-m (20-ft) intervals and separated from the next test section by a minimum of five joints containing 38-mm (15-in) round steel dowels
To measure the actual strain responses within the bars six baskets in the outside lane were fitted with
47
strain gauges The basket configurations chosen for instrumentation were
bull Medium elliptical dowels at 305-mm (12shyin) spacing
bull Medium elliptical dowels at 460-mm (18-in) spacing
bull Heavy elliptical dowels at 305-mm (12-in) spacing
bull Heavy elliptical dowels at 460-mm (18-in) spacing
bull Heavy elliptical dowels at 380-mm (15-in) spacing
bull Standard 38-mm (15-in) dowels at 305-mm (12-in) spacing
State Monitoring Activities
The research team is monitoring the performance of these test sections for 5 years FWD tests visual distress surveys joint faulting and joint opening measurements and longitudinal profile measureshyments are being conducted twice per year (spring and fall) (Cable Edgar and Williams 2003) In addition strain gauge responses were monitored using loaded trucks 1 to 7 days after paving and will be monitored 1 3 and 5 years after paving (Cable Edgar and Williams 2003)
Preliminary ResultsFindings
The following conclusions can be drawn from the construction process (Cable Edgar and Williams 2003)
bull The use of elliptical dowels had no effect on the handling or installation of standard full-lane width dowel baskets
bull The wheelpath-only baskets provide for more options in the pavement placement process are easy to handle and require less dowel
materials However the wheelpath-only basshykets require more time to align on the base than conventional baskets of full-lane width
bull Current construction practices make it somewhat difficult to install and protect the strain gauges during the various phases of construction
A general concern about the use of elliptical dowel bars is their suitability for placement with a dowel bar inserter
Points of Contact
Mark Dunn Iowa Department of Transportation 800 Lincoln Way Ames IA 50011 (515) 239-1447
Max L Porter Iowa State University Center for PCC Pavement Technology 2901 S Loop Drive Suite 3100 Ames IA 50010-8632 (515) 294-8103
References
Cable J K L Edgar and J Williams 2003 Field Evaluation of Elliptical Steel Dowel Perform-ancemdashConstruction Report Iowa State University Ames
Porter M L and R J Guinn 2002 Assessment of Dowel Bar Research Project HR-1080 Final Reshyport Iowa Department of Transportation Ames
Porter M L R Guinn and A Lundy 2001 Dowel Bar Optimization Phases I and II Final Report American Highway Technology and Center for Portland Cement Concrete pavement Technolshyogy Ames
48
Chapter 14 IOWA 5 (Iowa 330 Melbourne)
Introduction
In 2002 the Iowa DOT in conjunction with Iowa State University constructed concrete pavement test sections containing elliptical fiber reinforced polymer (FRP) dowel bars The test sections are located on Iowa 330 just west of Melbourne Iowa (see Figure 40) The primary advantage of FRP dowels over conventional steel dowels is that they are not susceptible to corrosion In addition the benefits of an elliptical shape over circular are the reduction of bearing contact stress between the concrete and the bar This project provides the opshyportunity to evaluate the performance of elliptical FRP dowels compared to both round and elliptical steel dowels installed on the same highway project
Figure 40 Location of IA 5 project
Study Objectives
The goal of this project is the evaluation of the elshyliptical FRP dowels and elliptical dowel bar baskets to provide for transfer of load across the concrete pavement joints (Cable Porter and Guinn 2003)
Project Design and Layout
The elliptical FRP dowel bars used in this project are 457-mm (18-in) long The major and minor axes have dimensions of 5715 and 4928 mm (225 and 194 in) respectively (Cable Porter and Guinn 2003) Dowel bars were placed in the northbound lanes at 30 joint locations each 6 m (20 ft) apart Three different dowel bar spacings (254 305 and 381 mm [10 12 and 15 in]) were used
Figure 41 illustrates the layout of the dowel bars (Cable Porter and Guinn 2003)
The use of FRP material caused an inability to use the conventional method of welding steel dowel bars to the baskets Therefore the dowels were atshytached to the baskets using plastic ties and epoxy (Cable Porter and Guinn 2003) Special care was taken to make sure that when dried the epoxy was strong enough to hold the bars in position during the concrete placement yet brittle enough to crack and allow the bars to move in the longitudinal dishyrection after the concrete had set (Cable Porter and Guinn 2003)
To determine the stresses on the dowel bars at difshyferent spacings one dowel bar from each of the 254- 305- and 381-mm (10- 12- and 15-in) spacshyings was fitted with eight strain gauges The strain gauge positions as shown in Figure 42 (Cable Porshyter and Guinn 2003) were chosen to be the same as the strain gauges placed on the coinciding ellipshytical steel dowel bar project to facilitate a comparishyson between the two types of bars
State Monitoring Activities
The research team is monitoring the performance of these test sections for a period of 5 years Visual distress surveys joint opening and joint faulting measurements FWD tests and profile measureshyments are being conducted twice a year (spring and fall) Load testing using a loaded Iowa DOT tanshydem axle truck was conducted in fall 2002 and winter 2003 and will be conducted in the future only as long as the wiring to the test bars continues to function
Preliminary ResultsFindings
The following conclusions were drawn from this project during the construction process
bull The elliptical FRP dowels can be placed on metal baskets and successfully placed in concrete pavements
bull Testing of the FRP dowel locations indishycates no specific difference with the steel dowels on an adjacent project
49
STA 1372+83
10 Joints (1969 ft [6 m] apart) STA 1372+59 Dowels 15 in (381 mm) (Gaged)
STA 1372+29 STA 1372+23
10 Joints (1969 ft [6 m] apart)STA 1371+93 Dowels 12 in (305 mm)
(Gaged)
STA 1371+69 STA 1371+63
10 Joints (1969 ft [6 m] apart) Dowels 10 in (254 mm)
STA 1371+33 (Gaged)
STA 1371+09
Slab width 2559 ft (78 m)
Figure 41 Layout of dowel bars on IA 5 project
50
15 in 15 in (38 mm) (38 mm)
Top
Bottom 45 in 45 in
(114 mm) (114 mm)
18 in (457 mm)
Figure 42 Location of strain gauges on elliptical FRP dowel bar
Points of Contact
Mark Dunn Iowa Department of Transportation 800 Lincoln Way Ames IA 50011 (515) 239-1447
Max L Porter Iowa State University Center for PCC Pavement Technology 2901 S Loop Drive Suite 3100 Ames IA 50010-8632 (515) 294-8103
Reference
Cable J K M L Porter and R J Guinn 2003 Field Evaluation of Elliptical Fiber Reinforced Polymer Dowel PerformancemdashConstruction Re-port Iowa State University Ames
51
Chapter 15 IOWA 6 (Various Locations)
Introduction
Iowa State University in cooperation with Iowa DOT and Iowa Fly Ash Affiliates (IFAA) started full-scale field tests in 2002 to develop and impleshyment practical guidelines for soil stabilization with a wide range of fly ashes This research will not only benefit the paving industry by emphasizing the importance of subgrade uniformity but it will develop knowledge of successful design and applishycation of soil stabilization with fly ash materials
Study Objectives
The research has four primary objectives (White 2002)
1 Evaluate and document the influence of subgrade uniformity on pavement performshyance from studies of past and test sections selected in this study
2 Determine from field test sections and laboratory analysis how various raw fly ashes hydrated fly ashes (HFA) and conshyditioned fly ashes (CFA) in combination with the wide range of Iowa soil types will bring about uniform properties for sub-grade support
3 Recommend design and construction proshycedures and develop a Ash Stabilization Guide
4 Create a technology transfer seminar to disseminate the knowledge
Project Design and Layout
Several potential fly ash stabilization projects inshycluding sections of US highways 63 and 330 have
been identified for this study Field testing will be conducted to determine engineering properties of subgrade soils such as classification stiffness strength density and moisture content before and after stabilization (White 2002) Laboratory testing will be conducted on various ashsoil mixtures to evaluate the effects of ash on compressive strength volumetric stability and soil index properties of subgrade soils (White 2002)
State Monitoring Activities
At the time of this report the planned monitoring activities are yet to be determined
Preliminary ResultsFindings
No preliminary results or findings are available
Points of Contact
Mark Dunn Iowa Department of Transportation 800 Lincoln Way Ames IA 50011 (515) 239-1447
David J White Iowa State University Center for PCC Pavement Technology 2901 S Loop Drive Suite 3100 Ames IA 50010-8632 (515) 294-8103
Reference
White D W 2002 Field Trials of Guidelines for Soil Stabilizers of Non-Uniform Subgrade SoilsmdashProposal Iowa State University Ames
52
Chapter 16 Iowa 7 and MD 2 (Implementation of TEMP)
Introduction
The most common uses of the Total Environmental Management for Paving (TEMP) system is to preshydict the critical time to open concrete pavements to traffic and to determine the appropriate time for joint sawing activities (Transtec 2002) Concrete strength development and pavement opening times are computed using maturity concepts in which the opening time can be predicted based on the past (known) and future (predicted) concrete temperashytures Maturity methods have been used effectively for a number of years The key advantages of the TEMP system over the state-of-the-practice are automation and prediction At a minimum a TEMP System is comprised of concrete temperature gauges as well as a computer running the TEMP System software An optional portable weather stashytion can be included to further enhance the predicshytive ability of the software
In 2003 a cooperative project was initiated to imshyplement the TEMP system in the field Three canshydidate implementation sites two in Iowa and one in Maryland have been identified for this project The results from this project will help an agency or conshytractor better utilize concrete maturity data and imshyprove the efficiency and quality of concrete paving
Study Objectives
The objectives of this project include proof testing in the field as well as associated implementation activities of the TEMP system These objectives can be categorized as follows (Turner and Ruiz 2003)
bull Demonstrate an automated maturity data collection system that automatically colshylects and relays maturity data in the field
bull Demonstrate an automated maturity data management and reporting system that automatically catalogs maturity data in a fashion suitable for easy reporting and inshyterpretation by the practitioner
bull Demonstrate a system that performs real-time predictions of future concrete strengths and time of opening to traffic
Project Design and Layout
Up to three implementation sites are required for this project which have been tentatively identified as (Turner and Ruiz 2003)
1 US 151 in Jones County Iowa This project is a four-lane relocation and new construcshytion on a new alignment The total length of the project is 993 km (617 mi) from North of Monticello Iowa to Cascade Iowa The pavement cross section is a 240shymm (95-in) JPCP on a 260-mm (102-in) granular base The inside and outside lanes will be 36 m (118 ft) and 42 m (138 ft) wide respectively Perpendicular transshyverse joints will be doweled and spaced at 6-m (20-ft) intervals The pavement will have granular shoulders
2 County roads including 320th Street in Washington County Iowa This project is a combination of four individual sections in Washington County Two sections (650 and 275 km [404 and 171 mi] long) are 67-m (22-ft) wide JPCP on 102-mm (4-in) of rubblized concrete The new concrete layer varies from 254 mm (10 in) at the edges to 178 mm (7 in) at the centerline The pavement will have skewed and dowshyeled transverse joints at a spacing of 46 m (15 ft) and will have granular shoulders A third 436-km (271-mi) long section folshylows the same concrete surface thicknesses but will be constructed on an existing granular surfaced road A fourth section will be approximately 129 km (8 mi) long and will follow the same design for the concrete surface layer but will be conshystructed as whitetopping (on existing asshyphalt) or on granular material
53
3 Frederick Maryland Details on this proshyject are still being collected
Temperature monitoring sensors (iButtonstrade) will be installed into fresh concrete during paving IButshytonstrade will be installed at the mid-depth of the pavement and 03 to 09 m (1 to 3 ft) from the outshyside edge and transverse joint with intervals typishycally between 305 and 305 m (100 and 1000 ft) (Turner and Ruiz 2003)
State Monitoring Activities
Concrete temperature and strength as well as weather conditions (eg temperature wind speed and relative humidity) will be monitored using the TEMP System for 3 to 4 days following placement (Turner and Ruiz 2003)
Preliminary ResultsFindings
No preliminary results or findings are available at this time
Point of Contact
Mark Dunn Iowa Department of Transportation 800 Lincoln Way Ames IA 50011 (515) 239-1447
References
The Transtec Group 2002 Technical Work Plan for Implementation of a Total Environmental Man-agement for Paving (TEMP) System The Transtec Group Inc Austin TX
Turner D J and J M Ruiz 2003 Final Work Plan for Implementation of a Total Environmental Management for Paving (TEMP) System The Transtec Group Inc Austin TX
54
70
35
Kansas 1Highway K-96 Haven
70
35
Chapter 17 KANSAS 1 (Highway K-96 Haven)
Introduction
In 1997 the Kansas Department of Transportation (KDOT) constructed an experimental project under the TE-30 program This project incorporates a wide variety of experimental features from alternashytive dowel bars to alternative sawing practices to different mix designs (Wojakowski 1998) The proshyject is located on Highway K-96 near Haven which is located between Wichita and Hutchinson (see Figure 43)
96
Topeka
Wichita
Hutchinson
Haven
70
96 35
Topeka
Wichita
Hutchinson
Haven
Kansas 1 Highway K-96 Haven
Figure 43 Location of KS 1 project
Study Objectives
Looking for ways to improve PCC pavement pershyformance KDOT implemented this project to speshycifically assess the effects of different design feashytures mix designs and construction practices on the constructibility and performance of PCC paveshyments Benefits expected to be derived from the project include assessments of the following (Woshyjakowski 1998)
bull Feasibility of including recycled waste mashyterials in a two-lift PCC pavement
bull Feasibility of using a harder aggregate of unknown reactivity mitigated with an apshypropriate pozzolan in a two-lift PCC paveshyment
bull Performance of new load transfer devices
bull Life extensions associated with premium materials and concrete mixes
bull Cost-benefit data associated with the varishyous designs
Project Design and Layout
Two phases were defined in the work plan for this project Phase I included evaluating the many difshyferent construction materials and mix designs to be used in the study preparing the plans and specificashytions doing a construction evaluation and evaluatshying and monitoring the project (Wojakowski 1998) Phase II consisted of the actual construction of the test sections
Constructed in the early fall of 1997 the test secshytions are located only in the two eastbound lanes of the four-lane divided highway (Wojakowski 1998) Most test sections are 1-km (06-mi) long The soils in the area are typically silty and sandy loams and the 20-year projected traffic volume is 8000 vehishycles per day which includes 11 percent trucks (Wojakowski 1998)
The nominal pavement structural design for the test sections is a 254-mm (10-in) JPCP over a cement-treated base (CTB) Transverse joints are spaced at 46-m (15-ft) intervals (except for one section) contain 32-mm (125-in) diameter epoxy-coated steel dowels (except for two sections) and are sealed with neoprene compression seals (except for part of one section) (Wojakowski 1998) Longitushydinal joints contain tie bars at 914-mm (36-in) spacings and are sealed with a hot-poured low-modulus sealant (Wojakowski 1998)
Thirteen experimental pavement sections were conshystructed on this project incorporating a wide range of design and construction variables A description of the features of each experimental section is proshyvided below (Wojakowski 1998)
bull Section 1mdashControl section This pavement section reflects the nominal pavement strucshytural design containing 32-mm (125-in) dishyameter dowel bars and placed in a single lift The concrete mixture contains 337 kgm3
(564 lbyd3) of Type II cement a water-cement ratio (wc) of 047 and 65 percent air Three aggregatesmdash35 percent of a coarse
55
limestone (19 mm [075 in] top size) 15 pershycent of a pea gravel and 50 percent of a coarse sandmdashwere used and blended to proshyduce a grading approximating a ldquoShilstonerdquo haystack gradation curve Consolidation of the concrete was specified to be 98 percent of the vibrated unit weight when measured by a nuclear density meter
bull Section 2mdashSingle saw cut The first 31 transverse joints of this section were created using a narrow (6 mm [025 in]) single saw cut and left unsealed whereas the remaining 79 joints were widened and sealed with a hot-poured material Other than the transverse joint sealant other asshypects of this pavement are the same as the nominal pavement structural design
bull Section 3mdashNontraditional dowel type With the same nominal structural design as the control this section incorporates 51shymm (2-in) diameter FiberContrade fiberglass dowels manufactured by Concrete Sysshytems Inc These dowels are a composite fiberglass tube filled with a high-strength cement grout One-half of the length of the bar is machined to a smooth surface of 48 mm (19 in) diameter to allow slippage of the bar as the joint opens and closes The bars are placed on center-to-center spacshyings of 305 mm (12 in)
bull Section 4mdashX-Flextrade load transfer device This short section consisting only of five joints incorporates a unique load transfer device called the X-Flextrade developed at Kansas State University As shown in Figshyure 44 the configuration of the X-Flextrade is such that the ldquoXrdquo part of the device goes across the transverse joint with the far ends curving to make a loop in a continuous deshysign wheel loads are transferred through tension in the ldquoXrdquo part of the device rather than by shear The device is made from 13 mm (05 in) epoxy-coated steel cast bars and spaced at 305-mm (12-in) centers across the joint Other design aspects of this section are the same as the nominal pavement design
bull Section 4a 5 and 6mdashAlternate saws Three sections were constructed that used different lightweight saws for the estabshylishment of the transverse joints Section 4a used a Soff-Cuttrade saw (to depths of 38 and 64 mm [15 and 25 in]) section 5 used a Target saw (to depths of 25 44 and 64 mm [1 175 and 25 in]) and section 6 used a Magnum saw (to depths of 25 44 and 64 mm [1 175 and 25 in]) The rest of the design features of this section are the same as the nominal structural design
Figure 44 Photo of X-Flextrade load transfer devices
56
bull Section 6amdashPolyolefin fiber PCC This short (152-m [500-ft]) section incorporates polyolefin fibers in the PCC mix design The transverse joint spacing was extended to 183 m (60 ft) and the longitudinal lane-lane joint was eliminated The fibers are 157 mm (0062 in) in diameter and were added at the rate of 15 kgm3 (25 lbyd3) The wc of the mix was increased from 045 to 049 to provide additional workability
bull Section 7mdashLongitudinal tining Instead of conventional transverse tining this section incorporates longitudinal tining impressed on the surface of the fresh concrete surface The primary purpose of longitudinal tining is to reduce noise levels produced by passshying vehicles All other design aspects of this section are the same as the nominal structural pavement design
bull Section 8mdashSpecial curing compound A special high solids curing compound conshyforming to ASTM C 1315 was applied to this section The purpose is to compare the effectiveness of the special curing comshypound to the conventional curing comshypound in terms of surface integrity and compressive strength The curing comshypound was applied at the rate of 0036 Lm2
(003 galyd2) which is about half the rate recommended for a rough surface All other design elements for this section are the same as the nominal pavement design
bull Section 9mdashTwo-lift construction with recy-cled asphalt pavement (RAP) This section used a two-lift construction process in which the bottom 178 mm (7 in) of paveshyment used 15 percent recycled asphalt pavement in place of the intermediate-sized well gravel Laboratory testing indicated that this mixture could produce 28-day strengths of 276 MPa (4000 lbfin2) The top lift was placed 76-mm (3-in) thick usshying the standard PCC mixture All other design aspects for this section are the same as the nominal pavement design
bull Section 10mdashLower wc Concrete This secshytion employed a high-range water reducer to lower the wc of the mixture by 005 from the standard wc of 047 The rest of
the pavement design is the same as the nominal structural pavement design
bull Section 11mdashTwo-Lift Construction with Igneous Rock This section used a two-lift construction process in which the top 76 mm (3 in) incorporates rhyolite a hard igshyneous rock The objective of this design is to evaluate the resistance of the pavement to polishing to which the limestone aggreshygates commonly used by KDOT are susshyceptible Because the rhyolite is potentially susceptible to alkali-silica reactivity (ASR) a calcined natural clay pozzolan called DuraPoztrade was used to replace 20 percent of the cement (by weight) in the 76-mm (3-in) surface layer The bottom 178 mm (7 in) of this pavement used a soft high-absorption durable limestone A 25-mm (1-in) maximum size that passed the Statersquos freeze-thaw durability test (ASTM C 666 Procedure B) was used
bull Section 12mdashTwo-Lift Construction with Lower wc Concrete This two-lift conshystruction section used the same lower wc PCC mixture used in section 10 but only in the top 76 mm (3 in) layer The bottom 178 mm (7 in) layer used the same 25-mm (1-in) soft high absorptive limestone used in section 11 The remaining design aspects of this section are the same as the nominal pavement design
bull Section 13mdashRandom Transverse Tining and Special Curing Compound This secshytion was constructed in the spring of 1998 and used a special tining rake that imparted variably spaced transverse impressions on the surface of the fresh concrete to reduce tire-surface noise Additionally the reshymainder of the high-solids special curing compound used on section 8 was applied at the rate of 018 Lm2 (004 galyd2) All other design elements of the section are the same as the nominal pavement design
Table 17 provides the simplified experimental deshysign matrix for the sections included in this project The layout of the pavement test sections is illusshytrated in Figure 45
57
58
Table 17 Simplified Experimental Design Matrix for KS 1
CONVENTIONAL PCC MIX WITH SINGLE-LIFT CONSTRUCTION
TWO-LIFT CON-STRUCTION (RECYCLED
ASPHALT ON BOTTOM)
TWO-LIFT CONSTRUCTION
(IGNEOUSROCK ON TOP)
TWO-LIFT CONSTRUCTION
(LOW WC ONTOP)
PCC MIX WITH POLYOLEFIN
FIBERS
Conventional Sawcutting Equipment
Lightweight Sawcutting Equipment
Conventional Sawcutting Equipment Conventional Sawcutting Equipment
Conventional Sawcutting Equipment
Steel Dowels FiberCon Dowels
X-Flex Device Steel Dowels Steel Dowels Steel Dowels
Steel Dowels
Compression Seals Compression Seals
Hot-Pour Sealant
No Sealant Compression Seals
Compression Seals
Conventional wc
Conventional Curing Compound
Conventional Transverse Tining
Section 1 Section 3 Section 4 Section 4a Section 5 Section 6
Section 2 Section 2 (31 jts)
Section 9 Section 11 Section 12 Section 6a
Longitudinal Tining
Section 7
Random Transverse Tining
High Solids Curing Compound
Conventional Transverse Tining
Section 8
Longitudinal Tining
Random Transverse Tining
Section 13
Lower wc Conventional Curing Compound
Conventional Transverse Tining
Section 10
Kansas High Performance Rigid Pavement Test Sections
96-78 K 4457-01 Reno County
566+95 533+25 516+85 Soft Cut 500+70
Target Magnum 468+95
1 Control Section 2 Single Saw Cut 3 Non-Traditional 4 5 and 6 X-Flex Alternate Saws and 3M Fibers Dowel Type
1 km (3280 lf) 12 km (1640 lf) 12 km (1640 lf) 1 km (3280 lf) (5 X-Flex joints)
Typical construction Single saw cut FiberCon dowels Initial control cuts utilizing no joint sealant Soff-Cut Magnum and Target Early-cut Saws
014 km open 036 km ss 3M polyolefin fibers (500 ft section only) 1 lift placement 1 lift construction 1 lift construction 1 lift construction Shilstone design Shilstone design Shilstone design Shilstone design 564 lb cementcy 564 lb cementcy 564 lb cementcy 564 lb cementcy 65 air 65 air 65 air 65 air 98 consolidation 98 consolidation 98 consolidation 98 consolidation Typical epoxy coated steel dowels (125 dia) Typical dowels Typical dowels Typical dowels outside of X-flex 047 wc used through section 047 wc ratio 1st day 045 wc ratio all day 047 wc ratio for fibers
045 wc ratio 2nd day 045 wc ratio for all other
468+95 435+05 420+10 366+30
7 Special Pavement MarkingLongitudinal Tining 8 ASTM C1315 Cure 9 Two-Lift Recycled Asphalt on Bottom
1 km (3280 lf) 1 km (3280 lf) 1 km (3280 lf)
Longitudinal tining Special high-solids curing compound 15 RAP usage in bottom 7 layer Proprietary pavement marking product Typical concrete mix in top 3
1 lift construction 1 lift construction 2 lift construction Shilstone design Shilstone design 564 lb cementcy 564 lb cementcy 564 lb cementcy 65 air 65 air 65 air in each lift 98 consolidation 98 consolidation 98 consolidation Typical dowels Typical dowels Typical dowels 045 wc ratio through section Single consolidation
3 oz100 lb Masterpave N in RAP mix 045 wc ratio in RAP mix 045 wc ratio in normal mix
366+30 333+30 312+65 289+05 248+90
10 Lower wc Ratio 11 Two-Lift Igneous Rock on Top 12 Two-Lift Low wc on Top
1 km (3280 lf) 063 km (2065 lf) 1 km (3280 lf)
High range water reducer to High absorption limestone in bottom 7 High absorption limestone in bottom 7 lower wc 005 from standard mix Rhyolite aggregate in top 3 High range water reducer in top 3 to
Dura-Poz to counter ASR of Rhyolite lower wc 005 from standard mix 1 lift construction 2 lift construction 2 lift construction Shilstone design Shilstone design Shilstone design 564 lb cementcy 564 lb cementcy 546 lb cementcy 65 air 65 air in each lift 65 air in each lift 98 consolidation 98 consolidation 98 consolidation Typical dowels Typical dowels Typical dowels
Single consolidation Single consolidation
13 Random Pattern Transverse Tining and High Solids Cure Sta 966+44 to 982+15 and 1006+00 to 1026+40 11 km (3611f) All else typical construction
Figure 45 Layout of KS 1 project (Wojakowski 1998)
59
State Monitoring Activities
Construction Monitoring During the construction of the test sections sevshyeral incidents of note were observed by the reshysearchers These are summarized below (Wojashykowski 1998)
bull Section 4 Because they were placed only about 38 mm (15 in) below the surface several of the X-Flextrade load transfer deshyvices were struck and dislodged by the paver during construction Consequently some of these devices had to be replaced by dowels and the transverse joint hand finished
bull Section 5 Sawing with the Soff-Cuttrade lightweight saw began about 3 hours and 20 minutes after the concrete was placed For the 40 joints cut to a depth of 38 mm (1 in) 6 cracks occurred beneath the saw cut after 1 day 18 cracks occurred beshyneath the saw cut after 2 days 23 cracks after 3 days 31 cracks after 4 days 35 cracks after 5 days and 39 cracks after 7 days No cracks were observed within the panels for this section or for any of the secshytions that employed the lightweight sawsSection 6 Intermediate cracks ocshycurred almost immediately after this fiber-reinforced PCC pavement was placed During the first night intermediate cracks formed on 5 of the 8 panels that were paved and by the 5th day after placement 10 cracks had appeared in the 8 panels The panels containing two cracks were noted to be the first two placed on the day that had a high temperature of 35 oC (95 oF) and a low of 21 oC (69 oF)
bull Section 8 The special curing compound was applied with the expectation that imshyproved curing would lead to a more durashyble pavement Unfortunately the envishyronmental conditions at the time of application were quite mild and the acshytual coverage rate (0035 Lm2 [003 galyd2]) was one-half the recommended value
bull Section 9 Limited funding prevented the use of a separate paver for the lower lift
Therefore a belt placerspreader was used for the placement of the lower lift the mix design of which had to be stiffened to accommodate its placement An interval of about 30 minutes was needed between the placement of the two lifts Small depressions were noted when the top lift was dropped on the bottom lift and some intermixing of the two lifts occurred but for the most part the process was workashyble and adequately controlled This same construction procedure was essentially followed for all two-lift sections
bull Section 10 In spite of the lower wc used in the mix design for this section it was found to be workable and easy to finish This workability is attributed to the lubrishycation provided by the high-range water reducer used to reduce the wc
bull Section 13 The weather at the time that this section was constructed in 1998 manshydated the use of cold-weather concreting procedures The special curing compound was applied at the specified rate of 018 Lm2 (004 galyd2)
Early Mix Property Data During the construction of the different sections several key mix design properties were measured These measurements are summarized in Table 18 Generally speaking most of the results appear reasonable for the various mix designs
Performance Monitoring KDOT has been monitoring the performance of these test sections since 1998 The following inshyformation is collected distress data (cracking faulting spalling) joint load transfer efficiency noise and surface friction (Wojakowski 1998)
Preliminary ResultsFindings
Some preliminary results are available from KDOT regarding the costs and performance of these sections These results are described in the following sections
60
Cost Data Construction costs for these sections are summashyrized in Table 19 and illustrated in Figure 46 Some notes regarding these costs are documented by Wojakowski (1998)
bull Section 1 This figure includes the costs of both the mainline pavement and the shoulders
bull Section 3 For the small quantities of this project the costs of the Fiber-Contrade dowels were $2887m ($880ft) as compared to $800m ($244ft) for conventional epoxy-coated steel dowshy
els With a larger project and volume pricing the cost of these dowels could be expected to be around $1640m ($500ft)
bull Sections 4a 5 and 6 The lightweight saws provided minimal savings to the overall construction costs
bull Sections 9 11 and 12 These sections inshycluded a two-lift construction process that added considerable cost The two-lift conshystruction costs included a second batch plant extra hauling of material a concrete belt placer spreader and extra labor for hauling
Table 18 Summary of Early Mix Properties of KS 1 Test Sections (Wojakowski 1998)
CORE AVERAGE COMPRESSIVE
SECTION AVERAGE SLUMP IN
AVERAGE AIR
CONTENT
AVERAGE UNIT WEIGHT
LBFT3
FLEXURAL STRENGTH
LBFIN2
STRENGTH LBFIN2
(28-DAY)
1―Control 06 60 1420 525 (7 days) 4583
2―Single sawcut 10 71 1422 NA NA
3―Nontraditional dowel 10 53 1426 NA NA
4―X-Flextrade NA NA NA NA NA
4a―Lightweight Soff-cut saw NA NA NA NA 4530
5―Lightweight Target saw 10 70 1410 NA NA
6―Lightweight Magnum saw NA NA NA NA NA
6a―Polyolefin fibers 00 52 1410 539 (7 days) 4598
7―Longitudinal tining
8―Special curing compound
9―Two-lift with RAP
08
21
08 (top lift)
08 (bottom lift)
69
74
68
58
1412
1400
1420
1422
NA
NA
NA
517 (5 days)
4665
4760
3843
10―Lower wc
11―Two-lift with igneous rock
12―Two-lift with lower wc
11
20 (top lift)
08 (bottom lift)
10 (top lift)
58
43
59
58
1447
1422
13943
1438
550 (4 days)
583 (8 days)
475 (4 days)
583 (6 days)
5040
4780
NA
12 (bottom lift) 53 13782 583 (6 days)
13―Random tining NA
NA = not available Flexural strengths measured under third-point loading
NA NA NA NA
61
Table 19 Summary of Construction Cost Data for KS 1 (Wojakowski 1998)
COST DIFFERENCE FROM TOTAL SECTION EXPERIMENTAL FEATURE CONTROL $YD2 UNIT COST $YD2
1 Control mdash 2580
2 Unsealed joints ndash067 2513
3 FiberContrade dowels +572 3152
4 X-Flextrade device NA NA
4a Soff-Cut lightweight saw 0 2580
5 Target lightweight saw 0 2580
6 Magnum lightweight saw 0 2580
6a Polyolefin fibers +1563 4143
7 Longitudinal tining 0 2580
8 Special curing compound +083 2663
9 Two-lift construction with RAP +2512 5092
10 Lower wc +003 2583
11 Two-lift construction with igneous rock +2605 5185
12 Two-lift construction with lower wc +2509 5089
13 Random transverse tining 0 2580
NA = Not available (experimental device not commercially available)
6060
5050
4040
3030
2020
1010
00
CCoonnsst
rtruucctiti
oonn CC
oosstt
$$
yydd22
NANA
11 22 33 44 44aa 55 66 66aa 77 88 99 1100 1111 1122 1133 S eS e cc tt iioo nn
Figure 46 Relative construction costs by section for KS 1
62
Early Performance Data KDOT is monitoring the performance of these test sections and has produced two annual reports documenting their early performance (KDOT 1998 KDOT 1999) Visual distress surveys are conshyducted in which cracking joint faulting and joint spalling are recorded The results from these surshyveys are illustrated in Table 20 An examination of this table shows that although a few cracks have occurred in a few of the sections overall these secshy
tions are in good condition Faulting levels are all less than 1 mm (004 in) far below critical faulting thresholds of 25 to 30 mm (010 to 012 in) Joint spalling is observed only on two sections
The initial profile index values for the test sections are shown in Table 20 and plotted in Figure 47 These values are based on a zero-blanking band Followup roughness measurements are not availshyable
Table 20 Summary of Early Performance Data for KS 1 Project (KDOT 1998 KDOT 1999)
SECTION EXPERIMENTAL
FEATURE
1998 INITIAL PROFILE
INDEX MMKM
AVERAGE JOINT FAULTING MM
1998 1999
AVERAGE SPALLING MMJOINT
1998 1999 OTHER NOTED DISTRESSES
1 Control 240 002 002 490 1524
2 Unsealed joints
Sealed joints
000
007
021
010
1 corner crack
2 corner cracks
3 FiberContrade dowels 268 008 025 10-m transverse
crack 8 corner cracks
4 X-Flextrade device 259 000 000
4a Soff-Cut lightweight saw 000 007
5 Target lightweight saw 000 007
6 Magnum lightweight saw
Polyolefin fibers 006 016 16 mid-panel 6a cracks
1 longitudinal crack
7 Longitudinal tining 189
8 Special curing compound 129 002 00 106 169
9 Two-lift construction with RAP 178 005 013
10 Lower wc 178 013 010
11 Two-lift construction with igneous rock
166 002 002
12 Two-lift construction with lower wc
186 013 017 37-m trans crack
13 Random transverse tining 319 003
These cracks in section 6a were retrofitted with dowel bars in 1999
63
IInnitit
iiaal
Pl
Prroo
ffile
ile II
nnddeexx
mmmm
kkmm 350350
300300
250250
200200
150150
100100
5050
00 NNAA
11 22 33 44 44aa 55 66 66aa 77 88 99 1100 1111 1122 1133 S eS e cc tt iioo nn
Figure 47 Comparison of Initial Profile Index of KS 1 test sections (Zero-Blanking Band)
A noise study was conducted by KDOT in October 1998 to assess the effect of the various tining methods (sections 1 7 and 13) (KDOT 1998 KDOT 1999) Noise sampling was recorded from a passenger car and a medium-duty dump truck at three locations adjacent to the roadway The study concluded that there were no significant differences in either the exterior or interior noise levels genershyated by vehicles traveling over these test sections (KDOT 1998 KDOT 1999)
Interim ResultsFindings
The interim performance of these test sections is documented in the 2002 Annual Report (KDOT 2002) and the 2003 Annual Report (KDOT 2003) and summarized in Tables 21 and 22 FWD testing was performed in January 2002 and again in Janushyary 2004 and the results are shown in Figure 48 Based upon the FWD results some of the load transfer devices are exhibiting marginal efficiency particularly for a pavement less than 5 years old
References
Kansas Department of Transportation (KDOT) 1998 High Performance Concrete Pavement K-96 Reno County 1998 Annual Report Kansas Deshypartment of Transportation Topeka
mdashmdashmdash 1999 High Performance Concrete Pave-ment K-96 Reno County 1999 Annual Report Kansas Department of Transportation Topeka
mdashmdashmdash 2002 High Performance Concrete Pave-ment K-96 Reno County 2002 Annual Report Kansas Department of Transportation Topeka
mdashmdashmdash 2003 High Performance Concrete Pave-ment K-96 Reno County 2003 Annual Report Kansas Department of Transportation Topeka
Wojakowski J B 1998 High Performance Con-crete Pavement Report No FHWA-KS-982 Kanshysas Department of Transportation Topeka
64
Table 21 Summary of 2002 Performance Data for KS 1 Project (KDOT 2002)
SECTION EXPERIMENTAL
FEATURE
AVERAGE JOINT FAULTING
MM
2002
AVERAGE SPALLING MMJOINT
2002 OTHER NOTED DISTRESSES
1 Control 002 652
2 Unsealed joints 002 279 1 corner crack
Sealed joints 007 389 6 corner cracks
3 FiberContrade dowels 016 322 7 corner cracks 1 12-m longitudinal crack
4 X-Flextrade device 000 1626
4a Soff-Cut lightweight saw 002 1431
5 Target lightweight saw 007 109
6 Magnum lightweight saw 000 508
6a Polyolefin fibers 023 533 3 new longitudinal cracks
7 Longitudinal tining 007 93
8 Special curing compound 007 279
9 Two-lift construction with RAP 005 178 16 transverse cracks averaging 13 m each
10 Lower wc 015 102
11 Two-lift construction with igneous rock
007 271 395 transverse cracks averaging 04 m each 16 longitudinal cracks averaging 04 mm each
12 Two-lift construction with lower wc 012 127 5 longitudinal cracks from 46 to 914 m each 1 37 m transverse crack
13 Random transverse tining 005 229 2 corner cracks 1 03 m longitudinal crack
65
Table 22 Summary of 2003 Performance Data for KS 1 Project (KDOT 2003)
AVERAGE JOINT FAULTING MM
AVERAGE SPALLING MMJOINT
SECTION EXPERIMENTAL FEATURE 2003 2003 OTHER NOTED DISTRESSES
1 Control 025 415
2 Unsealed joints 008 590 1 corner crack
Sealed joints 007 500 6 corner cracks
3 FiberContrade dowels 022 381 10 corner cracks 1 12-m longitudinal crack
4 X-Flextrade device 040 1067
4a Soff-Cut lightweight saw 007 854
5 Target lightweight saw 004 218
6 Magnum lightweight saw 000 445
6a Polyolefin fibers 019 254
7 Longitudinal tining 007 93
8 Special curing compound 002 423
9 Two-lift construction with RAP 000 110 16 transverse cracks averaging 13 m each light map cracking on 21 of 30 panels
10 Lower wc 012 237
11 Two-lift construction with igneous rock
000 212 17 longitudinal cracks averaging 26 m each many smaller cracks not recorded
12 Two-lift construction with lower wc 008 246 5 longitudinal cracks from 46 to 914 m each 1 37-m transverse crack 1 03-m transverse crack
13 Random transverse tining 007 279 2 corner cracks 1 36-m longitudinal crack
Figure 48 Joint load transfer efficiency on KS 1
66
Chapter 18 KANSAS 2 (Hutchinson)
Introduction
The Kansas Department of Transportation a nashytional leader on pavement smoothness has undershytaken a project to build a PCC pavement that is ldquosuper smoothrdquo and maintains that smoothness for an extended time This project consists of five speshycial sections is located in Hutchinson Kansas and has a construction start date of April 2001 The proshyject is multifaceted The initial smoothness will be monitored and controlled with new equipment innoshyvations while the post-construction smoothness will be evaluated for different construction conditions (weather) mixture properties (wc ratio) and joint spacings
Study Objectives
To build a super-smooth pavement that maintains most of its original smoothness through increased initial smoothness levels as well as through design and mixture improvements
Project Design and Layout
The pavement design consists of a 220-mm (87shyin) slab with 46-m (15-ft) joint spacing a dense cement treated base 32-mm (125-in) diameter dowels spaced at 305 mm (12 in) and a tied conshycrete shoulder The transverse and longitudinal joints are sealed with a preformed compression seal and a low-modulus hot-poured material respecshytively
A definite correlation has been shown between monitoring of the smoothness behind the paver and the head of concrete coming into it A special strike-off bar is being developed to maintain a unishyform head of concrete to help alleviate one signifishycant source of roughness Concrete mixtures have been improved by newer specifications in Kansas but there still appears to be room for making the
mixture more workable without being susceptible to segregation This will be done by increasing the coarse aggregate content to the maximum possible while maintaining a non-segregating grading withshyout gaps Consistency of the mixture and the pavshying operation along with ambient temperatures must also be monitored for any effect on smoothshyness The smoothness of the paving base should also be checked
During the post construction period the temperashyture gradient in the slab will be measured for mornshying and afternoon placements Daily temperature ranges (and solar radiation) can also be monitored for their effect on smoothness Additionally joint spacing can be varied somewhat from a standard spacing of 46-m (15 ft) to as short as 36 m (12 ft) and as much as 52 m (17 ft) for each of the three mixtures proposed for the project
State Monitoring Activities
No information is currently available regarding the State monitoring efforts
Preliminary ResultsFindings
Preliminary results are not available at this time
Point of Contact
Lon Ingram Chief of Materials and Research Kansas Department of Transportation Bureau of Materials and Research 2300 Van Buren Topeka KS 66611-1195 (785) 296-2231
References
None
67
95
Maryland 1US 50
Salisbury Bypass
Chapter 19 MARYLAND 1 (US 50 Salisbury Bypass)
Introduction
Marylandrsquos TE-30 project was constructed in 2001 It is located on the Salisbury Bypass on US 50 in the southeastern part of the State (see Figure 49) The project is being undertaken jointly by the Maryland State Highway Administration (MSHA) the University of Maryland and the FHWA
50
Annapolis
Salisbury
95
5050
Maryland 1 US 50
Salisbury Bypass
Annapolis
Salisbury
Figure 49 Location of MD 1 project
Study Objectives
This project is designed to research the benefits of using fiber-reinforced concrete (FRC) and low-shrinkage concrete in Maryland paving operations (Goulias and Schwartz 1999) The researchers beshylieve that the use of these materials may lead to inshycreases in flexural fatigue resistance and reductions in crack development and slab warping effects (Goulias and Schwartz 1999) The objectives of the study will be completed in three phases
bull Phase ImdashLaboratory examination of the design and performance of fiber-reinforced concrete and low-shrinkage concrete for Maryland conditions
bull Phase IImdashActual construction of the test sections
bull Phase IIImdashShort- and long-term monitorshying of the test sections and quantification of benefits for possible incorporation into PCC pavement design
Project Design and Layout
Laboratory tests were conducted to evaluate the properties of fiber-reinforced and low-shrinkage concrete mixtures Marylandrsquos standard concrete mixture for highway pavements MD Mix 7 was used as the control mixture The low shrinkage mixshytures were developed by using the MD 375 aggreshygate in place of the MD 57 aggregate or by modishyfying the wc ratio The fiber-reinforced mixtures used the mix design of the control mixture by addshying different fiber contents (01 02 03 and 04 percent) Seven mixtures were evaluated and their characteristics are summarized in Table 23 (Goulias and Schwartz 2003) The characteristics of the fiber used in this study are shown in Table 24 (Goulias and Schwartz 2003) The mixture properties evalushyated in the lab included compressive strength unreshystrained shrinkage of hardened concrete restrained shrinkage of plastic concrete flexural strength and toughness fatigue endurance elastic modulus temshyperature slump and air content
Three different concrete pavement test sections were constructed by MSHA in 2001 (Goulias and Schwartz 2003)
bull Control section using MD Mix 7
bull Fiber-reinforced concrete section containing 01 percent polypropylene fiber
bull Low-shrinkage concrete section using MD 375 aggregate
The pavement sections were extensively instrushymented to provide feedback on the structural reshysponses of the different designs
68
Table 23 Mixture Properties of Concrete Used on MD 1
COMPONENT MIX A MIX B MIX C MIX D MIX E MIX F MIX G
Aggregate type 57 57 57 57 57 375 LS 57 LS
wc ratio 044 044 044 044 044 044 040
Air content () 66 46 66 70 58 50 60
Slump (insec) 15 1517 112515 121 062529 1 15
Fiber content 00 01 02 03 04 00 00
Air entrainment 17 oz 19 oz 19 oz 19 oz 19 oz 20 oz 20 oz 100 lbs 100 lbs 100 lbs 100 lbs 100 lbs 100 lbs 100 lbs
Water reducer (M)5 oz (M)5 oz (M)5 oz (M)55 oz (M)6 oz (M)55 oz (H)27 oz 100 lbs 100 lbs 100 lbs 100 lbs 100 lbs 100 lbs 100 lbs
Note (M) = middle range water reducing admixture (H) = high range water reducing admixture LS = low shrinkage Target air content 65
Table 24 Fiber Characteristics for MD 2
ELASTIC LENGTH DIAMETER ASPECT RATIO YIELD STRENGTH MODULUS SPECIFIC
FIBER MM (IN) MM (IN) (LD) MPA (KSI) MPA (KSI) GRAVITY
Polypropylene (Fibrillated)
19 (075)
NA NA 550ndash750 (80ndash110)
3450 (500)
091
State Monitoring Activities
A variety of information has been collected on the three experimental sections (Goulias and Schwartz 2003) Two MSHA trucks (with 18 kip and 32 kip axles) were used for field load testing Condition surveysprofile measurements were conducted using a dipstick device Nondestructive testing was also conducted using an ultrasound device
Interim ResultsFindings
Analyses were carried out utilizing both the lab reshysults and field instrumentation data to evaluate the response and behavior of the control fiber reinshyforced and low shrinkage concrete pavement secshytions and mixtures The following conclusions have been reached (Goulias and Schwartz 2003)
bull The lab results indicated that fibers reduce the workability of concrete However the
use of admixtures permits acceptable levels of workability
bull The flexural strength of concrete for fiber contents gt 01 percent was higher than that of the control concrete mixture The toughshyness of concrete increased with increasing fiber content
bull Shrinkage testing indicated that there were small differences in unrestrained shrinkage for the control and the two low shrinkage mixtures However fiber-reinforced conshycrete mixtures exhibited higher levels of shrinkage
bull The fatigue analysis indicated that the addishytion of polypropylene fibers resulted in higher fatigue strengths The fatigue strength of FRC increased with decreasing fiber content until 03 percent The endurshyance limit expressed as a percentage of the
69
modulus of rupture of the mixture showed an increase with decreasing fiber content until 03 percent Overall the best fatigue performance was obtained for mixes conshytaining 01 percent fiber
bull The field data indicated that overall the secshytions with the 01 percent fiber-reinforced concrete mixture had lower deflections than the control mix and the low shrinkage mixshyture Analytical evaluations indicated that the best estimates of the modulus of sub-grade reaction (k) and elastic modulus of concrete (Ec) are k of 350 lbfin2in and 5000000 lbfin2 respectively
Points of Contact
Dimitrios Goulias University of Maryland Department of Civil and Environmental Engineering 0147A Engineering Lab Building College Park MD 20742 (301) 405-2624
Charles Schwartz University of Maryland Department of Civil and Environmental Engineering College Park MD 20742-0001 (301) 405-1962
References
Goulias D and C Schwartz 1999 High Perform-ance Portland Cement Concrete Pavement Project Work Plan University of Maryland Department of Civil and Environmental Engineering College Park
mdashmdashmdash 2003 High Performance Portland Cement Concrete Pavement Final Research Report Unishyversity of Maryland Department of Civil and Envishyronmental Engineering College Park
70
75
96
75
75
96
75
Chapter 20 MICHIGAN 1 (I-75 Detroit)
Introduction
The Michigan 1 project is located on I-75 (Chrysler Freeway) in downtown Detroit (see Figure 50) Built in 1993 this project came about as a result of an FHWA-sponsored tour of European concrete pavement design and construction practices in 1992 During that tour and a followup tour one mashyjor observation of European concrete design and construction practices was the emphasis placed on the quality of the design materials and construcshytion of the pavement with less concern for higher costs or longer construction periods (FHWA 1992 Larson Vanikar and Forster 1993) The tours genshyerated substantial interest in constructing a ldquoEuroshypean-typerdquo concrete pavement to evaluate its conshystructibility and performance compared to conventional US designs This interest led to the selection of the 16-km (1-mi) test section on I-75 in Detroit (see Figure 50)
The MI 1 project is not a TE-30 project per se but gave rise to the TE-30 program After construction of the project in 1993 interest in constructing simishylar ldquohigh-performancerdquo concrete pavements reshymained high and in 1994 FHWA and industry agreed to pursue this effort and launched the TE-30 program
LansingDetroit
Michigan 1I-75 Detroit
75
Lansing Detroit
Michigan 1 I-75 Detroit
96
75
Figure 50 Location of MI 1 project
71
Study Objectives
The objective of this project is to determine whether innovative features of typical rigid pavement deshysigns used in European countries can be applied cost effectively to conventional design and conshystruction methods used for rigid pavements in the United States (Smiley 1995) The European paveshyment was constructed for the purpose of comparing the European design with conventional designs to demonstrate the applicability of certain European concepts to US highway construction (Weinfurter Smiley and Till 1994)
Project Design and Layout
This project is located in the northbound lanes of Ishy75 and consists of two sections a ldquocontrolrdquo section representing the Michigan Department of Transporshytationrsquos (MDOTrsquos) then-current standard concrete pavement design and the European concrete paveshyment section incorporating several innovative deshysign features (Weinfurter Smiley and Till 1994) The layout of these sections is shown in Figure 51 which also lists some of the key design features of each section
The existing roadbed for the project lies within an approximate 76-m (25-ft) cut section (Weinfurter Smiley and Till 1994) The subgrade is predomishynately a silty clay material which was required to be compacted to 95 percent of its maximum unit weight in accordance with Michiganrsquos One-Point Tshy99 (Proctor) Test (Weinfurter Smiley and Till 1994)
These sections on I-75 contain three to four traffic lanes in each direction In 1993 this portion of I-75 carried about 111000 vehicles per day including 11 percent heavy trucks (Smiley 1995)
Construction of the sections began in July 1993 and was opened to traffic in November of that same year (Smiley 1995) During the 1994 construction season southbound I-75 traffic was detoured onto northbound I-75 while it was reconstructed The entire I-75 reconstruction project was completed in October 1994
13 mi 10 mi
SSeectictioonn 11mdashmdashMichiMichigganan SSttandandaardrd PPaavveemmeentnt SSeeccttiion 2on 2mdashmdashEEuurroopepeaann PPaavveemmeenntt 1111--iin Jn JRRCCPP 1010--iinn JJPPCCPP ((ttwo-wo-lliifftt coconsnsttrrucucttiionon))
4141--fftt TTrrananssvvererssee JJooiinntt SpaSpaccinging 1515--fftt TTrraannsvsverersese JJooiinntt SpSpacaciningg 112255--iinn DDoowelwelss ((ssttaandndarard sd sppacaciinngg)) 112525--iinn DDoowelwelss ((vvarariiaabblly sy sppaacceedd))
4-4-iinn CCeemmeenntt--TTrreeaatteded OOppenen-G-Grraaddeedd DDrraiainanagege CCoourursese ((OOGGDDCC)) 6-6-iinn LeLeanan CCooncncrreettee BaBassee 1122--iinn SaSandnd SuSubbabbassee 1616--iinn AgAggrgregegatatee SuSubbbbasasee TTiieedd PCPCCC ShShououldlderer WWiidedenened Oud Outtssiidde Se Sllaabb
TTiieded PCPCCC ShShououlldderer
13 mi 10 mi
I-75I-75 NBNBWI-375I-375 Waarren Avenuerren Avenue PiPicqucqueette Avtte Avenueenue
Figure 51 Layout of MI 1 project
Section 1mdashMichigan Standard Pavement The Michigan standard section is 21-km (13-mi) long and is located south of the European section The cross section for the Michigan standard secshytion is shown in Figure 52 (Smiley 1995) This is a 279-mm (11-in) JRCP design with transverse joints spaced at 125-m (41-ft) intervals (Weinshyfurter Smiley and Till 1994)
The PCC mix used a higher quality coarse aggreshygate than standard so that the performance could be compared to the European section A 100-mm (4-in) permeable cement-treated base is located beneath the slab The aggregates for the open-graded base were obtained by crushing the existshying I-75 pavement and were stabilized with 6 pershycent cement (Weinfurter Smiley and Till 1994) A geotextile separator is located beneath the open-graded base and above the underlying 305shymm (12-in) sand subbase (Weinfurter Smiley and Till 1994) Longitudinal collector drains (152 mm [6 in] diameter) are located beneath both the inside and outside reinforced concrete shoulders All traffic lanes in this section are 37 m (12 ft) wide
Section 2mdashEuropean Pavement The European pavement section is 16 km (1 mi) long and is located north of the Michigan stanshydard section It consists of a 254-mm (10-in) JPCP that was placed in two lifts (see Figure 53 for the pavement cross section) The layers were placed ldquowet-on-wetrdquo to ensure bonding between the top 64-mm (25-in) concrete layer and the bottom 190-mm (75-in) concrete layer The same sources for cement and aggregate were used in the top and bottom layers except that the course aggregate for the top layer was specified to be a 100 percent crushed basalt rock to provide resistance to polishing (Weinfurter Smiley and Till 1994) Conventional paving equipment was used for the placement of the two layers
The two-layer JPCP was constructed directly on a 152-mm (6-in) lean concrete base (LCB) without the use of a bonding agent Plane-of-weakness joints were sawed in the LCB at transverse and longitudinal locations to match those of the overshylying JPCP slab and thereby prevent reflection cracking (Weinfurter Smiley and Till 1994) The joints were sawed to a depth of 61 mm (24 in) A comparison of the specified concrete properties of the LCB the top layer PCC slab the bottom layer PCC slab and the Michigan standard paveshyment is provided in Table 25 (Weinfurter Smiley and Till 1994)
72
73
Figure 52 Cross section for Michigan standard pavement (Smiley 1995)
74
Figure 53 Cross section for European pavement (Smiley 1995)
Table 25 Comparison of Specified Concrete Properties on MI 1 Project (Weinfurter Smiley and Till 1994)
PORTLAND CEMENT CONCRETE PROPERTY
EUROPEAN PAVEMENT MICHIGAN
STANDARD PAVEMENT TOP LAYER BOTTOM LAYER LCB
28-day compressive strength lbfin2 5500 5000 2500 3500
28-day flexural strength lbfin2 mdash mdash mdash 650
Maximum wc (by weight) 040 042 070 050
Minimum cement content lbyd3 752 588 420 550
Maximum slump in 3 3 3 3
Air content 65 + 15 65 + 15 65 + 15 65 + 15
LCB = lean concrete base
An exposed aggregate surface was specified for the top layer of concrete This exposed aggregate surshyface provides surface texture and is expected to reshyduce noise levels The exposed aggregate surface was produced through a patented process developed by Robuco Ltd of Belgium consisting of the folshylowing steps (Weinfurter Smiley and Till 1994)
bull Evenly spraying the surface with a set reshytarder within 30 minutes of the finishing operation
bull Covering the concrete surface with plastic waterproof sheeting (for a period of apshyproximately 20 hours)
bull Removing the sheeting and brushing the surface with a brushing machine
bull Placing a curing compound on the newly exposed aggregate surface
Joint sawing operations were made through the proshytective sheeting prior to the brushing operation
A 406-mm (16-in) thick nonfrost-susceptible agshygregate subbase was placed directly on the sub-grade and longitudinal edge drains were installed beneath both the inside and outside PCC shoulders (Weinfurter Smiley and Till 1994) The outer lane consisted of a 41-m (135-ft) wide outer slab to reduce critical edge loading encroachments
Transverse contraction joints were spaced at 46-m (15-ft) intervals and were designed to match those joints in the underlying LCB Polyethylene-coated dowel bars 32 mm (125 in) in diameter and 508 mm (20 in) long were placed on chairs at the mid-depth of the composite slab and at the variable spacings shown in Figure 54 (Weinfurter Smiley and Till 1994)
The longitudinal and transverse joints were sealed with an ethylene propylene diene terpolymer (EPDM) seal (Weinfurter Smiley and Till 1994) Similar to conventional neoprene compression seals these seals are placed without a lubrishycantadhesive and require only a clean (but not dry) joint prior to installation (Weinfurter Smiley and Till 1994)
State Monitoring Activities
MDOT has been monitoring the performance of both sections since 1993 Performance data colshylected include surface distress ride quality surface friction and tire noise levels (Weinfurter Smiley and Till 1994) Seasonal pavement deflection measurements are also taken periodically to identify any structural inadequacies that may develop in eishyther pavement section (Weinfurter Smiley and Till 1994) Although limited performance monitoring continues no formal reports have been prepared since 2000
75
LONGITUDINAL JOINTEUROPEAN PAVEMENT
LONGITUDINAL JOINTSYMBOL B
DOWEL BAR
LONGITUDINAL JOINTSYMBOL B
TRANSVERSE CONTRACTION JOINTEUROPEAN PAVEMENT
070
rsquo
075
rsquo0
75rsquo
075
rsquo
080
rsquo
080
rsquo
080
rsquo
080
rsquo
080
rsquo
080
rsquo
080
rsquo
075
rsquo0
75rsquo
080
rsquo
090
rsquo
LONGITUDINAL JOINT SYMBOL B
DOWEL BAR
LONGITUDINAL JOINT SYMBOL B
TRANSVERSE CONTRACTION JOINT EUROPEAN PAVEMENT
LONGITUDINAL JOINT EUROPEAN PAVEMENT
070
rsquo
075
rsquo0
75rsquo
075
rsquo
080
rsquo
080
rsquo
080
rsquo
080
rsquo
080
rsquo
080
rsquo
080
rsquo
075
rsquo0
75rsquo
080
rsquo
090
rsquo
080
rsquo
090
rsquo
3 x3 x 08rsquo08rsquo 3 x3 x 08rsquo08rsquo3 x3 x 16rsquo16rsquo 7 x7 x 16rsquo16rsquo 4 x4 x 08rsquo08rsquo 3 x3 x 16rsquo16rsquo 4 x4 x 08rsquo08rsquo 3 x3 x 16rsquo16rsquo 44 xx 08rsquo08rsquo 3 x3 x 1616rsquorsquo 3 x3 x 008rsquo8rsquo 3 x3 x3 x 16rsquo16rsquo16rsquo
12rsquo12rsquo135rsquo135rsquo 12rsquo12rsquo 135rsquo135rsquo625rsquo625rsquo 650rsquo650rsquo LANLANEELANLANEE LANLANEE LANLANEESHSHOULDOULDERER SHSHOULDOULDERER
DODOWWEELL BBAARR SPSPAACCIINNGG
ALALL BL BAARRSS SSHHAALLLL BEBE 11 frac14frac14rdquordquo DDIIAA 2 200rdquordquo LLOONNGG AANNDD TTYYPEPE A CA COOAATTEDED INSINSTTALALLELED AD ATT HALHALFF DEDEPPTTHH (5rdquo)(5rdquo)
Figure 54 Variable dowel spacings used on European pavement section (Weinfurter Smiley and Till 1994)
ResultsFindings
Initial Construction Findings The construction of the European pavement section was accomplished without any major difficulties Slower production rates were noted much of which is attributed to an unfamiliarity with two-layer conshystruction and exposed aggregate surfaces (Weinshyfurter Smiley and Till 1994) Among some of the specific recommendations for similar future proshyjects include (Weinfurter Smiley and Till 1994)
bull The saw cut depth for longitudinal joints in a two-layer pavement is recommended to be between 40 and 45 percent of the total pavement thickness The saw cut depth for transverse joints is recommended to be beshytween 25 to 30 percent of the total paveshyment thickness
bull The variable spacing of dowel bars in a basket assembly should be arranged such that the spacing between bars actually represents a standard ldquouniformrdquo spacing but with selected bars missing This will save on the costs associated with the fabrication of special dowel bar baskets
bull The top layer of the two-layer pavement should be designed no less than 70 mm (275 in) thick in order to reduce the chance for poor consolidation and a thin surface layer to occur
bull The concrete mixture for the top layer should be revised to eliminate sand partishycles larger than 1 mm (004 in) These coarser particles prevent the coarse aggreshygate in the mixture from ldquolockingrdquo together which is needed in order to reduce noise
bull The environmental ramifications of the dust and slurry generated from the surface brushing operations must be clarified in the design stage There was excessive dust generated during the brushing operation but fortunately the location was not near a resishydential area Disposal of the slurry must meet all local regulations
bull Repair methods need to be developed for exposed aggregate surfaces when the texshyture depth is determined to be out of the specified range
76
One-Year Performance Findings In the first year after the construction of the pavement sections distress surveys skid testing and noise studies were conducted Results of those monitoring activities are given below (Smiley 1995)
bull The first performance evaluation of the project was conducted in October 1994 just prior to the I-75 freeway being opened to normal traffic operations (the southbound lanes had been re-routed on the northbound lanes) Observations from that initial survey include
ndash On the European pavement section only one transverse crack was identishyfied A core retrieved over the crack indicated significant honeycombing It was later determined in conversashytions with the construction project staff that the crack was likely a cold joint between old concrete and a botched attempt to patch fresh conshycrete that had been damaged by conshytractor paving equipment
ndash Occasional surface popouts were noted throughout the European paveshyment section These diameter of these popouts was normally between 25 and 50 mm (1 and 2 in)
ndash The EPDM joint seals on the Euroshypean pavement section appeared to be in very good condition although there was occasional evidence of ldquocamelshyback humpingrdquo on some of the transshyverse joints
ndash The exposed aggregate surface of the European pavement section appeared to have lost macro-texture in the two inner lanes where traffic was during most of 1994 when the southbound lanes were being reconstructed
ndash On the Michigan standard pavement section approximately 50 percent of the 125-m (41-ft) long panels conshytained transverse cracks typical of
JRCP designs The cracks were tight and typically irregular in direction
bull Surface friction was measured on both secshytions in accordance with ASTM E-274 Tests were conducted in November 1993 and again in April 1994 Over that time the overall avshyerage friction number for the European pavement section increased from 38 to 42 while the overall average friction number for the Michigan standard pavement section inshycreased from 46 to 53
bull A traffic noise study was conducted in June 1994 on both the European pavement section and the Michigan standard pavement section Both interior and exterior noise levels were recorded The results from the study indicate that the exposed aggregate surface did not produce the expected reduction in noise levshyels that are perceptible to persons residing adjacent to the project or when traveling by car One possible reason for this is that the exshyposed aggregate surface had too much macro-texture from the excessive spacing of the coarse aggregate particles
Five-Year Performance Findings A 5-year analysis of the performance of the two test sections was just recently completed (Buch Lyles and Becker 2000) This analysis included an evaluashytion of traffic pavement distress roughness surface friction and deflection data obtained on the sections from 1993 to 1998 An economic analysis of each section was also conducted Summaries of these analyses are provided in the following sections
Traffic Pavement performance is typically assessed in terms of how well the pavement stands up to traffic loadshying which is generally expressed in terms of 80-kN (18-kip) equivalent single-axle load (ESAL) applicashytions However because of variable commercial trafshyfic levels and questionable vehicle classification data the 5-year evaluation used total traffic volume as the basis for performance comparisons (Buch Lyles and Becker 2000) The cumulative total traffic volume (traffic in all lanes in one direction) for these sections is shown in Figure 55 (Buch Lyles and Becker 2000)
77
Cum
ulati
ve T
ota
l T
raff
ic V
olu
me
millions
of
vehic
les
120
100
80
60
40
20
0
Euro M ich Std
1992 1993 1994 1995 1996 1997 1998 1999 Y e a r
C u m u la t iv e T o t a l T r a f f ic V o lu m e m i l l io n s o f
v e h ic le s
EuroM ich Std
Cumulative Total Traffic Volume millions of vehicles
C u m u la t iv e T o t a l T r a f f ic V o lu m e m i l l io n s o f
v e h ic le s
111993993993 199419941994 199519951995 120120
100100
8080
111996996996 199719971997
IR
IRI
I
iinnmm
ii
6060
4040
2020
00
Euro M ich Std
00 2200 4400 6600 8800 110000 Cumulative Total Traffic Volume millions of
vehicles
Figure 55 Cumulative total traffic volumes for MI 1 test sections (Buch Lyles and Becker 2000)
Pavement Distress Pavement distress surveys are conducted regularly on Michiganrsquos highways as part of MDOTrsquos paveshyment management activities The condition of a pavement is reported in terms of a distress index (DI) which is computed based on the type extent and severity of distress Data from 1995 and 1997 showed a DI of 0 for the European pavement secshytion indicating a distress-free pavement well below the rehabilitation trigger value of 50 (Buch Lyles and Becker 2000) The 1995 and 1997 DI values for the Michigan standard pavement section are 1 for both years also suggestive of a pavement in very good condition (Buch Lyles and Becker 2000)
Roughness MDOT has monitored the roughness of these pavement sections using an inertial profiler International Roughness Index (IRI) values computed from the measured profiles are shown in Figure 56 as a function of total traffic (Buch Lyles and Becker 2000) The European pavement is noted to be slightly rougher than the Michigan standard pavement but overall the smoothness levels have remained fairly constant It should be noted that IRI values less than 13 mkm (80 inmi) are considered to be smooth (Buch Lyles and Becker 2000)
Figure 56 Computed IRI values for MI 1 test sections (Buch Lyles and Becker 2000)
78
TEST PROPERTY TEST LOCATION
EUROPEAN PAVEMENT MICHIGAN STANDARD PAVEMENT
NOVEMBER 1993
APRIL 1995
NOVEMBER 1993
APRIL 1995
Outside lane 130 mils 141 mils 199 mils 205 mils
Average maximum mid- Lane left of outside lane 137 mils 132 mils 213 mils 207 mils slab deflection
Inside lane 127 mils 133 mils 228 mils 207 mils
Average transverse joint
Outside lane 77 59 68 70
load transfer efficiency Lane left of outside lane 79 62 72 70
Deflection Analysis Surface Friction Deflection testing on the test sections has been pershyformed twice once in November 1993 and once in April 1995 (Buch Lyles and Becker 2000) The 1993 measurements were taken during daylight hours prior to the pavement being opened to traffic the 1995 measurements were taken at night because of lane closure restrictions (Buch Lyles and Becker 2000) An FWD using a 4000-kg (9000-lb) load was used to conduct the testing
Table 26 summarizes the results of the FWD testshying It is observed that the magnitude of the maxishymum mid-slab deflections are less for the European pavement than for the Michigan standard paveshyment which is not surprising given the strong base and thick subbase located beneath the European pavement slab However it is surprising that the load transfer efficiencies for both sections are as low as they are for such new pavements and that the most recent LTEs for the European pavement are less than the Michigan standard pavement One possible reason for this is the wet weather condishytions that had preceded the April 1995 testing which may have contributed to warping of the slabs (Buch Lyles and Becker 2000)
Friction numbers measured for these test sections are shown in Figure 57 (Buch Lyles and Becker 2000) The friction numbers for the Michigan stanshydard pavement section are higher than those of the European pavement section which is somewhat unexpected because of the exposed aggregate surshyface Both sections show an initial increase in fricshytion number which is most likely due to the wearshying off of the curing compound (Buch Lyles and Becker 2000)
Economic Analysis of Pavement Sections It was expected that the European pavement section would cost more to construct than the Michigan standard pavement but the result would be a longer-lasting concrete pavement A cost analysis showed that the European pavement cost about 234 percent more to construct than the Michigan stanshydard pavement (Buch Lyles and Becker 2000) However it should be noted that the European pavement was a demonstration project that was constructed as part of an ldquoopen-houserdquo conference so the costs are not representative of a conventional paving project
Table 26 Summary of Deflection Testing Results for MI 1 Sections (Buch Lyles and Becker 2000)
79
C u m u la t iv e T o t a l T r a f f ic V o lu m e m i l l io n s o f
v e h ic le s
EuroM ich Std
Cumulative Total Traffic Volume millions of vehicles
C u m u la t iv e T o t a l T r a f f ic V o lu m e m i l l io n s o f
v e h ic le s
EuroM ich Std
C u m u la t iv e T o t a l T r a f f ic V o lu m e m i l l io n s o f
v e h ic le s
1993199319931993 1991991991994444 1111999999995555 606060
505050
404040
303030
202020
101010
000
Cumulative Total Traffic Volume millions of vehicles
Fr
Fr
Friii
ccctttiii
ooonnn NNN
uuummm
bbbeeerrr
Euro M ich Std
000 111000 222000 333000 444000
Figure 57 Computed friction numbers for MI 1 test sections (Buch Lyles and Becker 2000)
An economic analysis was conducted to compare the life-cycle costs (LCC) of the European and Michigan standard pavements This required sevshyeral assumptions regarding future performance future maintenance cycles and future rehabilitation schedules Based on the analysis it was determined that the European pavement is not competitive with the Michigan standard pavement However the calculations are theoretical in the sense that the proshyjected time to maintenance and rehabilitation activities are based on MDOT estimates (Buch Lyles and Becker 2000) In addition the construcshytion costs of the European pavement may not be representative since it was a demonstration project Nevertheless the extrapolated data suggest that in order for the European pavement to be competitive it can cost no more than approximately 17 percent more than the Michigan standard pavement (Buch Lyles and Becker 2000)
Point of Contact
Tom Hines Michigan Department of Transportation 8885 Ricks Road PO Box 30049 Lansing MI 48909 (517) 322-5711
References
Buch N R Lyles and L Becker 2000 Cost Effec-tiveness of European Demonstration Project I-75 Detroit Report No RC-1381 Michigan Department of Transportation Lansing
Federal Highway Administration (FHWA) 1992 Report on the 1992 US Tour of European Con-crete Highways FHWA-SA-93-012 Federal Highway Administration Washington DC
Larson R M S Vanikar and S Forster 1993 US Tour of European Concrete Highways (US TECH) Follow-Up Tour of Germany and Aus-triamdashSummary Report FHWA-SA-93-080 Fedshyeral Highway Administration Washington DC
Smiley D L 1995 First Year Performance of the European Concrete Pavement on Northbound I-75mdashDetroit Michigan Research Report R-1338 Michigan Department of Transportation Lansing
Weinfurter J A D L Smiley and R D Till 1994 Construction of European Concrete Pave-ment on Northbound I-75mdashDetroit Michigan Reshysearch Report R-1333 Michigan Department of Transportation Lansing
80
94
90
35
Minnesota 1I-35W Richfield
94
90
35
Chapter 21 MINNESOTA 1 (I-35W Richfield)
Introduction
The Minnesota Department of Transportation (MnDOT) is reconstructing a portion of I-35W in the Minneapolis-St Paul area (see Figure 58) using high-performance concrete pavement concepts Loshycated between I-494 and Highway 62 in Richfield (a suburb of Minneapolis) this project is being parshytially funded under the TE-30 program and is being designed for a 60-year service life (Rettner 1999)
St Paul
Richfield
94
90
35
St Paul
Minnesota 1 I-35W Richfield
Richfield
Figure 58 Location of MN 1 project
Study Objectives
The benefits associated with a pavement that lasts for 60 years include reduced maintenance and user costs (Rettner 1999) However such a pavement is also expected to have a higher initial cost This proshyject has the following objectives (Rettner 1999)
bull Evaluate the costbenefit of designing a pavement to last 60+ years with zero mainshytenance in a very high traffic volume envishyronment
bull Evaluate the performance benefits of using a high performance concrete in an urban paving environment The specific mix will be designed to have high durability using a number of design features including
ndash Low permeability ndash High air content ndash Well-graded aggregate ndash High-quality aggregate ndash Ground granulated blast furnace slag
(GGBFS)
bull Evaluate the durability of dowel bars clad in stainless steel compared to solid stainless steel dowel bars and assess their ability to perform satisfactorily for 60+ years
bull Evaluate the long-term performance of epshyoxy-coated dowel bars compared to stainless steel dowel bars
bull Evaluate the relative performance of 38shymm (15-in) and 44-mm (175-in) diameshyter dowel bars
Project Design and Layout
The nominal pavement design for this project is a 340-mm (134-in) thick JPCP with 46-m (15-ft) transverse joints The slab thickness was developed based on a design traffic of 100 million ESAL apshyplications over the 60-year design period Tied conshycrete shoulders 315-mm (124-in) thick will be included with the expectation that they will carry traffic during construction or during future rehabilishytation activities (Rettner 1999)
The existing sand base course beneath the original pavement is several feet thick and will be left in place for the new PCC pavement It will be capped with 305 mm (12 in) of select granular material which in turn will be topped with a 100-mm (4-in) thick Class 5 dense-graded granular base to provide a paving platform for the new PCC pavement No open-graded base or edge drains are being included in the design
At least five different test sections were originally planned to be constructed as part of this project (Rettner 1999)
bull Section 1mdashJPCP containing a high-performance concrete mixture and 38-mm
81
(15-in) by 457-mm (18-in) stainless steel dowel bars This design will be constructed for 35 joints over five lanes (three driving two shoulders) for a total length of 161 m (525 ft)
bull Section 2mdashJPCP containing a high-performance concrete mixture and 44-mm (175-in) by 457-mm (18-in) stainless steel clad dowel bars This design will be conshystructed for 35 joints over five lanes for a total length of 161 m (525 ft)
bull Section 3mdashJPCP containing a high-performance concrete mixture and 38-mm (15-in) by 457-mm (18-in) stainless steel clad dowel bars This design will be conshystructed over the rest of the mainline paveshyment project (approximately 2500 m [8200 ft])
bull Section 4mdashJPCP containing a high-performance concrete mixture and 38-mm (15-in) by 457-mm (18-in) stainless steel clad dowel bars This will be constructed on all ramps except the bottom of the northshywest exit ramp to CSAH 53 These ramps will be constructed to the same thickness (340-mm [124-in]) as the mainline paveshyment
bull Section 5mdashJPCP containing a high-performance concrete mixture and 38-mm (15-in) by 457-mm (18-in) epoxy-coated dowel bars This will be constructed only at the bottom of the northwest exit ramp to CSAH 53 This ramp will be constructed to
the same thickness (340-mm [124-in]) as the mainline pavement
Table 27 displays the experimental design matrix for this project The section with epoxy-coated dowel bars is located on a ramp because of the deshysire for the entire length of the mainline pavement to last the 60-year design period without traffic disshyruptions that may be required for epoxy-coated dowel bars (Rettner 1999) Indications in Minnesota are that epoxy-coated bars may not last beyond 25 years without significant corrosion (Rettner 1999) In addition a project being constructed immediately north of the current project includes epoxy-coated dowel bars and will also serve as a control section for this variable (Rettner 1999)
The high-performance concrete mix was used throughout the entire project for durability and lonshygevity The aggregate quality specifications were tightened so that only the most durable aggregate sources were eligible including a stipulation limitshying the amount of limestone to no more than 20 percent (Rettner 1999) In addition a well-graded coarse aggregate was used for improved workability without the use of excessive amounts of water reshyducer Other notable features of the concrete mix design include a higher specified air content (6 to 8 percent entrained) for increased freeze-thaw protecshytion the inclusion of ground granulated blast furshynace slag for reduced permeability a 28-day rapid chloride permeability of 2500 coulombs (which according to ASTM C 1202 is a moderate level of permeability) and a water-to-cementitious-material ratio less than 040 (Rettner 1999)
Table 27 Experimental Design Matrix for MN 1 Project
DIAMETER (IN) MAINLINE
PAVEMENT RAMP
PAVEMENT
Stainless Steel Clad Dowel Bar 15 Section 3 Section 4
175 Section 2
Solid Stainless Steel Dowel Bar 15 Section 1
175
Epoxy-Coated Steel Dowel Bar 15 Section 5
175
82
These sections were constructed during the summer of 2000 However there was considerable difficulty in obtaining the required number of stainless steel clad dowel bars from the manufacturer and conseshyquently several modifications to the original exshyperimental design were made during construction Most of the northbound and all of the southbound lanes were constructed with solid stainless steel dowel bars and only a portion of the northbound lanes received stainless steel clad dowel bars Furshythermore the outside shoulders were constructed with plastic-coated bars and it appears as if the exit ramp that was to receive epoxy-coated bars will be also be constructed using plastic-coated bars Fishynally the inside shoulders will not be paved until the 2001 construction season
State Monitoring Activities
MnDOT will monitor the performance of these pavement sections for a minimum of 5 years Pavement distress surveys and ride quality measshyurements will be conducted every other year using standard MnDOT procedures (Rettner 1999) Load transfer efficiency will be measured on the outside lane using the MnDOT FWD on an every other year basis if traffic allows (Rettner 1999)
Preliminary ResultsFindings
Some findings on the use of high performance conshycrete specifications and high performance materials in Minnesota were presented a the 2003 Annual TRB meeting The following sections summarize some of the findings (Turgeon 2003 Rangaraju 2003)
Cement Paste Specification The contractor elected to provide a mix containing 229 kgm3 (384 lbsyd3) cement and 123 kgm3 (206 lbyd3) GGBFS This met all mix requirements inshycluding the RCP test Typically contractors elect to use the 25 percent fly ash mixes under the standard specification Fly ash is approximately half the cost of cement or GGBFS The introduction of GGBFS to the paving process registered some complaints of a ldquostickyrdquo mix from the finishers
The mix was produced concurrently from two batch plants located at the same site using the same mix design This further aggravated the variability in the plastic air contents which ranged from below 5
percent to over 10 percent Upon completion of the project price reductions were assessed for failing plastic air contents Most price reductions related to tests results of around 60 percent but some tests were as low as 40 percent
The hardened air contents as determined using ASTM C457 were determined for the top middle and bottom third of each sample Results ranged from 67 percent to 157 percent with an average value of 106 percent Sixteen of the 26 hardened air contents were above the maximum allowable of 100 percent Only one was below the range minishymum of 70 percent The cores were taken at ranshydom therefore they do not coincide with any of the plastic air tests taken Even so these results do not correspond well with the plastic air contents disshycussed previously Further analysis of the linear traverse results showed the prevalence of small voids with diameters less than 100 microns Few air voids are present in the 150 micron to 250 micron range It has been theorized that the volumetric air meters used to determine plastic air contents are not efficient when measuring small bubbles which could account for the test result differences Small bubbles may be more susceptible to filling with secondary reaction by-products thus undermining the long-term void structure effectiveness The ratio of entrapped to entrained air was determined to be acceptable however this determination was not available until a few months after paving was comshyplete
Aggregate Specification The coarse aggregate supplied consisted of a low carbonate class C gravel This material qualified for the full aggregate quality bonus The contractor added ldquoSafety Gritrdquo No 8 sieve to 95-mm (0375shyin) sand to the typical coarse rock and sand mixshyture to meet the denser gradation requirements
Pavement Thickness The pavement was specified and constructed at a thickness of 340 mm (135 in) The ability to finish the surface avoiding edge slump deformation and meeting the low wc ratio were competing considshyerations that required the contractorrsquos constant atshytention The additional thickness added to the comshyplexity of these issues
83
Load Transfer The first paving was scheduled for fall 1999 but proshyject conflicts delayed it until spring 2000 At that time approximately 75 percent of the required quanshytity of stainless clad bars was available for installashytion To keep the project on schedule plastic-coated dowel bars of the same dimension were substituted and used in the shoulder The opposing direction of traffic was paved in summer 2000 but sufficient stainless steel clad bars were not available Conseshyquently the majority of this work used solid stainless dowel bars at a significant increase in cost
Cost Placement costs are primarily a factor of the comshyplexity of the project and the pavement thickness Projects that include long uninterrupted stretches of pavement are less costly to place since less time is spent mobilizing equipment and setting up For thicker pavements the larger volume of concrete needed to produce an equivalent area of concrete slows production which leads to higher placement costs Edge slump is also a more prevalent problem with thicker pavements The placement bid price for the 340-mm (135-in) pilot HPC project was $755m2 ($631yd2) Four projects let the same year with pavement thickness ranging from 254 mm to 267 mm (100 to 105 in) had an average placeshyment cost of $685m2 ($572yd2) The cost differshyence seems to be primarily due to thickness
The two factors that greatly influence the structural concrete unit price are the project quantity and the ability of paving contractors to produce the material from their own mobile batch plants Small quantity projects or projects without space to set up a portshyable batch plant require the paving contractor to purchase concrete from a local ready-mix supplier at a higher cost Due to the confined location the paving contractor purchased the 22841 m3 (30054 yd3) of concrete from a ready-mix supplier at a unit price of $9740m3 ($7402yd3) This unit price does not reflect any potential incentive disincenshytives Four similarly sized non-HPC projects let that same year had the following quantities and unit bid prices for structural concrete 13824 m3 at $7865m3 (18189 yd3 at $5977yd3) 19838 m3 at $8637m3 (26103 yd3 at $6564yd3) 40806 m3 at $7313m3 (53692 yd3 at $5558yd3) and 7665 m3
at $11618m3 (10085 yd3 at $8830yd3) The difshyferent quantities aggregate availability and project complexities make it difficult to make a direct asshy
sertion as to the added cost of the HPC specificashytion However based upon feedback from the pavshying contractor the added cost for the HPC structural concrete is approximately $1300m3 ($1000yd3)
The unit costs of the different types of dowel bars also varied considerably The epoxy-coated dowel bar cost $520 the 38-mm (15-in) stainless steel clad dowel bar $1160 the 44-mm (175-in) stainless steel clad dowel bar $1430 and the solid stainless steel dowel bar $1970 A 16-km (10-mi) long project consisting of two 36-m (12-ft) lanes and 46-m (15-ft) joint spacing requires 8448 dowel bars yielding a total dowel bar cost of $4392960 for the epoxy-coated dowels $9799680 for the 38-mm (15-in) stainless steel clad dowels $12080640 for the 44-mm (175-in) stainless steel clad dowels and $16642560 for the solid stainless steel dowels The annualized cost for a 60-year design using solid stainless dowels is sigshynificantly higher than the annualized cost of a stanshydard 35-year design (ignoring user costs)
Point of Contact
Curt Turgeon Minnesota Department of Transportation 1400 Gervais Avenue Maplewood MN 55109 Ph (651) 779-5535 Fax (651) 779-5616 curtturgeondotstatemnus
References
Rangaraju P R 2003 Development of Some Per-formance-Based Material Specifications for Minne-sotarsquos High-Performance Concrete Pavement Transportation Research Board Annual Meeting CD-ROM Transportation Research Board Washshyington DC
Rettner D 1999 I-35W High Performance Rigid Pavement Work Plan Minnesota Department of Transportation Maplewood
Turgeon C 2003 Minnesotarsquos High Performance Concrete Pavements Evolution of the Practice Transportation Research Board 2003 Annual Meetshying CD-ROM Transportation Research Board Washington DC
84
94
90
35 Minnesota 2MnRoad Test Facility
Low Volume Road LoopAlbertville
94
90
35
Chapter 22 MINNESOTA 2 (MnRoad Low-Volume Road Facility)
Introduction
The Minnesota Road Research Project (MnRoad) is a major highway research initiative studying the performance of asphalt- concrete- and aggregate-surfaced roadways Opened to traffic in 1994 the purpose of the test road is to gain a better undershystanding of pavement response and pavement beshyhavior to traffic and environmental loadings with the expectation that improvements to existing pavement design and evaluation procedures will result
The MnRoad facility is located near Albertville just northwest of Minneapolis-St Paul (see Figure 59) It consists of two different road segments runshyning parallel to I-94 one a 57-km (35-mi) mainline roadway in the westbound direction carryshying interstate traffic and the other a 40-km (25shymi) low-volume road (LVR) loop exposed to conshytrolled truck weight and traffic loadings A variety of heavily instrumented test sections consisting of different thicknesses of concrete asphalt and agshygregate surfaces as well as other design features have been constructed within each road segment The asphalt sections on the LVR loop were deshysigned to last approximately 3 years and after 5
St PaulAlbertville
94
90
35
St Paul
Minnesota 2 MnRoad Test Facility
Low Volume Road Loop Albertville
Albertville
Figure 59 Location of MN 2 project
years several of these sections have required rehashybilitation or reconstruction (MnDOT 2000) By eliminating one of the deteriorated gravel test secshytions on the LVR three new JPCP test sections (numbered 32 52 and 53) were constructed with partial funding from the TE-30 program (MnDOT 2000) Figure 60 shows the layout of the MnRoad facility and the approximate location of the new test sections
I-94 EBI-94 WB
WB TestLanes
Low Volume RoadTest Loop
To AlbertvilleTo Monticello
32 52470 ft 285 ft 115 ft
Approximate Location ofTest Sections
53
N
I-94 EBI-94 WB
WB Test Lanes
Low Volume Road Test Loop
To AlbertvilleTo Monticello
32 52 470 ft 285 ft 115 ft
Approximate Location of Test Sections
53
N
Figure 60 Approximate location of new LVR test sections at MnRoad facility
85
Study Objectives
These three new test sections were constructed to obtain data not previously considered in the original LVR designs as well as to satisfy the data needs of local agencies (MnDOT 2000) Specific objectives include the following (MnDOT 2000)
bull Characterization of early-age and long-term slab curling and warping
bull Measurement of early-age and long-term internal slab stresses and shrinkage
bull Evaluation of long-term joint load transfer behavior of different dowel bar types
bull Evaluation of the performance of a thin low-cost JPCP for low-volume applicashytions
bull Evaluation of a concrete mixture containing ground granulated blast furnace slag (GGBFS)
bull Validation of sensor readings from other MnRoad test sections
bull Further investigation of the feasibility of retrofitting sensors in a pavement
Project Design and Layout
The three test sections are located on the southern tangent of the LVR near the eastern loop Design characteristics of each section are provided below (MnDOT 2000)
bull Section 32mdash127-mm (5-in) JPCP with 31-m (10-ft) transverse joints The paveshyment rests on a 178-mm (7-in) aggregate base The joints are sealed with a hot-poured joint sealant material and do not contain dowel bars The concrete mix conshytains 35 percent GGBFS
bull Section 52mdash190-mm (75-in) JPCP with 46-m (15-ft) transverse joints A 127-mm (5-in) aggregate base is located beneath the pavement slab The transverse joints are sealed with silicone The outside lane is 40-m (13-ft) wide and the inside lane is 43-m (14-ft) wide Four different load transfer devices are included in the section
ndash 25-mm (1-in) diameter 381-mm (15shyin) long epoxy-coated dowel bars
ndash 32-mm (125-in) diameter 381-mm (15-in) long epoxy-coated dowel bars
ndash 32-mm (125-in) diameter 457-mm (18-in) long fiber-reinforced polymer dowel bars
ndash 38-mm (150-in) diameter 457-mm (18-in) long fiber-reinforced polymer dowel bars
bull Section 53mdash190-mm (75-in) JPCP with 46-m (15-ft) transverse joints A 127-mm (5-in) aggregate base is beneath the paveshyment The transverse joints are sealed with silicone The outside lane is 40-m (13-ft) wide and the inside lane is 43-m (14-ft) wide None of the joints is doweled
Table 28 summarizes some of the key design feashytures for the MN 2 test sections Figure 61 illusshytrates the layout of test sections 52 and 53
Instrumentation layout for these test sections began in April 2000 with actual construction commencing in June (MnDOT 2000) Table 29 summarizes the type and number of sensors in these test sections (Burnham 2001) Concrete paving was performed on June 30 which was immediately followed by 72 hours of continuous monitoring of the internal shrinkage strain and temperatures as well as the external shape of the slabs (MnDOT 2000)
86
SSeectionction 5252 112525-in-in 115500-in-in
diadiammetereter didiamameteterer 112255--iinn FiFibbeerr FiberFiber 100100-in-in
diadiammetereter EEppoxoxy-y-CoCoatateded
DoDowweelsls
ReReinfinfoorcercedd PolyPolymmeerr DoDowweelsls
ReReinfinfoorrcceedd
PolPolyymmeerr DoDowweelsls
diadiammetereter EpoxyEpoxy--CCoatedoated
DoDowweelsls
1414 fftt
SSeectionction 5353
NoNo DoDowweelsls
1313 fftt 00 11 22 33 4 54 5 66 77 8 98 9 10 1110 11 12 1312 13 14 1514 15 16 1716 17 1818 1919 20 2120 21 22 2322 23 24 25 2624 25 26
2626 slabs slabs 1155 fftt 1100 ftft
Table 28 Summary of Design Features for MN 2 Test Sections
DESIGN FEATURE SECTION 32 SECTION 52 SECTION 53
Pavement type JPCP JPCP JPCP
Concrete mix GGBFS Conventional Conventional
Slab thickness in 5 75 75
Base type 7 in aggregate 5 in aggregate 5 in aggregate
Transverse joint spacing ft 10 15 15
Load transfer None (aggregate interlock) 1-in epoxy-coated dowels 125-in epoxy coated dowels 125-in fiber reinforced polymer 150-in fiber reinforced polymer
None (aggregate interlock)
Joint sealant Hot-pour Silicone Silicone
Longitudinal joint tie bars No 4 bars 30-in spacings No 4 bars 30-in spacings No 4 bars 30-in spacings
Lane width ft 12 (both) 13 (outside) 14 (inside)
13 (outside) 14 (inside)
Section length ft 470 285 115
JPCP = jointed plain concrete pavement GGBFS = ground granulated blast furnace slag
Figure 61 Layout of test sections 52 and 53 for MN 2 project
87
Table 29 Sensor Types and Quantities for Test Sections 32 52 and 53
QUANTITIES
SENSOR TYPE MEASUREMENT TYPE MANUFACTURER SECTION 32 SECTION 52 SECTION 53
Concrete embedment sensor Strain Tokyo Sokki 37 87 20
Displacement transducer Joint opening Tokyo Sokki 4 8 4
Invar reference rod Elevation MnDOT 4 4
Stainless steel reference rod Elevation MnDOT 2 5 1
Concrete embedment sensor Strain MicroMeas 8
Psychrometer sensor Relative humidity Wescor 4 4 4
Moisture resistance sensor Relative humidity ELE International 6 6 6
Dynamic Soil Pressure Sensor Pressure Geokon 1 3 3
Static soil pressure sensor Pressure Geokon 1 2 2
Thermocouple (T-type) Temperature Omega 16 16 16
Time domain reflectometer Soil moisture Campbell Scientific 6 4 4
Vibrating wire strain sensor Strain Geokon 16 35 34
State Monitoring Activities
As with all pavements at the MnRoad test facility these sections are subjected to an intensive data colshylection effort In addition to the data obtained from the instrumented slabs within each section visual distress data faulting measurements ride quality and FWD deflection data are collected (MnDOT 2000)
Preliminary Results and Findings
One of the objectives of this study was to evaluate the long-term joint performance of different dowel bar types Preliminary data on the dowel bars is provided below in Figures 62 and 63 The initial load transfer efficiency was lower for the FRP bars compared to the steel dowels by about 5 percent After 2 years in service the load transfer efficiency for the FRP bars dropped from approximately 80 percent to approximately 70 to 75 percent which are considered critical minimum levels The performance of the epoxy-coated steel bars appears relatively constant since construction The differenshytial deflections measured across each joint are still relatively low as can be seen in Figure 63
Another objective of the MN 2 project was to evaluate the early-age and long-term slab curling and warping Early-age profile measurements made using the Dipstick are provided in Figures 64 to 66 The profiles measurements revealed that large posishytive temperature moments can produce sufficient deformation in the slab such that the slab is unsupshyported along the whole length of the transverse joint due to upward curvature Large negative gradients can result in a deformed slab that forces the bottom of the slab into the base layer along the complete length of the transverse joint The total range of movement of the corner of the slab adjacent to the asphalt shoulder for the temperature conditions preshysent during measurement period was approximately 3500 microns The total movement for the corner of the slab adjacent to the longitudinal joint was 2500 microns These measurements were for slabs without dowel or tie bars A more thorough analysis of the early-age performance data can be found in Vandenbossche (2003)
Extensive research has also been performed on the analysis of measured dynamic strains in the thin concrete pavements on the MN2 project An in-depth discussion of the findings is provided by Burnham (2003 2004)
88
0
10
20
30
40
50
60
70
80
90
100 LT
E (
)
7132002 912002 10212002 12102002 1292003 3202003 592003
10 Epoxy steel 125 Epoxy steel 125 FRP 15 FRP
(mils
)
Diff
eren
tial D
efle
ctio
n (m
icro
ns)
00
05
10
15
20
25
30
35
7132002 912002 10212002 12102002 1292003 3202003 592003
10 Epoxy steel 125 Epoxy steel 125 FRP 15 FRP
Load Transfer Efficiency 9000 FWD Load leave side of joint
Figure 62 Load transfer efficiency of joints with different types of dowel bars for MN 2 project
Differential Joint Deflection 9000 FWD Load leave side of joint
Figure 63 Differential deflections across joints with different types of dowel bars for MN 2 project
89
3500
Dis
plac
emen
t m
icro
ns
3000 2500 2000 1500 1000 500
0 -500
-1000 -1500
0 100 200 300 400 500
Distance cm
600
D
ispl
acem
ent
mic
rons
Cell 53 - Diagonal (Replicate of Unrestrained Slabs in Cell 6)
3500 3000 2500 2000 1500 1000
500 0
-500 -1000 -1500
0 100 200 300 400 500 Distance cm
600
Cell 53 - Approach Transverse Joint (Replicate of Unrestrained Slab in Cell 6)
Figure 64 Transverse profile of unrestrained slab in Cell 53 for MN 2 project (Vandenbossche 2003)
Figure 65 Diagonal profile of unrestrained slab in Cell 53 for MN 2 project (Vandenbossche 2003)
90
3000
cron
s
2500 2000 i
nt m 1500
eD
ispl
acem
1000 500
0 -500
-1000 -1500
0 100 200 300 400 500 600 Distance cm
Cell 52 - Diagonal (Replicate of Restrained Slab in Cell 6)
3500
Figure 66 Diagonal profile of restrained slab in Cell 52 for MN 2 project (Vandenbossche 2003)
Point of Contact
Thomas Burnham 1400 Gervais Avenue Maplewood MN 55109 (651) 779-5606 TomBurnhamdotstatemnus
References
Burnham T R 2001 Construction Report for MnRoad PCC Test Cells 32 52 and 53mdashFinal Report Minnesota Department of Transportation Maplewood
mdashmdashmdash 2003 ldquoSeasonal Load Response Behavshyior of a Thin PCC Pavementrdquo Proceedings Eighth International Conference on Low-Volume Roads Transportation Research Record 1819 Transportation Research Board Washington DC
mdashmdashmdash 2004 ldquoLoad Proximity Correlation of Dynamic Strain Measurements in Concrete Paveshymentrdquo Proceedings Second International Con-ference on Accelerated Pavement Testing Minshyneapolis MN
Minnesota Department of Transportation (MnDOT) 2000 New JPCP Test Cells at the MnROAD Project Minnesota Department of Transportation Maplewood
Vandenbossche J M 2003 Interpreting Falling Weight Deflectometer Results for Curled and Warped Portland Cement Concrete Pavements Thesis for the degree Doctor of Philosophy in Civil Engineering University of Minnesota St Paul
91
Chapter 23 MINNESOTA 3 (MnRoad Mainline Road Facility and US 169 Albertville)
Introduction
This study included two projects three test secshytions on US 169 in Elk River and six test sections on I-94 at the Minnesota Road Research (MnRoad) test facility (see Figure 67)
The US 169 site represents a typical application for ultrathin whitetopping Most of the loads are static and the traffic is constantly starting and stopping This section of US 169 carries approxishymately 400000 ESALS per year The few cracks that were present in the existing asphalt pavement were in good condition but the asphalt itself was not especially along the outer edge A large amount of rutting (greater than 25 mm [1 in]) was also present before milling
The I-94 section was in good condition Very few cracks were present on the existing asphalt paveshyment and all were of low severity The roadway is subjected to heavy traffic loadings (over 1 million ESALs per year) Although this is not a typical application it provided the opportunity to monitor the performance of the overlay under accelerated loading conditions and to evaluate ultrathin
Figure 67 Location of MN 3 project
whitetoppings as an overlay alternative for high-volume roads (Vandenbossche and Rettner 1998 Vandenbossche and Rettner 1999)
Study Objectives
The purpose of the test sections was to further evalushyate how whitetopping performs in Minnesota and to determine what design features are desirable to optishymize the life of the pavement These heavily instrushymented sections allow the static and dynamic reshysponse of the pavement under various applied and environmental loading conditions to be measured In doing this a better understanding can be obtained on how to more accurately model whitetopping overlays so that a more efficient design method and performshyance prediction model can be developed
Project Design and Layout
The first project was located on the outer southbound lane of US 169 in Elk River at the intersections of Jackson School and Main streets The first 2402 m (788 ft) north of each intersection was overlaid with 762 mm (3 in) of fiber reinforced concrete and the final 366 m (12 ft) was paved 2032 mm (8 in) thick The original asphalt pavement was constructed in 1961 on a sandy subgrade and consisted of a 1016shymm (4-in) asphalt surface on 127-mm (5-in) of a relatively dense-graded aggregate base and 1524shymm (6-in) of subbase In 1991 508 (2 in) of asphalt was milled and the pavement was overlaid with 381 mm (15 in) of asphalt The average asphalt thickshyness based on a total of 10 cores was 15875 (625 in) Temperature and dynamic and static strain senshysors were installed at the Jackson Street intersection A summary of each test section is provided in Table 30
On the MnRoad project a 3429-mm (135-in) full-depth asphalt pavement was whitetopped with a fishyber-reinforced concrete overlay The original asphalt pavement was constructed in 1993 on a silty-clay subgrade The existing asphalt pavement was previshyously a transition zone that separated the 5- and 10shyyear mainline test cells The test section was divided up into six separate test cells with various thicknesses
92
TEST CELL DESCRIPTION SENSOR NO OF SENSORS
Jackson Street intersection 75 mm ndash 12 m x 12-m panels (3 in ndash 4 ft x 4-ft) Polypropylene fibers
Dynamic strain Static strain Thermocouple
32 4
14
Main Street intersection 75 mm ndash 12 m x 12-m panels (3 in ndash 4 ft x 4-ft) Polypropylene fibers
None
ndash
School Street intersection 75 mm ndash 18 m x 18-m panels (3 in ndash 6 ft x 6-ft) Polyolefin fibers
None
ndash
and joint patterns These cells were instrumented with strain temperature and moisture sensors A summary of the test cells is provided in Table 31
The US 169 test sections were paved on Septemshyber 17 1997 and the I-94 test sections on October 23 1997 All concrete was required to have an air content of 65 percent plusmn 15 percent and a flexural strength of 27579 kPa (400 lbfin2) at 3 days so that the overlays could be opened to traffic The flexural and compressive strengths for the conshycrete on US 169 are provided in Tables 32 and 33 respectively The flexural strengths for both the polypropylene and polyolefin mixes were similar The polypropylene concrete had slightly higher compressive strengths even though the wc ratio for the polyolefin mix was lower Increasing the
fiber content in the polyolefin mix by 8 times that of the polypropylene mix contributed to the lower strength of the polyolefin concrete Both mixes met the Minnesota Department of Transportationrsquos (MnDOTrsquos) flexural and compressive strength reshyquirements
In addition to the material testing on the US 169 proshyject extensive material property testing was also pershyformed on the concrete mixture used to construct the I-94 test sections These material properties are summarized in Tables 34 through 36
Additional information on the concrete mixture deshysign and the construction of these test sections can be found in the report by Vandenbossche and Rettner (1998)
Table 30 Summary of US 169 Whitetopping Test Sections for MN 3 Project
93
MnROAD TEST CELL DESCRIPTION SENSOR NO OF SENSORS
Cell 93 100 mm ndash 12 m x 12-m panels (4 in ndash 4 ft x 4-ft) Polypropylene fibers
Dynamic strain Dynamic asphalt foil strain gauge Static strain Thermocouple Moisture
32 2 8
14 12
Cell 94 75 mm ndash 12 m x 12-m panels (3 in ndash 4 ft x 4-ft) Polypropylene fibers
Dynamic strain 32
Cell 95 75 mm ndash 15 m x 18-m panels (3 in ndash 5 ft x 6-ft) Polyolefin fibers
Dynamic strain Dynamic asphalt foil strain gauge Static strain Thermocouple Moisture
32 2 8
12 12
Cell 96 150 mm ndash 15 m x 18-m panels (6 in ndash 5 ft x 6-ft) Polypropylene fibers
Dynamic strain 32
Cell 97 150 mm ndash 3 m x 37-m panels (6 in ndash 10 ft x 12-ft) Polypropylene fibers
Dynamic strain Dynamic asphalt foil strain gauge Static strain Thermocouple Moisture
32 2 8
16 12
Cell 97b 150 mm ndash 3 m x 37-m panels (6 in ndash 10 ft x 12-ft) Polypropylene fibers Doweled
Nonendash
TIME OF Time of STRENGTH Strength TESTING Testing
CONCRETE WITH POLYPROPYLENE FIBERS CONCRETE WITH POLYPROPYLENE FIBERS (JA(JACKSON STREET INTERSECTION) (LBFIN2) CKSON STREET INTERSECTION) (LBFIN2)
CONCRETE WITH POLYOLEFIN FIBERS
(MAIN STREET INTERSECTION) (LBFIN2)
28-day 590 570
Table 31 Summary of MnRoad Whitetopping Test Sections for MN 3 Project
Table 32 Flexural Strengths for US 169 on the MN 3 Project
94
TIME OF STRENGTH TESTING
CONCRETE WITH POLYPROPYLENE FIBERS
(JACKSON STREET INTERSECTION) (LBFIN2)
CONCRETE WITH POLYPROPYLENE FIBERS
(SCHOOL STREET INTERSECTION) (LBFIN2)
TIME OF STRENGTH TESTING
CONCRETE WITH POLYPROPYLENE FIBERS
(LBFIN2)
TIME OF STRENGTH TESTING
CONCRETE WITH POLYPROPYLENE FIBERS
(LBFIN2)
TIME OF STRENGTH TESTING
CONCRETE WITH POLYPROPYLENE FIBERS
Table 33 Compressive Strengths for US 169 on the MN 3 Project
CONCRETE WITH POLYOLEFIN FIBERS
(MAIN STREET INTERSECTION) (LBFIN2)
28-day 4900 4900 4400
28-day 5400 5900 5300
Table 34 Compressive Strengths for I-94 on the MN 3 Project
CONCRETE WITH POLYOLEFIN FIBERS
(LBFIN2)
1-day 2000 1600
3-day 3900 2900
7-day 4800 4200
14-day 5500 4800
28-day 6100 5300
Table 35 Elastic Moduli for I-94 on the MN 3 Project
CONCRETE WITH POLYOLEFIN FIBERS
(LBFIN2)
7-day 45 x 10-6 43 x 10-6
28-day 48 x 10-6 44 x 10-6
Table 36 Poissonrsquos Ratio for I-94 on the MN 3 Project
CONCRETE WITH POLYOLEFIN FIBERS
7-day 019 019
28-day 019 019
95
State Monitoring Activities
Climatic static strain and dynamic strain data are collected periodically throughout the year on the US 169 project On the I-94 project temperature moisture and static strain data was collected every 15 minutes since construction Dynamic strain data was collected for both static and dyshynamic truck loads and in conjunction with FWD testing four times per year once during each seashyson Distress ride and faulting data was also colshylected four times per year
Preliminary ResultsFindings
Distinct cracking patterns developed within each test section The UTW test sections with a 122-m x 122-m (4-ft x 4-ft) joint pattern contained corshyner breaks and transverse cracks The corner breaks occurred primarily along the inside longishytudinal joint and the laneshoulder (LS) longitushydinal joint while the transverse cracks developed in the panels adjacent to the shoulder The transshyverse cracks typically develop approximately 13 of the length of the panel away from the transshyverse joint The test section with the 183-m x 183-m (6-ft x 6-ft) joint pattern performed sigshynificantly better because the longitudinal joint does not lie in the inside wheelpath This signifishycantly reduces the edge and corner stresses Very tight longitudinal cracks developed on the 1524shymm (6-in) overlay with a 183-m x 183-m (6-ft x 6-ft) joint pattern on I-94 Reflective cracking was not observed in any of the test sections although reflective cracking has been found to occur in UTW placed on thicker HMA pavements such as on I-94 (Vandenbossche 2003) The strains measured on I-94 were consistently lower than those on US 169 even when measshyurements were made at higher HMA temperashytures The reduction in strain is a result of the inshycrease in thickness and quality of the HMA on Ishy94 and an increase in the bond strength between the two layers Increases in the temperature of the HMA also produce much smaller increases in strain on I-94 compared to US 169 except for the strains measured at mid-panel Strains at mid-panel on the I-94 project approach those measured at mid-panel on the US 169 project It was found that applying a load when the HMA temperature is high produces similar strains in the UTW reshy
gardless of the thickness of the HMA layer when a good bond is obtained (Vandenbossche 2003) The strain measurements emphasize the importance of the support provided by the HMA layer A reducshytion in this support occurs when the temperature of the HMA is increased or when the HMA begins to ravel The results from the strain measurements and the cores pulled from the test section indicate the HMA ravels at a faster rate along the joints where there is greater access for the water to enter the pavement structure The lane-shoulder joint is the most difficult to keep sealed and therefore the HMA along this joint was found to be more susceptible to strippingraveling Consideration should be given to sealing this joint to limit the water coming into contact with the HMA layer (Vandenbossche 2003) Repairs were made on three of the six MnROAD test sections on June 20 2001 after over 47 million ESALs The repairs were made to 13 different areas in the ultrathin whitetopping test sections In the secshytion with a 3-in overlay and 5-ft by 5-ft joint spacing four panels were repaired (two locations) Eighteen panels were repaired (six locations) in the section with a 3-in overlay and 4-ft by 4-ft joint spacing Nineteen panels were repaired (five locations) in the section with a 4-in overlay and 4-ft by 4-ft panels A detailed description on the repair techniques used was provided by Vandenbossche and Fagerness (2002)
Current Project Status Results and Findings
The test sections on US 169 were in service between September 1997 and September 1999 During that period the sections accumulated approximately 670000 equivalent single-axle loads (assuming a 1524-mm (6-in) portland cement concrete pavement and a terminal serviceability of 25) Additional inshyformation on the performance of these test sections can be found in the report by Vandenbossche (2002)
Three of the test sections on I-94 will be reconshystructed in the summer of 2004 The new test sections will consist of a 127-mm (5-in) and a 1016-mm (4shyin) overlay with 152-m x 183-m (5-ft x 6-ft) panels Half of each section will have sealed joints and the joints in the other half of each test section will remain unsealed The monitoring activities will be similar to that for the original whitetopping test sections The new test sections will be instrumented with temperashyture moisture and static and dynamic strain gauges
96
Point of Contact
Thomas Burnham 1400 Gervais Ave Maplewood MN 55109 (651) 779-5606 TomBurnhamdotstatemnus
References
Vandenbossche J M 2003 ldquoPerformance Analyshysis of Ultra-thin Whitetopping Intersections on US-169rdquo Transportation Research Record 1823 Transportation Research Board Washington DC
mdashmdashmdash 2002 The Construction and Performance of Ultra-thin Whitetopping Intersections on US-169 Final Report Minnesota Department of Transportation St Paul
Vandenbossche J M and A J Fagerness 2002 ldquoPerformance Analysis and Repair of Ultra-thin and Thin Whitetopping at MnROADrdquo Transportation Research Record 1809 Transportation Research Board Washington DC
Vandenbossche J M and D L Rettner 1999 ldquoOne-Year Performance Summary of Whitetopping Test Sections at the MnROAD Test Facilityrdquo Pro-ceedings International Conference on Accelerated Pavement Testing Reno NV
mdashmdashmdash 1998 The Construction of US-169 and I-94 Experimental Whitetopping Test Sections in Minne-sota Minnesota Department of Transportation St Paul
97
55
20
Mississippi 1US 72 Corinth
55
20
Chapter 24 MISSISSIPPI 1 (US 72 Corinth)
Introduction
The Mississippi Department of Transportation (MDOT) constructed an experimental project in 2001 under the TE-30 program to investigate the performance of a resin-modified pavement (RMP) RMPs are a new composite paving mateshyrial consisting of a thin layer (50 mm [2 in]) of open-graded hot mix asphalt (HMA) whose intershynal voids (approximately 30 percent) are filled with a latex rubber-modified portland cement grout (MDOT 1999) RMPs provide a tough and durable pavement surface that resists rutting surshyface abrasion and deterioration due to fuel spillshyage (Anderton 1996) To date they have been used almost exclusively on military bases but current research suggests they are suitable for any low-speed traffic application where resistance to heavy loads tracked vehicle traffic or fuel spillshyage is required (Anderton 1996) The cost of an RMP is typically about 50 to 80 percent higher than a comparable HMA pavement but about 30 to 60 percent less than a comparable PCC paveshyment design (Anderton 1996)
To evaluate the performance of RMP the MDOT constructed a series of test sections under the TEshy30 program on US 72 in Corinth (see Figure 68) in 2001 These test sections were constructed at
Jackson
72
Jackson
55
20
Mississippi 1 US 72 Corinth
7272
Figure 68 Location of MS 1 project
98
two HMA pavement intersections on US 72 that have a history of rutting and high traffic loading For comshyparison purposes an alternative pavement was conshystructed at each intersection adjacent to the RMP but in the opposite traffic direction One of the alternative pavements was an ultrathin whitetopping (UTW) deshysign the other was a polymer-modified HMA paveshyment
Study Objectives
The objective of this project is to construct a demonshystration RMP highway project and compare its pershyformance to that of a UTW overlay and a polymer-modified HMA overlay
Project Design and Layout
The construction of this experimental project took place from April to June of 2001 A total of four test sections were constructed at two different intersecshytions on US 72 in Corinth
bull Intersection of US 72 and Hinton Street South Parkway and Liddon Lake Road
ndash RMP in eastbound lanes
ndash UTW overlay in westbound lanes
bull Intersection of US 72 and Cass Street
ndash RMP in eastbound lanes
ndash Polymer-modified HMA overlay in westbound lanes
Figure 69 shows the layout of the test sections at the intersection of US 72 and Hinton Street South Parkshyway and Liddon Lake Road while Figure 70 shows the layout of the test sections at the intersection of US 72 and Cass Street
The existing HMA pavement varied in thickness from 250 to 350 mm (10 to 14 in) and was exhibitshying rutting typically between 25 and 38 mm (1 and 15 in) This portion of US 72 carried approximately 22600 vehicles per day in 2000 (including about 10 percent heavy trucks) The projected cumulative
KESALs in one direction for 20-year design life are 11257 and 7257 for rigid and flexible paveshyments respectively
At both intersection locations the RMP was conshystructed 50 mm (2 in) thick The existing HMA pavement was first milled to a depth of 50 mm (2 in) after which a 50-mm (2-in) lift of open-graded HMA (PG 67-22) was placed The cement grout containing a resin additive PL-7 was applied to the open-graded HMA the following day
A 5000 lbfin2 air-entrained concrete mix containshying fibrillated polypropylene fibers was utilized for the UTW that was placed at the intersection of US 72 and Hinton Street The existing HMA pavement was first milled to a depth of 75 mm (3 in) The 75-mm (3-in) UTW was then placed with green sawing of the slabs conducted using
South Parkway
US 72 WB
US 72 WB
Soff-Cut saws The UTW was sawed into 09-m (3-ft) square slabs
The polymer-modified HMA overlay was placed at the US 72 and Cass Street intersection The existing HMA pavement was first milled to a depth of 100 mm (4 in) The polymer-modified HMA with a 125 mm (05 in) nominal maximum aggregate size (NMAS) and a PG 82-22 asphalt binder was then placed in two 50-mm (2-in) lifts
The excess milling of the existing pavement during the construction increased the unit costs of UTM and RMP sections The unit cost of RMP sections was further increased by the removal of a portion of the sections due to the lack of full-depth grout penetrashytion The estimated and actual unit costs for these overlay treatments are shown in Figure 71
Lidden Lake Road
474 ft
3 in ultrathin whitetopping 3 ft Χ 3 ft panels
2 in resin-modified pavement
310 ft
US 72 EB
US 72 EB
Hinton Street
Figure 69 Layout of test sections at the intersection of US 72 and Hinton Street South Parkway and Liddon Lake Road
99
Cass Street
450 ft
4 in hot mix asphalt PG 82-22
2 in resin-modified pavement
US 72 WB
US 72 WB
US 72 EB
US 72 EB
290 ft
Hinton Street
Figure 70 Layout of test sections at the intersection of US 72 and Cass Street
3 UTW 2 RMP 4 HMA
Test Section
Figure 71 Relative unit costs of the test sections
0
5
10
15
20
25
30
35
40
Uni
t Cos
t ($
sqy
d) Estimated
Actual
100
AT HINTON
State Monitoring Activities
Construction Monitoring During the construction of test sections several incidents were observed by the researchers that might affect long-term pavement performance These are summarized below (Battey 2002)
bull After the inside lanes of both RMP secshytions were constructed the temperature in Corinth dropped to 32 oF during the night The severe cold slowed down the curing of the grout to such an extent that it apshypeared to be ldquopowdering uprdquo on the surshyface However the next day as the temshyperature warmed up the powdering condition was not evident and the grout appeared to be gaining strength
bull During the construction of the right lane of the HMA section 10 vehicles drove on the fresh asphalt mat before the breakshydown roller could begin compacting the section The rutting due to the early traffic averaged 22 mm (009 in) in the left wheelpath and 1 mm (004 in) in the right wheelpath
Performance Monitoring MDOT will monitor the performance of these test sections for a period of 5 years Performance data collected include Profile Index (PI) International
Roughness Index (IRI) and skid number Rutting data are also being collected for the HMA section
Preliminary ResultsFindings
Some preliminary performance data collected under the monitoring program are summarized in Table 37 (andashd) The monitoring of the construction and pershyformance of these test sections has led to the followshying conclusions and recommendations (Battey 2002)
bull Table 37 indicates that the smoothness of the UTW test section is less than satisfactory suggesting the need for smoothness incentive provisions
bull In the construction of RMP the gradation of the open-graded asphalt mix must be careshyfully controlled to ensure the target 30 pershycent air void level is obtained Sufficient curshying time (no less than 72 hours of above 50 oF temperature) should be provided for the grout to obtain its design compressive strength
bull The initial skid resistance of the RMP secshytions is less than satisfactory However as traffic begins to wear the top film of grout off the sections the skid numbers begin to imshyprove to more acceptable levels
Table 37(a) International Roughness Index (IRI) Measured on the MS 1 Test Sections (mmkm)
DATE ULTRATHIN
WHITETOPPING RESIN-MODIFIED PAVEMENT
AT CASS HOT MIX ASPHALT
April 2001 542 204 236
July 2001 475 178 212 141
August 2001 454 176 201 132
IRI was collected in the right wheelpath using MDOTrsquos ARRB Transport Research Walking Profiler IRI is the average IRI of both wheelpaths collected using MDOTrsquos High Speed ldquoSouth Dakota Typerdquo Profiler
101
DATE
ULTRATHIN WHITETOPPING
RESIN-MODIFIED PAVEMENT AT CASS AT HINTON
HOT MIX ASPHALT
PI 02 PI 00 PI 02 PI 00 PI 02 PI 00 PI 02 PI 00
April 2001 10003 14828 1142 278 2353 5921
June 2001 1603 3524
DATE ULTRATHIN
WHITETOPPING RESIN-MODIFIED PAVEMENT
AT CASS AT HINTON HOT MIX ASPHALT
April 2001 368
May 2001 332 244 234
July 2001 333 298 318 358
August 2001 378 371 380 369
December 2001 442 387 394 349
RUTTING (IN) DATE LEFT WHEELPATH RIGHT WHEELPATH
July 2001 009 004
December 2001 013 008
Table 37(b) Profile Index Measured on the MS 1 Test Sections (inmi)
PI was collected in the right wheelpath using a ldquoCalifornia Typerdquo Profilograph and analyzed with both 0 and 02 in blanking bands
Table 37(c) Friction Numbers Measured on the MS 1 Test Sections
Skid resistance tests were conducted in the outside lane of each section with a test speed of 40 mihr
Table 37(d) Rutting Measured in the MS 1 HMA Test Section (in)
Point of Contact
Randy Battey Mississippi Department of Transportation P O Box 1850 Jackson MS 39215-1850 (601) 359-7648
References
Anderton G L 1996 Userrsquos Guide Resin Modi-fied Pavement Miscellaneous Paper GL-96-7 US Army Center for Public Works Alexandria VA
Battey R L 2002 Construction Testing and Preliminary Performance Report on the Resin Modified Pavement Demonstration Project Work Order Document Work Order DTFH71-99shyTE030-MS-12 (State Study No 137) Mississippi Department of Transportation Jackson
Mississippi Department of Transportation (MDOT) 1999 High Performance Concrete Pavement Work Order Document Work Order DTFH71-99-TE30-MS-12 (State Study No 137) Mississippi Department of Transportation Jackshyson
102
70
44
29
Missouri 1I 29 SB Rock Port
70
44
29
Chapter 25 MISSOURI 1 (I-29 Rock Port)
Introduction
As part of the TE-30 program the Missouri Deshypartment of Transportation (MoDOT) constructed an experimental unbonded concrete overlay in 1998 Located in the southbound lanes of I-29 just west of Rock Port (see Figure 72) the overlay includes test sections of conventional unbonded overlays steel fiber-reinforced overlays and polyolefin fiber-reinforced overlays all with varyshying thicknesses (MoDOT 2000)
- Jefferson City
Kansas City
Rock Port
70
44
29
Missouri 1 I-29 SB Rock Port Jefferson City
Kansas City
Rock Port
Figure 72 Location of MO 1 project
Study Objectives
The overall objective of this study is to compare the performance of fiber-reinforced unbonded concrete overlays to that of conventional unshybonded concrete overlays (MoDOT 2000) The addition of the fibers to the concrete mix is exshypected to increase the service life of the overlay by increasing the ldquotoughnessrdquo and post-cracking behavior of the concrete (Mindess and Young 1981) Toughness is defined as the total energy required to break a specimen and the addition of fibers gives concrete a considerable amount of apparent ductility before ultimate failure of the specimen (Mindess and Young 1981)
Project Design and Layout
This project constructed in 1998 consists of eight test sections each 762 m (2500 ft) long (MoDOT 2000) Of the eight test sections three sections
incorporate steel fibers in the concrete mix three secshytions incorporate polyolefin fibers in the mix and two sections use a conventional concrete mixture The layout of these test sections is illustrated in Figshyure 73 (MoDOT 2000)
All of the test sections are unbonded concrete overshylays placed over an existing 229-mm (9-in) jointed reinforced concrete pavement (JRCP) that has 187-m (615-ft) transverse joint spacing (MoDOT 2000) A 25-mm (1-in) asphaltic interlayer treated with white curing compound was used to isolate the concrete overshylays from the underlying pavement (MoDOT 2000)
Based on a laboratory evaluation of fiber-reinforced mixes conducted by the DOT and on the recommenshydations of the fiber manufacturers two fibers were selected for the I-29 project (MoDOT 2000)
bull 50-mm (2-in) 3M polyolefin fibers The fishybers are straight with an aspect ratio (lengthdiameter) of 79 and were applied at a dosage rate of 148 kgm3 (25 lbyd3)
bull 60-mm (24-in) Dramix steel fibers These fibers have hooked ends to promote bonding an aspect ratio of 75 and were applied at a dosage rate of 445 kgm3 (75 lbyd3)
Each of the fiber-reinforced sections are differentishyated by slab thickness with thicknesses of 229 mm (9 in) 152 mm (6 in) and 127 mm (5 in) included in the study Furthermore within each fiber-reinforced test section four subsections with variable joint spacshyings (46 m [15 ft] 91 m [30 ft] 183 m [60 ft] and 61 m [200 ft]) are also included The two control secshytions for the project are a 229-mm (9-in) unbonded JPCP with 46-m (15-ft) transverse joints and a 279shymm (11-in) unbonded JPCP with 46-m (15-ft) transshyverse joints The experimental design matrix for the project is provided in Table 38
Paraffin-treated epoxy-coated steel dowel bars were included in all test sections The 279-mm (11-in) test section contained 38-mm (15-in) diameter bars whereas the rest of the test sections contained 32-mm (125-in) diameter bars Transverse joints were sealed with a hot-poured elastic sealant
103
Figure 73 Layout of MO 1 test sections (MoDOT 2000)
Table 38 Experimental Design Matrix for MO 1
UNBONDED OVERLAY PORTLAND CONCRETE CEMENT
CONVENTIONAL Steel Fiber Polyolefin Fiber
5 in Slab Thickness
15-ft Joint Spacing Section 7 Section 8
30-ft Joint Spacing Section 7 Section 8
60-ft Joint Spacing Section 7 Section 8
200-ft Joint Spacing Section 7 Section 8
6 in Slab Thickness
15-ft Joint Spacing Section 6 Section 5
30-ft Joint Spacing Section 6 Section 5
60-ft Joint Spacing Section 6 Section 5
200-ft Joint Spacing Section 6 Section 5
9 in Slab Thickness
15-ft Joint Spacing Section 1 Section 2 Section 3
30-ft Joint Spacing Section 2 Section 3
60-ft Joint Spacing Section 2 Section 3
200-ft Joint Spacing Section 2 Section 3
11 in Slab Thickness 15-ft Joint Spacing Section 4
104
State Monitoring Activities
MoDOT is monitoring the performance of these sections annually for a minimum of 5 years with additional monitoring thereafter conducted as apshypropriate Data collection activities include paveshyment distress surveys roughness measurements surface friction testing and FWD testing
During construction the properties of the materishyals were monitored The fiber-reinforced concrete overlay mix had a wc of 039 and utilized a limeshystone coarse aggregate with a 13 mm (05 in) top size (MoDOT 2000) Nonuniform distribution of the fibers was observed particularly for the polyshyolefin fibers (MoDOT 2000) Mixing times were increased batch sizes were decreased and the order of mixer loading was altered to address this concern and these seemed to increase the unishyformity of the fiber distribution in the concrete (MoDOT 2000)
Initial finishing of the overlays used a burlap drag but this was later changed to an unweighted carpet drag because it was found that the fibers became caught in the burlap such that some fibers and agshygregate were pulled from the top layer of the overshylay (MoDOT 2000) In lieu of the conventional transverse tining texturing method the final surshyface texture was established by diamond grinding the overlay 21 days after construction for smoothshyness and rideability (MoDOT 2000) Following
grinding profilograph readings averaged less than 017 mkm (11 inmi) (0 blanking band) resulting in a smoothness bonus for the contractor (MoDOT 2000)
The in-place construction costs for these paveshyment sections are shown in Figure 74 (MoDOT 2000) This figure shows that the initial cost of the fiber-reinforced sections is higher than the cost of the conventional sections (the cost of furnishing the steel fiber concrete and the polyolefin fiber concrete was $5622 and $7177 more per m2 [$47 and $60 more per yd2] respectively than the conshyventional concrete)
Preliminary ResultsFindings
Preliminary resultsfindings are based on the first 2 years of performance monitoring of these test sections After nearly 2 years of service the overshyall performance of these sections was good alshythough a few of the sections performed poorly (MoDOT 2000) In particular the thin 127-mm (5-in) sections both steel and polyolefin reinshyforced exhibited a large amount of transverse cracking In addition the 152-mm (6-in) steel fiber-reinforced section also showed significant transverse cracking Figure 75 summarizes the cracking data collected up to 1999 on these test sections (MoDOT 2000)
Relative Cost of Test Sections
$000
$20000000
$40000000
$60000000
$80000000
$100000000 Cost per mile - 38 width
9 9 9 11 6 6 5 5 Plain Steel Poly Plain Poly Steel Steel Poly TS 1 TS 2 TS 3 TS 4 TS 5 TS 6 TS 7 TS 8
Figure 74 Relative cost of MO 1 test sections (MoDOT 2000)
105
Most of the transverse cracks that had developed were not located above joints or cracks in the exshyisting pavement so they did not appear to be reshyflective cracks (MoDOT 2000) In fact most of the cracks on the thin steel fiber-reinforced secshytions were parallel to and located within 03 m (1 ft) of the transverse joints whereas the cracks in the thin polyolefin fiber-reinforced sections were located away from the joints near mid-panel (MoDOT 2000) Because of the problems of the cracking and subsequent spalling the test sections 7 and 8 were replaced with full-depth concrete in 2000
Four general conclusions are drawn from the pershyformance data collected up to 1999 (MoDOT 2000)
bull The steel fiber-reinforced test sections exhibited more transverse cracking than the polyolefin fishyber-reinforced test sections
bull The longer panels exhibited more cracking than the short panels
bull The thinner overlay sections exhibited more cracking than the thicker sections
bull Cracks that had developed in the steel fiber-reinforced test sections were tighter than those in the polyolefin fiber-reinforced test sections (3 mm [012 in] vs 6 mm [025 in])
0
2
4
6
8
10
12
Feet
of
Cra
ckin
gP
anel
9 in Plain - TS 1
9 in Steel - TS 2
9 in Poly - TS 3
11 in Plain - TS 4
6 in Poly - TS 5
6 in Steel - TS 6
5 in Steel - TS 7
5 in Poly - TS 8
July
-98
Sep
tem
bershy
98
Nov
embe
rshy98
Janu
ary-
99
Mar
ch-9
9
May
-99
July
-99
Approximate Date of Survey
Figure 75 Transverse cracking on MO 1 test sections (MoDOT 2000)
Interim ResultsFindings
Although no formal reports have been developed since the 2000 summary MoDOT has provided additional performance data for inclusion in this report (Chojnacki 2004) Cracking surveys were conducted in December 2003 on these test secshytions and the results are shown in Figure 76 (Choshyjnacki 2004) These data have been combined with the previous data to produce Figure 77
In 2003 joint repairs were performed at several locashytions where transverse cracks existed near joints and spalling had occurred The deteriorated areas were replaced with a full-lane-width concrete patch at least 18 m (6 ft) long The patches were tied at one end with 19-mm (075-in) epoxy-coated tie bars and doweled at the other end with 19-mm (075-in) epshyoxy-coated dowel bars (Chojnacki 2004)
106
000
200
400
600
800
1000
1200
1400
1600
Cra
ck L
engt
h (ft
pan
el)
Transverse Longitudinal
1 2 3 4 5 6
Section
Figure 76 Transverse and longitudinal cracking on MO 1 test sections (Chojnacki 2004)
Transverse Cracking by Entire Test Section
14
0
2
4
6
8
10
12
Jul-98 Nov-99 Mar-01 Aug-02 Dec-03
Approximate Date of Survey
Feet
of C
rack
ing
Pane
l
9 in Plain - T S1
9 in St eel - T S2
9 in Poly - T S3
11 in Plain - T S4
6 in Poly - T S5
6 in St eel - T S6
5 in St eel - T S7
5 in Poly - T S8
Figure 77 Transverse cracking on MO 1 test sections
Point of Contact
Tim Chojnacki Missouri Department of Transportation 1617 Missouri Boulevard PO Box 270 Jefferson City MO 65102 (573) 751-1040 TimothyChojnackimodotmogov
References
Chojnacki T 2004 Performance Data from MO1 Test Sections Missouri Department of Transportashytion Jefferson City
Mindess S and J F Young 1981 Concrete Pren-tice-Hall Inc Englewood Cliffs NJ
Missouri Department of Transportation (MoDOT) 2000 Test SectionsmdashUnbonded Concrete Overlay Internal Technical Summary Missouri Department of Transportation Jefferson City
107
Chapter 26 NEW HAMPSHIRE HPCP PROJECT
Introduction
Under the TE-30 program the University of New Hampshire in conjunction with the New Hampshyshire Department of Transportation developed definitions of and showcase presentations for high-performance concrete in both bridge and pavement applications A CD-ROM was produced containing the definitions as well as the presentashytion materials and accompanying speaker notes (Goodspeed 1999) On the pavement applications side a demonstration computer program allowing the optimization of several concrete pavement variables was also developed
Study Objectives
The objectives of this project include the develshyopment of performance classifications for high-performance concrete pavement (HPCP) the disshysemination of information on HPCP through sevshyeral showcase presentations and the development of computer program that develops optimized pavement designs based on performance and varishyable constraints
ResultsFindings
HPCP Definitions To aid in the development of high-performance concrete pavement designs three HPCP classifications were developed These classifications provide recommended values or ranges for different slab base and subgrade properties and also maximum limits on various pavement performance parameters The concept is that pavements subjected to higher traffic loadings or designed for longer service lives require stronger more durable materials and more stringent performance requirements Table 39 summarizes the recommended performance characteristics for three different HPCP classifications (Goodspeed 1999) It is noted that some of the performance characteristics are not defined and also that the criteria for several of the design characteristics (eg permeability and
ability and friction number) are not compatible with the selected performance classification
Optimization Computer Program The High Performance Concrete Pavement Optishymization Program is available for use by State highway agencies (Goodspeed 1999) The comshyputer program allows for one or more key design variables to be selected for optimization subject to certain constraints Generally slab thickness is the design variable that will be optimized although other design variables such as joint spacing or PCC compressive strength can also be selected for optimization
When optimizing acceptable ranges must be enshytered for each variable being optimized Furthershymore a cost equation must also be defined for each variable being optimized The cost equation relates the cost of the variable to the design of the pavement system Several default cost equations are provided for key variables but users may also define their own unique cost equations (Goodspeed 1999)
Constraint parameters for various performance indicators must also be defined These are genershyally equations that link the different design varishyables to pavement performance Again several default constraint parameters are contained in the program (for example the 1993 AASHTO design procedure [AASHTO 1993] and the 1998 AASHTO Supplement [AASHTO 1998]) but users may define their own unique performance equations (Goodspeed 1999)
After defining the optimization variables and the constraint parameters the user runs the optimizashytion program to obtain the cost result and the valshyues associated for each optimization variable A summary report window is generated that summashyrizes the selected constraint equations the optimishyzation variable limits the parameters the cost equation results and the optimized variable reshysults (Goodspeed 1999)
108
RECOMMENDED RANGE OR VALUE
DESIGN CHARACTERISTICS PERFORMANCE
CLASSIFICATION 1 PERFORMANCE
CLASSIFICATION 2 PERFORMANCE
CLASSIFICATION 3
System Parameters ESAL applications millions 50ndash150 gt 150
Maximum bearing stress lbfin2 2 4 6
Limiting IRI rating 15 175
Limiting faulting inmi 20 15 10
Limiting transverse cracksmi 30 20
Design life years 20 30 gt 40
Design reliability 75ndash85 85ndash95
Terminal serviceability index 250 30
PCC Slab Materials Modulus of rupture lbfin2 500ndash650 650ndash700 gt 700
Elastic modulus lbfin2 25ndash50 50ndash100 gt 100
Freeze-thaw (ASTM C666) 60ndash80 gt 80
Scaling (ASTM C672) x = 4 5 x = 2 3 x = 0 1
Abrasion (ASTM C944-90a) 1ndash2 05ndash1 lt 05
Permeability (ASTM C1202) coulombs 1000 2000 3000
Coarse aggregate (AASHTO M80-87) class D C B
Fine aggregate (AASHTO M6-93) class B A
Slab Constructibility Fast track hours to 3000 lbfin2 lt 24 lt 18 lt 12
Slab Performance Mean friction number (ASTM E 274) 40ndash50 35ndash40 30ndash35
Initial smoothness (profilograph) inmi 9 7 6
Texture (ASTM E965) in 013 013ndash025 025ndash030
Joint Materials Rubberized asphalt (ASTM D1190 D3405) 15ndash20 20ndash30 gt 30
Low-Modulus RA (ASTM D3405) 30ndash40 40ndash50 gt 50
Nonself-leveling silicone (ASTM D3893) 30ndash40 40ndash50 gt 50
Self-leveling silicone (ASTM D3893) 30ndash40 40ndash50 gt 50
Preformed compression seal (ASTM D2628) 45ndash65 65ndash85 gt 85
Joint Constructibility Load transfer coefficient J 30ndash32 28ndash30 lt 28
Joint Performance Joint faulting in lt 013 lt 010
Base Materials Liquid limit (AASHTO T89) 25ndash28 28ndash32 gt 32
Plastic limit (AASHTO T90) lt 10 lt 20
Abrasion (ASTM C131) 50 max
Drainage coefficient Cd 09ndash11 11ndash12 gt 12
Stabilized base k-value lbfin2in 100ndash200 200ndash300 gt 300
Subgrade k-value lbfin2in 100 150ndash200 200ndash250
Subgrade CBR 60ndash70 70ndash80 gt 80
Base Constructibility In-place recycling lt 10 lt 20 lt 30
Speed ftday lt 500 lt 1500 lt 3000
Base Performance Erosion resistance (CTB) 3ndash5 5ndash7 7ndash8
Friction coefficient f 09ndash12 12ndash20 gt 20
Table 39 Summary of Design Characteristics for HPCP Classifications (Goodspeed 1999)
109
Program Availability The software program is currently available and free upon request The software can be requested from either the New Hampshire Technology Transfer (T2) Center or the Florida T2 Center
Charles Goodspeed University of New Hampshire Kingsbury Hall Room 236 Durham NH 03824 (603) 862-1443 chgicisunxunhedu
Gib Peaslee University of Florida Civil Engineering Department Transportation Research Center PO Box 116585 512 Wiel Hall Gainesville FL 32611-6585 (352) 392-2371 ext 245 gibceufledu
Point of Contact
Charles H Goodspeed University of New Hampshire Kingsbury Hall Room 236 Durham NH 03824 (603) 862-1443 chgicisunxunhedu
References
American Association of State Highway and Transshyportation Officials (AASHTO) 1993 Guide for De-sign of Pavement Structures American Association of State Highway and Transportation Officials Washington DC
mdashmdashmdash 1998 Supplement to the Guide for Design of Pavement Structures American Association of State Highway and Transportation Officials Washington DC
Goodspeed C H 1999 High Performance Concrete for Bridge and Pavement Applications CD-ROM (with HPCP definitions presentation files and comshyputer program) Durham NH
110
71
70
Ohio 1 2 and 3US 50 Athens
77
71
70
77
Chapter 27 OHIO 1 2 AND 3 (US Route 50 Athens)
Introduction
Under the TE-30 program the Ohio Department of Transportation (ODOT) constructed three experishymental pavement projects on US 50 approximately 8 km (5 mi) east of the city of Athens (see Figure 78) The projects incorporate a variety of experishymental design features including high-performance concrete mixtures utilizing ground granulated blast furnace slag (GGBFS) (OH 1) alternative dowel bar materials (OH 2) and alternative joint sealing materials (OH 3) (Ioannides et al 1999 Sargand 2000 Hawkins et al 2000) Although each project was funded separately under the TE-30 program they are all located on the same section of roadway and share many of the same design and construction attributes as well as the same traffic and environshymental loadings therefore these projects are all described together in this chapter
50
Columbus
Athens
71
70
5050
Ohio 1 2 and 3 US 50 Athens
Columbus
Athens
77
Figure 78 Location of OH 1 2 and 3 projects
Study Objectives
The study objectives for the overall US 50 paveshyment project may be broken out by each specific study For OH 1 the evaluation of GGBFS the primary objective is to evaluate the effectiveness of GGBFS as a partial cement replacement in PCC pavements The expectation of adding GGBFS to a concrete mix is the achievement of increased
workability increased durability and increased long-term strength
For OH 2 the evaluation of alternative dowel bar materials the general purposes of the study are to evaluate dowel response under a variety of loading and environmental conditions and to compare the measured responses of different types of dowel bars (Sargand 2000) Specific objectives include the folshylowing (Sargand 2000)
bull Instrument standard steel and fiberglass dowels for the monitoring of strain induced by curing changing environmental condishytions and applied dynamic forces
bull Record strain measurements periodically over time to determine forces induced in the dowel bars during curing and during changing environmental conditions
bull Record strain measurements in the dowel bars as dynamic loads are applied with the FWD
bull Evaluate strain histories recorded for the in-service pavement
For OH 3 the evaluation of joint sealing materials the objectives are to (Ioannides et al 1999)
bull Assess the effectiveness of a variety of joint sealing practices employed after the initial sawing of joints and to examine their reshypercussions in terms of reduced construcshytion times and life cycle costs
bull Identify those materials and procedures that are most cost effective
bull Determine the effect of joint sealing techshyniques on pavement performance
Project Design and Layout
General Design Information The US 50 project is a 105-km (65-mi) segment of highway that was reconstructed and expanded to a new four-lane divided facility The eastbound lanes
111
of the project were constructed in the fall of 1997 and the westbound lanes were constructed in the fall of 1998 (Ioannides et al 1999)
The 20-year design traffic loading for this pavement is approximately 11 million ESAL applications The subgrade over the project site is predominantly a silty clay material (Ioannides et al 1999)
The cross-sectional design for the projects is a 254shymm (10-in) JRCP placed over a 102-mm (4-in) open-graded base course The open-graded base course in the eastbound direction is a ldquoNew Jerseyrdquo type nonstabilized base whereas the open-graded base course in the westbound direction is a ldquoIowardquo type nonstabilized base (Ioannides et al 1999) A 152-mm (6-in) crushed aggregate subbase is loshycated beneath the open-graded bases and is topped with a bituminous prime coat to prevent migration of fines into the open-graded layers (Ioannides et al 1999) Table 40 provides the actual project gradashytions for these materials A 102-mm (4-in) under-drain was placed at both the outside and inside edges of the pavement to collect infiltrated moisture from the open-graded bases (Ioannides et al 1999)
The slabs are reinforced with smooth welded wire fabric (WWF) to control random cracking (Sargand 2000) Wire style designation W85 x W4mdash6x12 was specified meaning that the longitudinal wires
have a cross sectional area of 548 mm2 (0085 in2) and are spaced 152 mm (6 in) apart and the transshyverse wires have a cross-sectional area of 258 mm2
(004 in2) and are spaced 305 mm (12 in) apart This style designation translates to a longitudinal steel content of 014 percent
The transverse joints are spaced at fixed 64-m (21shyft) intervals and contain 38-mm (15-in) diameter 457-mm (18-in) long epoxy-coated dowel bars on 305-mm (12-in) centers (Sargand 2000) However some of the joints within the alternative dowel bar project contain either fiberglass dowels or stainless steel tubes filled with concrete (Sargand 2000) Transverse joints were sealed with a preformed compression sealant except for the joints within the joint sealant project The longitudinal centerline joint is tied with 16-mm (062-in) diameter 760shymm (30-in) long deformed bars spaced at 760-mm (30-in) intervals (Ioannides et al 1999)
Plain concrete shoulders were paved separately from the mainline pavement These were tied to the mainline pavement using 16-mm (062-in) diameshyter 76-mm (30-in) long deformed tie bars The outside shoulder is 3 m (10 ft) wide and the inside shoulder is 12 m (4 ft) wide (Ioannides 1999)
Table 40 Comparison of Actual Base and Subbase Gradations Used on Ohio US 50 Project
TOTAL PERCENT PASSING
SIEVE SIZE NEW JERSEY OPEN-GRADED
BASE (EB) IOWA OPEN-GRADED
BASE (WB) CRUSHED AGGREGATE
SUBBASE (EBWB)
2 in 100
1frac12 in 100
1 in 100
8 12 30 25
16 6 19 18
30 4 15 14
40 4 12 13
50 4 9 12
100 3 6 10
200 32 56 98
112
US 50 WB
OH 1 GGBFS Study104+40 to 436+00
Both Directions
OH 1 Control Section (No GGBFS in mix) 92+3425 to 104+40
US 50 EB
Project Layout Information As described previously the US 50 project actually includes three projects one evaluating GGBFS one evaluating alternative dowel bar materials and one evaluating joint sealant materials In addition a conshytrol section that does not contain GGBFS is located at the western end of the project The general layout of these projects is shown in Figure 79 More deshytailed information on each project is provided in the following sections
OH 1 Evaluation of Ground Granulated Blast Furnace Slag
The entire 105-km (65-mi) length of the US 50 project was constructed using a high-performance concrete mix consisting of a Type I cement with GGBFS replacing 25 percent of the cement (Sarshygand 2000) An AASHTO 8 gravel (013 mm [05 in] top size) was used for the coarse aggreshygate and a natural sand was used for the fine agshygregate (Sargand 2000) A wc of 044 was used in the mix design The complete PCC mix design is shown in Table 41
Begin Project STA92+3425
OH 3 Joint Seal Study 133+60 to
231+00
Begin Project STA 92+3425
OH 3 Joint Seal Study 133+60 to
231+00
US 50 WB
Samples from the concrete mix used in the actual paving operation were tested in the laboratory and showed a 28-day compressive strength of 276 MPa (4000 lbfin2) and a 28-day modulus of rupture of 276 MPa (400 lbfin2) (Sargand 2000) The 28-day static modulus of elasticity was 2592 GPa (3760000 lbfin2) (Sargand 2000)
As previously mentioned a control pavement section that does not contain GGBFS in the concrete mix is located at the western end of the project between stations 92+354 and 104+40 Other than the mix deshysign the design of the control section is the same as the GGBFS section
OH 2 Evaluation of Alternative Dowel Bars
Three types of dowel bars were used in the dowel bar project epoxy-coated steel dowel bars fiberglass dowel bars (manufactured by RJD Industries Inc) and stainless steel (type 304) tubes filled with conshycrete The diameter of the steel and fiberglass dowels bars is 38 mm (15 in) while the stainless steel tubes have an outer diameter of 38 mm (15 in) and an inshyner diameter of 34 mm (135 in) (Sargand 2000) All bars are 457 mm (18 in) long
OH 3 JOH 3 Jooint Sint Seal Seal Sttudyudy 260260++000 t0 too 2290+0090+00
End Project STA436+00
End Project STA 436+00
OH 3 Joint SealStudy
154+00 to 231+00 OH 3 Joint Seal Study260+00 to 290+00
OH 2 Dowel Bar Study
104+40 to 154+00
OH 3 Joint Seal Study
154+00 to 231+00 OH 3 Joint Seal Study 260+00 to 290+00
OH 2 Dowel Bar Study
104+40 to 154+00
US 50 EB
OH 1 Control Section (No GGBFS in mix) 92+3425 to 104+40
OH 1 GGBFS Study 104+40 to 436+00
Both Directions
Figure 79 Layout of experimental projects on Ohio US 50
113
762 mm(30 in)
198 m(78 n)
366 m(12 ft)
152 m(60 in)137 m
(54 in)
229 mm (9 in)
640 m(21 ft)
Thermocouples
Table 41 Concrete Pavement Mix Design Used on Ohio US 50 Project
PCC MIX DESIGN COMPONENT QUANTITY
Natural Sand 1437 lbyd3
AASHTO 8 Aggregate 1374 lbyd3
Type I Cement 412 lbyd3
Water 236 lbyd3
Ground granulated blast furnace slag 138 lbyd3
Water Reducer 11 ozyd3
Air Entraining Agent 165 ozyd3
Design Air 8
Design Slump 3 in
Most of the US 50 project contains conventional epoxy-coated steel dowel bars However three
specific test sections each incorporating one of the load transfer devices under study were set up near the western-most limits of the project in the eastbound direction to instrument dowel response and to compare the performance of the different load transfer devices Each test section is made up of six consecutive joints with the middle two joints containing instrumented dowel bars (see Figure 80) The concrete-filled stainless steel bars were not instrumented because the thin wall thickness did not permit the necessary installation operation to protect the lead wires of the gauges (Sargand 2001)
Three dowel bars within each joint are instrushymented The instrumented bars are located at disshytances of 152 mm (6 in) 762 mm (30 in) and 1980 mm (78 in) from the outside edge of the pavement as shown in Figure 81 (Sargand 2000)
DoDowel Test Sectiowel Test Sectionn (6(6 jointsjoints for efor eaach dch doowel twel tyyppee))
21 ft
Traffic
Traffic
21 ft
Traffic
Traffic
InInstrustrummentented Joed Jointsints
Figure 80 Layout of dowel test sections on Ohio US 50 project
TrTraaffffiicc FlowFlow
366 m (12 ft)
Dowel 1Dowel 1
Dowel 2
Dowel 3
InstrumentedDowels
Dowel 2
Dowel 3
152 mm (6 in)
i
Thermocouples
508 mm (20 in)
Joint 1 Joint 2
Dowel 1Dowel 1
Dowel 2
Dowel 3
Instrumented Dowels
Dowel 2
Dowel 3
152 mm (6 in)
762 mm (30 in)
198 m (78 in)
Thermocouples
152 m (60 in)137 m
(54 in)
229 mm (9 in)
508 mm (20 in)
Joint 1 Joint 2
640 m (21 ft)
Thermocouples
Figure 81 Dowel instrumentation layout for Ohio US 50 project (Sargand 2000)
114
Each instrumented dowel bar contained a uniaxial strain gauge on the top and the bottom of the bar and one 45-degree rosette on the side The uniaxshyial gauges measure environmental and dynamic strains while the rosette gauges measure only dyshynamic strains (Sargand 2000)
Two thermocouple units were also installed near each instrumented joint to measure temperatures in the concrete slab One unit housed three sensors that measure temperatures at depths of 102 178 and 254 mm (4 7 and 10 in) from the surface and the second unit consists of a single sensor measuring temperatures at a depth of 25 mm (1 in) below the surface (Sargand 2000)
OH 3 Evaluation of Joint Sealing Materials
The joint sealant test sections are located in both the eastbound and westbound directions and feashyture a total of nine different joint sealants In addishytion several pavement sections containing no sealant are included in the study
Table 42 summarizes the location of the different sealant materials in each direction as well as the joint channel configuration (see Figure 82) used for each material (Hawkins Ioannides and Minkarah 2000) The westbound sections each represent replicate sealant sections of those in the eastbound lanes with the exception of the Watson Bowman WB-687 in the eastbound lanes which was replicated using the Watson Bowman WBshy812 in the westbound lanes (Ioannides et al 1999) The eastbound lanes were sealed in Octoshyber and November of 1997 whereas the westshybound lanes were sealed in December 1998 (silishycone and compression seals) and April 1999 (hotshypoured sealants) (Ioannides et al 1999)
State Monitoring Activities
The Ohio DOT in conjunction with researchers from several State universities monitored the pershyformance of these pavements for 5 years Annual condition surveys and profile measurements were conducted along with special FWD testing on the instrumented joints In addition detailed joint sealant evaluations following SHRP procedures were performed annually on a selected samples of each sealant material
ResultsFindings
Overall pavement performance on this project has been mixed and may be related to the small top size of the coarse aggregate the small percentage of reinshyforcing steel and the poor support from the nonstashybilized bases Specific findings for each specific study are presented in the following sections
OH 1 Evaluation of Ground Granulated Blast Furnace Slag The final report by Sargand Edwards and Khoury (2002) provides the results for this study Several factors related to the performance of the HPC paveshyment containing 25 percent GGBFS have been evaluated with the following results
bull Temperature gradients generated between the top and bottom of concrete slabs during the cure period can have a significant impact on the development of early cracks HPC paveshyment sections placed in October 1997 experishyenced gradients of 10 oC and developed cracking within 18 hours of placement One HPC and one standard pavement section placed in October 1998 experienced gradients of only 5 oC and did not develop cracking The higher temperature gradient in 1997 reshysulted from a cold front that moved in shortly after the placement of the concrete
bull Large values of strain recorded with the vishybrating wire strain gauges and maturity measshyurements indicated that the HP 1 and HP 2 sections could be expected to crack as was observed in the field HP 3 constructed 1 year later of the same concrete mix but during a period of warmer weather did not develop cracks In this case both strain and maturity data collected in the field indicated a low probability of cracking
bull Results from HIPERPAV also suggested that sections HP 1 and HP 2 would crack while HP 3 would not Predicted strength curves were calculated for the placements in addishytion to those provided by the standard HIPERPAV prediction model
115
Table 42 Sealant Materials Used in Joint Sealant Study on Ohio US 50 Project (Hawkins Ioannides and Minkarah 2000)
JOINT SEALANT SEALANT BEGIN END CONFIGURA- SECTION NO OF MATERIAL TYPE STATION STATION TION LENGTH FT JOINTS
Eastbound Direction
TechStar W-050 Preformed 154+00 160+00 5 600 29
No Sealant mdash 160+00 166+00 6 600 29
Dow 890-SL Silicone 166+00 172+00 3 600 29
Crafco 444 Hot Pour 172+00 188+00 1 1600 76
Crafco 903-SL Silicone 188+00 194+00 1 600 29
Watson Bowman WB-687 Preformed 194+00 200+00 5 600 27
Crafco 902 Silicone Silicone 200+00 206+00 1 600 29
Crafco 903-SL Silicone 206+00 213+00 4 700 33
Dow 890-SL Silicone 213+00 219+00 4 600 29
No Sealant mdash 219+00 225+00 2 600 28
Delastic V-687 Preformed 225+00 231+00 5 600 29
Crafco 221 Hot Pour 260+00 266+00 1 600 29
Dow 890-SL Silicone 266+00 272+00 1 600 28
Dow 888 Silicone 272+00 284+00 1 1200 57
Dow 888 Silicone 284+00 290+00 1 600 29
Westbound Direction
TechStar W-050 Preformed 133+60 139+60 5 600 29
No Sealant mdash 139+60 166+00 2 2640 126
Dow 890-SL Silicone 166+00 172+00 3 600 29
Crafco 221 Hot Pour 172+00 188+00 1 1600 76
Crafco 903-SL Silicone 188+00 194+00 1 600 29
Crafco 903-SL Silicone 194+00 200+00 1 600 29
Dow 890-SL Silicone 200+00 206+00 1 600 28
Crafco 444 Hot Pour 206+00 213+00 1 700 33
Dow 888 Silicone 213+00 219+00 1 600 28
Delastic V-687 Preformed 219+00 225+00 5 600 29
Watson Bowman WB-812 Preformed 225+00 231+00 5 600 28
Dow 888 Silicone 260+00 266+00 1 600 29
Crafco 903-SL Silicone 266+00 272+00 4 600 28
Dow 890-SL Silicone 272+00 284+00 4 1200 57
No Sealant mdash 284+00 290+00 6 600 29
116
1 frac12 in
3 frac14 in
18 in
3 frac14 in 3 frac14 in 3 frac14 in
1 frac12 in
3 frac14 in
18 in
1 in
3 frac14 in
18 in
1 frac12 in
3 frac14 in
18 in
3 frac14 in 3 frac14 in 3 frac14 in
1 frac12 in
3 frac14 in
18 in
1 in
3 frac14 in
18 in
1 in
3 frac14 in
18 in
14 - 38 in
14 - 38 in
frac12 inBacker Rod
Detail 1
14 - 38 in
14 - 38 in
frac12 inBacker Rod
Detail 1
1 frac12 in
3 frac14 in
18 in
14 - 38 in
14 - 38 in
frac12 in Backer Rod
Detail 1
333888 plusmnplusmnplusmn 111161616 ininin
DDDDeeee Dtail 3tail 3tail 3tail 3 DDeeetail 5tail 5tail 5
111444 plusmnplusmnplusmn 111161616 ininin
111444 --- 333888 ininin
333161616 --- 555161616 ininin
111888 plusmnplusmnplusmn 111161616 ininin 111888 plusmnplusmnplusmn 111161616 ininin
3 frac14 in 3 frac14 in 3 frac14 in frac14 infrac14 infrac14 in
Backer RodBacker RodBacker Rod
14 plusmn 116 in
14 - 38 in
14 - 38 in
516 inBacker Rod
14 plusmn 116 in
14 - 38 in
14 - 38 in
516 inBacker Rod
14 plusmn 116 in
14 - 38 in
14 - 38 in
516 inBacker Rod
1 in
3 frac14 in
14 plusmn 116 in
14 - 38 in
14 - 38 in
516 in Backer Rod
18 in
38 plusmn 116 in
CompressionSeal
38 plusmn 116 in
CompressionSeal
1 frac12 in
3 frac14 in
18 in
38 plusmn 116 in
Compression Seal
DDDeeetail 2tail 2tail 2 DDDeeetail 4tail 4tail 4 DDDeeetail 6tail 6tail 6
Figure 82 Joint channel configurations used in sealant study on Ohio US 50 project (Hawkins Ioannides and Minkarah 2000)
bull Section HP 3 had less initial warping than did section SP (standard ODOT paving concrete) Sections HP 1 and 2 developed cracking precluding effective curling measurement of these slabs
Based on the laboratory results and field data obshytained in this study the following conclusions were derived (Sargand Edwards and Khoury 2002)
bull Temperature gradients generated between the surface and bottom of concrete slabs during the curing process can have a sigshynificant impact on the formation of early cracks
bull Section HP 3 had less initial warping than did section SP constructed with standard ODOT class C concrete
bull FWD data indicated that under similar loadshying conditions the HP 3 section experienced slightly less deflection at joints than the SP section
bull With limited data available it was suggested that the moisture in the base at sealed and unshysealed joints was similar In some cases however moisture under sealed conditions was observed to be slightly higher indicating that joint seals might trap moisture under the pavement
bull During FWD testing the deflection at sealed joints was generally higher than at unsealed joints
OH 2 Evaluation of Alternative Dowel Bars An analysis of the strains in both the fiberglass and steel dowel bars under environmental and dynamic
117
loading was conducted (ORITE 1998 Sargand evaluation of PCC pavement joints (Sargand 2001) 2000 Sargand 2001) Major findings from that Because of the high bearing stresses that can be gen-analysis include (Sargand 2000 Sargand 2001) erated in concrete surrounding dowel bars this pashy
bull In addition to transferring dynamic load across PCC pavement joints dowel bars serve as a mechanism to reduce the curlshying and warping of slabs due to curing and temperature and moisture gradients in the slabs
bull Steel and fiberglass dowels both experishyenced higher moments from environshymental factors than from dynamic loadshying The dynamic bending stresses induced by a 569 kN (12800 lb) load were considerably less than the environshymental bending stresses induced by a 3 oC (54 oF) temperature gradient
bull Steel bars induced greater environmental bending moments than fiberglass bars
bull Significant stresses were induced by steel dowel bars early in the life of this paveshyment as it cured late in the construction season under minimal temperature and thermal gradients in the slab Concrete pavements paved in the summer under more severe conditions may reveal even larger environmental stresses
bull Both types of dowels induced a permashynent bending moment in the PCC slabs during curing the magnitude of which is a function of bar stiffness
bull Curling and warping during the first few days after concrete placement can result in large bearing stresses being applied to the concrete around the dowels This stress may exceed the strength of the conshycrete at that early age and result in some permanent loss of contact around the bars
bull Steel bars transferred greater dynamic bending moments and vertical shear stresses across transverse joints than fishyberglass bars of the same size
Given these findings it is concluded that the efshyfects of environmental cycling and dynamic loadshying both must be included in the design and
rameter should be considered in dowel bar design especially during the first few days after placement of concrete (Sargand 2001)
It is noted that these results are based on the analysis of the instrumented steel and fiberglass dowel bars only The stainless steel tubes were not instrumented for the reason stated earlier
OH 3 Evaluation of Joint Sealing Materials The results from this experiment through the 2001 performance evaluation have resulted in several obshyservations (Ioannides et al 1999 Hawkins Ioanshynides and Minkarah 2000)
bull The silicone and hot-poured sealants in the eastbound lanes are in fair to poor condition typically suffering from full-depth adhesion failure
bull The worst of the sealed sections were those with a narrow joint width of 3 mm (012 in) In these installations the sealant material had overflowed and run onto the pavement surshyface
bull There is a significant difference in the pershyformance of the same joint seal materials from EB (constructed in 1997) and WB (conshystructed in 1998) This difference is attribshyuted to improvements in installation temperashytures experience and equipment
bull The joints in this experiment were cleaned only by water- and air-blasting even when the sealant manufacturers recommended sand blasting This suggests that some of the adheshysion loss may be due to an inadequate cleanshying process
bull Both the Watson Bowman and the Delastic compression seals have performed by far best overall in both directions In the WB direcshytion the silicones have performed best but were poor in the EB The performance of the hot pour materials is very different being far better in WB in general However the Crafco 221 material did relatively well in one EB test section The TechStar compression seal
118
however has developed significant adheshysion failure and has sunk into the joint
bull The compression seals have performed by far best overall in both directions In the WB direction the silicones have pershyformed best but were poor in the EB The performance of the hot pour materials is very different being far better in WB in general However the Crafco 221 mateshyrial did relatively well in one EB test secshytion
bull Hot pour material appears to have pershyformed better when installed within the manufacturers recommended temperature range No specific temperature range is recommended for the silicone materials
bull Roughness measurements made using PSI IRI and Mays meter do not provide any conclusive trends relating to paveshyment performance
bull Assessment of joint seal efficiency has little relationship to pavement condition at this time It is recommended to reseal the EB sites except for the two compression seals for continued performance monitoring
bull The Techstar W-050 material performed poorly in both directions and is considered unsuitable for pavement applications
bull Currently the unsealed sections seem to have more spalling corner and midslab cracking distress than others although there is no conshyclusive pavement performance related trends as yet
A summary of estimated joint sealant costs on this project is provided in Table 43 (Ioannides et al 1999) These costs are based solely on the material costs themselves and do not include the costs of backer rods adhesives or labor
Table 43 Summary of Sealant Costs on Ohio US 50 Project (Ioannides et al 1999)
MATERIAL UNIT COST ESTIMATED COSTJOINT
Dow 890-SL $4800gal $1227
Crafco 903-SL $3600gal $950
Dow 888 $4200gal $1074
Crafco 902 $3900gal $997
Crafco 444 $1050gal $268
Crafco 221 $025lb $064
Watson Bowman WB-812 $103ft $4326
Watson Bowman WB-687 $072ft $3024
Delastic V-687 $066ft $2772
TechStar V-050 $865ft $36330
119
Points of Contact
Roger Green Ohio Department of Transportation Office of Pavement Engineering 1980 West Broad Street Columbus OH 43223 (614) 995-5993
Anastasios Ioannides University of Cincinnati Department of Civil and Environmental Engineering 741 Baldwin Hall (ML-0071) PO Box 210071 Cincinnati OH 45221-0071 (513) 556-3137
Shad Sargand Ohio University Ohio Research Institute for Transportation and the Environment Department of Civil and Environmental Engineering Stocker Center Athens OH 45701 (740) 593-1467
References
Hawkins B K A M Ioannides and I A Minkarah 2000 To Seal or Not to Seal Con-struction of a Field Experiment to Resolve an Age-Old Dilemma Preprint Paper No 00-0552 79th Annual Meeting of the Transportation Reshysearch Board Washington DC
Ioannides A M I A Minkarah B K Hawkins and J Sander 1999 Ohio Route 50 Joint Sealant ExperimentmdashConstruction Report (Phases 1 and 2) and Performance to Date (1997ndash1999) Ohio Department of Transportation Columbus
Ohio Research Institute for Transportation and the Environment (ORITE) 1998 Measurement of Dowel Bar Response in Rigid Pavement ORITEshy1 Ohio Department of Transportation Columbus
Sargand S M 2000 Performance of Dowel Bars and Rigid Pavement Draft Final Report Ohio Department of Transportation Columbus
mdashmdashmdash 2001 Performance of Dowel Bars and Rigid Pavement Final Report Ohio Department of Transportation Columbus
Sargand S M W Edwards and I Khoury 2002 Application of High Performance Concrete in the Pavement System Structural Response of High Performance Concrete Pavement Final Report Ohio Department of Transportation Columbus
120
Chapter 28 Ohio 4 (US 35 Jamestown)
Introduction
The Ohio Research Institute for Transportation and the Environment at the Department of Civil Engineering at Ohio University in conjunction with the Ohio Department of Transportation have conducted extensive pavement research activities during the past decade As a part of the TE-30 program this study has undertaken a comparative evaluation of the available nondestructive test deshyvices for measuring the support of subgrade and aggregate base layers of pavement sections The study considers the means and results of data measurements of various testing devices includshying their application and ease of use The test secshytion selected for this project is located on US 35 in Jamestown Ohio (see Figure 83)
Figure 83 Location of OH 4 project
Study Objectives
Variability in pavement support resulting from variations in subgrade and base layer support valshyues result in significant variation in pavement pershyformance Deficiencies relative to design assumpshytions result in reduced pavement performance Conventional laboratory testing has not been efshyfective in capturing field variation The use of nondestructive testing methods to assess paveshyment conditions and to predict pavement performshyance depends upon the quality and reliability of the data obtained
The principal objective of the study is to measure the structural characteristics of the subgrade and base layers on a section of US 35 with various
NDT devices during construction and compare the output from the devices in the context of assessing structural conditions and variability Nondestructive testing was performed using a nuclear density gauge the Humboldt Stiffness Gauge the German plate load device a falling weight deflectometer and a dynamic cone penetrometer
Project Design and Layout
A 6096-m (2000-ft) test section was selected in the eastbound lanes of a 85-km (53-mi) construction project on US 35 in Jamestown Ohio The test locashytion was judged to have relatively uniform topogshyraphical and subsurface soil conditions The paveshyment consists of a four-lane divided highway with two 36-m (12-ft) lanes a 3-m (10-ft) outside shoulshyder and a 18-m (6-ft) inside shoulder The pavement cross section consists of 2286-mm (9-in) JRCP a 1016-mm (4-in) unstabilized drainable base and a 1524-mm (6-in) dense-graded aggregate base all over a prepared subgrade
Subgrade samples were collected and identified as silty clay (AASHTO Classification A-6) with a liquid limit of 228 percent a plastic limit of 167 percent and a plasticity index of 61 percent Laboratory resilshyient modulus tests were conducted in accordance with SHRP Protocol P-46
State Monitoring Activities
Initial moisture and density data were collected along the centerline and right wheelpath of the eastbound driving lane at 152-m (50-ft) intervals with a nuclear density gauge Other nondestructive testing was also typically conducted at intervals of 152 m (50 ft) exshycept for the German plate load test whose testing frequency was increased to 305 (100 ft) because of the time required to conduct each test
Laboratory resilient modulus testing was performed on material samples from the project materials to provide a comparison of results Tests were pershyformed at several confining pressure levels including 207 345 689 1034 and 1379 kPa (3 5 10 15 and 20 lbfin2) The moisture content of the materials is also known to affect the results
121
ResultsFindings
Overall results indicated that each device has a useful function in evaluating subgrade and base uniformity conditions The laboratory resilient modulus test is limited to materials sampled at specific designated locations Additionally the results are very much a function of test conditions The level of confining pressure used during the testing was found to have an effect on the comshyputed modulus values as described by Sargand Edwards and Salimath (2001)
The nuclear density gauge is limited to a layer thickness measurement of 3048 mm (12 in) and greatly affected by nonuniformity within the layshyers tested It is a quick means of controlling the uniformity of material density during construcshytion The density measurements recorded can be correlated with material stiffness
The DCP is a quick automated field test method for evaluating the in situ stiffness of layers in a highway pavement structure It measures the strength and stiffness of subgrade and unstabilized base layers The DCPrsquos ability to penetrate into underlying layers and accurately locate zones of
weakness represent its greatest advantage over other tests considered The automated device includes software for storing and reporting the collected data
The Humboldt Gauge measures stiffness of the upper 1524 mm (6 in) of material by electrical impedance In this respect it is quite different from the other NDT devices considered in this study as the other devices measure the composite response of the upper layer measured and any supporting layers beneath The Humboldt gauge was considered effective for monitoring the integrity of individual material layers as they are being placed
The remaining devices identified significant paveshyment support variation along the length of the test Because the Humboldt Gauge only measures to a depth of 1524 mm (6 in) its variation represented is much smaller than that indicated by the other devices Both stiffness and calculated moduli values were evaluated for each device with sample results proshyvided in Table 44
The large load FWD represented 29483- to 40823shykg (6500- to 9000-lb) loads while the small load repshyresented 15876- to 20412-kg (3500- to 4500-lb) loads
Table 44 Stiffness and Modulus Sample Results from OH 4 Testing
Nondestructive Test Stiffness lbfin Modulus lbfin2
Subgrade (15 stations)
Humboldt Gauge 88758 18750
FWD Large load 249703 22610
FWD Small load 210785 19090
1st Cycle
German Plate 131889 11960
2nd Cycle
153795 13930
Composite Base (16 stations)
Humboldt Gauge 129730 27410
FWD Large load 252747 36220
FWD Small load 257114 40970
1st Cycle
German Plate 67793 16870
2nd Cycle
206533 44500
FWD = falling weight deflectometer
122
The FWD and the German plate load test are conshysidered effective for measuring the total composshyite stiffness of the in situ pavement structures Comparisons of the devices and the Humboldt Gauge are difficult since each generates load difshyferently to a different depth and uses different equations to convert surface deflections to layer modulus The dynamic loading applied by the FWD typically results in higher material stiffness than static loads used in the German plate test The Humboldt Gauge produces small excitations which limits its depth of effectiveness
Points of Contact
Roger Green Ohio Department of Transportation Office of Pavement Engineering 1980 West Broad Street Columbus OH 43223 (614) 995-5993
Shad Sargand Ohio University Ohio Research Institute for Transportation and the Environment Department of Civil and Environmental Engineering Stocker Center Athens OH 45701 (740) 593-1467
The FWD has a definite advantage over the plate load testing because of its speed of testing The plate load test is much more labor intensive and requires more test time at a single location The DCP is considered useful for identifying and locating the cause(s) of low stiffness identified with FWD results which will likely cause premature failure within a pavement structure
Reference
Sargand S M W F Edwards and S Salimath 2001 Evaluation of Soil Stiffness Via Non-destructive Testing Final Report Ohio Department of Transportashytion Columbus
123
Chapter 29 PENNSYLVANIA 1 (SR 22 Murrysville)
Introduction
Pennsylvaniarsquos first project to be funded in part under the TE-30 program will be on Section B01 on SR 22 in Murrysville just east of Pittsburgh (see Figure 84) This project is unique in that is a cooperative effort with the public (Pennsylvania Department of Transportation [PENNDOT] and FHWA) and private sector (Mascaro Construcshytion) as well as academia (University of Pittsshyburgh) The project will be constructed in the fall of 2004
Figure 84 Location of PA 1 project
Study Objectives
One of the primary objectives for this project is to evaluate HIPERPAV a computer program that can be used to evaluate the early-age behavior of concrete pavements This study will evaluate the ability of HIPERPAV to predict strength gain and to model early-age stress development Other obshyjectives of particular interest to PENNDOT inshyclude addressing needs for the new mechanistic-empirical pavement design guide Six additional objectives will be addressed in this study
1 Characterize thermal gradients throughout the pavement structure
2 Characterize moisture gradients throughshyout the pavement structure
3 Quantify construction curling and seashysonal and diurnal curling
4 Develop suitable strength correlations
5 Monitor slab performance over time
6 Characterize slab response to environmental and applied loads
Project Design and Layout
Four test cells will be constructed on a four-lane dishyvided highway The project layout is provided in Figshyure 84 and a summary of the design features for each cell is provided in Table 45
The types of instrumentation to be installed on this pavement project include the following
bull Environmental Sensors o Moisture gauges o Thermocouples o Time domain reflectometers
bull Static Sensors o Static strain gauges o Static pressure cells
bull Dynamic Sensors o Dynamic Strain gauges o Dynamic pressure cells
Environmental and static data collection will be automated and collected every 15 minutes Dynamic data will be collected manually All data will be stored in a database housed at the University of Pittsshyburgh
State Monitoring Activities
The test sections will be monitored seasonally by the University of Pittsburgh This will include making Dipstick measurements performing distress surveys and collecting dynamic strain data from various truck types weights and axle configurations Ride data and FWD testing will be performed by PENNDOT Seashysonal monitoring will be performed for 4 years
Preliminary ResultsFindings
No preliminary results are available
124
Table 45 Design Features for the PA 1 Project
DESIGN FEATURE CELL 1 CELL 2 CELL 3 CELL 4
Pavement type JPCP JPCP JPCP JPCP
Tie bars Yes No No Yes
Dowel bars 125 in No No 125 in
Slab thickness 12 in 12 in 12 in 12 in
Base type Asphalt treated Asphalt treated Asphalt treated Asphalt treated
Lane width 12 ft 12 ft 12 ft 12 ft
Dynamic sensors Yes Yes No No
Static and environmental sensors No No Yes Yes
Point of Contact
Julie M Vandenbossche University of Pittsburgh 934 Benedum Hall 3700 Ohara St Pittsburgh PA 15261 (412) 624-9879 jmvengrpittedu
125
90 29
South Dakota 1US 83 Pierre
90 29
Chapter 30 SOUTH DAKOTA 1 (US Route 83 Pierre)
Introduction
In the early 1990s the South Dakota Department of Transportation (SDDOT) investigated the use of non-metallic fiber reinforced concrete (NMFRC) on several small bridge and highway applications (Ramakrishnan 1995 Ramakrishnan 1997) Although the NMFRC performed well in each application a strong need for additional inshyformation on the design construction and pershyformance of NMFRC pavements was identified Thus this project located on US 83 northeast of Pierre (see Figure 85) was constructed in 1996 under the TE-30 program to allow on a larger scale the evaluation of NMFRC pavements with different slab thicknesses joint spacings and the need for transverse joint load transfer (Ramashykrishnan and Tolmare 1998)
83
Pierre
83
90 29
8383
South Dakota 1 US 83 Pierre
Pierre
8383
Figure 85 Location of SD 1 project
Study Objectives
In order to more fully assess the suitability of NMFRC in full-depth concrete this project
was constructed to accomplish the following objecshytives (Ramakrishnan and Tolmare 1998)
bull Develop NMFRC full-depth pavement deshysigns that will enhance PCC pavement pershyformance including appropriate slab thickshynesses joint load transfer designs and joint spacings
bull Evaluate the constructibility and performance of NMFRC full-depth pavement
bull Evaluate the economic impacts of using NMFRC full-depth pavement
Project Design and Layout
This project was constructed in 1996 on US 83 northshyeast of Pierre between mileage reference markers (MRMs) 144 and 145 (Ramakrishnan and Tolmare 1998) The new pavement is a two-lane roadway (each lane 43 m [14 ft] wide) and was constructed on an existing gravel base course Eight different test sections are included in the project one control secshytion and seven non-metallic fiber reinforced concrete pavement (NMFRCP) sections Figure 86 illustrates the layout of the test sections and Table 46 summashyrizes the design features of the test sections Table 47 presents the experimental design matrix for the proshyject
The NMFRCP sections used polyolefin fibers manushyfactured by the 3M company These fibers are purshyported to provide mechanical improvements to the concrete and are also non-corrodible and resistant to chemicals (Ramakrishnan and Tolmare 1998) The NMFRCP mix design used in this project is shown in Table 48 (Ramakrishnan and Tolmare 1998)
126
225500 fftt 224455 fftt 550000 fftt 11000000 fftt 449900 ftft 550000 ftft 449900 fftt 11229900 fftt
SBSB14 ft14 ft LaneLane
BB FFAA CC DD EE HHGG NB14 ft14 ft NB
LaneLane
SSeeccttion Aion A SSeeccttion Cion C SeSection Ection E SeSection Gction G SeSection Hction H 8 in8 in JJPPCPCP 665 i5 inn NNMMFRFRCPCP 8 in8 in NMNMFRCPFRCP 88 in NMin NMFRCPFRCP 88 iinn NMNMFRCPFRCP
DoDowweeleled Jod Jointsints NoNo DDoowweellss DoDowweeleled Jod Jointsints NoNo DoDowweelsls No DoNo Dowweelsls 2020 fftt JJooiinntt SpSpaciacinngg 3535 fftt JoJointint SpSpacingacing 3535 fftt JoJointint SpSpacingacing NNoo JJooiinntsts3535 fftt JJooiinntt SpSpacaciningg
SeSection Bction B SeSectctioionn DD SeSection Fction F 88 iinn NMNMFRCPFRCP6655 in NMin NMFRCPFRCP 88 iinn NMNMFRCPFRCP
NoNo DowDoweelsls DowDoweelleedd JoJoininttss No DoNo Dowweelsls 2525 fftt JoJointint SpaSpaccinging 2525 fftt JoJointint SpaSpaccinging2525 fftt JoJoinintt SSppaaccinging
Figure 86 Layout of SD 1 test sections (Ramakrishnan and Tolmare 1998)
Table 46 Design Features of SD 1 Test Sections (Ramakrishnan and Tolmare 1998)
TEST SECTION
LENGTH FT
THICKNESS IN
JOINT SPACING FT
VOLUME OF FIBERCONCRETE YD3 TYPE DOWELED
A 1000 JPCP 80 Yes 20 0
B 250 FRCP (25 lbyd3) 65 No 25 173
C 245 FRCP (25 lbyd3) 65 No 35 170
D 500 FRCP (25 lbyd3) 80 Yes 25 346
E 490 FRCP (25 lbyd3) 80 Yes 35 339
F 500 FRCP (25 lbyd3) 80 No 25 346
G 490 FRCP (25 lbyd3) 80 No 35 339
H 1290 FRCP (25 lbyd )3 80 No None 892
Table 47 Experimental Design Matrix for SD 1
JPCP NMFRCP
Doweled Nondoweled Doweled Nondoweled
20 ft Joints
25 ft Joints Section B65-in Slab
35 ft Joints Section C
No Joints
20 ft Joints Section A
25 ft Joints Section D Section F 8-in Slab
35 ft Joints Section E Section G
No Joints Section H
127
Table 48 NMFRCP Mix Design Used in SD 1 Project (Ramakrishnan and Tolmare 1998)
MIX COMPONENT QUANTITY
Cement (Type II) 510 lbyd3
Fly ash (Type F) 112 lbyd3
Water 264 lbyd3
Limestone coarse aggregate 1417 lbyd3
Fine aggregate 1417 lbyd3
Polyolefin fibers 25 lbyd3
Slump 1ndash2 in
Air content 6 + 15 percent
Preliminary ResultsFindings
The monitoring of the design construction and early performance of these pavement sections had led to the following conclusions regarding the use of NMFRC pavements (Ramakrishnan and Tolshymare 1998)
bull The same construction techniques and construction equipment can be used in the batching and placement of fiber-reinforced concrete pavements The only modification needed in the batching procshyess is the addition of a plastic tube to fashycilitate the introduction of the fibers However some additional mixing time may be required for NMFRC pavements
bull No differences in the riding quality of the pavement sections could be established All of the pavement sections met the smoothness criteria for new pavement construction
bull During the construction of these test secshytions both cylinders and beams were cast for later laboratory testing A comparison of the flexural strengths for beams cast from concrete used on different days of
paving is shown in Figure 87 these are the average of three beam breaks for each of the following specimens
ndash ldquoP1rdquo indicates specimens collected from the northbound NMFRC paving operashytions on August 15 1996
ndash ldquoP2rdquo indicates specimens collected from a portion of the southbound NMFRC paving operations on August 26 1996
ndash ldquoP3rdquo indicates specimens collected from the rest of the southbound NMFRC pavshying operations on August 27 1996
ndash ldquoControlrdquo indicates specimens collected from the northbound control section paved on August 15 1996
The strengths of the NMFRC specimens are observed to be greater than that of the control section although on average the percent inshycrease is only about 20 percent However other laboratory tests of toughness impact fatigue endurance limit and post-crack load carrying capacity suggested that the strucshytural properties of the fiber-modified conshycrete had been improved
128
o After about 3 years of service condition surveys of the paveshyment sections revealed that transshyverse cracks had occurred only in the section without joints (section H) These cracks occurred at apshyproximately 26-m (85-ft) intershyvals No other distresses were noted within the pavement secshytions
bull Data from FWD testing showed that the load transfer was less in the NMFRC pavement sections compared to the conshytrol section (see Figure 88) In general the load transfer was less in sections with longer joint spacings thinner slabs or nondoweled joints The longer joint spacshyings of the nondoweled NMFRC paveshyments reduce the effectiveness of the agshygregate interlock at the joints even though they contain fibers This suggests that the doweling recommendations for
Fle
xura
l S
trength
psi
8 0 0
7 0 0
6 0 0
5 0 0
4 0 0
3 0 0
2 0 0
1 0 0
0
bull conventional PCC pavements also apply to fiber reinforced concrete pavements Unforshytunately direct comparisons of load transfer could not be made between the control secshytion and the NMFRC sections because joint spacing was not held constant in the experishymental design
bull The initial cost of the 203-mm (8-in) JPCP was $1836m2 ($1535yd2) whereas the inishytial cost of the 203-mm (8-in) NMFRC was $3457m2 ($2890yd2) (both based on an 85-m [28-ft] wide pavement) A life cycle cost analysis of both designs showed that the conventional design was 61 and 31 percent cheaper than the NMFRC design for analysis periods of 40 and 60 years respectively Nevertheless there may be special design situations in which longer joint spacings thinner slabs or more efficient performance may dictate the use of NMFRC pavements
7 - D a y
2 8 - D a y
P 1 P 2 P 3 C o n t r o l
S p e c im e n D e s ig n a t io n
Figure 87 Summary of flexural strength tests for SD 1 (Ramakrishnan and Tolmare 1998)
129
0
1 0
2 0
3 0
4 0
5 0
6 0
7 0
8 0
9 0
1 0 0
Load T
ransf
er
Effic
iency
S e c t io n S e c t io n S e c t io n S e c t io n S e c t io n S e c t io n S e c t io n S e c t io n
A B C D E F G H
S e c t io n
Figure 88 Load transfer efficiencies for SD 1 sections
Interim ResultsFindings
Distress surveys conducted on these test sections in February 2004 revealed no apparent distress of any kind except for the uncontrolled transverse cracks in section H (Johnston and Huft 2004) The uncontrolled transverse cracks showed no faultshying spalling etc and remained narrow The entire pavement section was uniform in appearance and in good condition (Johnston amp Huft 2004)
Points of Contact
Dave Huft South Dakota Department of Transportation 700 East Broadway Avenue Pierre SD 57501-2586 (605) 773-3292 DaveHuftstatesdus
Venkataswamy Ramakrishnan Department of Civil and Environmental Engineering SD School of Mines and Technology 501 E St Joseph Street Rapid City SD 57701-3995 (605) 394-2403
References
Johnston D and D Huft 2004 Distress Survey Results of the Non-Metallic Fiber Reinforced Concrete Pavement Test Sections on US 83 Eshymail communication from South Dakota Department of Transportation Pierre
Ramakrishnan V 1995 Evaluation of Non-Metallic Fiber Reinforced Concrete in PCC Pavements and Structures Report No SD94-04-I South Dakota Department of Transportation Pishyerre
mdashmdashmdash 1997 Demonstration of Polyolefin Fiber Reinforced Concrete in Bridge Replacement Reshyport No 5095-22 South Dakota Department of Transportation Pierre
Ramakrishnan V and N S Tolmare 1998 Evaluation of Non-Metallic Fiber Reinforced Concrete in New Full Depth PCC Pavements Reshyport No SD96-15-F South Dakota Department of Transportation Pierre
130
Chapter 31 TENNESSEE 1 (I-65 Nashville)
Introduction
Over the past decade significant progress has been made in the development of performance-related specifications (PRS) for the acceptance of newly constructed jointed plain concrete paveshyment (JPCP) A PRS is able to relate the construcshytion acceptance quality characteristics (AQCs) (eg smoothness thickness strength air content and percent consolidation around dowels) to the levels of expected pavement performance and fushyture life cycle costs (LCCs) thus providing the basis for rational acceptance and price adjustment decisions The PRS methodology has been verishyfied through the use of shadow specifications on actual construction projects
In this study the Tennessee Department of Transshyportation (TDOT) is implementing PRS on a field trail basis under a FHWA contract Should the implementation of PRS in this project be successshyful TDOT would be able to use PRS in more proshyjects without outside assistance and would be able to achieve the full benefits of PRS
Study Objectives
The main objective of this project is to evaluate the practicality and effectiveness of PRS for JPCP based on a real-world field trial in Tennessee The long-term benefits of PRS expected to be derived from this project include (Gharaibeh 2003)
bull Better linkage between design and conshystruction
bull Higher quality pavements (through incenshytives)
bull Testing that focuses on key quality charshyacteristics that relate to the pavementrsquos long-term performance
bull Incentives and disincentives that are justishyfied through reductions or increases in life cycle costs
bull Specifications that give contractors more flexibility responsibility and accountability
bull Incentive to contractors to be more innovashytive and more competitive
bull Lower ldquofear factorrdquo for contractors and less administrative complexity for the agency than warrantees
Project Design and Layout
TDOT provided the following candidate projects for the implementation of PRS (Gharaibeh 2003)
bull I-65 north of Nashville This project is ongoshying and consists of widening a 56-km (35shymi) long roadway from 6 to 10 lanes with the existing concrete pavement to be reconshystructed Paving is expected to take place in March or April 2004
bull I-75 north of Chattanooga and I-65 north of Nashville These projects are expected to be let in December 2004 However paving could take place 2 to 3 years after letting
After a project coordination meeting it was recomshymended to TDOT that the most practical option is to implement PRS on a portion of the ongoing I-65 proshyject
State Monitoring Activities
No final decisions have been made regarding the State monitoring activities
Preliminary ResultsFindings
Acceptance test results from three concrete pavement projects that were constructed in Tennessee in the past 5 years were obtained and analyzed The project-wide results are summarized in Table 49 These reshysults will assist in establishing the target values (mean and standard deviation) for the PRS project considering the quality levels achieved in these past projects (Gharaibeh 2003)
131
Point of Contact
Sam Tyson Federal Highway Administration Office of Infrastructure Office of Pavement Technology (HIPT) 400 7th Street SW Washington DC 20590 (202) 366-1326
Reference
Gharaibeh N G 2003 Performance-Related Speci-fications (PRS) Field Trial in Tennessee Quarterly Progress Report to the Federal Highway Administrashytion
Table 49 Summary of Past Concrete Pavement Projects in Tennessee
ATTRIBUTE PROJECT 1 PROJECT 2 PROJECT 3
Tennessee Department of Transportation Identification
SP 33003-4154-04 (Contract No
4359)
IM-40-2(71)87 57001-8172-44
(Contract No 4559)
NH-I-75-1(95)3 33005-3161-44
(Contract No 5356)
Location I-24 Hamilton County
I-40 Madison and Henderson Counties
I-75 Hamilton County
Approximate length mi 276 802 32
Project period 1997-2000 1997 1999-2001
28-day compressive strength lbfin2
Field average 6432 5247 6046
Field standard deviation 892 315 625
Specifications Min 3000 Min 3000 Min 3000
Thickness in
Field average NA NA 1204
Field standard deviation NA NA 011
Specifications NA NA 1200
Air content
Field Average 546 511 514
Field standard deviation 051 011 044
Specifications 3-8 3-8 3-8
PI inmi
Field Average 255 NA 253
Field standard deviation 088 NA 071
Specifications 5 NA 4
132
81
64
64
95
81
64
64
95
Chapter 32 VIRGINIA 1 (I-64 Newport News)
Introduction
Concrete pavements constructed in Virginia over 20 years ago commonly incorporated a 50-mm (2-in) maximum coarse aggregate size in the PCC mix design (Ozyildirim 2000) These pavements genershyally performed well but over time concerns with the availability stockpiling and segregation of the aggregate led to a reduction in the specified maxishymum coarse aggregate size (Ozyildirim 2000) However while smaller coarse aggregate size is inherently more durable concrete using smaller coarse aggregate commonly exhibits greater shrinkshyage (and increased potential for slab cracking) beshycause of increased paste requirements Larger maximum coarse aggregate sizes on the other hand require less paste less cementitious material and less water thereby resulting in reduced shrinkage they also provide increased mechanical interlock at joints and cracks (Ozyildirim 2000)
To investigate the effect of maximum coarse aggreshygate on concrete material properties and pavement performance the Virginia Department of Transporshytation (VDOT) constructed an experimental conshycrete pavement project as part of the TE-30 proshygram The project is located on I-64 near Newport News (see Figure 89) and was constructed in 1998 and 1999 (Ozyildirim 2000)
Virginia 1I-64 Newport News
NewportNews
Richmond
Virginia 1 I-64 Newport News
Newport News
81
64
Richmond64
95
Figure 89 Location of VA 1 project
Study Objectives
The objectives of this project are (Ozyildirim 2000)
bull To develop concrete mixtures that have low shrinkage and high flexural strength
bull To determine the properties of such conshycretes
bull To instrument and test jointed pavement slabs for volumetric changes
bull To determine the air void distribution (inshydicative of consolidation) from cores
Project Design and Layout
This project was constructed on I-64 in Newport News beginning about 24 km (15 mi) west of Route 143 and ending about 16 km (1 mi) east of Route 143 (Ozyildirim 2000) The project involved removing and replacing the two existing traffic lanes in both the eastbound and westbound direcshytions and constructing an additional lane in each direction (Ozyildirim 2000) The nominal pavement design used for these sections is as follows (Ozyshyildirim 2001)
bull 280-mm (11-in) JPCP
bull 75-mm (3-in) asphalt-stabilized open-graded drainage layer (OGDL)
bull 150-mm (6-in) cement-treated subbase
bull 46-m (15-ft) transverse joint spacing
bull Silicone sealant in all transverse joints
bull 32-mm (125-in) diameter epoxy-coated steel dowel bars (511 mm [18 in] long and spaced 300 mm [12 in] apart)
bull Widened slabs (43 m [14 ft]) in the outer traffic lane
133
646 f646 ftt 45450 f0 ftt 374374 fftt
14 f14 ftt
SectSectiioonn 1 W1 WBB SSectectiioonn 2 W2 WBB SectSectiioonn 3 W3 WBB12 f12 ftt
2-2-inin AggrAggregaegattee wwGGGGBBFFSS 1-1-in Ain Aggrggregategatee wwGGGGBBFFSS 1-1-inin AAggrggregategatee wwFFllyasyashh
12 f12 ftt
WesWesttboundbound (N(Noovveemmberber 11998)998) 447272 fftt 495 f495 ftt 515 f515 ftt
12 f12 ftt
SSectectiioonn 3 E3 E SBB Sectectiioon 1n 1 EBEB SSectectiioon 2n 2 EBEB12 f12 ftt
1-1-in Aggrin Aggregaegattee wwFFllyyaass 2-hh 2-inin AggrAggregegatatee wwGGGGBBFFSS 1-1-inin AggrAggregaegattee wwGGGGBBFFSS
14 f14 ftt
EaEastbound (Jstbound (Julyuly 19199999))
NomNomiinnaall PPaavveemmeentnt DDesiesiggnn (a(allll sectisectioonnss)) 11-in11-in JPJPCPCP
3-in3-in AAssphphaltalt OOGGDDLL 6-in6-in CCTTBB
1515-ft-ft JoJointint SSpacinpacingg 1125-i25-inn DoweDowelsls
Three experimental sections were constructed in the westbound lanes in November 1998 and then replishycated in the construction of the eastbound lanes in July 1999 (Ozyildirim 2000) Each of the three sections incorporated a different concrete mix design (Ozyshyildirim 2001)
bull Section 1 EBWBmdashconcrete mixture using a 50-mm (2-in) maximum coarse aggregate and including ground granulated blast furshynace slag (GGBFS)
bull Section 2 EBWBmdashconcrete mixture using a 25-mm (1-in) maximum coarse aggregate and including GGBFS
bull Section 3 EBWBmdashconcrete mixture using a 25-mm (1-in) maximum coarse aggregate and including Class F fly ash This section represents VDOTrsquos current conventional concrete mix design
Figure 90 illustrates the layout of these test secshytions while Table 50 summarizes the concrete mix design information The mix designs for sections 1 and 2 contain 30 percent slag whereas the mix deshysign for section 3 contains 25 percent fly ash The
coarse aggregate was a crushed biotite gneiss and granite whereas the fine aggregate was a natural sand (Ozyildirim 2001) The coarse aggregate used in section 1 was a blend of No 3 and No 57 aggreshygates (Ozyildirim 2001)
Comparing the mix design of section 1 (the larger aggregate) with the mix designs for the other two sections it is observed that the use of the larger agshygregate did slightly reduce the required quantities of water and cementitious materials (Ozyildirim 2000)
Dowel bars were placed in baskets at the predetershymined joint locations prior to the paving operations (Ozyildirim 2001) Transverse joints were cut inishytially 475 mm (019 in) wide to a depth of one-third of the slab thickness (Ozyildirim 2001) A secondary cut was made 2 weeks later to establish the joint reservoir for the silicone sealant
A water-based curing compound was used to cure the pavement except that the appropriate materials could not be obtained during the placement of the westbound lanes (Ozyildirim 2001) Consequently a white plastic sheeting was used to cure the paveshyment for 10 days (Ozyildirim 2001)
Figure 90 Layout of VA 1 test sections (Ozyildirim 2000)
134
MATERIAL SECTION 1
(SLAG MIX 2) SECTION 2
(SLAB MIX 1) SECTION 3 (FLY ASH)
Portland cement quantity lbyd3 (kgm3) 374 (222) 394 (234) 423 (251)
GGBFS quantity lbyd3 (kgm3) 160 (95) 169 (100) mdash
Class F fly ash quantity lbyd3 (kgm3) mdash mdash 142 (84)
Pozzolan quantity lbyd3 (kgm3) 30 percent 30 percent 25 percent
Course aggregate No 357 57 57
Maximum top size in (mm) 2 in (50 mm) 1 in (25 mm) 1 in (25 mm)
Course aggregate quantity lbyd3 (kgm3) 1935 (1148) 1841 (1092) 1841 (1092)
Fine aggregate quantity lbyd3 (kgm3) 1171 (695) 1217 (722) 1229 (729)
Water lbyd3 (kgm3) 243 (144) 249 (148) 249 (148)
Water-to-cementitious materials ratio (wcm) 045 044 044
Admixtures Air entraining agent + retarder
Air entraining agent + retarder
Air entraining agent + retarder
Table 50 Concrete Mix Designs Used in VA 1 Project (Ozyildirim 2000)
During construction one outside slab in each of the three sections in the westbound lanes was inshystrumented to record strains displacements and temperatures in the slab (Ozyildirim 2000) Two vibrating wire strain gauges were placed in the middle of each slab one 38 mm (15 in) from the top of the slab and one 38 mm (15 in) from the bottom of the slab (Ozyildirim 2000) Two addishytional vibrating wire strain gauges were tied to two stainless steel stakes and driven into the base (Ozyildirim 2001) The gauges were placed 2 m (65 ft) from the outside edge to avoid the vibrator of the paver (Ozyildirim 2001)
Two linear variable differential transformers (LVDTs) were installed in each of the slag conshycrete pavement sections to measure vertical disshyplacements due to curling (Ozyildirim 2001) One LVDT was placed at the center of the slab and the other 280 mm (11 in) from the joint (Ozyildirim 2001)
Type T thermocouples were placed at each locashytion in the slab where the vibrating gauges were placed The thermocouples were placed at 6 mm (025 in) 76 mm (3 in) 140 mm (55 in) 203 mm (8 in) and 273 mm (1075 in) above the base (Ozyildirim 2001) In addition the vibrating
wire gauges included thermistors that provide temshyperatures at the each location (Ozyildirim 2001)
Finally 10 consecutive joints in each section were instrumented to monitor transverse joint movements (Ozyildirim 2001) Gauges were placed on either side of the joints 1 week after paving (Ozyildirim 2001)
State Monitoring Activities
During and immediately after construction VDOT conducted an evaluation of the fresh and hardened concrete properties of each pavement section Table 51 summarizes some of the selected concrete propershyties obtained from the monitoring Both the fresh concrete properties and the hardened concrete propershyties generally met design requirements but there was a noticeable difference in the properties of the mixshytures between the westbound and eastbound lanes Generally speaking the westbound lanes had lower strengths and higher air contents than the eastbound lanes
Comparisons of the different mixes show that the slag mixes (sections 1 and 2) have higher strengths than the fly ash mixes Interestingly the section 2 mixes had higher strengths than the section 1 mixes even though the section 1 mixes had a larger coarse aggregate size
135
SECTION 1 (2-IN AGG WSLAG)
SECTION 2 (1-IN AGG WSLAG)
SECTION 3 (1 IN AGG WFLY ASH)
SPECIMEN SIZE IN CONCRETE PROPERTY EB WB EB WB EB WB
Fresh Concrete
Slump in
Air
Concrete temperature oF
Unit weight lbyd3
Hardened Concrete
28-day compressive strength lbf
28-day flexural strength lbfin2
Permeability coulombs
1-year shrinkage
Freeze-Thaw Data at 300 cycle
Weight loss
Durability rating
6 x 12
6 x 6 x 20
4 x 4
6 x 6 x 200
088
430
865
1456
5446
704
1364
0041
150
525
67
1442
4530
670
1774
0052
188
495
855
1470
5540
783
1548
0044
125
580
68
1456
4625
685
1672
0059
150
420
820
1476
4612
mdash
680
mdash
125
545
67
1438
3920
mdash
1265
mdash
in2
s (ASTM C 666 Procedure A except air dried 1 week and 2 NaCl in test solution)
53
69
40
91
23
88
60
89
116
82
141
83
The chloride ion permeability test measures the electrical conductance of a sample and VDOT specifies a maximum of 3500 coulombs (Ozyshyildirim 2001) All of the mixtures exhibit permeshyabilities much less than that value with the fly ash mixtures the lowest of all of the mixtures All of the sections exhibited similar shrinkage values with the section 1 mixture (containing the largest maximum coarse aggregate size) exhibiting the least amount of shrinkage
The acceptance criteria for freeze-thaw data shown in Table 51 are a weight loss of 7 percent or less and a durability factor of 60 or more (Ozyshyildirim 2001) All mixtures complied with these requirements except the fly ash mixtures exceeded the allowable weight loss However this is a seshyvere test and the fly ash mixtures are expected to
perform satisfactorily in the field provided that they have adequate strength and an adequate air void sysshytem (Ozyildirim 2001)
Monitoring of the instrumented slabs was conducted during the first several weeks after construction along with transverse joint movements Generally larger thermal gradients were observed for section 2 but all of the differences were really quite small (Ozyildirim 2001) Section 1 (larger aggregate) showed less curling than section 2 but again the difshyferences were small (Ozyildirim 2001) Limited FWD testing showed nearly identical load transfer efficiencies of 85 85 and 88 percent for section 1 2 and 3 respectively (Ozyildirim 2001)
Table 51 Summary of Concrete Properties Measured on VA 1 Project (Ozyildirim 2000)
136
After 2 years and 6 months of service respecshytively both the westbound sections and the eastshybound sections are in excellent condition with no distress or scaling (Ozyildirim 2001) VDOT will continue monitoring the performance of these pavements and will produce a final report in 2004 (Ozyildirim 2000)
Preliminary ResultsFindings
This project has illustrated that air-entrained pavshying concrete with satisfactory strength low pershymeability and volume stability can be prepared using concrete with Class F fly ash or slag and with 25- and 50-mm (1- and 2-in) maximum size aggregates (Ozyildirim 2000 Ozyildirim 2001) The larger maximum size aggregate is expected to provide better performance in the field and it will be monitored over the next 5 years Although the reduction in water and cement contents was minimal for the mix with the larger sized aggreshygate the use of a more uniform combined grading is expected to reduce water and paste demands (Ozyildirim 2000 Ozyildirim 2001) The instrushymentation did not provide any strong results reshygarding the relative performance of the different pavement sections (Ozyildirim 2000 Ozyildirim 2001)
Project Status
No interim field testing results have been published nor were they available for this update However an additional field evaluation will be conducted in the spring of 2004 that will include FWD and automated distress measurements Results of these field reviews will be included in the final project report that is slated to be complete in August 2004
Point of Contact
Celik Ozyildirim Virginia Transportation Research Council 530 Edgemont Road Charlottesville VA 22903 (434) 293-1977 celikvdotstatevaus
References
Ozyildirim C 2000 Evaluation of High-Performance Concrete Pavement in Newport News VA Draft Interim Report Virginia Transportation Research Council Charlottesville
mdashmdashmdash 2001 ldquoEvaluation of High-Performance Concrete Pavement in Newport News VArdquo Preprint Paper 01-3173 80th Annual Meeting of the Transshyportation Research Board Washington DC
137
Virginia 2Route 288Richmond
81
64
64
95
Virginia 3US 29
Madison Heights
81
64
64
95
Chapter 33 VIRGINIA 2 (Route 288 Richmond) and VIRGINIA 3 (US 29 Madison Heights)
Introduction
VDOT constructed two additional high-performance concrete pavements under the TE-30 program Virginia 2 is located on Route 288 near Richmond and Virginia 3 is located on US 29 near Madison Heights (see Figure 91) These pavements are both continuously reinforced concrete paveshyment (CRCP) designs that are incorporating conshycrete mixtures expected to provide high flexural strengths and low shrinkage
29
MadisonHeights
Richmond288
2929
Virginia 2 Route 288 Richmond
Madison Heights
81
64
Richmond64
95
Virginia 3 US 29
Madison Heights
288288
Figure 91 Location of VA 2 and VA 3 projects
Study Objectives
These two pavement projects share the following objectives
bull Develop concrete mixes that have low shrinkage and high flexural strength
bull Assess aggregate particle shape using a video grader
bull Determine the material properties of high performance concrete including compressive strength flexural strength elastic modulus coefficient of thermal expansion permeabilshyity and drying shrinkage
bull Continuously monitor the speed of the paver and the frequency of the vibrators during the construction of the pavement
bull Investigate the effect of longitudinal steel content on the development of cracking
Curing of the sections (curing compound vs burlap wet cure) may also be investigated as part of the investigation
Project Design and Layout
The project on Route 288 was paved in mid-December 2003 Samples and data were gathered during the construction The paving materials will be tested as per the AASHTO 2002 guidelines No speshycific information regarding the actual pavement conshystruction or the results from any followup testing is currently available
The Madison Heights project (located on US Route 29) has not yet been constructed consequently no information is currently available
State Monitoring Activities
Once these projects are constructed the State will monishytor the performance of the sections for 5 years
Preliminary ResultsFindings
No preliminary results or findings are available
Point of Contact
Celik Ozyildirim Virginia Transportation Research Council 530 Edgemont Road Charlottesville VA 22903 (434) 293-1977 celikvdotstatevaus
138
Chapter 34 Washington 1 (SR 395 Kennewick)
Introduction
Traditionally reconstruction of urban intersecshytions with portland cement concrete pavement (PCCP) requires several weeks and complex trafshyfic management plans However with accelerated paving construction techniques concrete can meet opening strengths in less than 12 hours providing quick public access to a high-quality long-lasting pavement In the fall of 2000 the Washington State Department of Transportation (WSDOT) reconstructed an asphalt concrete (AC) intersecshytion with PCC over a weekend in a 70-hour peshyriod The intersection is located at SR 395 and West Kennewick Avenue in the City of Kenneshywick Washington (see Figure 92) The successful completion of this project demonstrates that conshycrete can be used successfully for the rapid reconshystruction of urban intersections
Figure 92 Location of WA 1 project
Study Objectives
The goal of this project is to develop a body of knowledge and tools for accelerated reconstrucshytion of urban intersections using PCC To achieve this goal three classes of activities were investishygated methods to accelerate the rate of concrete strength gain methods to minimize the construcshytion time and traffic control strategies to minishymize user delay (Nemati et al 2003)
Project Design and Layout
Before reconstruction the HMA pavement exhibited severe rutting as much as 508 to 1016 mm (2 to 4 in) (Nemati et al 2003) Traffic volume passing through the intersection is as high as 30000 vpd inshycluding 20 percent heavy trucks (Nemati et al 2003) A 3-day weekend closure beginning on Thursday evening was adopted for the intersection reconstrucshytion Efforts were focused on the following aspects
Public Relations and Traffic Management Many individuals especially business owners in the affected areas were contacted personally by WSDOT personnel Pre-construction meetings were held with the City council and the public to encourage active involvement of all the affected parties The media was utilized to alert the public to the upcoming conshystruction and to keep them up to date on the schedule A multistaged traffic detour plan was implemented that provided local access access to commercial sites and special routes for heavy trucks passing through the area These activities were aimed at makshying the closures as organized and painless as possible for the public
Concrete Mixture Properties For this project the concrete mix design was critical in maintaining the accelerated schedule ASTM C 150 Type III portland cement was used to provide rapid strength gain Table 52 shows the concrete mix design used in this project while Table 53 shows the characteristics of the concrete delivered to the site (Nemati et al 2003) Figure 93 shows the strength-maturity relationship that was developed for the speshycific concrete mixture used in the intersection reconshystruction (Nemati et al 2003) According to WSDOT requirements a minimum concrete compressive strength of 172369 kPa (2500 lbfin2) must be achieved in order for the intersection to be opened to traffic Figure 93 indicates that this mixture is capashyble of reaching the opening strength approximately 8 hours after placement
139
Construction The contractor prepared and executed an hourly progress schedule during the intersection closure Figure 94 shows the contractorrsquos critical path method schedule (Nemati et al 2003) The apshyproach legs were rebuilt in the days prior to the complete intersection closure A rotomill was used to remove the existing pavement and base at the intersection to a depth of 3048 mm (12 in) which was accomplished in a single pass Conshycrete was placed in alternate sections and then the sides of the newly placed pavements acted as forms for the interim sections In this way a sigshynificant amount of time was saved by not erecting and removing side forms for the interim sections
In this project liquid curing compounds meeting ASTM C309 requirements were applied to the surshyface and exposed edges of the concrete pavement at a rate of one gallon per 139 m2 (150 ft2) The sawcutshyting at the intersection typically began within 6 hours of concrete placement After sawing the joints were sealed with a hot-poured asphaltic material Maturity meters were used in this project to monitor the strength gain in the concrete and determine the appropriate time for stripping forms and opening the pavement to traffic The intersection was opened to traffic on Sunday between 400 pm and 600 pm well ahead of the originally scheduled 600 am Monday morning opening
Table 52 Concrete Mix Design Used on WA 1 Project
MATERIAL TYPE QUANTITY
Cement (lbsyd3) ASTM C150 Type III 705
15 in 940
Aggregate (lbsyd3) 075 in 799
0375-in Pea Gravel 140
Sand (lbsyd3) Coarse
Fine
590
481
Water (lbsyd3) minus 254
Air-entraining admixture (ozyd3) ASTM C260 11
Water-reducing admixture (ozyd3) ASTM C494 303
Set-retarding admixture (ozyd3) ASTM C494 Delvo 176
Table 53 Characteristics of Concrete Used on WA 1
CHARACTERISTIC TEST RESULT
Slump
wc ratio
Air content
Unit weight
Concrete temperature
Air temperature
325 in
036
63 percent
1498 lbft3
85 degF
82 degF
140
WSDOT Strength Requirement for Opening to Traffic
1000
2000
3000
4000
5000
0 8 16 24 32 40 48 56 64 72 80
Time (Hours)
Com
pres
sive
Str
engt
h (p
si)
Figure 93 Strength-time relationship developed for WA 1 project
Figure 94 Contractorrsquos critical path method schedule for WA 1 project
141
Opening) 8 (Excavation) 5 (Grading)
Place Concrete)
ResultsFindings
The reconstruction of the intersection at SR 395 and Kennewick Avenue using accelerated construction techniques and complete weekend closure was completed successfully The intersection was opened to traffic 16 hours ahead of the scheduled opening time The breakdown of the time actually spent on each activity during the reconstruction is shown in Figure 95 (Nemati et al 2003) As a result of the traffic control and public relation manageshyment complaints from the public were reduced by over 70 percent compared to a project constructed 2 years before (Nemati et al 2003) The unit price for reconstruction of the intersection at SR 395 and Kennewick Avenue is 16826m2 ($1558ft2) (Nemati et al 2003)
Construction Activity 2 (Delay) 1 (Closing
4 (Prep For Roadway)
1 (Clean Roadway)
5 (Joint Seal) 1 (Conduit
5 (Clean Repair) Joints)
14 (Cure)
27 (Form amp
11 (Sawcutting)
Closing Roadway Excavation Grading Conduit Repair Form and Place Concrete Sawcutting Cure Clean Joints Joint Seal Clean Roadway Prep Roadway for Opening to Traffic Delay
Figure 95 Breakdown of time consumed by each construction activity on WA 1 project
Points of Contact
Kamran M Nemati University of Washington PO Box 95233 Seattle Washington 98145-2233 (206) 685-4439 nematiuwashingtonedu
Jeff S Uhlmeyer (360) 709-5485 UhlmeyJwsdotwagov
Linda M Pierce (360) 709-5470 PierceLwsdotwagov
Washington State Department of Transportation PO Box 47365 Olympia WA 98504-7365
Reference
Nemati K M J S Uhlmeyer L M Pierce and J R Powell 2003 Accelerated Construction of Ur-ban Intersections with Portland Cement Concrete Pavement (PCCP) Final Report Federal Highway Administration Washington DC
142
Chapter 35 WEST VIRGINIA 1
Introduction
As part of a comprehensive research program invesshytigating the use of glass fiber-reinforced plastic (GFRP) reinforcing bars in concrete pavements the West Virginia University initiated a research study consisting of three research elements (1) construcshytion and evaluation of GFRP-doweled pavement sections (2) investigation of moisture diffusion in GFRP dowels and (3) construction and evaluation of a CRCP pavement section containing GFRP re-bars The use of GFRP bars in lieu of steel bars is expected to alleviate the problems associated with steel corrosion and steel distress At the conclusion of the project a workshop and technology transfer initiative are scheduled to be held
Study Objectives
As mentioned above three separate investigations are being conducted under this research project Specific objectives of each investigation are deshyscribed below
GFRP Dowel Study The objectives of this study are to (Li 2004 Vijay GangaRao and Li 2004)
1 Evaluate the use of GFRP dowel bars as load transfer devices in JPCP under HS-25 static and fatigue loads and compare their response with JPCP consisting of steel dowels This includes the conduct of laboshyratory and field evaluations of JPCP with both GFRP and steel dowels as well as the conduct of analytical modeling of dowel reshysponse in terms of maximum bending deshyflection relative deflection and bearing stress
2 Evaluate the long-term performance of field rehabilitation of JPCP using GFRP dowels
Moisture Diffusion Study This is a laboratory study with the following objecshytives (Gupta Rana and GangaRao 2004)
1 Measure the diffusion coefficients and equilibrium moisture contents and estabshy
lish the mechanism of water diffusion through neat and glass fiber-reinforced DERAKANE 411-350 Momentum vinyl ester resin bars
2 Reduce the diffusion coefficient through GFRPs by dispersing nanoclay in the mashytrix
3 Study the effect of clay loading on the difshyfusion properties of GFRPs by varying the amount of clay (1 2 and 5 percent by weight)
4 Study the effect of alkaline and saline solushytions on the diffusion of water through GFRPs
5 Take scanning electron microscope (SEM) images of damage at the surface of GFRP after prolonged immersion in distilled washyter
6 Determine the changes in tensile strength and impact strength of vinyl ester-clay nanocomposites with varying amounts of nanoclay and correlate the results with available theories
7 Use dynamic mechanical analysis (DMA) to study the structural changes due to imshymersion in distilled water for extended peshyriods
GFRP Rebars in CRCP Study The objectives of this study are to (GangaRao Chen and Vijay 2003 Choi and Chen 2005)
1 Design and construct a CRCP that used GFRP bars for longitudinal reinforcement
2 Evaluate the performance of GFRP-reinforced CRCP in relation to convenshytional steel-reinforced CRCP during the winter and summer seasons in terms of
bull Crack spacing and crack width
bull Crack-cluster ratio and percentage of ldquoYrdquo cracking
143
Both the GFRP-reinforced CRCP and the conventional steel-reinforced CRCP will be constructed on the same project and will share the same pavement thickness base design traffic loadings and environmental conditions
3 Check the existing design and construction methodologies given by the 1993 AASHTO Pavement Design Guide for the performshyance of conventional steel-reinforced CRCP and suggest necessary modifications for CRCP with GFRP reinforcement
Project Design and Layout
GFRP Dowel Study The study of GFRP dowels consists of both laborashytory and field investigations Laboratory tests conshyducted in this study include static and repeated load applications on 2794- and 3048-mm (11- and 12shyin) thick slabs containing both 254- and 381-mm (10- and 15-in) diameter steel and GFRP dowels placed at 1524- and 3048-mm (6- and 12-in) spacshyings
For the field investigation GFRP dowel bars were included the Corridor H project on Rt 219 near Elkins WV Both 254- and 381-mm (10- and 15shyin) diameter GFRP dowels were installed in the field at 1524-2032-2286- and 3048-mm (6- 8- 9- and 12-in) spacings Load calibrated field tests were conducted on these pavements in 2002 and 2003 using a WVDOT truck The 381-mm (15-in) diameter GFRP dowel bars were also utilized for pavement rehabilitation near the junction of Rt 857 and Rt 119 on University Avenue in Morgantown WV Field data collected through automatic data acquisition system included strain and joint deflecshytions (which were used for assessing joint load transfer efficiency) relative deflections across the joints and overall pavement performance
Moisture Diffusion Study Diffusion of water through GFRPs is being studied gravimetrically by performing transient water upshytake experiments on glass fiber-reinforced and non-reinforced nanocomposites in distilled water alkashyline solutions and saline solutions A diffusion mechanism will be proposed for both glass fiber-reinforced and nonreinforced nanocomposites based on the experimental results Equations will also be
proposed to predict the changes in diffusion behavshyior with temperature SEM images will be taken to estimate the damage of the fiber surface after exshytended exposure to distilled water tensile tests and fracture tests will be carried out on nonreinforced nanocomposites with various clay loadings and DMA tests will be carried out to study changes in glass transition temperature (Tg) storage modulus and loss modulus with clay loading Results of these laboratory experiments will be correlated with available theories
GFRP Rebars in CRCP Study Analytical modeling and finite element (FE) analyshysis of CRCP reinforced with GFRP bars have been carried out at WVU (Vijay and GangaRao 1999 Chen and Choi 2002 2003 2004) Based on the laboratory and FE analysis results designs for a GFRP-reinforced CRCP section and a conventional steel-reinforced CRCP control section have been developed but a suitable project site has not yet been identified
Current Project Status Results and Findings
Some preliminary findings and recommendations are available from the study of GFRP dowels (Li 2004 Vijay GangaRao and Li 2004) These are presented below
Findings from GFRP Dowel Study 1 In this research GFRP dowels were found to be
acceptable alternatives to traditional steel dowshyels for transferring joint loads in JPCP paveshyments Joints with GFRP dowels provided adeshyquate deflection load transfer efficiency exceeding the minimum values recommended by AASHTO (75 percent) and ACPA (60 pershycent) in both laboratory tests and field tests
2 GFRP dowel-concrete interfaces in slab 1 and slab 4 after 5 million load cycles were found to be in excellent condition with no visible damage microcracking or separation between the GFRP dowel and surrounding concrete
3 The greater flexibility of the GFRP dowels reshysults in a shorter distance to the point of inflecshytion (no bending in the GFRP dowel) compared to steel dowels The required length of 381-mm (15-in) GFRP dowels is 65 percent of that for
144
a steel dowel with same diameter The required length of a 254-mm (1-in) GFRP dowel is 69 percent of that for a steel dowel with same dishyameter The bearing stress at the joint face is greater with the GFRP dowel compared to a steel dowel
4 Under static load testing slabs with smaller diameter GFRP dowel and shorter spacings provided lower relative deflections than GFRP dowels with larger diameter and longer spacshyings During fatigue loading up to 5 million cyshycles the relative deflection of the slab with smaller GFRP diameter bars and shorter spacshyings and a 1016-mm (04-in) joint width inshycreased from 03251 mm (00128 in) to 20396 mm (00803 in) over a range from 2 million to 5 million cycles whereas the relative deflection of the slab with larger GFRP diameter bars and longer spacings and a 635-mm (025-in) joint width decreased from 0635 mm (0025 in) to 04318 mm (0017 in) over the range from 2 million to 5 million cycles
5 The LTE of slabs with 254-mm (1-in) diameshyter GFRP bars spaced at 1524-mm (6-in) inshytervals was 72 percent after 5 million load cyshycles The LTE of slabs on a strong base and with 381-mm (15-in) diameter GFRP bars spaced at 3048-mm (12-in) intervals was greater than 80 percent whereas the same setshyup on slabs with poor base support conditions exhibited an LTE of 55 percent Hence it is very important to ensure adequate support conshyditions
6 The LTE affects the slab integrity and slab stresses whereas relative deflection affects ride comfort and impact on slab at joints It is imshyportant to consider both LTE and relative deshyflections when the performance of JPCP is evaluated For example at 5 million cycles the slab with 381-mm (15-in) diameter GFRP dowels spaced at 3048-mm (12-in) intervals exhibited 55 percent LTE but its relative deshyflection (04318 mm [0017 in]) was less than that of the slab with 254-mm (1-in) diameter GFRP dowels spaced at 1524-mm (6-in) intershyvals (LTE of 72 percent and a relative deflecshytion of 20396 mm [00803 in])
Findings from GFRP CRCP Study The concrete stresses induced in a GFRP-reinforced concrete slab due to concrete shrinkage or temperashyture variations have been analytically calculated in comparison to those induced in a steel reinforced concrete slab and the validity of the analytical model has been verified numerically and experishymentally The analytical solution indicates that a low Youngrsquos modulus of GFRP rebars results in a stress reduction in concrete slabs The thermal stress in concrete can be either tensile or compresshysive depending on temperature variations the coefshyficient of thermal expansions (CTEs) of the conshycrete and the type of GFRP reinforcement
From comparison with the FE calculation the anashylytical solution of average axial concrete stresses is shown to be valid throughout the longitudinal (x-) direction especially in the vicinity of the slabrsquos middle section where the maximum average axial stresses in concrete appeared Meanwhile the comshyparison also reveals the applicability of the FE method to the CRCP analysis A 5-ft CRCP segshyment FE model was built to simulate the behavior of the CRCP and to study the effects of the CRCP-design considerations (such as the CTE of concrete the subbase friction and the bond-slip between concrete and reinforcement) on the stress developshyment and crack width in the CRCP It is shown that using concrete with a lower CTE reduces the conshycretersquos tensile stress level when exposed to a temshyperature drop and a weaker bond between the conshycrete and reinforcement also decreases the concrete tensile stress level in the CRCP and the tensile reinshyforcement stress level at its cracks With a higher subbase friction the CRCP is more likely to crack from its bottom area since the concrete stress level at the bottom will be higher than that at the top This suggests that one can control crack spacing and crack widths of GFRP-reinforced CRCP by increasing the amount of reinforcement reducing the bond between the concrete and reinforcement or reducing the bond between the slab and the base
From the FE study a feasible longitudinal reinshyforcement design for a 254-mm (10-in) GFRP-reinforced CRCP has been developed by evaluating concrete stress levels in 1-m (35-ft) 15-m (5-ft) and 24-m (8-ft) long CRCP-slab segments Using 6 longitudinal GFRP rebars at 1524-mm (6-in) spacings at the mid-depth of the slab is shown to be an economically feasible design for GFRP-CRCP
145
on the flexible subbase (or lime-treated clay sub-base) In addition 5 GFRP-rebars spaced at 48 in will be adequate as transverse reinforcement
Higher CTE higher Youngrsquos modulus lower tenshysile strength and greater drying shrinkage of the concrete appear to reduce the crack spacing in the CRCP However even though the crack width is generally narrower as the crack spacing is smaller it can open wider after the crack formation stabishylizes This occurs when the ambient temperature and air humidity levels drop enough to cause sigshynificant concrete volume changes such that the crack width of those smaller crack spacing sections will become larger Increased subbase friction levshyels always cause shorter crack spacings followed by a narrower crack width for all cases From the mechanistic analysis results either of the GFRP-CRCPs with the limestone sandstone and siliceous river gravel concrete on asphalt-stabilized subbase seems to perform satisfactorily without raising the GFRP-reinforcement ratio In addition the subbase that can provide a bond-slip of about 1789 kPamm (5000 lbfin2in) is able to guarantee a satisfactory performance of the GFRP-reinforced CRCP with granite concrete
The designs of a 2794-mm (11-in) GFRP-reinforced CRCP and a conventional steel-reinforced CRCP sections were prepared in 2003 The final designs of the sections may vary dependshying upon the location of the experimental sections
Points of Contact
Hota V S GangaRao PhD PE Professor (304) 293-7608 ext 2634 HotaGangaraomailwvuedu
Hung-Liang (Roger) Chen PhD Professor (304) 293-3031 ext 2631 hchenwvuedu
P V Vijay PhD Assistant Professor (304) 293-7608 ext 2660 pvijaywvuedu
Constructed Facilities Center College of Engineering and Mineral Resources West Virginia University Morgantown WV 26506
References
Chen H L and J H Choi 2002 ldquoEffects of GFRP Reinforcing Rebars on Shrinkage and Thermal Stresses in Concreterdquo Proceedings of the 15th ASCE Engineering Mechanics Conference Columbia Unishyversity New York NY
mdashmdashmdash 2004 ldquoEffects of GFRP Reinforcing Re-bars on Shrinkage and Thermal Stresses in Conshytinuously Reinforced Concrete Pavementrdquo submitshyted to ACI Structural Journal American Concrete Institute Farmington Hills MI
Choi J H and H L Chen 2003 ldquoDesign Considerashytions of GFRP-Reinforced CRCPrdquo Field Applications of FRP Reinforcement Case Studies SP-215 Amerishycan Concrete Institute Farmington Hills MI
mdashmdashmdash 2005 Development and Deployment of Second Generation FRP Composite Applied to Concrete Pavements (Task 3 Continuously Rein-forced Concrete Pavement) Draft Final Report for USDOTFHWA Project DTFH61-99-X-0078 Federal Highway Administration Washington DC
GangaRao H V S H L Chen and P V Vijay 2003 Field Implementation and Performance Evaluation of CRCP with FRP Composite Bars West Virginia University Work Plan Federal Highway Administration Washington DC
Gupta R H Rana and H V S GangaRao 2004 Moisture Diffusion through Neat and Glass-Fiber Reinforced Vinyl Ester Resin Containing Nano-Clay Draft Final Report CFC 04-102 Federal Highway Administration Washington DC
Li H 2004 Evaluation of Jointed Plain Concrete Pavement (JPCP) with FRP Dowels Masterrsquos Theshysis West Virginia University Morgantown
Vijay P V and H V S GangaRao 1999 Develop-ment of Fiber Reinforced Plastics for Highway Appli-cation Aging Behavior of Concrete Beams Rein-forced with GFRP Bars CFC-WVU Report No 99shy265 (WVDOH RP T-699-FRP1) West Virginia Deshypartment of Transportation Charleston
Vijay P V H V S GangaRao and H Li 2004 Evaluation of Jointed Plain Concrete Pavements (JPCP) with FRP Dowels Draft Final Report CFC 04-101 Federal Highway Administration Washingshyton DC
146
39
Wisconsin 1Highway 29 WB
Abbotsford
94
94
Original 1994Test Sections
Owen
39
94
94
Chapter 36 WISCONSIN 1 (Highway 29 Abbotsford)
Introduction
In the early 1990s the Wisconsin Department of Transportation (WisDOT) began investigating noise levels produced by concrete pavement finishing practices (Kuemmel et al 2000) In 1994 Wisconshysin constructed 16 concrete pavement sections inshycorporating different experimental textures the reshysults of which led to some preliminary recommendations on concrete pavement surface texturing (Kuemmel et al 1996)
At about the same time several other states (Coloshyrado Iowa Michigan Minnesota and North Dashykota) constructed concrete pavements with experishymental surface texturing and there arose an acute need to uniformly collect and analyze the data from all of the test sections and develop national guideshylines for recommended surface texturing practices To address this need WisDOT and FHWA conshytracted with Marquette University and the HNTB Corporation to collect noise texture and friction characteristics from the now six states and prepare a final report documenting the findings (Kuemmel et al 2000) Concurrently under the TE-30 program additional concrete pavement test sections were constructed in Wisconsin to afford a more complete range of surface textures (Kuemmel et al 2000) These new test sections were constructed in the westbound lanes of Highway 29 west of Abbots-ford (see Figure 96) and are located just east of the original 1994 Wisconsin test sections (Kuemmel et al 2000)
Study Objectives
The major objective of this project is to develop national guidelines for texturing PCC pavements based on national experience (Kuemmel et al 2000) This objective was to be accomplished by performing the following (Kuemmel et al 2000)
bull Construction of 10 additional test sites in Wisconsin
29
MilwaukeeMadison
Abbotsford
Owen
39
Wisconsin 1 Highway 29 WB
Abbotsford
292994
94 MilwaukeeMadison
Abbotsford
Owen
Original 1994 Test Sections
Owen
Figure 96 Location of WI 1 project
bull Measurement of interior and exterior noise levels surface friction and texture on test sites in Wisconsin Colorado Iowa Michishygan Minnesota and North Dakota as well as on 8 of the original 16 Wisconsin test sections
bull Application of Fast Fourier Transform (FFT) methods for both interior and exteshyrior noise measurements to help resolve discrepancies in subjective noise measureshyments
bull Assessment of public perception to road noise through the use of standard audiology testing by a panel of non-highway agency raters
bull Development of recommended pavement textures and demonstration at an open house and workshop near the new Wisconshysin test sections
147
Project Design and Layout
New Wisconsin Sections The 10 new Wisconsin test sections were conshystructed in 1997 in the westbound lanes of Highway 29 west of Abbotsford (Kuemmel et al 2000) These sections are all 16 km (1 mi) long and share the same pavement design differing only surface texture On this project the following 10 surface textures were constructed (Kuemmel et al 2000)
1 Random transverse tining 25-mm (1-in) average spacing (Random 1)
2 Random transverse tining 19-mm (075-in) average spacing (Random 2)
3 Uniform transverse tining 25-mm (1-in) spacing
4 Random 1 skewed tining 16 left hand forshyward (LHF)
5 Random 2 skewed tining 16 LHF
6 Random 1 skewed tining 14 LHF
7 Random 2 skewed tining 14 LHF
8 Random 1 longitudinal tining
9 Random 2 longitudinal tining
10 Uniform longitudinal tining 25-mm (1-in) spacing
All texturing was preceded by a longitudinal turf drag (LTD) and all tining depths were specified to be 3 mm (012 in) (Kuemmel et al 2000)
Additional Analysis Sections Several additional sections both within Wisconsin and from other states were brought into the study to expand the analysis Characteristics of these secshytions are described below
Additional Wisconsin Sections
As previously noted 8 of the 16 original 1994 Wisshyconsin sections were included in this evaluation six other experimental pavement sections from I-43 and four other sections from throughout the State were also included (Kuemmel et al 2000) The surface texturing of these additional Wisconsin sections are described below (Kuemmel et al 2000)
bull Highway 29 Owen
ndash 25 mm (1 in) uniform longitudinal
ndash 25 mm (1 in) uniform skewed 16 LHF 15 mm (006 in) depth
ndash 13 mm (05 in) uniform transverse
ndash 13 mm (05 in) uniform transverse 15 mm (006 in) depth
ndash 19 mm (075 in) uniform transverse
ndash Manufactured random
ndash 25 mm (1 in) uniform transverse (forshymer WisDOT standard)
ndash Skidabrader (a blasted set but uncured PCC pavement with longitudinal turf drag only prior to treatment)
bull I-43 Milwaukee
ndash SHRP AC Pavement (built in 1992)
ndash Standard AC dense-graded pavement (1992)
ndash Standard AC dense-graded pavement (1993)
ndash Stone matrix asphalt (SMA) pavement 16 mm (062 in) top size (1993)
ndash Diamond ground PCC pavement (built in 1978 ground in 1993)
ndash SMA pavement 9 mm (038 in) top size aggregate (1992)
bull Highway 29 eastbound random transverse tining 21 mm (083 in) average spacing (1994)
bull US 51 north of Merrill random transverse tining 25 mm (1 in) average spacing (1996)
bull US 151 near Beaver Dam random transshyverse tining 25 mm (1 in) average spacing (1996)
bull Highway 26 near Jefferson random transshyverse tining 25 mm (1 in) average spacing (1996)
148
Colorado Sections
The Colorado DOT constructed nine test sections on I-70 near Deertrail in 1994 six of which were included in this study (Kuemmel et al 2000)
bull 25 mm (1 in) uniform transverse tining (Colorado DOTrsquos then standard)
bull 19 mm (075 in) average random transshyverse tining (repeating pattern of 16 22 and 19 mm [063 087 and 075 in])
bull 13 mm (05 in) uniform transverse tining
bull 19 mm (075 in) average random transshyverse saw cut (repeating pattern of 16 22 and 19 mm [063 087 and 075 in])
bull 19 mm (075 in) uniform longitudinal saw cut
bull 19 mm (075 in) uniform longitudinal tinshying
LTD preceded all surface texturing and the impresshysions were specified to be 3 mm (012 in) deep and 3 mm (012 in) wide (Kuemmel et al 2000)
Iowa Sections
In 1993 the Iowa DOT constructed nine test secshytions on Highway 163 northeast of Des Moines and the following seven sections were selected for inshyclusion in this study (Kuemmel et al 2000)
bull 13 mm (05 in) uniform transverse 3 to 5 mm (012 to 02 in) deep
bull 19 mm (075 in) uniform transverse 3 mm (012 in) deep
bull 19 mm (075 in) uniform longitudinal 15 mm (006 in) deep
bull 19 mm (075 in) uniform longitudinal 3 to 5 mm (012 to 02 in) deep
bull 19 mm (075 in) variable transverse 3 to 5 mm (012 to 02 in) deep
bull Milled PCC pavement (carbide ground)
bull 13 mm (05 in) uniform transverse sawed
All texturing was preceded by LTD
Michigan Sections
The two sections in the Michigan I-75 experimental project (see chapter 10) were selected for inclusion in this study (Kuemmel et al 2000) These include both a standard texture (25-mm [1-in] uniform transverse tining) and a European exposed aggreshygate surface
Minnesota Sections
Eight pavement sections with various surface texshyturings were included from Minnesota LTD preshyceded all texturing activities for the 8 selected secshytions (Kuemmel et al 2000)
bull US 169 section with 19 mm (075 in) unishyform longitudinal tining (built in 1996)US 169 section with 19 mm (075 in) random transverse tining (1996)
bull US 12 section with 19 mm (075 in) ranshydom transverse tining (1996)
bull Highway 55 with 38 mm (150 in) random transverse tining (built in 1994)
bull I-494 section with longitudinal turf drag only (1990)
bull US 169 section with 38 mm (150 in) ranshydom transverse tining (1994)
bull US 169 section with LTD only (1996)
bull US 169 section with 19 mm (075 in) unishyform longitudinal tining (1996)
North Dakota Sections In 1994 North Dakota constructed nine test sections incorporating different surface texturing on I-94 near Eaglersquos Nest of which six were selected for this study (Kuemmel et al 2000)
bull 25 mm (1 in) uniform skewed tining 16 RHF
bull 19 mm (075 in) uniform transverse tining
bull Variable (26 51 76 and 102 mm [1 2 3 and 4 in]) random transverse tining
bull 13 mm (05 in) uniform transverse tining
149
bull 19 mm (075 in) uniform longitudinal tinshying
bull 25 mm (1 in) uniform transverse tining (for control)
All surface texturing was preceded by LTD
State Monitoring Activities
A total of 57 pavement test sections from 6 states were ultimately included in the study Representing a wide variety of surface textures each of these pavement sections was evaluated in 1999 for the following properties (Kuemmel et al 2000)
bull Interior and exterior noise levels measured with a real-time acoustical analyzer using the FFT analysis
bull Subjective rating of interior noise levels by 24 people on 21 of the test sections The subjecshytive ratings were performed on digital reshycordings of interior noise levels made during the interior noise measurements
bull Surface texture measurements using the FHWArsquos Road Surface Analyzer (ROSAN) Computations of mean profile depth (MPD) and estimated texture depth (ETD) were obshytained from the measurements Sand patch testing providing an estimate of the texture depth was also conducted on most test secshytions in Wisconsin
bull Surface friction collected by the participating SHAs This testing was conducted in accorshydance with ASTM E274 and was conducted in close proximity to the time that the texture and noise measurements were obtained
ResultsFindings
A comprehensive analysis of the noise texture and surface friction data collected from the 57 sections was conducted and yielded the following conclushysions (Kuemmel et al 2000)
bull The depth of the tining varies considerably between pavement test sections as well as within a test section In many cases specishyfied tining depths were not achieved
bull Uniformly tined pavements exhibit discrete frequencies that produce an annoying ldquowhinerdquo to travelers
bull Transversely tined pavements with the widshyest and deepest textures were often among the noisiest
bull AC and longitudinally tined PCC paveshyments exhibit the lowest exterior noise levshyels while still providing adequate texture Longitudinal uniform spacings of 19 mm (075 in) reduce the impact on motorcycles and compact vehicles However splash and spray have been noted to be greater on lonshygitudinally tined pavements
bull The longitudinally tined PCC pavements the randomly skewed (16) tined paveshyments and an AC pavement exhibit the lowest interior noise levels while still proshyviding adequate texture
bull Random transverse tining is very sensitive to the spacing pattern When the spacings become more uniform discrete frequencies may develop resulting in an objectionable whine
bull Randomly skewed (16) tined pavements can be constructed relatively easily exhibit low interior noise levels and no discrete frequencies and have the best subjective ranking They have higher levels of exterior noise than longitudinally tined PCC and AC pavements but lower than random transshyverse PCC pavements They also exhibit good friction and texture
bull The diamond-ground PCC pavement alshythough not as quiet as other PCC paveshyments did not exhibit any predominant freshyquency or spike
Figure 97 summarizes the surface friction data (measured at 64 kmhr [40 mihr] and with a bald tire) collected for the Wisconsin 1 sections (Kuemshymel et al 2000) All but one of these sections exshyhibit friction numbers greater than 40 with the lowshyest exhibited by Section 8 (random longitudinal tining)
Figure 98 shows the relative ranking of the noise levels for all of the different pavement surface texshy
150
8080
FFNN
40 B
40 B
KKeeyy toto WI 1 SeWI 1 Sectictioonnss 11 RanRandom tdom trransansvveerrsse tie tinniingng 2255-m-mm (m (11-shy
iinn) av) avereraaggee spspaciacinng (g (RRandandoomm 1)1)6060 22 RanRandom tdom trransansvveerrsse tie tinniingng 1199-m-mmm
((00775-5-in)in) aavveerraage spage spacciinng (g (RRanandom 2)dom 2) 33 UnifUniformorm trtraannssvverse tierse tiningning 2255-m-mmm (1-(1shy
iinn) spacing) spacing 44 RanRandom 1 skewdom 1 skeweedd titinniingng 16 l16 leefftt hahandnd4040
ffoorwrward (ard (LLHFHF)) 55 RanRandom 2 skewdom 2 skeweedd titinniingng 16 LH16 LHFF 66 RanRandom 1 skewdom 1 skeweedd titinniingng 14 LH14 LHFF 77 RanRandom 2 skewdom 2 skeweedd titinniingng 14 LH14 LHFF
2020 88 RanRandom 1 ldom 1 loonnggiittududiinnaall titiningning 99 RanRandom 2 ldom 2 loonnggiittududiinnaall titiningning 1010UUnifnifoormrm lloongitudinalngitudinal titinniinngg 25-m 25-mmm ((11-shy
iinn) spacing) spacing 00
11 22 33 44 55 66 77 88 99 1100
WWII 11 SeSeccttioion Nn Nuumbemberr
tures in terms of subjective ratings interior noise levels and exterior noise levels (Kuemmel et al 2000)
Based on the results of the data analysis the followshying primary recommendations were developed (Kuemmel et al 2000)
bull If overall noise considerations are parashymount longitudinal tining that provides satshyisfactory friction may be considered A unishyform tine spacing of 19 mm (075 in) will provide adequate friction and according to other studies will minimize effects on small tired vehicles However the safety aspects of longitudinal tining have not been documented
bull If subjective perceptions and texture considshyerations are paramount a randomly skewed (16) textured pavement offset the opposite of any skewing of the transverse joints may be used This pattern achieves the texture and friction of a conventional transversely tined pavement while also obtaining most of the noise reductions associated with longitushydinal tining
bull If texture considerations are paramount and a skewed pattern is impractical randomly spaced transverse tining may be employed However this should be carefully designed and built using a highly variable spacing A 3-m (10-ft) long rake with spacings beshytween 10 and 76 mm (04 and 30 in) deshysigned using spectral analysis is recomshymended and has been successfully tested by three states
bull Diamond grinding if sufficiently deep to remove most of the uniform transverse texshyture can be considered a treatment for PCC pavements with excessive whine
It should be noted that at least one State evaluated the surface texture recommendation presented above but did not achieve low-noise pavements (Scofield 2003) A new technical advisory on pavement surface texture is currently under develshyopment by the FHWA
Figure 97 Surface friction of WI 1 test sections (Kuemmel et al 2000)
151
Points of Contact
Debbie Bischoff Wisconsin Department of Transportation 3502 Kinsman Boulevard Madison WI 53704 (608) 246-7957 debrabischoffdotstatewius
David A Kuemmel (414) 288-3528 davidkuemmelmarquetteedu
Ronald C Sonntag (414) 288-5734 ronaldsonntagmarquetteedu
Marquette University Department of Civil and Environmental Engineering PO Box 1881 Milwaukee WI 53201-1881
References
Kuemmel D A J R Jaeckel A Satanovsky S F Shober and M M Dobersek 1996 ldquoNoise Characshyteristics of Pavement Surface Texture in Wisconsinrdquo Transportation Research Record 1544 Transportashytion Research Board Washington DC
Kuemmel D A R C Sonntag J A Crovetti Y Becker J R Jaeckel and A Satanovsky 2000 Noise and Texture on PCC PavementsmdashResults of a Multi-State Study Report Number WISPR-08-99 Wisconsin Department of Transportation Madison WI (also available at httpchtemarquetteedu noiseamptextureindexhtml)
Scofield L 2003 SR202 PCCP Whisper Grinding Test Sections Final Report Arizona Department of Transportation Phoenix
152
0
2
4
6
8
10
12
14
16
18
20
1 9 mm 1 9 mm S HR P AC P Trans var 2 5 mm Euro p ean 3 8 mm Trans Trans 1 9 M illed Trans 1 3 Gro und 2 5 mm 2 5 mm Truly 1 3 mm 3 8 mm 1 9 mm R and o m 2 5 mm
Ran
k
0
2
4
6
8
10
12
14
16
18
20
1 9 mm 1 9 mm S HR P AC P Trans var 2 5 mm Euro p ean 3 8 mm Trans Trans 1 9 M illed Trans 1 3 Gro und 2 5 mm 2 5 mm Truly 1 3 mm 3 8 mm 1 9 mm R and o m 2 5 mm
Ran
k
154
rraannd o md o m raranndd oo mm 2 6 2 6 5 2 5 2 7 8 7 8 lolo nngg TeTexxtt uurree rraannd o md o m ss aawweed d 1 31 3 mmmm (3(3 -5-5 SS uurfarfaccee mmmm (3(3 -5-5 PP C C PC C P raranndd oo mm (C(C OO SS tt dd )) RR aannd o md o m t rt raannss (( 11 55 raranndd oo mm ununiiffoo rrmm tt rraanns s as s aww t rt raannss s ks keeww 11 66 s ks keeww 11 44 1 0 4 m1 0 4 mmm t rt raannss LL TTDD mmmm mm dmm d )) mm dmm d )) t rt raannss ((ZZiigg nnaag o )g o ) mm dmm d )) t rt raannss t rt raannss cucutt ss
SSuubjbjececttiivvee IInntteerriioror dBdB AA EExxtteerriioror dBdB AA
Figure 98 Relative noise rankings of pavement surface texturings (Kuemmel et al 2000)
39
94
94
Wisconsin 3Highway 29
Hatley to Wittenberg
Wisconsin 2Highway 29 EB
Owen to Abbotsford
39
94
94
Chapter 37 WISCONSIN 2 (Highway 29 Owen) and WISCONSIN 3 (Highway 29 Hatley)
Introduction
In the summer of 1997 WisDOT constructed two experimental concrete pavement projects on Highway 29 to investigate the constructibility and cost effectiveness of alternative concrete paveshyment designs (Crovetti 1999 Crovetti and Bischshyoff 2001) Constructed with partial funding from the TE-30 program one project (designated WI 2) is located in the eastbound lanes of Highway 29 between Owen and Abbotsford while the other project (designated WI 3) is located in both lanes of Highway 29 between Hatley and Wittenberg (see Figure 99) The WI 3 test sections are also part of FHWArsquos ongoing Strategic Highway Reshysearch Program (SHRP) study Because of the similarities and complementary design of these two projects they are considered together in this chapter
29
MilwaukeeMadison
Abbotsford
OwenHatley
Wittenberg
39
292994
94 MilwaukeeMadison
Abbotsford
Owen
Wisconsin 3 Highway 29
Hatley to Wittenberg
Hatley
Wittenberg
Wisconsin 2 Highway 29 EB
Owen to Abbotsford
Figure 99 Location of WI 2 and WI 3 projects
Study Objectives
The overall objective of these projects is to evalushyate the constructibility and cost-effectiveness of alternative concrete pavement designs (Crovetti 1999) Among the different concrete pavement designs and design features being investigated in these projects are (Crovetti 1999)
bull Reduced number of dowel bar across transverse joints
bull Alternative dowel bar materials for transshyverse joint load transfer
bull Variable thickness pavement cross secshytion
Project Design and Layout
Wisconsin 2 The WI 2 project is located only in the eastbound lanes of Highway 29 It was constructed in Sepshytember 1997 and includes both alternative dowel bar materials and alternative dowel bar layouts (Crovetti 1999 Crovetti and Bischoff 2001)
bull Alternative Dowel Bar Materials
ndash Standard epoxy-coated steel dowel bars
ndash Solid stainless steel dowel bars manufactured by Avesta Sheffield
ndash Fiber-reinforced polymer (FRP) comshyposite dowel bars manufactured by Glasforms
ndash FRP composite dowel bars manufacshytured by Creative Pultrusions
ndash FRP composite dowel bars manufacshytured by RJD Industries
ndash Stainless steel tubes filled with morshytar manufactured by Damascus Bishop
bull Alternative Dowel Bar Layouts
ndash Standard dowel layout (dowels spaced at 305-mm [12-in] intervals)
ndash Alternative dowel layout 1 (three dowels in each wheelpath)
154
12 f12 ftt InInner Lanener Lane
SSttaandarndardd DDoowweell LLaayyooutut ((2266 ddoowweelsls at 12at 12-in s-in sppaacings)cings)
AAllteterrnnatiativve Dowe Doweell LayLayout 1out 1 (3 dow(3 doweellss peperr wwhheelpeelpaatthh))
AAlltteerrnnaattiivve De Doowweel Layl Layoutout 22 ((44 dowdoweells in outers in outer wwhheeeelpalpatthh
3 dow3 doweellss in all othein all otherr wwhheeeelplpathsaths))
AAlltteerrnnaattiivve De Doowweel Layl Layoutout 33 ((44 dodowweels in outerls in outer wwhheeeelpalpatthh
3 do3 dowweels in all otherls in all other wwhheeeelpalpatthhss 1 dow1 doweell aatt ououtteer edr edge)ge)
AAlltteerrnnaattiivve De Doowweel Layl Layoutout 44 (3 dow(3 doweellss in allin all wwhheelpeelpaathsths
11 dowdoweell nnearear oouuterter eeddggee))
14 f14 ftt OutOuteer Lar Lanene
ndash Alternative dowel layout 2 (four dowshyels in outer wheelpath three in all other wheelpaths)
ndash Alternative dowel layout 3 (four dowshyels in outer wheelpath three in all other wheelpaths one dowel at outer edge)
ndash Alternative dowel layout 4 (three dowshyels in all wheelpaths one dowel near outer edge)
The alternative dowel bar layouts used on this project are illustrated in Figure 100 These layouts were selected to reduce dowel bar requirements while still maintaining standard placement locashytions used in Wisconsin (Crovetti 1999)
The nominal pavement design for these pavement sections is a 275-mm (11-in) JPCP with skewed variable joint spacing of 52-61-55-58 m (17-20shy18-19 ft) (Crovetti 1999)
The dowel bars were 38 mm (15 in) in diameter and were placed using an automated dowel bar inserter (DBI) The transverse joints were left unshysealed
The pavement was constructed over existing base materials that were salvaged from the in-place structure including 230 mm (9 in) of existing dense-graded crushed aggregate subbase and 125 mm (5 in) of existing dense-graded crushed agshygregate base An additional 50 mm (2 in) of new dense-graded aggregate base was placed prior to the PCC paving
Figure 101 shows the approximate layout of the 11 test and 2 control sections in the WI 2 project using the original section nomenclature adopted by the researchers Nominal 161-m (528-ft) long pavement segments generally consisting of 29 joints were selected from within each test section for long-term monitoring (Crovetti 1999) Table 54 provides the experimental design matrix for the project
Figure 100 Alternative dowel bar layouts used on WI 2
155
SeSeccttiioon CPn CP SSectectioionn 4E4E1111--iinn JPJPCPCP TrTransansiitiontion 1111--iin Jn JPPCCPPFRFRPP CoCompompossiteite BBaarsrs 1111-i-inn JPJPCPCP SStteeleel DDoowweellss((CCrreeaattiivve Pue Pullttrrususiionsons)) StSteeeell DDoowelwelss DoDowweel Layl Layoouutt 44StStanandardard Dd Doowelwel LLaayyououtt StStanandardard Dd Doowelwel LLaayyououtt
SSeeccttion RJion RJDD SeSectctiioonn 3S3S1111-i-inn JPJPCPCP 11-11-iinn JJPPCCPP
(R(RJD InJD Indudustries)stries) FRP CFRP Coompompossiteite BBaarsrs
StStaiainlnlesesss StSteeeell DDoowelwelss StStanandardard Dd Doowelwel LLaayyoutout DDoowelwel LaLayoutyout 33
SSectectioionn 2E2E SeSeccttiioon C2n C2 1111--iin Jn JPPCCPP 11-11-iinn JJPPCCPP
SStteeleel DDoowweellss StSteeeel Dol Dowweellss DoDowweell LayLayoouutt 22 SSttaandarndard Dd Doowewell LLaayyououtt
1212 fftt TrafTrafffiicc
1414 fftt
1818785785 fftt 16121612 fftt 15551555 fftt 16165151 fftt 367367 5959 11226969 16201620 fftt 11556611 fftt 62426242 fftt 53405340 fftt 42184218 fftt 55226688 ftft 66550044 ftft
SeSeccttiion GFon GF 1111-i-inn JPJPCPCP
FRP CFRP Coompompossiteite BBaarsrs (Gla(Glasfsfoorrms)ms)
StStanandardard Dd Doowelwel LLaayyoutout
SeSection 4Sction 4S SSeection 3ction 3EE Sbb Seection 1ction 1EE 1111--iinn JJPPCCPP 11-11-iinn JJPPCC 11PP 11-i-inn JPJPCPCP
SSttaiainlnlesesss StSteeleel DDoowelwelss StSteeeel Dowl Dowee Stlsls Steeeell DDoowelwelss DDoowweell LaLayyooutut 44 DoDowweell LayLayoouutt D33 Doowelwel LaLayyooutut 11
SeSeccttiion C1on C1 SeSeccttiion HFon HF SSectectioionn 3E3Eaa 11-11-iinn JJPPCCPP 11-11-iinn JJPPCCPP 11-11-iinn JJPPCCPP
StSteeeel Dol Dowweellss StStaiainlnleessss StSteeeell TTuubbeess StSteeeel Dol Dowweellss SSttaandandarrdd DDoowewell LaLayouyoutt FilFillleedd wwithith MortaMortarr DDoowelwel LaLayoutyout 33
(Dama(Damascuscus-s-BBiishoshopp)) SSttaandandarrdd DDoowewell LaLayouyoutt
Figure 101 Approximate layout of WI 2 test sections
Table 54 Experimental Design Matrix for WI 2
11-IN JPCP 17-20-18-19 FT JOINT SPACING
Standard Dowel Layout
Alternative Dowel Layout 1
Alternative Dowel Layout 2
Alternative Dowel Layout 3
Alternative Dowel Layout 4
Standard Epoxy-Coated Steel Dowels
Section C1 Section C2
Section 1E Section 2E Section 3Ea Section 3Eb
Section 4E
Solid Stainless Steel Dowels (Avesta Sheffield) Section 3S Section 4S
FRP Composite Dowel Bars (Creative Pultrusions)
Section CP
FRP Composite Dowel Bars (Glasforms) Section GF
FRP Composite Dowel Bars (RJD Industries)
Section RJD
Stainless Steel Tubes Filled With Mortar (Damascus-Bishop) Section HF
156
14 ft Ou14 ft Outsidetside WWiidendened Slabed Slab
12 ft Inne12 ft Inner Laner Lane 1212 ft Outer Laneft Outer Lane
Paint StripePaint Stripe forfor
8 in
11 in
12 ft Lane
Base
PCC SlabDeformed Tie Bar8 in
11 in
12 ft Lane
Base
PCC Slab Deformed Tie Bar
tion
Wisconsin 3 The westbound lanes of the WI 3 project were constructed in June 1997 whereas the eastbound lanes were constructed in October 1997 (Crovetti 1999) The project includes the evaluation of a variable thickness cross section an alternative dowel bar layout and alternative dowel bar mateshyrials The variable thickness cross section uses a 275 mm (11 in) thickness at the outside edge of the outer lane that then tapers to a thickness of 200 mm (8 in) at the far edge of the inner lane (see Figure 102) The goal is the more efficient use of materials in areas subjected to greater trafshyfic loading resulting in more cost-effective deshysigns
The following alternative dowel bar materials are also included on the WI 3 project (Crovetti 1999)
bull Standard epoxy-coated dowel bars
bull FRP composite dowel bars manufactured by MMFG
bull FRP composite dowel bars manufactured by Glasforms
bull FRP composite dowel bars manufactured by Creative Pultrusions
bull FRP composite dowel bars manufactured by RJD Industries
bull Solid stainless steel dowel bars manufacshytured by Slater Steels
The nominal pavement design for these pavement sections is a 275-mm (11-in) JPCP with a unishyform joint spacing of 55 m (18 ft) However as previously described one section has a variable thickness cross section varying from 275 mm (11 in) for the outer lane and then tapering to 203 mm (8 in) at the edge of the inner lane The pavement rests on a 150-mm (6-in) crushed agshygregate base course and the transverse joints conshytain 38-mm (15-in) diameter dowels and are not sealed
Six sections are included in the WI 3 project The approximate layout of the WI 3 sections being monitored is shown in Figure 103 All dowel bars were placed on baskets prior to paving (Crovetti 1999) It is noted that within the section incorposhyrating various FRP composite dowel bars (Section FR) some of the composite dowel bars were imshyproperly distributed between the 37-m (12-ft) and 43-m (14-ft) baskets resulting in different manushyfacturersrsquo bars being placed across some of the inner and outer traffic lanes (Crovetti 1999) The location of the different manufacturersrsquo dowel bars is shown by lane in the blowup illustration in Figure 103
The experimental design matrix for the WI 3 proshyject is shown in Table 55 Most of the dowel mashyterials are placed in the standard dowel layout although one section is placed in alternative dowel layout 1 As previously mentioned all of these sections are included in the SHRP study and the SHRP code is provided in Table 55 for each secshy
Figure 102 Variable cross section used on WI 3
157
SeSeccttiion TRon TR SecSecttiioon Cn C11
8 -8 - 1111 in JPCPin JPCP 1111 iinn JJPPCCPP StSteeeell DDoowelwelss SStteeeel Dowl Doweelsls
SSttananddaarrdd DDoowewell LaLayoyoutut StanStandard Dowdard Doweel Lal Layyoutout
WBWB TTrrafficaffic
1212 fftt 1414 fftt
SeSeccttiion RJon RJDD SSeeccttiioon FRn FR 1111 iinn JJPPCCPP 1111 iinn JJPPCCPP
FFRRP ComP Comppositeosite DDoowweelsls ((RRJD InJD Indudustrstriies)es)
FFRRP ComP Comppositeosite DDoowweelsls (Glasf(Glasfororms Crms Creaeatitivvee
StanStandard Dowdard Doweel Lal Layyoutout PuPultrltruusiosionns Ms MMMFFGG)) StanStandard Dowdard Doweel Lal Layyoutout
InInnerner LLaneane MMMMFFGG GlasGlas GlasGlas MMFMMFGG ++
GlasGlas CPCP
SeSectctiioonn 11EE 1111 iinn JJPPCCPP
SStteel Doweel Doweelsls DoDowweel Lal Layyoouutt 11
1414 fftt
1212 fftt
EBEB TTrraffiafficc
SeSeccttiion SSon SS 1111 iinn JJPPCCPP
SSoolliid Sd Sttaaiinlnlesesss SStteeeell DDoowewellss StanStandard Dowdard Doweel Lal Layyoutout
OuteOuterr LLaneane MMMMFFGG MMMMFFGG MMMMFFGG CCPP CPCP
1 Jo1 Joiinntt 11 JoinJointt 225252 fftt 180180 fftt 110808 fftt
Figure 103 Approximate layout of WI 3 monitoring sections
11-IN JPCP 18-FT JOINT SPACING
8- TO 11-IN JPCP 18-FT JOINT SPACING
Standard Dowel Layout
Section TR (SHRP 550263)
Standard Dowel Layout
Section C1 (SHRP 550259)
Section SS (SHRP 550265)
Section FR (SHRP 550264A)
Section RJD (SHRP 550264B)
Alternative Dowel Layout 1
Section 1E (SHRP 550260)
Standard Epoxy-Coated Steel Dowels
Solid Stainless Steel Dowels (Slater Steels)
FRP Composite Bars (MMFG Glasforms Creative Pultrusions)
FRP Composite Dowel Bars (RJD Industries)
Table 55 Experimental Design Matrix for WI 3
158
State Monitoring Activities
WisDOT in conjunction with Marquette Univershysity is monitoring the performance of these pavement test sections Four types of monitoring activities are used (Crovetti 1999 Crovetti and Bischoff 2001)
bull Dowel bar location studymdash2 months after construction
bull FWD testingmdashimmediately prior to pavshying immediately after paving and after 6 and 12 months of trafficking
bull Distress surveysmdashimmediately after pavshying and after 6 and 12 months of traffickshying The distress surveys are being conshyducted over a nominal 161-m (528-ft) pavement segment selected from within each test section
bull Ride quality surveysmdashusing a pavement profiler and measured on the sections afshyter approximately 1 and 3 years of sershyvice
Continued monitoring of these sections in the form of FWD testing distress surveys and ride quality surveys will continue through 2004 (Crovetti and Bischoff 2001)
Preliminary ResultsFindings
Even though these sections are only 3 years old some significant findings have been revealed through their early monitoring These findings are described in the following sections by type of monitoring activshyity
Construction Monitoring A dowel bar inserter (DBI) was used during the conshystruction of WI 2 The DBI easily accommodated the various types of dowel bar materials used in the study and the various dowel layout patterns with minimal disruption to the paving operations (Crovetti 1999)
Dowel Bar Location Study With the purpose of determining the depth longitushydinal position and transverse position of each dowel bar a dowel bar location study was performed on the WI 2 project 2 months after construction using an impact echo device (Crovetti 1999) A summary of the study results are provided in Table 56 (Crovetti 1999) Generally it appears that the dowel bars are slightly deeper than the mid-depth of the slab (140 mm [55 in]) and that some vertical skewing of the dowels occurred across the joint It should be noted that dowel depth data were inconclusive for the stainless steel tubes and the solid stainless steel dowshyels and that the device could not provide exact longishytudinal and transverse positions of each dowel end (Crovetti 1999)
Table 56 Summary of Dowel Bar Location Study Results From WI 2 (Crovetti 1999)
TEST SECTION NO OF JOINTS
TESTED
AVERAGE DEPTH WEST SIDE OF
JOINT IN
AVERAGE DEPTH EAST SIDE OF
JOINT IN AVERAGE DEPTH
VARIATION IN
C1 (epoxy-coated steel dowel) 1 604 586 018
CP (FRP composite dowel) 2 617 597 021
GF (FRP composite dowel) 5 612 600 047
RJD (FRP composite dowel) 7 604 605 020
159
FWD Testing FWD testing has been conducted several times since the construction of these test sections Table 57 summarizes the backcalculated k-value and concrete elastic modulus as well as the total joint deflection (defined as the sum of the deflections from both the loaded and unloaded sides of the joint) obtained from the FWD testing (Crovetti 1999) Generally the test results are fairly consisshytent over time although greater variability was noticed in the June 1998 tests for both directions presumably because of higher slab temperature gradients (Crovetti 1999) Apparent increases in total joint deflections may be due to FWD testing conducted in the early morning when upward slab curling is likely
Transverse joint load transfer efficiencies were also measured on all test sections using the FWD Figure 104 illustrates the average transverse joint load transfer for the outermost wheelpath of the WI 2 project while Figure 105 illustrates the avshyerage transverse joint load transfer for the outershymost wheelpath of the WI 3 project (Crovetti 1999) For WI 2 the late season tests (October 1997 and November 1998) indicate significantly reduced LTE in the composite doweled sections and in dowel layout 1 as compared to the control sections (Crovetti 1999) The LTE measured in the summer do not indicate any significant differshyences within the test sections probably because of the increased aggregate interlock brought about by the closing of the joints due to the warmer temshyperatures (Crovetti 1999) Overall the low LTE values of the FRP bars (between 60 and 75 pershycent in many cases) is a cause of concern
For WI 3 Figure 105 shows that the FRP composite dowel sections and dowel layout 1 experience a reshyduction in LTE in the November 1998 test results there is also a slight reduction in the LTE of the stainless steel section (Crovetti 1999) Again howshyever the lower LTE values for the FRP bars are a concern
Distress Surveys Distress surveys were conducted for both WI 2 and WI 3 in June and December 1998 Some joint distress (spalling chipping and fraying of the transverse joints) was observed and is primarily attributable to the joint sawing operations that dislodged aggregate particles near the joint faces (Crovetti and Bischoff 2001) However this joint spalling has not yet proshygressed to the point to be considered as low severity based on the Wisconsin DOT Pavement Distress guidelines (Crovetti and Bischoff 2001) Other than the minor joint spalling no transverse faulting slab cracking or other surface distress has been observed to date (Crovetti and Bischoff 2001)
Ride Quality Surveys Figure 106 presents the average international roughshyness index (IRI) measurements in the outer lane of the WI 2 and WI 3 pavement sections (Crovetti and Bischoff 2001) These measurements were recorded in the summer of 1998 and the winter of 2000 Alshythough there is some variability in the data most of the test sections are performing comparably to the control sections (Crovetti and Bischoff 2001)
Table 57 Summary of FWD Test Results for WI 2 and WI 3 Projects (Crovetti 1999)
WI 2 WI 3
EB LANES EB LANES WB LANES PROPERTY Oct 97 Jun 98 Nov 98 Oct 97 Jun 98 Nov 98 Jun 98 Nov 98
Dynamic k-value lbfin2in 312 255 254 364 324 324 255 222
PCC Elastic Modulus lbfin2 3560000 3870000 4820000 3970000 5990000 6060000 5290000 6130000
Total 9000-lb Joint Deflection mils 896 777 818 670 556 848 623 711
160
1 0 0
9 0
8 0
7 0
6 0
5 0
4 0
3 0
2 0
1 0
0
Load T
ransf
er
Effic
iency
C 1 C P G F R J D H F 3 S 4 S 4 E 3 E 2 E 1 E C 2
T e s t S e c t io n
Oct 97 Jun 98 Nov 98
Points of Contact
Debbie Bischoff Wisconsin Department of Transportation 3502 Kinsman Boulevard Madison WI 53704 (608) 246-7957
James A Crovetti Marquette University Department of Civil and Environmental Engineering PO Box 1881 Milwaukee WI 53201-1881 (414) 288-7382
References
Crovetti J A 1999 Cost Effective Concrete Pave-ment Cross-Sections Report No WISPR 12-99 Wisconsin Department of Transportation Madison
Crovetti J A and D Bischoff 2001 ldquoConstruction and Performance of Alternative Concrete Pavement Designs in Wisconsinrdquo Preprint Paper No 01-2782 80th Annual Meeting of the Transportation Research Board Washington DC
Figure 104 Transverse joint load transfer for outermost wheelpath on WI 2 (Crovetti 1999)
161
1 0 0
9 0
8 0 y
cen 7 0
ici 6 0 f
Ef
5 0
er
f 4 0 sn
ar 3 0
Td 2 0
ao
L 1 0
0
R J D F R S S 1 E C 1 T R
T e s t S e c t io n
Oct 97 Jun 98 Nov 98
IRI
inm
i
110
100
90
80
70
60
50
40
30
20
10
0
1998 2000
C1 1E 2E 3Ea 4E 4S 3S 3Eb HF RJD GF CP C2 1E FR RJD SS TR C1
Wisconsin 2 Sections Wisconsin 3 Sections
Figure 105 Transverse joint load transfer for outermost wheelpath on WI 3 (Crovetti 1999)
Figure 106 Average IRI values in the outer traffic lanes of WI 2 and WI 3 pavement sections (Crovetti and Bischoff 2001)
162
Chapter 38 WISCONSIN 4 (I-90 Tomah)
Introduction
In September 2002 the Wisconsin Department of Transportation (WisDOT) constructed a high pershyformance concrete pavement section with a design life of 50 years with no maintenance anticipated over that period The project is located on I-90 in Monroe County immediately west of the intersecshytion with STH 16 and approximately 129 km (8 mi) west of the split in Tomah of I-90 and Ishy94 The test sections are located in the eastbound lanes with the termination of the test sections at structure B-41-111 The general project location is illustrated in Figure 107
Figure 107 Location of WI 4 project
Study Objectives
The objective of this study was to construct a pavement that would last for 50 years Specific design factors considered were
bull The use of deicing agents especially salts may cause premature pavement failure due to determination of the load transfer devices made of plain and epoxy-coated steel
bull Slab curling is also a cause of premature pavement failure One key to a long-life pavement is that the pavement is built
upon a firm foundation and remains in conshytact with such Concrete pavements respond to the environment by changing in three ways built-in curvature temperature curling and moisture warping When the slab is curled away from the foundation premature cracking may result from stresses incurred
Some of the benefits of providing this type of techshynology to Wisconsin are the anticipated lower longshyterm pavement maintenance costs and reduced rehashybilitation and replacement costs due to a longer initial service life Wisconsin is also beginning to focus on user cost delays If a longer lasting pavement is deshyveloped and placed user cost delays will decrease as well as increasing safety by reducing the exposure of construction and maintenance crews to traffic
Project Design and Layout
The test sections are located in the two eastbound lanes of I-90 The project was split into two test secshytions and one control section as follows (Kemp 2004)
bull Test section 1 is 227 m (745 ft) long with two 36-m (12-ft) lanes and tied concrete shoulders (inside shoulder 12 m (4 ft) wide and outside shoulder 3 m (10 ft) wide)
bull Test section 2 is 2423 m (795 ft) long with two 36-m (12-ft) lanes and tied concrete shoulders (inside shoulder 12 m [4 ft] wide and outside shoulder 3 m [10 ft] wide) Stainless steel dowels were used for the load transfer devices utilizing a non-corrodible basket system for the test sections Shoulders were tied to the pavement using stainless steel tie bars
bull The control section is 2423 m (795 ft) long with two 36-m (12-ft) lanes and asphaltic shoulders (inside shoulder 12 m [4 ft] wide and outside shoulder 3 m [10 ft] wide) Epshyoxy-coated dowels placed in standard steel baskets were used for load transfer at the joints
163
The current WisDOT pavement design guidelines specify a structure with the following characterisshytics will be suitable for pavements with a 20-year pavement life
bull 3048-mm (12-in) thick doweled JPCP
bull 1016-mm (4-in) open-graded base course
bull 1524-mm (6-in) dense-graded base course
The 50-year design had the following characterisshytics
bull 3429-mm (135-in) doweled JPCP
bull 1016-mm (4-in) open-graded base course (No2)
bull 1524-mm (6-in) dense-graded base course
In addition to the standard design an increased base section was engineered to carry the improved pavement section This is to provide a more static base than the standard base and original subgrade The section has the following properties
bull 3429-mm (135-in) doweled JPCP
bull 1016-mm (4-in) open-graded base course (No 20)
bull 254-mm (10-in) dense-graded base course (a two-layer system with the first 1524 mm [6 in] being a 762-mm [3-in] maximum size and the remaining 1016shymm [4-in] being a 381-mm [15-in] maximum size well graded base course)
bull 4064-mm (16-in) of breaker run
State Monitoring Activities
The test section is monitored using Wisconsinrsquos Pavement Monitoring Van This van is equipped with laser sensors to measure the profile The lashyser measurements are used to calculate an Internashytional Roughness Index (IRI) The van is also equipped with video cameras that are able to log the section of the highway of interest and later analyzed for pavement distress The results of the
analysis are used to calculate a Pavement Distress Index (PDI)
A fatigue life will be calculated based upon a back-calculated elastic module This is calculated from a FWD testing results performed on the various secshytions
Rapid chloride permeability tests will be performed at 28 90 and 365 days to indicate the concretersquos reshysistance to infiltration of salts In addition the stanshydard tests of air content slump and compressive strength will be monitored at 3 7 28 90 and 365 days Thermocouples were installed to monitor the temperature of the slab during the curing period along with documentation of the temperature of the base course
The FHWA Office of Pavement Technology will evaluate the slab in relationship to warpage and curl during the initial curing period In addition to these tests regular visual inspections will be conducted and traffic and weather data will be recorded from an automated site located near the project
Preliminary ResultsFindings
The pavement sections were constructed on Septemshyber 24 2002 The concrete was a standard mix design utilizing local materials Type I cement was used in conjunction with a Class C fly ash at a substitution rate of 25 percent Dowel bars were 381-mm (15shyin) diameter Type 316 solid stainless steel 4572 mm (18 in) long and spaced across the joints at 3048-mm (12-in) spacings The transverse joints are perpendicular and spaced at fixed 46-m (15-ft) intershyvals
The dowels were placed in baskets on the grade The baskets were constructed from stainless steel wire The wire had a diameter of 32 mm (0125 in) which made the baskets flexible To compensate for this flexibility the baskets were cut in half on the jobsite Epoxy-coated steel tie bars were then driven in the ground in front of the baskets to keep the frame from moving forward when the paver passed over them (see Figure 108) Additionally a concrete spreader deposited 15 to 23 m3 (2 to 3 yd3) of wet concrete on top of the basket assemblies prior to the slip-form paver moving over the dowel baskets Visual inspecshytion during the paving along with verification from a dowel bar locater confirmed that the dowels had
164
stayed in place Dowel baskets for future projects should be constructed with a 48-mm (01875-in) minimum diameter wire to avoid these issues
Test section 1 was paved shorter than originally planned and totaled 227 m (745 ft) A construcshytion joint extended into the test section by 152 m (50 ft) This joint is to allow the doweled JPCP to abut to the existing CRCP Stainless steel tie bars for adjoining the shoulder were used in the test sections The spacing was unintentionally altered from 30 in center-to-center spacing to 24 in censhyter-to-center spacing This caused the addition used of epoxy-coated tie bar in the last 213 m (70 ft) of test section 2
Points of Contact
Peter Kemp New ProductsNew Methods Engineer (608) 246-7953 peterkempdotstatewius
Steven Krebs Chief Pavements Engineer (608) 246-5399
David Leo Larson (608) 246-7950
Wisconsin Department of Transportation 3502 Kinsman Boulevard Madison WI 53704
Reference
Kemp P 2004 High Performance Concrete Pave-ment Construction Report Draft Report WI-04-03 Wisconsin Department of Transportation Madison
Figure 108 Stainless steel dowels and basket on WI 4 (Kemp 2004)
165
Chapter 39 FEDERAL HIGHWAY ADMINISTRATION 1 (FHWArsquos Pavement Test Facility McLean VA)
Introduction
A joint venture between FHWA and the American Concrete Pavement Association (ACPA) was initishyated in 1998 to study the design and performance of ultrathin whitetopping (UTW) overlays The reshysearch consisted of constructing eight 152-m (50-ft) test lanes of UTW placed on an existing hot mix asphalt (HMA) surface Loading of the test sections occurred between May 1998 and November 1999
Study Objectives
The objective of the study was to validate the deshysign equations and performance prediction models used in the ACPA UTW design procedure The specific research objectives were as follows
bull Evaluate UTW performance under conshytrolled wheel-loads and temperature
bull Study the effects of a range of design feashytures (thickness joint spacing and fiber reshyinforcement) on the performance of UTW
bull Measure pavement response and develop mechanistic models based on these responses
bull Verify existing models and develop new modshyels for predicting load-carrying capacity
Project Design and Layout
The test sections were loaded by two accelerated load testing machines capable of applying simulated truck loads under a controlled pavement temperashyture A single wheel load of either 10 or 12 kips was applied and the speed of the loaded tire was a conshystant 16 kmhr (10 mihr) An average of 35000 loads were applied per week The HMA was 5 years old and a range of severities of rutting were present prior to milling The HMA was milled to a depth of either 635 or 889 mm (25 or 35 in) depending on the depth of the rutting that was present The thickshyness of the overlay was equal to the milled depth so the existing elevation could be maintained The deshysign parameters for each test section are provided in Table 58 and a layout of the test sections is proshyvided in Figure 109
Table 58 Test Section Design Parameters for FHWA 1 Project (CTL 2001)
FIBERS IN DESIGN LANE NO
PCC OVERLAY THICK (IN)
HMA THICK (IN)
HMA MIXTURE BINDER1
JOINT SPACING (FT)
CONCRETE MIXTURE
12-KIP LOAD APPLICATIONS2
5 25 55 SM AC-10 4 x 4 Yes 210000
6 25 55 SM AC-20 4 x 4 No 140000
7 25 55 SM PM 3 x 3 Yes 420000
8 25 55 SM PM 3 x 3 No 350000
9 35 45 SM AC-5 6 x 6 Yes 350000
10 35 45 BM AC-20 6 x 6 No 245000
11 35 45 BM AC-5 4 x 4 Yes 455000
12 35 45 BM AC-20 4 x 4 No 350000
1SM = surface mixture BM = base mixture PM = polymer modified asphalt 2Estimated design life was calculated using ACPA design procedure based on as-built strengths overlay design thicknesses and 12-kip loads
166
ALF = accelerated loading facility LVDT = linear value displacement transducers THK = thick
Figure 109 Layout of test sections and instrumentation for FHWA 1 project (FHWA 2004)
The test sections were instrumented with between 15 and 18 dynamic strain gauges The gauges were installed near the top and bottom of the conshycrete overlay and on the surface of HMA Deflecshytions were measured in the interior of the slab and adjacent to the joint using linear variable disshyplacement transducers
State Monitoring Activities
Monitoring activities included collecting distress data and measuring faulting and roughness Deshyflections and strains induced by the applied wheel loads were also recorded Laboratory data colshylected included layer modulus values flexural strengths and bond strengths
Preliminary ResultsFindings
A summary of the performance of the test sections is provided in Table 59 Although a few of the sections exhibited significant cracking many exshyperienced very little cracking The primary types of distress documented were corner transverse and longitudinal cracks with corner cracking beshy
ing the most predominant distress A small amount of faulting along some of the longitudinal and transshyverse joints was measured but overall very little faulting developed Test sections that contained an HMA with binders having a higher penetration tended to exhibit a slightly higher level of cracking Reducing the panel size when overlaying an HMA with a soft binder tended to increase the performance of the overlay
Design recommendations based on the findings from this study are being prepared and the database of information produced will be available to the public in conjunction with a report on the contents of the database
Current Project Status Results and Findings
The cracked slabs in Lane 6 and Lane 10 were reshypaired on April 28 2000 Mostly panels with multishyple cracks or loose or missing pieces of concrete were replaced Five panels were replaced in Lane 6 and three panels in Lane 10 The steps followed in performing the repairs appear below
167
Table 59 Performance of UTW Test Sections (CTL 2001 FHWA 2004)
NUMBER OF PANELS RANGE OF RANGE OF
LANE ACTUAL NUMBER OF EXHIBITING LONGITUDINAL TRANSVERSE NO LOAD APPLICATIONS PANELS LOADED CRACKING FAULTING (IN) FAULTING (IN)
5 194500 12 kips 12 18 01-07 None
6 359000 12 kips 12 11 01-03 None
7 283500 12 kips 16 4 0-01 None
8 628000 12 kips 16 3 01-02 0-01
9 266000 12 kips 8 10 01-003 0-02
10 441000 12 kips 8 4 01-02 0-02
11 310000 10 kips 12 6 01-06 None 762630 12 kips
12 310000 10 kips 12 4 0-003 0-04 762630 12 kips
1 Identify panels to be repaired
2 Mark boundaries for saw cuts which should be at located at least 1016 mm (4 in) on the inside of each joint
3 Perform saw cuts
4 Used jackhammer to break-up slabs and to dislodge the bonded portions of the concrete overlay from the HMA
5 Remove debris and clean surface in the repair area
6 Place new concrete
7 Saw joints
The average depth of the repair area after the panels were removed for Lane 6 was 965 mm (38 in) and 1194 mm (47 in) for Lane 10 This resulted in an increase in overlay thickness of 33 mm (13 in) for the repairs in Lane 6 and 33 mm (13 in) for the reshypairs in Lane 10 More information on the repairs can be found in the report prepared by CTL (2001)
The slump air content concrete temperature and unit weight of the repair concrete were measured The compressive strength split tensile strength modulus of rupture and modulus of elasticity of
the concrete were also measured Information on the test results is available in the report prepared by CTL (2001)
Four panels were also removed from Lane 9 to investigate the removal of slabs using a small front-end loader Additional loadings were not applied to Lane 9
Additional 12-kip dual wheel loads were applied to each lane beginning 8 days after the repair and continuing until early August 2000 During this time Lane 6 accumulated 400000 load repetitions and Lane 10 427000 repetitions Two of the five panels repaired in Lane 6 exhibited cracking and two of the three panels repaired in Lane 10 cracked These cracks were primarily corner cracks
Point of Contact
James Sherwood Office of Infrastructure Research and Development Turner-Fairbank Highway Research Center 6300 Georgetown Pike McLean VA 22101 jamessherwoodfhwadotgov (202) 493-3150
168
References
Construction Technologies Laboratories Inc (CTL) 2001 UTW Pavement Repair Demonstra-tion Final Report Innovative Research Foundashytion Falls Church VA
Federal Highway Administration (FHWA) 2004 Ultra-Thin Whitetopping (UTW) Project httpwwwtfhrcgovpavement utwwebutwhtm
169
Chapter 40 Various States MIT Scan-2
Introduction
Dowel bar placement is critical for providing proper load transfer for concrete pavements Misaligned dowels can lock up the joint and cause premature failure However the ability to identify the accushyracy of dowel bar placement is difficult A new deshyvice MIT Scan-2 developed by MIT GmbH Dresshyden Germany was created for the specific purpose
of locating steel dowel and tie bars in concrete pavements Figure 110 provides a close-up view of the device (ERES 2003) In 2003 the FHWA conshyducted laboratory and field evaluation of the MIT Scan-2 technology to assess its performance in deshytermining dowel bar location It is anticipated that MIT Scan-2 will become an important monitoring tool in QAQC procedures
Figure 110 Close-up view of MIT Scan-2
Study Objectives
The objectives of this project are the following (ERES 2003)
bull Provide laboratory and field evaluashytion of MIT Scan-2 to assess accuracy and repeatability of measurements of dowel position
bull Compare MIT Scan-2 measurements with measurements of other devices such as cover meter and ground peneshytrating radar (GPR)
bull Demonstrate MIT Scan-2 to contracshytors and State DOT personnel and colshylect their comments on usability of this device
bull Develop recommendations for use of MIT Scan-2 in QAQC procedures by contractors and State DOTs and develop comprehensive training material
170
Project Design and Layout
The laboratory testing program was designed to verify the measurement accuracy determine the overall standard deviation of measurement error and identify factors affecting measurement results for MIT Scan-2 The following laboratory tests were identified (ERES 2003)
bull Determine repeatability of measurements
bull Determine the absolute measurement ershyror
bull Document that the measurements are not afshyfected by cover material or water
bull Determine the effects of common factors (variability in bar length presence of metal objects and water) encountered in the field
bull Determine the effects of dowel basketsmdash properly cut baskets only
Other than the basic objectives no specific plans were developed for the field testing since the feashysibility of field testing depends on the availability of projects (ERES 2003)
Preliminary ResultsFindings
Literature Review Summary A comprehensive literature search was conducted to evaluate various types of cover meters GPR and MIT Scan-2 in determining dowel bar alignshyment The cover meters and MIT Scan-2 were noted to have the following advantages over GPR (ERES 2003)
bull The weather conditions (dry vs wet) do not affect measurement results
bull Testing can be conducted on ldquogreenrdquo conshycrete
The main disadvantage of cover meters and MIT Scan-2 is that the presence of other metal affects the measurement results In addition to the advanshytages mentioned above however MIT Scan-2 is able to scan the entire joint and determine the loshy
cation and alignment of all dowels in one measureshyment (ERES 2003)
Laboratory Testing Results The first series of laboratory testing was completed during August 2003 Preliminary results from the laboratory testing confirmed the MITrsquos claim on the accuracy of Scan-2 (ERES 2003)
bull Depth +2 mm (00787 in)
bull Horizontal misalignment +2 mm (00787 in)
bull Vertical misalignment +2 mm (00787 in)
bull Side shift +5 mm (01968 in)
bull Repeatability +2 mm (00787 in)
With the rail fixed the measurements from one series of repeated testing had the following standard deviashytions (ERES 2003)
bull Horizontal misalignment 06 mm (00236 in)
bull Vertical misalignment 04 mm (00157 in)
bull Side shift 05 mm (00197 in)
These results are for the bars with misalignment less than 13 mm (05118 in) The variability is somewhat higher for bars with greater misalignment
Field Testing Results Limited field testing conducted in Reno Nevada showed that for dowel bars placed in baskets the presence of the metal basket interferes with the MIT Scan-2 measurement results However if the transshyport ties for the basket are cut good results can be obtained (ERES 2003) MIT is in the process of deshyveloping software that can compensate for the presshyence of the basket
Even without the basket software however the field testing results showed that MIT Scan-2 can be a useshyful tool for detecting problems with dowel placement Figure 111a shows an example of dowel basket that is pulled apart during construction resulting in seshyverely misaligned bars Figure 111b is an example of properly placed dowel basket (ERES 2003)
171
Point of Contact
Sam Tyson Federal Highway Administration Office of Infrastructure Office of Pavement Technology (HIPT) 400 7th Street SW Washington DC 20590 (202) 366-1326
Reference
ERES Consultants Inc (ERES) 2003 Use of Mag-netic Tomography Technology to Evaluate Dowel Placement Quarterly Progress Report to Federal Highway Administration
(a) (b)
Figure 111 Example sectional contour map (tomography) of electro-magnetic signal detected by MIT Scan-2 a) severely distorted basket
with bars pulled out b) properly placed dowel basket
172
APPENDIX A
TE-30 PROJECT SUMMARY TABLE
APPENDIX A TE-30 PROJECT SUMMARY TABLE
STATE AND PROJECT DESIGNATION TE-30 DESIGN FEATURES EVALUATED RANGE OF STUDY VARIABLES LOCATION
NUMBER OF SECTIONS
YEAR BUILT
PROJECT LENGTH
NO OF LANES (1-DIR)
SLAB THICKNESS BASE TYPE
JOINT SPACING
LOAD TRANSFER
JOINT SEALANT
SHOULDER TYPE
California CA 1 No Precast Post-Tension Concrete Pavement Single Application of TX Design Standards Pending 1 10 in 8 ft
Colorado
CO 1 No Thin Whitetopping Thickness (39 in 45 in 66 in) Jt Spacing (4 x 4 6 x 6 6 x 9 ft)
SH 121 Wadsworth 4 2001 4 mi 2 Varies HMA Varies No
CO 2 No Precast Concrete Repairs Const ruction Methods (Michigan amp Colorado) I-25 Loveland 1 2004 450 panels 2 12 ft Yes Yes Tied PCC
Illinois
IL 1 No Alternative Dowel Bar Materials Fiber composite bars (15 in) Epoxy coated steel bars (15 in)
I-55 SB Williamsville
4 Joints with Fiber Bars 3 control
1996 315 ft 1 1125 in JRCP BAM 45 ft
(15 ft hinges)
15 in dowels (various types)
Preformed (HP in hinge
joints)
Widened Slab + PCC Shldr
IL 2 Yes Alternative Dowel Bar Materials SealedNonsealed Joints
Epoxy-coated steel bars (15 in) Polyester and fiberglass bars (15 and 175 in) Epoxy-resin and fiberglass bars (15 in) Sealed and nonsealed Hinge Joint JRCP and Conventional JRCP
IL 59 SB Naperville 8 1997 2355 ft 3 10 in JRCP
10 in JPCP
12 in AGG over porous embankment
45 ft (15 ft hinges)
15 ft
15 to 175 in dowels (various types)
Preformed HP
None
Tied curb and gutter
IL 3 Yes Alternative Dowel Bar Materials SealedNonsealed Joints
Polyester and fiberglass bars (15 in) Vinyl ester and fiberglass bars (15 in) Cement-filled fiberglass and polyester resin tubes Carbon steel rods with stainless steel cladding (15 in) Epoxy-coated steel dowels (15 in) Sealed and nonsealed joints
US 67 WB Jacksonville
7 (5 for dowels 2 for sealing)
1999 1065 ft 2 10 in JPCP 4 in CAM II 12 in LSS 15 ft
15 in dowels (various types)
HP No Seal Tied PCC
IL 4 No Alternative Dowel Bar Materials
Cement-filled fiber composite tubes Cement-filled stainless steel tubes (15 and 175 in) Carbon steel rods with stainless steel cladding (15 and 175 in)
SR 2 NB Dixon (driving lanes
only) 5 2000 2 95 in JPCP 12 in AGG 15 ft
15 to 175 in dowels (various types)
HP Tied curb and gutter
Indiana IN 1 Yes Mixed design Low shrinkage and Low curling and warping Improve fracture properties
I-65 at SR-60 Clark County 3 2002 155 mi 3 14 in AGG 18 ft and 15 ft
(experimental) Dowels (1 in) NA concrete
Iowa IA 1a Yes PCC Mixing Times Iowa DOT and contractor mixes 45- 60- and 90-second mixing times
IA 5 Carlisle
1996
36 mi JPCP
IA 1b Yes PCC Mixing Times 30- and 45-second mixing time US 30 Carroll 1996 22 mi JPCP
IA 2 Yes Alternative Dowel Bar Materials Alternative Dowel Bar Spacings
Fiber composite (15 and 188 in at 8 and 12 in spacing) Stainless steel (15 in at 8 and 12 in spacing) Epoxy-coated steel (15 in at 12 in spacing)
US 65 Bypass Des Moines 8 1997 2432 ft 2 12 in JPCP 6 in AGG 20 ft
(skewed)
15 to 188 in dowels (various types)
HP HMA
IA 3 Yes Subgrade Stabilization Fly Ash Stoke Ash
US 151 in LinnJones Counties
4 (test sections plus
control)
2000ndash 2001 7100 m
2 lanesndash
dir
240 mm thick
pavement
Fly-ash stabilized
base 6m joint spacing Doweled
joints HP bitumishy
nous Granular
IA 4 No Alternative Dowel Bar Shapes Heavy Elliptical Bars (2084 sq in) Medium Elliptical Bars (1473 sq in) Standard Round Bars ( 15 in dia)
IA 330 21 2002 10500 ft 2 20 ft Dowels (various types)
IA 5 No Elliptical Fiber Reinforced Polymer Dowel Bars Dowel Bar Spacing (10 12 15 in) IA 330 Melbourne 3 2002 180 m 2 6 m FRP Elliptical
Dowels
STATE AND PROJECT DESIGNATION TE-30 DESIGN FEATURES EVALUATED RANGE OF STUDY VARIABLES LOCATION
NUMBER OF SECTIONS
YEAR BUILT
PROJECT LENGTH
NO OF LANES (1-DIR)
SLAB THICKNESS BASE TYPE
JOINT SPACING
LOAD TRANSFER
JOINT SEALANT
SHOULDER TYPE
IA 6 No Field Trials of Guidelines for Soil Stabilizers of Non-Uniform Subgrade Soils
Raw Hydrated amp Conditioned Fly Ash Various (pending) Various (pending)
IA 7 No Implementation of Total Environshymental Management for Paving (TEMP)
Up to 3 Implementation Sites Pending 3 Pending
Kansas
KS 1 Yes
Alternative Dowel Bar Materials Fiber PCC Alternative PCC Mix Designs Joint Sawing Alternatives Joint Sealing Alternatives Surface Texturing Two-Lift Construction
Epoxy dowels fiber composite bars and X-Flex Polyolefin fibers Lower wc mix Early-cut saws (3 types) Preformed HP and no seal Longitudinal and random tining Two-lift construction (3 types) High solids curing compound
Highway K-96 EB Haven 13 1997 61 mi 2 10 in JPCP
10 in FRCP CTB 15 ft
125 in to 2 in
dowels (various types)
X-Flex device
Preformed HP
None HMA
KS 2 Yes Smoothness Monitoring of Plastic Concrete Smoothness monitoring of plastic concrete Hutchinson KS 5 2001 12401 m 1 220 mm
Dense cement
treated base 5 m
1 frac14 in dowels at 12 in centers
Transverse-Preformed neoprene
compression Longitudinal-low modulus
hot pour
Tied concrete
Maryland MD 1 Yes PCC Mix Design
Fiber PCC
Conventional PCC Polypropylene fiber reinforced PCC Low shrinkage PCC (large coarse aggregate size)
US 50 Salisbury Bypass 3 2001 JPCP
FRCP
Michigan MI 1 No Two-Lift Construction Exposed Aggregate Surface Thick Foundation
JRCP and JPCP OGDL and LCB Subbase thickness Surface texturing
I-75 NB (Chrysler Freeway) Detroit 2 1993 21 mi 2 to 3 11 in JRCP
10 in JPCP 4 in OGDL 6 in LCB
41 ft 15 ft
125 in dowels
(variably spaced on
JPCP)
HP Preformed
PCC Shldr Widened Slab + PCC Shldr
Minnesota
MN 1 Yes Alternative Dowel Bar Materials PCC Mix Design
High performance PCC mix (high air content low wc high quality aggregate GGBFS) Stainless steel dowels (15 and 17 in) Epoxy-coated steel bars (15 in)
I-35W Richfield 5 2000 1 mi 3 134 in JPCP 5 in AGG 15 ft
15 to 17 in dowels (various types)
HP PCC
MN 2 Yes Alternative Dowel Bar Materials DoweledNondoweled Joints
PCC Mix Design
5 and 75 in JPCP High performance PCC mix with GGBFS Dowelednondoweled joints
Epoxy-coated dowels (1 and 125 in diameter) Fiber composite dowels (125 and 150 in diameter)
MnRoad Low-Volume Road
Facility Albertville 3 2000 870 ft 2 5 in JPCP
75 in JPCP 7 in AGG 5 in AGG
10 ft 15 ft
None 1 to 15 in
dowels (various types)
HP Silicone None
Widened Slab + Granular
MN 3 No Ultrathin Whitetopping Instrumented sections with varying thickness and joint spacings
MnROAD Mainline Road Facility and US 169 Albertville
9 1997 788 ft per section
3 in
4 in
6 in
Mississippi MS 1 Yes Alternative PCC Paving Material (Resin Modified Pavement)
Resin modified pavement Ultrathin whitetopping Polymer-modified HMA overlay
US 72 Corinth
4 (2 RMP 1 UTW 1 HMA) 2001 Approx
900 ft 2 2 in RMP 3 in UTW 4 in HMA
Existing HMA pavement
RMP NA UTW 3 ft HMA NA
RMP NA UTW None HMA NA
RMP NA UTW None HMA NA
Missouri MO 1 Yes Fiber PCC Slab Thickness Joint Spacing
Conventional JPCP (9 and 11 in) Steel fibers (5 6 and 9 in) Polyolefin fibers (5 6 and 9 in) 15 30 60 and 200 ft joint spacings
I-29 SB Rock Port 8 1998 39 mi 2
9 and 11 in JPCP
5 6 9 in FRCP
Underlying 9 in JRCP with 615 ft joint
spacing
15 ft 30 ft 60 ft 200 ft
125 and 15 in epoxy
coated steel dowels
HP AC
New Hampshire NH 1 Yes Definition of HPCP Design Optimization NA NA NA NA NA NA NA NA NA NA NA NA
STATE AND PROJECT DESIGNATION TE-30 DESIGN FEATURES EVALUATED RANGE OF STUDY VARIABLES LOCATION
NUMBER OF SECTIONS
YEAR BUILT
PROJECT LENGTH
NO OF LANES (1-DIR)
SLAB THICKNESS BASE TYPE
JOINT SPACING
LOAD TRANSFER
JOINT SEALANT
SHOULDER TYPE
Ohio
OH 1 Yes PCC Mix Design PCC mix with GGBFS Conventional PCC mix US 50 Athens 2 1997 105 mi 2 10 in JRCP
4 in Perm AGG
6 in AGG subbase
21 ft 15 in epoxy coated steel
bars HP PCC
OH 2 Yes Alternative Dowel Bar Materials Fiberglass bars (15 in) Epoxy coated steel bars (15 in) Stainless steel tubes filled with concrete
US 50 Athens 3 1997 378 ft 2 10 in JRCP
4 in Perm AGG
6 in AGG subbase
21 ft 15 in dowels
(various types)
HP PCC
OH 3 Yes SealedNonsealed Joints
Hot Poured Sealants Silicone Sealants Neoprene Sealants No Seal
US 50 Athens
14 (28 including replicates)
1997shy1998 20 mi 2 10 in JRCP
4 in Perm AGG
6 in AGG subbase
21 ft 15 in epoxy coated steel
bars
HP Silicone
Preformed None
PCC
OH 4 No Evaluation of nondestructive test devices for measuring the support of subgrade and aggregate base layers
Nuclear Gauge Humboldt Gauge FWD Large Load FWD Small Load German Plate
US 35 Jamesshytown 1 2000 526 mi 2 9 in JRCP
4 in drainable base 6rdquo
dense graded aggregate
Pennsylvania PA 1 Yes Evaluation of HIPERPAV
Tie Bars (YesNo) Dowel Bars (YesNo) Static Sensors (YesNo) Dynamic Sensors (YesNot)
SR 22 Murrysshyville 4 Fall 2004 210 ft 2 12 in Asphalt
Treated 15 ft Dowels (125
in when used)
South Dakota SD 1 Yes
Fiber PCC DoweledNondoweled Joints Joint Spacing
Polyolefin fiber reinforced concrete (doweled and non-doweled 65 and 8 in thick 0 25 and 35 ft joints) Conventional concrete (8 in thick 20 ft doweled joints)
US 83 Pierre 8 1996 4765 ft 1
65 and 8 in FRCP
8 in JPCP Gravel
20 ft 25 ft 35 ft None
Dowels (1 in epoxy coated
steel bars) No Dowels
HP Widened Slab + Granular
Virginia
VA 1 Yes PCC Mix Design 2 in top size aggregate with GGBFS 1 in top size aggregate with GGBFS 1 in top size aggregate with Class F fly ash
I-64 Newport News 3 1998shy
1999 238 mi 3 11 in JPCP Asphalt-treated OGDL 15 ft
125 in epoxy coated steel
bars Silicone Widened Slab
+ HMA
VA 2 Yes PCC Mix Design Steel Contents
Low shrinkage and high flexural strength mixes Various longitudinal steel contents
VA 288 Richmond
2000
CRCP NA NA NA
VA 3 Yes PCC Mix Design Steel Contents
Low shrinkage and high flexural strength mixes Various longitudinal steel contents
US 29 Madison Heights 2000 CRCP NA NA NA
Washington WA 1 No PCC Mix Design and Construction at Intersections
Evaluate rapid reconstruction of urban intersections by looking at methods to accelerate the rate of concrete strength gain methods to minimize the construction time and traffic control strategies to minimize user delay
SR 395 Kenneshywick 1 2000 Intersecshy
tion
West Virginia WV 1 No GFRP Dowel Bars
GFRP Reinforced CRCP Evaluate the potential use of GFRP dowel bars in JPCP and GFRP reinforcing for CRCP Pending
Wisconsin WI 1 Yes Surface Texturing
Random transverse tining (2 levels) Uniform transverse tining Random skewed tining (4 levels) Random longitudinal tining (2 levels) Uniform longitudinal tining
WI 29 Abbotsford
10 (+47 from
other states) 1997 10 mi 2 JPCP 17-20-18-19 ft
variable Dowels None Widened Slab + HMA
WI 2 Yes Alternative Dowel Bar Materials Alternative Dowel Bar Spacings
Fiber reinforced polymer composite dowels Solid stainless steel dowels Hollow coremortar filled stainless steel dowels Epoxy-coated dowels Dowel placement (5 layouts)
WI 29 EB Owen 13 1997 106 mi 2 11 in JPCP
2 in AGG 5 in AGG (in
place) 9 in AGG (in
place)
17-20-18-19 ft variable
15 in Dowels (various types)
None Widened Slab + HMA
NO OF STATE AND NUMBER OF YEAR PROJECT LANES SLAB JOINT LOAD JOINT SHOULDER
PROJECT DESIGNATION TE-30 DESIGN FEATURES EVALUATED RANGE OF STUDY VARIABLES LOCATION SECTIONS BUILT LENGTH (1-DIR) THICKNESS BASE TYPE SPACING TRANSFER SEALANT TYPE
WI 3 Yes
Alternative Dowel Bar Materials Alternative Dowel Bar Spacings Trapezoidal Cross Section
Conventional thickness (12 in) Variable thickness (8-11 in) Fiber composite dowels stainless steel dowels epoxy-coated steel dowels Dowel placement (2 layouts)
WI 29 Hatley 6 1997 2
11 in JPCP 8-11 in JPCP
6 in AGG 18 ft 15 in Dowels
(various types)
None Widened Slab + HMA
WI 4 Yes Alternative Dowel Bar Materials PCC Mix Design
High performance PCC mix (Class C fly ash 04 water to cement ratio) Stainless steel dowels (15) 24-36 in dense graded base
12-24 in select granular back fill
4 inches of open graded base
I-90 approx 8 mi W of split of I-90 and I-94 Monroe
County
2 test sections and 1 control
section 2002 2500 ft 2
135 in research
slab 12 in control slab
Std 4rdquo OGDL 6rdquo dense graded ndash
Mod 4rdquo open graded
drained 10rdquo dense graded
15 ft joint spacing
18 in long 15 in dia Stainless
steel
None concrete
Federal Highway
Administration FHWA 1 No Ultrathin Whitetopping Validate the design equations and performance predicshy
tion models used in the ACPA UTW design procedure
FHWArsquos Pavement Test
Facility McLean VA
8 1998ndash 1999 400 ft 1
25 in UTW
35 in UTW
(fibers varied)
HMA
3 x 3 ft
4 x 4 ft
6 x 6 ft
Various States No MIT Scan-2 Conducted laboratory and field evaluation of MIT Scan-2 Various Ongoing Ongoing
KEY
AGG = aggregate GFRP = glass fiber reinforced polymer JRCP = jointed reinforced concrete pavement PCC = portland cement concrete BAM = bituminous aggregate mixture GGBFS = ground granulated blast furnace slag LCB = lean concrete base RMP = resin-modified pavement CAM = cement aggregate mixture HMA = hot mix asphalt LSS = lime stabilized subgrade UTW = ultrathin whitetopping CRCP = continuously reinforced concrete pavement HP = hot-poured sealant NA = not applicable FRCP = fiber-reinforced concrete pavement JPCP = jointed plain concrete pavement OGDL = open-graded drainage layer
APPENDIX B
BIBLIOGRAPHIC LISTING OF PROJECT REFERENCES BY STATE
APPENDIX B
BIBLIOGRAPHIC LISTING OF PROJECT REFERENCES BY STATE
Colorado
Buch N 2002 Field Trials of Concrete Pavement Product and Process TechnologymdashPrecast Panel System for Full Depth Pavement Repairs Technical Proposal Michigan State University East Lansing
mdashmdashmdash 2003 Field Trials of Concrete Pavement Product and Process TechnologymdashPrecast Panel System for Full Depth Pavement Repairs Quarterly Progress Report Michigan State University East Lansing
Construction Technology Laboratories Inc (CTL) 2001 Whitetopping Pavements in Colorado and Revision of the TWT Design Procedure Innovative Pavement Research Foundation Falls Church VA
Sheehan M J S M Tarr and S D Tayabji 2004 Instrumentation and Field Testing of Thin White-topping Pavement in Colorado and Revision of the Existing Colorado Thin Whitetopping Procedure Report No CDOT-DTD-R-2004-12 Colorado Deshypartment of Transportation Denver
Tarr S M M J Sheehan and P A Okamoto 1998 Guidelines for the Thickness Design of Bonded Whitetopping Pavement in the State of Colorado Report No CDOT-DTD-R-98-10 Coloshyrado Department of Transportation Denver
URETEK 2004 httpwwwuretekusacom servicesstitch_in_timeindexhtm
Illinois
Gawedzinski M 1997 Fiber Composite Dowel Bar Experimental Feature Construction Report Illinois Department of Transportation Springfield
mdashmdashmdash 2000 TE-30 High Performance Rigid Pavements Illinois Project Review Illinois Departshyment of Transportation Springfield
mdashmdashmdash 2004 TE-30 High Performance Rigid Pave-ments An Update of Illinois Projects Illinois Departshyment of Transportation Springfield
Illinois Department of Transportation (IDOT) 1989 Mechanistic Pavement Design Supplement to Section 7 of the Illinois Department of Transpor-tation Design Manual Illinois Department of Transportation Springfield
Indiana
Nantung T E 2004 High Performance Concrete Pavement Indiana Public Works News Volume 5 Number 1 Anchor Media Co
Iowa
Cable J K 1998 ldquoEvaluation of Mix Time on Conshycrete Consistency and Consolidationrdquo Proceedings Crossroads 2000 Conference Ames IA
Cable J K and L L McDaniel 1998a Effect of Mix Times on PCC Properties Iowa DOT Project HR-1066 Iowa Department of Transportation Ames
mdashmdashmdash 1998b Demonstration and Field Evalua-tion of Alternative Portland Cement Concrete Pavement Reinforcement Materials Iowa DOT Proshyject HR-1069 Iowa Department of Transportation Ames
Cable J K L Edgar and J Williams 2003 Field Evaluation of Elliptical Steel Dowel Performancemdash Construction Report Iowa State University Ames
Cable J K and M L Porter 2003 Demonstration and Field Evaluation of Alternative Portland Ce-ment Concrete Pavement Reinforcement Materials Iowa DOT Project HR-1069 Iowa State University Ames
Porter M L and R J Guinn 2002 Assessment of Dowel Bar Research Project HR-1080 Final Reshyport Iowa Department of Transportation Ames
Cable J K M L Porter and R J Guinn 2003 Field Evaluation of Elliptical Fiber Reinforced Poly-mer Dowel PerformancemdashConstruction Report Iowa State University Ames
179
Porter M L R Guinn and A Lundy 2001 Dowel Bar Optimization Phases I and II Final Reshyport American Highway Technology and Center for Portland Cement Concrete pavement Technolshyogy Ames
The Transtec Group 2002 Technical Work Plan for Implementation of a Total Environmental Man-agement for Paving (TEMP) System The Transtec Group Inc Austin TX
Turner D J and J M Ruiz 2003 Final Work Plan for Implementation of a Total Environmental Management for Paving (TEMP) System The Transhystec Group Inc Austin TX
White D W 2002 Field Trials of Guidelines for Soil Stabilizers of Non-Uniform Subgrade SoilsmdashProposal Iowa State University Ames
Kansas
Kansas Department of Transportation (KDOT) 1998 High Performance Concrete Pavement K-96 Reno County 1998 Annual Report Kansas Deshypartment of Transportation Topeka
mdashmdashmdash 1999 High Performance Concrete Pave-ment K-96 Reno County 1999 Annual Report Kansas Department of Transportation Topeka
mdashmdashmdash 2002 High Performance Concrete Pave-ment K-96 Reno County 2002 Annual Report Kansas Department of Transportation Topeka
mdashmdashmdash 2003 High Performance Concrete Pave-ment K-96 Reno County 2003 Annual Report Kansas Department of Transportation Topeka
Wojakowski J B 1998 High Performance Con-crete Pavement Report No FHWA-KS-982 Kanshysas Department of Transportation Topeka
Maryland
Goulias D and C Schwartz 1999 High Perform-ance Portland Cement Concrete Pavement Project Work Plan University of Maryland Department of Civil and Environmental Engineering College Park
mdashmdashmdash 2003 High Performance Portland Cement Concrete Pavement Final Research Report Unishy
versity of Maryland Department of Civil and Envishyronmental Engineering College Park
Michigan
Buch N R Lyles and L Becker 2000 Cost Effec-tiveness of European Demonstration Project I-75 Detroit Report No RC-1381 Michigan Department of Transportation Lansing
Federal Highway Administration (FHWA) 1992 Report on the 1992 US Tour of European Con-crete Highways FHWA-SA-93-012 Federal Highshyway Administration Washington DC
Larson R M S Vanikar and S Forster 1993 US Tour of European Concrete Highways (US TECH) Follow-Up Tour of Germany and Austriamdash Summary Report FHWA-SA-93-080 Federal Highway Administration Washington DC
Smiley D L 1995 First Year Performance of the European Concrete Pavement on Northbound I-75mdashDetroit Michigan Research Report R-1338 Michigan Department of Transportation Lansing
Weinfurter J A D L Smiley and R D Till 1994 Construction of European Concrete Pave-ment on Northbound I-75mdashDetroit Michigan Reshysearch Report R-1333 Michigan Department of Transportation Lansing
Minnesota
Burnham T R 2001 Construction Report for MnRoad PCC Test Cells 32 52 and 53mdashFinal Report Minnesota Department of Transportation Maplewood
mdashmdashmdash 2003 ldquoSeasonal Load Response Behavior of a Thin PCC Pavementrdquo Proceedings Eighth International Conference on Low-Volume Roads Transportation Research Record 1819 Transportashytion Research Board Washington DC
mdashmdashmdash 2004 ldquoLoad Proximity Correlation of Dyshynamic Strain Measurements in Concrete Pavementrdquo Proceedings Second International Conference on Accelerated Pavement Testing Minneapolis MN
Minnesota Department of Transportation (MnDOT) 2000 New JPCP Test Cells at the
180
MnROAD Project Minnesota Department of Transportation Maplewood
Rangaraju P R 2003 Development of Some Per-formance-Based Material Specifications for Minne-sotarsquos High-Performance Concrete Pavement Transportation Research Board Annual Meeting CD-ROM Transportation Research Board Washshyington DC
Rettner D 1999 I-35W High Performance Rigid Pavement Work Plan Minnesota Department of Transportation Maplewood
Turgeon C 2003 Minnesotarsquos High Performance Concrete Pavements Evolution of the Practice Transportation Research Board 2003 Annual Meetshying CD-ROM Transportation Research Board Washington DC
Vandenbossche J M 2002 The Construction and Performance of Ultra-thin Whitetopping Intersections on US-169 Final Report Minnesota Department of Transportation St Paul
mdashmdashmdash 2003 Interpreting Falling Weight Deflec-tometer Results for Curled and Warped Portland Cement Concrete Pavements Thesis for the degree Doctor of Philosophy in Civil Engineering Univershysity of Minnesota St Paul
mdashmdashmdash 2003 ldquoPerformance Analysis of Ultra-thin Whitetopping Intersections on US-169rdquo Transpor-tation Research Record 1823 Transportation Reshysearch Board Washington DC
Vandenbossche J M and D L Rettner 1998 The Construction of US-169 and I-94 Experimental Whitetopping Test Sections in Minnesota Minneshysota Department of Transportation St Paul
mdashmdashmdash 1999 ldquoOne-Year Performance Summary of Whitetopping Test Sections at the MnROAD Test Facilityrdquo Proceedings International Conference on Accelerated Pavement Testing Reno NV
Vandenbossche J M and A J Fagerness 2002 ldquoPerformance Analysis and Repair of Ultra-thin and Thin Whitetopping at MnROADrdquo Transporta-tion Research Record 1809 Transportation Reshysearch Board Washington DC
Mississippi
Anderton G L 1996 Userrsquos Guide Resin Modi-fied Pavement Miscellaneous Paper GL-96-7 US Army Center for Public Works Alexandria VA
Battey R L 2002 Construction Testing and Pre-liminary Performance Report on the Resin Modified Pavement Demonstration Project Work Order Document Work Order DTFH71-99-TE030-MS-12 (State Study No 137) Mississippi Department of Transportation Jackson
Mississippi Department of Transportation (MDOT) 1999 High Performance Concrete Pavement Work Order Document Work Order DTFH71-99-TE30shyMS-12 (State Study No 137) Mississippi Departshyment of Transportation Jackson
Missouri
Chojnacki T 2004 Performance Data from MO1 Test Sections Missouri Department of Transportashytion Jefferson City
Missouri Department of Transportation (MoDOT) 2000 Test SectionsmdashUnbonded Concrete Overlay Internal Technical Summary Missouri Department of Transportation Jefferson City
New Hampshire
American Association of State Highway and Transshyportation Officials (AASHTO) 1993 Guide for Design of Pavement Structures American Associashytion of State Highway and Transportation Officials Washington DC
mdashmdashmdash 1998 Supplement to the Guide for Design of Pavement Structures American Association of State Highway and Transportation Officials Washshyington DC
Goodspeed C H 1999 High Performance Con-crete for Bridge and Pavement Applications CDshyROM (with HPCP definitions presentation files and computer program) Durham NH
Ohio
Hawkins B K A M Ioannides and I A Minkarah 2000 To Seal or Not to Seal Construc-
181
tion of a Field Experiment to Resolve an Age-Old Dilemma Preprint Paper No 00-0552 79th Annual Meeting of the Transportation Research Board Washington DC
Ioannides A M I A Minkarah B K Hawkins and J Sander 1999 Ohio Route 50 Joint Sealant ExperimentmdashConstruction Report (Phases 1 and 2) and Performance to Date (1997ndash1999) Ohio Deshypartment of Transportation Columbus
Ohio Research Institute for Transportation and the Environment (ORITE) 1998 Measurement of Dowel Bar Response in Rigid Pavement ORITE-1 Ohio Department of Transportation Columbus
Sargand S M 2000 Performance of Dowel Bars and Rigid Pavement Draft Final Report Ohio Deshypartment of Transportation Columbus
mdashmdashmdash 2001 Performance of Dowel Bars and Rigid Pavement Final Report Ohio Department of Transportation Columbus
Sargand S M W F Edwards and S Salimath 2001 Evaluation of Soil Stiffness Via Non-destructive Testing Final Report Ohio Department of Transportation Columbus
Sargand S M W Edwards and I Khoury 2002 Application of High Performance Concrete in the Pavement System Structural Response of High Per-formance Concrete Pavement Final Report Ohio Department of Transportation Columbus
South Dakota
Johnston D and D Huft 2004 Distress Survey Results of the Non-Metallic Fiber Reinforced Con-crete Pavement Test Sections on US 83 E-Mail communication from South Dakota Department of Transportation Pierre
Ramakrishnan V 1995 Evaluation of Non-Metallic Fiber Reinforced Concrete in PCC Pave-ments and Structures Report No SD94-04-I South Dakota Department of Transportation Pierre
mdashmdashmdash 1997 Demonstration of Polyolefin Fiber Reinforced Concrete in Bridge Replacement Report No 5095-22 South Dakota Department of Transshyportation Pierre
Ramakrishnan V and N S Tolmare 1998 Evaluation of Non-Metallic Fiber Reinforced Con-crete in New Full Depth PCC Pavements Report No SD96-15-F South Dakota Department of Transportation Pierre
Tennessee
Gharaibeh N G 2003 Performance-Related Specifications (PRS) Field Trial in Tennessee Quarterly Progress Report to the Federal Highway Administration
Virginia
Ozyildirim C 2000 Evaluation of High-Performance Concrete Pavement in Newport News VA Draft Interim Report Virginia Transportation Research Council Charlottesville
mdashmdashmdash 2001 ldquoEvaluation of High-Performance Concrete Pavement in Newport News VArdquo Pre-print Paper 01-3173 80th Annual Meeting of the Transportation Research Board Washington DC
Washington
Nemati K M J S Uhlmeyer L M Pierce and J R Powell 2003 Accelerated Construction of Ur-ban Intersections with Portland Cement Concrete Pavement (PCCP) Final Report Federal Highway Administration Washington DC
West Virginia
Chen H L and J H Choi 2002 ldquoEffects of GFRP Reinforcing Rebars on Shrinkage and Thershymal Stresses in Concreterdquo Proceedings of the 15th ASCE Engineering Mechanics Conference Columshybia University New York NY
mdashmdashmdash 2004 ldquoEffects of GFRP Reinforcing Re-bars on Shrinkage and Thermal Stresses in Conshytinuously Reinforced Concrete Pavementrdquo submitshyted to ACI Structural Journal American Concrete Institute Farmington Hills MI
Choi J H and H L Chen 2003 ldquoDesign Considshyerations of GFRP-Reinforced CRCP rdquo Field Appli-cations of FRP Reinforcement Case Studies SPshy215 American Concrete Institute Farmington Hills MI
182
mdashmdashmdash 2005 Development and Deployment of Second Generation FRP Composite Applied to Concrete Pavements (Task 3 Continuously Rein-forced Concrete Pavement) Draft Final Report for USDOTFHWA Project DTFH61-99-X-0078 Federal Highway Administration Washington DC
GangaRao H V S H L Chen and P V Vijay 2003 Field Implementation and Performance Evaluation of CRCP with FRP Composite Bars West Virginia University Work Plan Federal Highway Administration Washington DC
Gupta R H Rana and H V S GangaRao 2004 Moisture Diffusion through Neat and Glass-Fiber Reinforced Vinyl Ester Resin Containing Nano-Clay Draft Final Report CFC 04-102 Federal Highway Administration Washington DC
Li H 2004 Evaluation of Jointed Plain Concrete Pavement (JPCP) with FRP Dowels Masterrsquos Theshysis West Virginia University Morgantown
Vijay P V and H V S GangaRao 1999 Devel-opment of Fiber Reinforced Plastics for Highway Application Aging Behavior of Concrete Beams Reinforced with GFRP Bars CFC- WVU Report No 99-265 (WVDOH RP T-699-FRP1) West Virginia Department of Transportation Charleston
Vijay P V H V S GangaRao and H Li 2004 Evaluation of Jointed Plain Concrete Pavements (JPCP) with FRP Dowels Draft Final Report CFC 04-101 Federal Highway Administration Washingshyton DC
Wisconsin
Crovetti J A 1999 Cost Effective Concrete Pave-ment Cross-Sections Report No WISPR 12-99 Wisconsin Department of Transportation Madison
Crovetti J A and D Bischoff 2001 ldquoConstrucshytion and Performance of Alternative Concrete Pavement Designs in Wisconsinrdquo Preprint Paper No 01-2782 80th Annual Meeting of the Transporshytation Research Board Washington DC
Kemp P 2004 High Performance Concrete Pave-ment Construction Report Draft Report WI-04-03 Wisconsin Department of Transportation Madison
Kuemmel D A J R Jaeckel A Satanovsky S F Shober and M M Dobersek 1996 ldquoNoise Characshyteristics of Pavement Surface Texture in Wisconshysinrdquo Transportation Research Record 1544 Transshyportation Research Board Washington DC
Kuemmel D A R C Sonntag J A Crovetti Y Becker J R Jaeckel and A Satanovsky 2000 Noise and Texture on PCC PavementsmdashResults of a Multi-State Study Report Number WISPR-08-99 Wisconsin Department of Transportation Madison (also available at httpchtemarquetteedu noiseamptextureindexhtml)
Scofield L 2003 SR202 PCCP Whisper Grinding Test Sections Final Report Arizona Department of Transportation Phoenix
183

Disclaimer
This document is disseminated under the sponsorship of the Department of Transportation in the interest of information exchange The US Govshyernment assumes no liability for its contents or use thereof This report does not constitute a standard specification or regulation
The US Government does not endorse products or manufacturers Trade or manufacturerrsquos names appear herein only because they are considered essential to the object of this document
Quality Assurance Statement
The Federal Highway Administration (FHWA) provides high-quality inshyformation to serve Government industry and the public in a manner that promotes public understanding Standards and policies are used to ensure and maximize the quality objectivity utility and integrity of its informashytion FHWA periodically reviews quality issues and adjusts its programs and processes to ensure continuous quality improvement
Units of Measure
This document follows the conventions of the reporting States in their use of English units or the International System of Units
ii
Table of Contents
List of Figures XIII
List of Tables XVII
CHAPTER 1 INTRODUCTION 1 Background1 Included Projects 1 Purpose and Overview of Report2 References5
CHAPTER 2 CALIFORNIA 1 (I-10 EL MONTE) 6 Introduction6 Study Objectives6 Project Design and Layout6 State Monitoring Activities6 Preliminary ResultsFindings6 Points of Contact6 References6
CHAPTER 3 COLORADO 1 (SH 121 WADSWORTH COLORADO) 7 Introduction7 Study Objectives7 Project Design and Layout7 State Monitoring Activities7 Preliminary ResultsFindings8 Current Project Status Results and Findings 8 Point of Contact 8 References8
CHAPTER 4 COLORADO 2 (I-25 LOVELAND) AND MICHIGAN 2 (M25 PORT AUSTIN AND I-675 ZILWAUKEE)9 Introduction9 Study Objectives9 Project Design and Layout9
Michigan Concept9 Colorado Concept 10
State Monitoring Activities10 Preliminary ResultsFindings10 Points of Contact11 References11
CHAPTER 5 ILLINOIS 1 (I-55 SB WILLIAMSVILLE) 12 Introduction12 Study Objectives12 Project Design and Layout12 State Monitoring Activities14 Preliminary ResultsFindings15 Interim Project Status Results and Findings15
iii
Current Observations (Gawedzinski 2004) 15 Points of Contact16 References16
CHAPTER 6 ILLINOIS 2 (ROUTE 59 NAPERVILLE) 18 Introduction18 Study Objectives18 Project Design and Layout18 State Monitoring Activities20 Preliminary ResultsFindings 22 Interim Project Status Results and Findings22 Current Observations (Gawedzinski 2004) 24 Points of Contact25 References25
CHAPTER 7 ILLINOIS 3 (US 67 JACKSONVILLE) 26 Introduction26 Study Objectives26 Project Design and Layout26 State Monitoring Activities27 Preliminary ResultsFindings28 Interim Project Status Results and Findings28 Current Observations (Gawedzinski 2004) 29 Points of Contact29 References29
CHAPTER 8 ILLINOIS 4 (ROUTE 2 DIXON)32 Introduction32 Study Objectives32 Project Design and Layout32 State Monitoring Activities32 Points of Contact34 References34
CHAPTER 9 INDIANA 1 (I-65 AT SR-60 CLARK COUNTY) 35 Introduction35 Study Objectives35 Project Design and Layout 35 State Monitoring Activities 36 Preliminary ResultsFindings 36 Points of Contact36 Reference 36
CHAPTER 10 IOWA 1 (A AND B) (HIGHWAY 5 CARLISLE AND US 30 CARROLL) 37 Introduction37 Study Objectives37 Project Design and Layout37 State Monitoring Activities38 ResultsFindings 39
iv
Points of Contact39 References39
CHAPTER 11 IOWA 2 (US 65 DES MOINES) 40 Introduction40 Study Objectives40 Project Design and Layout40 State Monitoring Activities42 Preliminary ResultsFindings42 Final ResultsFindings 42 Points of Contact44 References44
CHAPTER 12 IOWA 3 (US 151 LYNNJONES COUNTIES) 45 Introduction45 Study Objectives45 Project Design and Layout45 State Monitoring 45 Preliminary ResultsFindings45 Points of Contact46 References46
CHAPTER 13 IOWA 4 (IA 330 JASPER STORY AND MARSHALL COUNTIES) 47 Introduction47 Study Objectives47 Project Design and Layout47 State Monitoring Activities48 Preliminary ResultsFindings48 Points of Contact48 References48
CHAPTER 14 IOWA 5 (IOWA 330 MELBOURNE) 49 Introduction49 Study Objectives49 Project Design and Layout49 Preliminary ResultsFindings49 Points of Contact51 Reference 51
CHAPTER 15 IOWA 6 (VARIOUS LOCATIONS)52 Introduction52 Study Objectives52 Project Design and Layout52 State Monitoring Activities52 Preliminary ResultsFindings52 Points of Contact52 Reference 52
v
CHAPTER 16 IOWA 7 AND MD 2 (IMPLEMENTATION OF TEMP) 53 Introduction53 Study Objectives53 Project Design and Layout53 State Monitoring Activities54 Preliminary ResultsFindings54 Point of Contact 54 References54
CHAPTER 17 KANSAS 1 (HIGHWAY K-96 HAVEN) 55 Introduction55 Study Objectives55 Project Design and Layout55 State Monitoring Activities60
Construction Monitoring60 Early Mix Property Data60 Performance Monitoring60
Preliminary ResultsFindings60 Cost Data61 Early Performance Data63
Interim ResultsFindings64 References64
CHAPTER 18 KANSAS 2 (HUTCHINSON) 67 Introduction67 Study Objectives67 Project Design and Layout67 State Monitoring Activities67 Preliminary ResultsFindings67 Point of Contact 67 References67
CHAPTER 19 MARYLAND 1 (US 50 SALISBURY BYPASS) 68 Introduction68 Study Objectives68 Project Design and Layout68 State Monitoring Activities69 Interim ResultsFindings69 Points of Contact70 References70
CHAPTER 20 MICHIGAN 1 (I-75 DETROIT)71 Introduction71 Study Objectives71 Project Design and Layout71
Section 1mdashMichigan Standard Pavement72 Section 2mdashEuropean Pavement72
State Monitoring Activities75
vi
ResultsFindings 76 Initial Construction Findings 76 One-Year Performance Findings 77 Five-Year Performance Findings77 Traffic 77 Pavement Distress78 Roughness 78 Deflection Analysis79 Surface Friction79 Economic Analysis of Pavement Sections79
Point of Contact 80 References80
CHAPTER 21 MINNESOTA 1 (I-35W RICHFIELD) 81 Introduction81 Study Objectives81 Project Design and Layout81 State Monitoring Activities83 Preliminary ResultsFindings83
Cement Paste Specification83 Aggregate Specification83 Pavement Thickness83 Load Transfer84 Cost 84
Point of Contact 84 References84
CHAPTER 22 MINNESOTA 2 (MNROAD LOW-VOLUME ROAD FACILITY) 85 Introduction85 Study Objectives86 Project Design and Layout86 State Monitoring Activities88 Preliminary Results and Findings88 Point of Contact 91 References91
CHAPTER 23 MINNESOTA 3 (MNROAD MAINLINE ROAD FACILITY AND US 169 ALBERTVILLE) 92 Introduction92 Study Objectives92 Project Design and Layout92 State Monitoring Activities96 Preliminary ResultsFindings96 Current Project Status Results and Findings 96
CHAPTER 24 MISSISSIPPI 1 (US 72 CORINTH)98 Introduction98 Study Objectives98 Project Design and Layout98
vii
State Monitoring Activities101 Construction Monitoring101 Performance Monitoring101
Preliminary ResultsFindings101 Point of Contact 102 References102
CHAPTER 25 MISSOURI 1 (I-29 ROCK PORT)103 Introduction103 Study Objectives103 Project Design and Layout103 State Monitoring Activities105 Preliminary ResultsFindings105 Interim ResultsFindings106 Point of Contact 107 References107
CHAPTER 26 NEW HAMPSHIRE HPCP PROJECT108 Introduction108 Study Objectives108 ResultsFindings 108
HPCP Definitions 108 Optimization Computer Program108 Program Availability110
Point of Contact 110 References110
CHAPTER 27 OHIO 1 2 AND 3 (US ROUTE 50 ATHENS) 111 Introduction111 Study Objectives111 Project Design and Layout111
General Design Information 111 Project Layout Information113
OH 1 Evaluation of Ground Granulated Blast Furnace Slag 113 OH 3 Evaluation of Joint Sealing Materials 115
State Monitoring Activities115 ResultsFindings 115
OH 1 Evaluation of Ground Granulated Blast Furnace Slag115 OH 2 Evaluation of Alternative Dowel Bars 117 OH 3 Evaluation of Joint Sealing Materials 118
Points of Contact120 References120
CHAPTER 28 OHIO 4 (US 35 JAMESTOWN) 121 Introduction121 Study Objectives121 Project Design and Layout121 State Monitoring Activities121 ResultsFindings 122
viii
Points of Contact123 Reference 123
CHAPTER 29 PENNSYLVANIA 1 (SR 22 MURRYSVILLE)124 Introduction124 Study Objectives124 Project Design and Layout124 State Monitoring Activities124 Preliminary ResultsFindings124 Point of Contact 125
CHAPTER 30 SOUTH DAKOTA 1 (US ROUTE 83 PIERRE)126 Introduction126 Study Objectives126 Project Design and Layout126 Preliminary ResultsFindings128 Interim ResultsFindings130 Points of Contact130 References130
CHAPTER 31 TENNESSEE 1 (I-65 NASHVILLE) 131 Introduction131 Study Objectives131 Project Design and Layout131 State Monitoring Activities131 Preliminary ResultsFindings131 Point of Contact 132 Reference 132
CHAPTER 32 VIRGINIA 1 (I-64 NEWPORT NEWS) 133 Introduction133 Study Objectives133 Project Design and Layout133 State Monitoring Activities135 Preliminary ResultsFindings137 Project Status 137 Point of Contact 137 References137
CHAPTER 33 VIRGINIA 2 (ROUTE 288 RICHMOND) AND VIRGINIA 3 (US 29 MADISON HEIGHTS)138 Introduction138 Study Objectives138 Project Design and Layout138 State Monitoring Activities138 Preliminary ResultsFindings138 Point of Contact 138
ix
CHAPTER 34 WASHINGTON 1 (SR 395 KENNEWICK)139 Introduction139 Study Objectives139 Project Design and Layout139
Public Relations and Traffic Management 139 Concrete Mixture Properties 139 Construction140
ResultsFindings 142 Points of Contact142 Reference 142
CHAPTER 35 WEST VIRGINIA 1143 Introduction143 Study Objectives143
GFRP Dowel Study143 Moisture Diffusion Study 143 GFRP Rebars in CRCP Study143
Project Design and Layout144 GFRP Dowel Study144 Moisture Diffusion Study 144 GFRP Rebars in CRCP Study144
Current Project Status Results and Findings 144 Findings from GFRP Dowel Study144 Findings from GFRP CRCP Study 145
Points of Contact146 References146
CHAPTER 36 WISCONSIN 1 (HIGHWAY 29 ABBOTSFORD)147 Introduction147 Study Objectives147 Project Design and Layout147
New Wisconsin Sections148 Additional Analysis Sections148 Additional Wisconsin Sections 148 Colorado Sections 149 Iowa Sections 149 Michigan Sections 149 Minnesota Sections 149 North Dakota Sections 149
State Monitoring Activities150 ResultsFindings 150 Points of Contact152 References152
x
CHAPTER 37 WISCONSIN 2 (HIGHWAY 29 OWEN) AND WISCONSIN 3 (HIGHWAY 29 HATLEY)154 Introduction154 Study Objectives154 Project Design and Layout154
Wisconsin 2154 Wisconsin 3157
State Monitoring Activities159 Preliminary ResultsFindings159
Construction Monitoring159 Dowel Bar Location Study159 FWD Testing160 Distress Surveys160 Ride Quality Surveys 160
Points of Contact161 References161
CHAPTER 38 WISCONSIN 4 (I-90 TOMAH) 163 Introduction163 Study Objectives163 Project Design and Layout163 State Monitoring Activities164 Preliminary ResultsFindings164 Points of Contact165 Reference 165
CHAPTER 39 FEDERAL HIGHWAY ADMINISTRATION 1 (FHWArsquoS PAVEMENT TEST FACILITY MCLEAN VA) 166 Introduction166 Study Objectives166 Project Design and Layout166 State Monitoring Activities167 Preliminary ResultsFindings167 Current Project Status Results and Findings 167 Point of Contact 168 References169
CHAPTER 40 VARIOUS STATES MIT SCAN-2170 Introduction170 Study Objectives170 Project Design and Layout171 Preliminary ResultsFindings171
Literature Review Summary 171 Laboratory Testing Results 171 Field Testing Results171
Point of Contact 172 Reference 172
xi
APPENDIX A TE-30 PROJECT SUMMARY TABLE174
APPENDIX B 179
BIBLIOGRAPHIC LISTING OF PROJECT REFERENCES BY STATE 179 Colorado 179 Illinois 179 Indiana 179 Iowa 179 Kansas180 Maryland180 Michigan 180 Minnesota 180 Mississippi 181 Missouri 181 New Hampshire 181 Ohio 181 South Dakota 182 Tennessee182 Virginia 182 Washington 182 West Virginia182 Wisconsin 183
xii
List of Figures
Figure 1 Location of TE-30 and related projects2
Figure 2 Location of CO 2 project9
Figure 3 Precast panel design for Michigan 10
Figure 4 Precast panel installation in Colorado11
Figure 5 Location of IL 1 project 12
Figure 6 Illinois DOT hinge joint design (IDOT 1989) 13
Figure 7 Layout of IL 1 project 13
Figure 8 Load transfer efficiency on IL 1 (Gawedzinski 2000) 14
Figure 9 Maximum joint deflections on IL 1 (Gawedzinski 2000) 15
Figure 10 Load transfer efficiency vs ESALs (Gawedzinski 2004) 17
Figure 11 Load transfer efficiency vs pavement temperature (Gawedzinski 2004) 17
Figure 13 Layout of IL 2 project 19
Figure 14 Load transfer efficiency on IL 2 (Gawedzinski 2000) 21
Figure 15 Maximum joint deflections on IL 2 (Gawedzinski 2000) 21
Figure 16 Load transfer efficiency vs ESALs for the right lane (Gawedzinski 2004) 23
Figure 17 Load transfer efficiency vs ESALs for the center lane (Gawedzinski 2004) 23
Figure 18 Load transfer efficiency vs ESALs for the left lane (Gawedzinski 2004) 24
Figure 19 Average load transfer efficiency vs pavement temperature for all lanes (Gawedzinski 2004) 25
Figure 20 Location of IL 3 project 26
Figure 21 Layout of IL 3 project 27
Figure 22 Load transfer efficiency on IL 3 (Gawedzinski 2000) 28
Figure 23 Maximum joint deflections on IL 3 (Gawedzinski 2000) 28
Figure 24 Driving lane load transfer efficiency vs ESALs (Gawedzinski 2004) 30
Figure 25 Passing lane load transfer efficiency vs ESALs (Gawedzinski 2004) 30
Figure 26 Average load transfer efficiency vs average pavement temperature (Gawedzinski 2004) 31
Figure 27 Location of IL 4 project 32
Figure 28 Driving lane load transfer efficiency vs ESALs (Gawedzinski 2004) 33
Figure 29 Average load transfer efficiency vs average pavement temperature (Gawedzinski 2004) 34
xiii
Figure 30 Location of IN 1 project35
Figure 31 Location of IA 1 projects 37
Figure 32 Location of IA 2 project 40
Figure 33 Layout of IA 2 project41
Figure 34 Illustration of dowel bar spacing configurations on IA 241
Figure 35 Average load transfer efficiency for IA 2 project 43
Figure 36 Average faulting on IA 2 project43
Figure 39 Location of IA 4 project 47
Figure 42 Location of strain gauges on elliptical FRP dowel bar 51
Figure 43 Location of KS 1 project 55
Figure 44 Photo of X-Flextrade load transfer devices 56
Figure 46 Relative construction costs by section for KS 162
Figure 47 Comparison of Initial Profile Index of KS 1 test sections (Zero-Blanking Band) 64
Figure 49 Location of MD 1 project68
Figure 50 Location of MI 1 project 71
Figure 51 Layout of MI 1 project 72
Figure 52 Cross section for Michigan standard pavement (Smiley 1995) 73
Figure 53 Cross section for European pavement (Smiley 1995) 74
Figure 54 Variable dowel spacings used on European pavement section (Weinfurter Smiley and Till 1994)76
Figure 55 Cumulative total traffic volumes for MI 1 test sections (Buch Lyles and Becker 2000) 78
Figure 56 Computed IRI values for MI 1 test sections (Buch Lyles and Becker 2000)78
Figure 57 Computed friction numbers for MI 1 test sections (Buch Lyles and Becker 2000)80
Figure 58 Location of MN 1 project81
Figure 60 Approximate location of new LVR test sections at MnRoad facility 85
Figure 61 Layout of test sections 52 and 53 for MN 2 project 87
Figure 62 Load transfer efficiency of joints with different types of dowel bars for MN 2 project 89
Figure 63 Differential deflections across joints with different types of dowel bars for MN 2 project89
Figure 64 Transverse profile of unrestrained slab in Cell 53 for MN 2 project (Vandenbossche 2003)90
Figure 65 Diagonal profile of unrestrained slab in Cell 53 for MN 2 project (Vandenbossche 2003)90
xiv
Figure 66 Diagonal profile of restrained slab in Cell 52 for MN 2 project (Vandenbossche 2003)91
Figure 67 Location of MN 3 project92
Figure 68 Location of MS 1 project 98
Figure 69 Layout of test sections at the intersection of US 72 and Hinton Street South Parkway and Liddon Lake Road99
Figure 70 Layout of test sections at the intersection of US 72 and Cass Street 100
Figure 71 Relative unit costs of the test sections100
Figure 72 Location of MO 1 project103
Figure 73 Layout of MO 1 test sections (MoDOT 2000) 104
Figure 74 Relative cost of MO 1 test sections (MoDOT 2000)105
Figure 75 Transverse cracking on MO 1 test sections (MoDOT 2000) 106
Figure 76 Transverse and longitudinal cracking on MO 1 test sections (Chojnacki 2004)107
Figure 77 Transverse cracking on MO 1 test sections107
Figure 78 Location of OH 1 2 and 3 projects 111
Figure 79 Layout of experimental projects on Ohio US 50113
Figure 80 Layout of dowel test sections on Ohio US 50 project 114
Figure 81 Dowel instrumentation layout for Ohio US 50 project (Sargand 2000)114
Figure 82 Joint channel configurations used in sealant study on Ohio US 50 project (Hawkins Ioannides and Minkarah 2000) 117
Figure 83 Location of OH 4 project 121
Figure 84 Location of PA 1 project 124
Figure 85 Location of SD 1 project 126
Figure 88 Load transfer efficiencies for SD 1 sections 130
Figure 89 Location of VA 1 project 133
Figure 90 Layout of VA 1 test sections (Ozyildirim 2000)134
Table 50 Concrete Mix Designs Used in VA 1 Project (Ozyildirim 2000)135
Figure 91 Location of VA 2 and VA 3 projects 138
Figure 92 Location of WA 1 project 139
Figure 93 Strength-time relationship developed for WA 1 project 141
Figure 94 Contractorrsquos critical path method schedule for WA 1 project141
xv
Figure 95 Breakdown of time consumed by each construction activity on WA 1 project 142
Figure 96 Location of WI 1 project 147
Figure 97 Surface friction of WI 1 test sections (Kuemmel et al 2000) 151
Figure 98 Relative noise rankings of pavement surface texturings (Kuemmel et al 2000) 153
Figure 99 Location of WI 2 and WI 3 projects 154
Figure 100 Alternative dowel bar layouts used on WI 2 155
Figure 101 Approximate layout of WI 2 test sections 156
Figure 102 Variable cross section used on WI 3 157
Figure 103 Approximate layout of WI 3 monitoring sections158
Figure 104 Transverse joint load transfer for outermost wheelpath on WI 2 (Crovetti 1999) 161
Figure 106 Average IRI values in the outer traffic lanes of WI 2 and WI 3 pavement sections (Crovetti and Bischoff 2001)162
Figure 107 Location of WI 4 project 163
Figure 108 Stainless steel dowels and basket on WI 4 (Kemp 2004)165
Figure 109 Layout of test sections and instrumentation for FHWA 1 project (FHWA 2004) 167
Figure 110 Close-up view of MIT Scan-2170
Figure 111 Example sectional contour map (tomography) of electro-magnetic signal detected by MIT Scan-2 a) severely distorted basket with bars pulled out b) properly placed dowel basket 172
xvi
List of Tables
Table 1 Listing of TE-30 and Related Projects 3
Table 3 Ranges of Edge Stresses Measured Under an 18-Kip Single-Axle Load on the CO 1 Project Test Sections 8
Table 4 Traffic Data for IL 1 (September 1996 to September 1999) (Gawedzinski 2000) 14
Table 6 Gradation of Porous Granular Embankment Subgrade Crushed Stone Material 18
Table 7 Experimental Design Matrix for IL 2 20
Table 8 Traffic Data for IL 2 (September 25 1997 to January 31 2000) (Gawedzinski 2000)21
Table 9 Traffic Data for IL 2 (September 25 1997 to June 16 2003) (Gawedzinski 2004)22
Table 10 Experimental Design Matrix for IL 3 27
Table 11 Current Traffic for Driving and Passing Lanes (Gawedzinski 2004)29
Table 12 Data Collection Date and Cumulative ESALs (Gawedzinski 2004) 33
Table 13 Summary of Proposed Instrumentation (Nantung 2004)36
Table 14 Experimental Design Matrix for IA 137
Table 15 Tests Conducted at IA 1 Test Sites38
Table 16 Experimental Design Matrix for IA 241
Table 17 Simplified Experimental Design Matrix for KS 158
Table 18 Summary of Early Mix Properties of KS 1 Test Sections (Wojakowski 1998) 61
Table 19 Summary of Construction Cost Data for KS 1 (Wojakowski 1998) 62
Table 20 Summary of Early Performance Data for KS 1 Project (KDOT 1998 KDOT 1999)63
Table 21 Summary of 2002 Performance Data for KS 1 Project (KDOT 2002)65
Table 22 Summary of 2003 Performance Data for KS 1 Project (KDOT 2003)66
Table 23 Mixture Properties of Concrete Used on MD 169
Table 24 Fiber Characteristics for MD 269
Table 25 Comparison of Specified Concrete Properties on MI 1 Project (Weinfurter Smiley and Till 1994)75
Table 26 Summary of Deflection Testing Results for MI 1 Sections (Buch Lyles and Becker 2000)79
Table 27 Experimental Design Matrix for MN 1 Project 82
Table 29 Sensor Types and Quantities for Test Sections 32 52 and 5388
Table 30 Summary of US 169 Whitetopping Test Sections for MN 3 Project93
xvii
Table 31 Summary of MnRoad Whitetopping Test Sections for MN 3 Project94
Table 32 Flexural Strengths for US 169 on the MN 3 Project 94
Table 33 Compressive Strengths for US 169 on the MN 3 Project 95
Table 34 Compressive Strengths for I-94 on the MN 3 Project 95
Table 35 Elastic Moduli for I-94 on the MN 3 Project95
Table 36 Poissonrsquos Ratio for I-94 on the MN 3 Project 95
Table 37(a) International Roughness Index (IRI) Measured on the MS 1 Test Sections (mmkm) 101
Table 37(b) Profile Index Measured on the MS 1 Test Sections (inmi)102
Table 37(c) Friction Numbers Measured on the MS 1 Test Sections102
Table 37(d) Rutting Measured in the MS 1 HMA Test Section (in) 102
Table 38 Experimental Design Matrix for MO 1 104
Table 39 Summary of Design Characteristics for HPCP Classifications (Goodspeed 1999)109
Table 40 Comparison of Actual Base and Subbase Gradations Used on Ohio US 50 Project112
Table 41 Concrete Pavement Mix Design Used on Ohio US 50 Project 114
Table 42 Sealant Materials Used in Joint Sealant Study on Ohio US 50 Project (Hawkins Ioannides and Minkarah 2000)116
Table 43 Summary of Sealant Costs on Ohio US 50 Project (Ioannides et al 1999) 119
Table 44 Stiffness and Modulus Sample Results from OH 4 Testing 122
Table 45 Design Features for the PA 1 Project 125
Table 46 Design Features of SD 1 Test Sections (Ramakrishnan and Tolmare 1998)127
Table 47 Experimental Design Matrix for SD 1127
Table 48 NMFRCP Mix Design Used in SD 1 Project (Ramakrishnan and Tolmare 1998) 128
Table 49 Summary of Past Concrete Pavement Projects in Tennessee 132
Table 51 Summary of Concrete Properties Measured on VA 1 Project (Ozyildirim 2000)136
Table 52 Concrete Mix Design Used on WA 1 Project140
Table 53 Characteristics of Concrete Used on WA 1140
Table 54 Experimental Design Matrix for WI 2156
Table 55 Experimental Design Matrix for WI 3158
Table 56 Summary of Dowel Bar Location Study Results From WI 2 (Crovetti 1999) 159
Table 57 Summary of FWD Test Results for WI 2 and WI 3 Projects (Crovetti 1999)160
xviii
Table 58 Test Section Design Parameters for FHWA 1 Project (CTL 2001) 166
Table 59 Performance of UTW Test Sections (CTL 2001 FHWA 2004)168
xix
ACKNOWLEDGMENTS
Many individuals contributed to the development of this report by willingly providing research reports work plans internal memos and other documentation on their TE-30 projects The authors gratefully acknowledge the following individuals for providing that assistance
Ahmad Ardani Colorado DOT Mark Gawedzinski Illinois DOT David Lippert Illinois DOT Tommy Nantung Indiana DOT Jim Cable Iowa State University Mark Dunn Iowa DOT John Wojakowski Kansas DOT Dimitrios Goulias University of Maryland David Smiley Michigan DOT Tom Hines Michigan DOT Dave Rettner Minnesota DOT Curt Turgeon Minnesota DOT Tom Burnham Minnesota DOT Randy Battey Mississippi DOT Tim Chojnacki Missouri DOT Charles Goodspeed University of New Hampshire Shad Sargand Ohio University Anastasios Ioannides University of Cincinnati Roger Green Ohio DOT V Ramakrishnan South Dakota School of Mines and Technology
Daniel Strand South Dakota DOT Dave Huft South Dakota DOT Dan Johnston South Dakota DOT Celik Ozyildirim Virginia Transportation Research Council David Kuemmel Marquette University
Jim Crovetti Marquette University
Debbie Bischoff Wisconsin DOT Peter Kemp Wisconsin DOT
xx
Chapter 1 INTRODUCTION
Background
Under Test and Evaluation Project 30 (TE-30) High Performance Concrete Pavement (HPCP) the Federal Highway Administration (FHWA) is exshyploring the applicability of innovative portland ceshyment concrete (PCC) pavement design and conshystruction concepts in the United States These innovative concepts ranging from the use of trapeshyzoidal cross sections to alternative dowel bar mateshyrials to fiber-reinforced concrete all share the same TE-30 goal of providing long-lasting economical PCC pavements that meet the specific performance requirements of their particular application
The TE-30 program actually got its start in May 1992 when a team of State industry and Federal engineers participated in the US Tour of European Concrete Highways (US TECH) (FHWA 1992) During that visit the tour participants were exposed to a wealth of information on concrete pavement materials structural design and construction that could benefit concrete pavements in the United States Followup visits to Germany and Austria in October 1992 (Larson Vanikar and Forster 1993) provided additional information that was used to construct an experimental concrete pavement in the United States consisting of a German structural deshysign (to provide long service life) and an Austrian exposed aggregate surface (to reduce tire paveshyment noise) That pavement a 16-km (1-mi) test section located in the northbound lanes of I-75 (Chrysler Freeway) in downtown Detroit was conshystructed in 1993 (Weinfurter Smiley and Till 1994)
The success of the I-75 project in incorporating European design concepts that hold the promise of long-lasting low maintenance concrete pavements spawned a great interest in pursuing similar proshyjects In 1994 both the FHWA and industry agreed to pursue this effort effectively launching the TEshy30 program Broad functional or performance criteshyria were established so that participating State highway agencies (SHAs) could select the area conshysidered appropriate for improving the performance of concrete pavements in their States
Several innovation areas for the program were sugshygested
bull Increasing the service life
bull Decreasing construction time
bull Lowering life-cycle costs
bull Lowering maintenance costs
bull Constructing ultra-smooth ride quality pavements
bull Incorporating recycled or waste products while maintaining quality
bull Utilizing innovative construction equipshyment or procedures
bull Utilizing innovative quality initiatives
Specific target projects were later added including joint sealing alternatives alternative load transfer devices durable concrete mix designs alternative surface finishing techniques and more cost-effective use of paving materials (such as widened lanes trapezoidal cross sections and two-lift conshystruction)
In each of these applications emphasis is given to an integrated design approach in which site influshyences (traffic loading climate and subgrade) conshycrete mix design structural design joint details and construction are considered together to develop the appropriate pavement design Consequently the term ldquohigh performancerdquo does not necessarily refer to high strength concrete but rather to any of the materials and mix design structural design or conshystruction components of the pavement that are exshypected to contribute to the pavementrsquos long-term performance
Included Projects
The TE-30 Program has funded approximately 25 field projects since 1996 As previously noted these projects were intended to test and evaluate innovashytive concrete pavement technology in ldquoon-the-roadrdquo applications A report (FHWA 2002) summarized
1
the status of the projects initiated through Decemshyber 2001 several topic-specific reports were also prepared based on the results of the original FHWA report (Hoerner and Smith 2002 Smith 2002)
Since the preparation of the original report several additional field projects have been constructed and additional monitoring reports completed Moreover projects originally included in a similar FHWA test and evaluation project Field Trials of Concrete Pavement Product and Process Technology have been or are in the process of being constructed The projects included in this report are those from the previous FHWA report (FHWA 2002) with an addishytional 14 projects included from the Field Trials of Concrete Pavement Product and Process Technolshyogy initiative
The geographical distribution of the included proshyjects is shown in Figure 1 and the projects are listed in Table 1 For each project the table inshycludes information on the design features evaluated the year built the type of concrete pavement (jointed plain concrete pavement [JPCP] jointed reinforced concrete pavement [JRCP] continuously reinforced concrete pavement [CRCP] precast post-tensioned concrete pavement (PPCP) or fiber-reinforced concrete pavement [FRCP]) and whether the project was funded as part of the TE-30 program More detailed information on each project is provided in the relevant chapter and in Appendix A to this report
Purpose and Overview of Report
The previous FHWA report (FHWA 2002) provides the foundation for this report The 24 projects deshyscribed in that original report have been updated where new information was available and an addishytional 15 projects have been included in this report Most of these newer projects have been constructed and since the TE-30 program is ongoing it is necshyessary to ascertain the status of those projects that have been constructed
It is the purpose of this report to document the curshyrent status of the TE-30 projects and the Field Tri-als of Concrete Pavement Product and Process Technology sections as well The authors have also attempted to describe anticipated results from the TE-30 program and to recommend relevant future research activities Chapters 2 through 39 of this report summarize each individual project included to date describing the goals of the project the deshysign features being evaluated and any preliminary results or products
Two appendixes are included in support of this reshyport Appendix A provides a summary table conshytaining general design and construction information on each of the projects Appendix B lists references relevant to each of the projects organized by State
Figure 1 Location of TE-30 and related projects
2
Table 1 Listing of TE-30 and Related Projects
PAVEMENT YEAR PROJECT TE-30 TYPE DESIGN FEATURES EVALUATED BUILT
California 1 No PPCP Precast post-tensioned concrete pavement 2004 I-10 El Monte
Colorado 1 No UTW Ultrathin whitetopping 2001 SH 121 Wadsworth
Colorado 2 No JPCP Precast concrete slabs for full-depth repairs 2004 I-25 Loveland
Illinois 1 No JRCP Alternative dowel bar materials 1996 I-55 SB Williamsville
Illinois 2 Yes JRCP Alternative dowel bar materials 1997 IL 59 Naperville JPCP Sealedunsealed joints
Traffic counters
Illinois 3 Yes JPCP Alternative dowel bar materials 1999 US 67 WB Jacksonville Sealedunsealed joints
Illinois 4 No JPCP Alternative dowel bar materials 2000 SR 2 NB Dixon
Indiana 1 Yes JPCP Factors to reduce curlingwarping 2004 I-65 at SR 60 Clark County
Iowa 1a Yes JPCP PCC mixing times on PCC properties 1996 IA 5 Carlisle
Iowa 1b Yes JPCP PCC mixing times on PCC properties 1996 US 30 Carroll
Iowa 2 Yes JPCP Alternative dowel bar materials 1997 US 65 Bypass Des Moines Alternative dowel bar spacings
Iowa 3 Yes JPCP Fly-ash stabilization of PCC 2001 US 151 LinnJones
Iowa 4 No JPCP Elliptical steel dowel bars 2002 IA 330 Jasper Story and Marshall Counties
Iowa 5 No JPCP Elliptical fiber-reinforced polymer dowel bars 2002 Iowa 330 Melbourne
Iowa 6 No Various Fly-ash stabilization of subgrade for PCC pavements NA Various locations
Iowa 7 No Various Total Environmental Management for Paving (TEMP) NA
Kansas 1 Yes JPCP Alternative dowel bar materials 1997 K-96 Haven FRCP Alternative PCC mix designs (including fiber PCC)
Joint sawing alternatives Joint sealing alternatives Surface texturing Two-lift construction
Kansas 2 Yes JPCP Smoothness monitoring of plastic concrete 2001 Hutchinson
Maryland 1 Yes JPCP PCC mix design 2001 US 50 Salisbury Bypass FRCP Fiber PCC
Michigan 1 No JRCP Two-lift construction 1993 I-75 NB Detroit JPCP Exposed aggregate
Thick foundation Alternative dowel bar materials and spacing
3 Continued on page 4
Continued from page 3
PROJECT TE-30 PAVEMENT
TYPE DESIGN FEATURES EVALUATED YEAR BUILT
Michigan 2 M25 Port Austin I-675 Zilwaukee
No JRCP Precast concrete slabs for full depth repairs 2003
Minnesota 1 Yes JPCP Alternative dowel bars 2000 I-35W Richfield PCC mix design
Minnesota 2 Yes JPCP Alternative dowel bar materials 2000 MnROAD Low Volume Road Facility Albertville
Dowelednondoweled joints PCC mix design
Minnesota 3 MnROAD Mainline Road Facility and US 169 Albertville
No UTW Application of ultrathin whitetopping 1997
Mississippi 1 US 72 Corinth
Yes Resin-Modified
Alternative PCC paving material (resin-modified pavement)
2001
Missouri 1 Yes JPCP Fiber PCC 1998 I-29 SB Rock Port FRCP Slab thickness
Joint spacing
New Hampshire 1 Yes NA HPCP definitions ldquoDesign Optimizationrdquo computer program
NA
Ohio 1 US 50 Athens
Yes JRCP PCC mix design (GGBFS) Evaluation of HIPERPAV
1997shy1998
Ohio 2 Yes JRCP Alternative dowel bar materials 1997 US 50 Athens
Ohio 3 US 50 Athens
Yes JRCP Sealedunsealed joints 1997shy1998
Ohio 4 US 35 Jamestown
Yes JPCP Evaluation of soil stiffness using nondestructive testing devices
2001
Pennsylvania 1 SR 22 Murrysville
Yes JPCP Evaluation of HIPERPAV 2004
South Dakota 1 US 83 Pierre
Yes JPCP FRCP
PCC mix design Joint spacing Dowelednondoweled joints
1996
Tennessee 1 I-65 Nashville
No JPCP Implementation of performance-related specifications 2004
Virginia 1 I-64 Newport News
Yes JPCP PCC mix design 1998shy1999
Virginia 2 VA 288 Richmond
Yes CRCP PCC mix design Steel contents
2004
Virginia 3 US 29 Madison Heights
Yes CRCP PCC mix design Steel contents
2004
Washington 1 SR 395 Kennewick
No JPCP PCC mix design for rapid construction 2000
West Virginia 1 Corridor H Route 219 Elkins University Avenue Routes 857 and 119 Morgantown Route 9 between Martinsburg and Charlestown
No JPCP
JPCP
CRCP
Alternative dowel bar materials size spacing
Alternative dowel bar materials and FRP moisture diffusion FRP versus steel longitudinal reinforcing bars
2002 2002
2006
Wisconsin 1 WI 29 Abbotsford
Yes JPCP Surface texturing 1997
4 Continued on page 5
Continued from page 4
PROJECT TE-30 PAVEMENT
TYPE DESIGN FEATURES EVALUATED YEAR BUILT
Wisconsin 2 Yes JPCP Alternative dowel bar materials 1997 WI 29 Owen Alternative dowel bar spacings
Wisconsin 3 Yes JPCP Alternative dowel bar materials 1997 WI 29 Hatley Alternative dowel bar spacings
Trapezoidal cross section
Wisconsin 4 I-90 Tomah
Yes JPCP Alternative dowel bar materials PCC mix design
2002
FHWA 1 No UTW Ultrathin whitetopping repair techniques 1998shy1999
Various States 1 No JPCP Evaluation of magnetic tomography for dowel bar location (MIT Scan-2)
2003 +
KEY CRCP = continuously reinforced concrete pavement FRCP = fiber-reinforced concrete pavement FRP = fiber-reinforced polymer GGBFS = ground granulated blast furnace slag JPCP = jointed plain concrete pavement JRCP = jointed reinforced concrete pavement PCC = portland cement concrete PPCP = precast post-tensioned concrete pavement
References
Federal Highway Administration (FHWA) 1992 Report on the 1992 US Tour of European Con-crete Highways FHWA-SA-93-012 Federal Highshyway Administration Washington DC
mdashmdashmdash March 2002 High Performance Concrete Pavements Project Summary FHWA-IF-02-026 Federal Highway Administration Washington DC
Hoerner T E and K D Smith 2002 High Per-formance Concrete Pavement Pavement Texturing and Tire-Pavement Noise FHWA-IF-02-020 Fedshyeral Highway Administration Washington DC
Larson R M S Vanikar and S Forster 1993 US Tour of European Concrete Highways (US
TECH) Follow-Up Tour of Germany and Austriamdash Summary Report FHWA-SA-93-080 Federal Highway Administration Washington DC
Smith K D 2002 High Performance Concrete Pavement Alternative Dowel Bars for Load Trans-fer in Jointed Concrete Pavements FHWA-IF-02shy052 Federal Highway Administration Washington DC
Weinfurter J A D L Smiley and R D Till 1994 Construction of European Concrete Pave-ment on Northbound I-75mdashDetroit Michigan Reshysearch Report R-1333 Michigan Department of Transportation Lansing
5
Chapter 2 CALIFORNIA 1 (I-10 EL MONTE)
Introduction
Caltrans has undertaken this project to evaluate the feasibility of using precast post-tensioned concrete pavement for rapid replacement of a deteriorated roadway
Study Objectives
The objectives of the project are to demonstrate the constructibility and cost effectiveness of precast post-tensioned concrete pavements under high-volume urban freeway conditions
Project Design and Layout
The project includes the replacement of a 248-ft section of I-10 in Los Angeles County A total of 31 precast concrete pavement segments were fabrishycated in accordance with the ldquoTexasrdquo design as deshyscribed by Merritt McCullough and Burns (2003) Replacement panels were precast in segments 24 m (8 ft) long 113 m (37 ft) wide and 254 mm (10 in) thick The panels contain formed keyways along the edges normal to the direction of travel Three types of precast panels are fabricated base panels joint panels and central stressing panels The nominal pavement thickness is 254 mm (10 in) with a grade reversal at the outside shoulder with increased thickness at the crown In the construction process the panels are placed and then post tenshysioned in the direction of travel using stressing pockets in the slabs at the mid length of each secshytion
State Monitoring Activities
Under contract with FHWA a research agency is monitoring the performance of the project for a minimum of 1 year If funding allows cracking smoothness and spalling evaluations will also be conducted at years 3 and 5 Other evaluation items
will include expansion joint condition and vertical slab movements
Preliminary ResultsFindings
This experimental project was completed in April 2004 Precasting of the 31 panels began in Decemshyber 2003 and was completed in early January 2004 The panels were then stored until the construction crew was ready for installation The panels were placed in 2 nights followed by 4 days of post-tensioning and grouting Currently a construction video is available from FHWA and a construction report will be completed within the next year
Points of Contact
Kirsten Stahl Pavement Engineer Caltrans District 7 100 S Main Street Los Angeles CA 90012 (213) 897-0470 kirstenstahldotcagov
Jason Dietz FHWA California Division Office 980 9th Street Suite 400 Sacramento CA 95814-2724 (916) 498-5886 jasondietzfhwadotgov
References
Merritt D K B F McCullough and N H Burns 2003 ldquoPrecast Prestressed Concrete Pavement Pilot Project Near Georgetown Texasrdquo Transportation Research Record 1823 Transportation Research Board Washington DC
6
Chapter 3 COLORADO 1 (SH 121 Wadsworth Colorado)
Introduction
The Colorado Department of Transportation (CDOT) constructed three experimental thin white-topping test sections in 1996 and 1997 An addishytional 64-km (4-mi) test section was constructed in 2001 on SH 121 just south of Denver near Wadsworth Colorado The original three test secshytions were instrumented and the resulting pavement response and performance data were used in the development of a design procedure for thin white-topping overlays The fourth test section was conshystructed to validate the design procedure that was developed
Study Objectives
The objective of this project is to instrument conshystruct load test and monitor the performance of a thin whitetopping test section The results will be used to validate the design procedure developed based on the test sections constructed in 1996 and 1997 More information on the test sections conshystructed in 1996 and 1997 can be found in the report by Tarr Sheehan and Okamoto (1998)
Project Design and Layout
A 10-year 13 million 18-kip ESAL design was developed for the thin whitetopping test section usshying the CDOT design procedure The resulting deshysign consisted of milling to promote bonding beshytween the existing hot mix-asphalt (HMA) and the
overlay A 1524 mm (6-in) PCC overlay was then placed on the remaining 140 mm (55 in) of HMA Both the longitudinal and transverse joints were sawed 18 m (6 ft) apart This section contained four additional designs which contained various combinations of overlay thicknesses and joint spacshying as shown in Table 2
The concrete mix did contain fibers Dowel bars were not included in any of the test sections but tie bars were included along all longitudinal joints at 762-mm (30-in) spacings
The volume of traffic on this section of roadway is relatively high but the traffic consists primarily of cars and light trucks
State Monitoring Activities
Monitoring activities included collecting strain measurements in conjunction with static load testshying performing distress surveys recording temshyperature gradients and performing shear bond strength testing on pavement cores These activities were performed at 28 days and at 1 year after conshystruction Load testing was performed again in 2003 The load testing consisted of applying an 18shykip rear axle load In 2003 a 30-kip tandem axle load was also used Loads were applied at the corshyner edges and midpanel of the slab Temperatures throughout the slab and asphalt were collected every 15 minutes while the load testing was being performed
Table 2 Summary of CO 1 Project Test Sections
TEST SECTION
PCC OVERLAY
THICKNESS (IN)
HOT-MIX ASPHALT
THICKNESS (IN)
LONGITUDINAL JOINT SPACING
(FT)
TRANSVERSE JOINT
SPACING (FT)
1 39 50 4 4
2 45 50 6 6
3 65 50 6 9
4 65 50 6 6
7
Preliminary ResultsFindings
The average bond shear strength was 100 lbfin2 and this appears to be sufficiently high to provide good performance for the overlay designs represhysented on State highway 121
The strains induced by the static 18-kip single-axle load placed along the edge of the slab were conshyverted to stress and are summarized in Table 3 The data show a reduction in stress as the slab thickness increases and the panel size decreases
The stress predicted by the design equations was calculated for the loading conditions in the field The predicted stresses were lower than the stresses determined using the measured strains This is exshypected because the measured strains did not capture curling and warping restraint stresses
Table 3 Ranges of Edge Stresses Measured Under an 18-Kip Single-Axle Load on the
CO 1 Project Test Sections
TEST SECTION
PCC THICKNESS
(IN) PANEL SIZE
(FT)
STRESS RANGE
(LBFIN2)
1 39 4 x 4 80ndash175
2 45 6 x 6 75ndash160
3 65 6 x 9 55ndash110
4 65 6 x 6 60ndash100
Current Project Status Results and Findings
A final report on the revisions to the thin whitetopshyping design procedure (Sheehan Tarr and Tayabji 2004) is available from the Colorado Department of Transportation
Point of Contact
Ahmad Ardani Colorado Department of Transportation 4201 East Arkansas Ave Rm A-100 Denver CO 80222 AhmadArdanidotstatecous (303) 757-9978
References
Sheehan M J S M Tarr and S D Tayabji 2004 Instrumentation and Field Testing of Thin White-topping Pavement in Colorado and Revision of the Existing Colorado Thin Whitetopping Procedure Report No CDOT-DTD-R-2004-12 Colorado Deshypartment of Transportation Denver
Tarr S M M J Sheehan and P A Okamoto 1998 Guidelines for the Thickness Design of Bonded Whitetopping Pavement in the State of Colorado Report No CDOT-DTD-R-98-10 Coloshyrado Department of Transportation Denver
8
Chapter 4 COLORADO 2 (I-25 Loveland) and MICHIGAN 2 (M25 Port Austin and I-675 Zilwaukee)
Introduction
An alternative to conventional cast-in-place conshycrete repairs is the use of precast concrete patches to address issues related to joint and slab deteriorashytion The use of precast panels has the potential to reduce construction time increase long-term paveshyment performance and reduce user delays Howshyever there are limited laboratory or field data on the construction and performance of full-depth precast concrete patches In 2003 Michigan State Univershysity in conjunction with the Michigan and Colorado Departments of Transportation (DOTs) initiated an FHWA-sponsored project to study the feasibility of precast panels as an alternative to cast-in-place conshycrete repairs Sites in both Colorado (Figure 2) and Michigan were selected
Figure 2 Location of CO 2 project
Study Objectives
The objectives of this project are (Buch 2002)
1 Review the literature and document the known practices
2 Conceptualize various construction alternashytives as they relate to precast concrete patches
3 Identify potential concrete pavement restorashytion projects along in-service concrete paveshyments in Colorado and Michigan and install precast concrete patches For the purposes of
poses of comparison control cast-in place full-depth patches will also be installed
4 Investigate the effectiveness and efficiency of precast panels through the development of maintenance performance guidelines
5 Recommend strategies for monitoring the ldquonewlyrdquo installed precast patches
6 Produce step-by-step guidelines for the conshystruction of precast concrete panels
Project Design and Layout
Hundreds of precast panels will be installed and monitored for performance along interstate highshyways in Michigan and Colorado The construction in Michigan will include the installation of 20 preshycast panels 12 along M25 (Port Austin) and 8 along I-675 (Zilwaukee) These 20 panels were slated for installation during the summer of 2003 The reshymaining panels will be installed on I-25 in Colorado beginning summer of 2003 and concluding in 2005 Nearly 450 panels will be installed on I-25 in Coloshyrado
The means of anchoring the precast panels is differshyent between the Michigan studies and the Colorado studies Details of each method are described in the following sections
Michigan Concept The concept being used in Michigan is illustrated in Figure 3 and is completed by using the following techniques
bull Mark and saw cut the perimeter (full depth) of the existing deteriorated concrete paveshyment area and allow time for the rest of the slab to ldquorelaxrdquo and relieve stresses The width of the patch should be the same as one of the standard widths for precast conshycrete patches
bull Cut dowel and tie bar slots in the adjoining concrete slabs
9
Joint Sealant
Existing Slab Mortar or Aggregate
Dowel Bar Tie Bar
Precast SlabBedding
Figure 3 Precast panel design for Michigan
bull Remove the existing concrete and compact the exposed base
bull Place a bedding of aggregate or mortar (rapid setting) to adjust slab elevation if needed
bull Lower the precast concrete panel fitted with dowels and tie bars into the prepared opening Adjust the elevation and grout the dowel bar slots The lift holes in the precast concrete slab should also be grouted and finished
bull Seal all construction joints
bull Diamond grind when needed to restore ride quality
Colorado Concept The Colorado DOT is using a proprietary technolshyogy that was developed by URETEK USA Inc for tying the slabs URETEK USA Inc has developed the Stitch-In-Timetrade technology which is a repair system for restoring load transfer to jointed cracked spalled or otherwise damaged concrete pavement URETEKrsquos Stitch-In-Timetrade System uses a series of 13-mm (05-in) saw-cut slots to position a 6-mm (025-in) thick composite insert
The slots and inserts are easily filled with sand and bonded into place with a hybrid high-density polyshymer Rapid curing characteristics allow almost imshymediate traffic restoration The Stitch-In-Timetrade system is being used to tie the precast panels to the existing concrete pavement (URETEK 2004) Figshyure 4 shows a precast panel installation in Colorado
State Monitoring Activities
The research team will collect pre-construction inshyformation such as pavement conditions traffic and inventory data for the panels to be replaced (Buch 2002) The entire construction process will be documented After panel placement continued pershyformance monitoring consisting of deflection measurements (load carrying capacity and load transfer) visual distress surveys and ride measureshyments will be completed for a minimum of 3 years
Preliminary ResultsFindings
Preliminary results are not available at this time however an installation report and information video should be available by summer 2004
10
Figure 4 Precast panel installation in Colorado
Points of Contact References
Ahmad Ardani PE Research Engineer Colorado Department of Transportation 4201 E Arkansas Denver CO 80222 Ph (303) 757-9978 Fax (303) 757-9974 ahmadardanidotstatecous
Neeraj Buch PhD Assistant Professor 3546 Engineering Building Department of Civil and Environmental Engineering Michigan State University East Lansing MI 48821 Ph (517) 432-0012 Fax (517) 432-1827 buchegrmsuedu
Buch N 2002 Field Trials of Concrete Pavement Product and Process TechnologymdashPrecast Panel System for Full Depth Pavement Repairs Technical Proposal Michigan State University East Lansing
URETEK 2004 httpwwwuretekusacom servicesstitch_in_timeindexhtm
11
Illinois 1I-55 SB
Williamsville55
74
88
55
74
88
Chapter 5 ILLINOIS 1 (I-55 SB Williamsville)
Introduction
This project was the first constructed by the Illinois Department of Transportation (IDOT) to evaluate alternative dowel bars for use in jointed concrete pavements Constructed in 1996 the project is loshycated on the exit ramp of a weigh station in the southbound direction of I-55 (milepost 107) near Williamsville just north of Springfield (see Figure 5) Although not a TE-30 project it did serve as a springboard for future IDOT projects evaluating alternative dowel bars under the TE-30 program
Williamsville
SpringfieldIllinois 1 I-55 SB
Williamsville
Williamsville
Springfield
55
74
88
Figure 5 Location of IL 1 project
Study Objectives
On most concrete pavements steel dowel bars are used at transverse joints to provide positive load transfer between adjacent slabs However even if epoxy coated these dowel bars are susceptible to corrosion which can create locked or ldquofrozenrdquo joints that can spall and crack the concrete signifishycantly reducing the service life of the pavement The purpose of this study therefore is to compare the performance of non-corrosive type lsquoErsquo fibershyglass and polyester dowels to the performance of conventional epoxy-coated dowel bars in a side-byshyside field evaluation project
Project Design and Layout
This project was constructed in 1996 and consists of a 280-mm (1125-in) slab placed on a 100-mm (4-in) bituminous aggregate subbase (BAM) (Gawedzinski 2000) In accordance with IDOT practices at the time the jointed concrete paveshyment was constructed as a hinge-joint design in which conventional doweled transverse joints are spaced at 137-m (45-ft) intervals and intermediate ldquohingerdquo joints containing tie bars are placed at 46shym (15-ft) intervals between the doweled joints (see Figure 6) this pavement is essentially a jointed reinforced design with the reinforcing steel conshycentrated at locations where the pavement is exshypected to crack The hinge joints contain number 6 epoxy-coated tie bars 900-mm (36-in) long and placed at 450-mm (18-in) intervals across the joint (Gawedzinski 2000) Preformed compression seals (32-mm [125-in] wide) are placed in the doweled transverse joints and a hot-pour joint seal placed in the tied hinge joints (Gawedzinski 2000)
The pavement was paved 49-m (16-ft) wide and a 30-m (10-ft) tied portland cement concrete (PCC) shoulder was placed adjacent to the mainline exit ramp The shoulders were tied using number 6 epshyoxy-coated tie bars 900 mm (36 in) long and placed at 762-mm (30-in) intervals (Gawedzinski 2000)
Seven joints (excluding hinge joints) are included in the project the layout of which is shown in Figshyure 7 The first two regular transverse joints of the project contain conventional epoxy-coated steel dowel bars (38-mm [15-in] diameter) The next four regular transverse joints contain type lsquoErsquo fishyberglass and polyester bars (38-mm [15-in] diameter and 450-mm [18-in] long) The fiberglass and polyester resin bars were manufactured by RJD Industries of Laguna Hills California The final regular transverse joint in the project contains conventional epoxy-coated steel dowel bars
12
Figure 6 Illinois DOT hinge joint design (IDOT 1989)
45 f45 ftt BetwBetweeeenn CCoontntrraaccttioion Join Joinnttss
FroFromm WWeeigighh StaStattiioonn
2 Hi2 Hingnge Joe Jointintss 15 ft 15 ft
ToTo I-55I-55 SBSB
1616 ftft
JoJoinint 1t 1 ContContrrooll JoJoinintt
1155--inin EpEpoxoxyy--CCooaatteedd
JoJoinint 3t 3 JoJoinint 5t 5 115-5-iinn FFiiberber 115-5-inin FFiibbeerr
CoCompompossititee DoDowewelsls CoCommppoossitite Doe Dowelswels
JJooinint 7t 7 CoContntrol Joirol Joinntt
1515--inin EpEpoxoxyy--CoatedCoated DoDo Joinwelswels Joint 2t 2 JoinJoint 4t 4 JJooinin Dowt 6t 6 Doweellss
ConConttrorol Joinl Jointt 115-i5-inn FiFibeberr 115-5-iinn FFiiberber 1155--in Epin Epoxy-oxy-CCooatedated CoCompositmpositee DowDoweelsls CCoompmpososititee DoDowweelsls
DoDowelwelss
Figure 7 Layout of IL 1 project
13
State Monitoring Activities
IDOT collects traffic data from the sorter scale loshycated at the entrance ramp of the weigh station Traffic totals from the period from September 1996 to September 1999 are summarized in Table 4 (Gawedzinski 2000)
Table 4 Traffic Data for IL 1 (September 1996 to September 1999) (Gawedzinski 2000)
TRUCK TYPE NUMBER OF VEHICLES
ACCUMULATED 18-KIP ESAL
APPLICATIONS
Single unit 95623 31324
Multiple unit 1860542 3056458
TOTALS 1956165 3087783
All seven joints in the project are evaluated at least semi-annually by IDOT to assess their performance This evaluation consists of both distress surveys
and nondestructive testing using the falling weight deflectometer (FWD) Results from the FWD testshying program are plotted in Figures 8 and 9 (Gawedzinski 2000) Figure 8 shows the load transshyfer efficiency (LTE) across each of the seven joints as a function of time whereas Figure 9 shows the maximum joint deflection measured at each joint as a function of time
A gradual decrease in overall load transfer effishyciency is observed in Figure 8 with the convenshytional steel dowel bars consistently showing higher levels of load transfer then the fiber composite bars But as seen in Figure 9 the largest deflection is consistently shown by one of the conventional doweled joints although the other two conventional doweled joints show consistently low deflections LTE values less than 70 percent provide very low stress load transfer and the results of the LTE testshying suggest that many of the joints are exhibiting an unacceptable LTE level after only 75 years
Figure 8 Load transfer efficiency on IL 1 (Gawedzinski 2000)
14
Figure 9 Maximum joint deflections on IL 1 (Gawedzinski 2000)
Preliminary ResultsFindings
After about 4 years of service this project is pershyforming well None of the joints is exhibiting any signs of distress IDOT will continue monitoring the project to assess the relative performance of the different dowel bar types
Interim Project Status Results and Findings
Truck data continues to be gathered from the sorter scale installed in the entrance ramp of the weigh station Equivalent single-axle loads (ESALs) were computed using scale vendor software and standard IDOT design coefficients Reported ESAL counts are lower than actual applied ESALs due to the failure of the hard drive on the sorter scale comshyputer for a 135-month period from January 23 2002 to March 13 2003 ESAL counts for the missing period were projected using the truck data previously gathered from the scale and manual counts obtained from scale operators Cumulative ESAL estimates are provided in Table 5 (Gawedzshyinski 2004)
Visual observations of the joints show no obvious signs of pavement distress neither faulting nor spalling was evident at any of the seven joints The
original construction had the joints sealed with a preformed elastomeric joint seal material comshypressed into a 1575-mm (062-in) wide joint Over time the preformed elastomeric joint material has been pushed deeper into the saw cut especially in the wheelpaths Deflection LTE and joint deflection values were determined for each of the seven paveshyment joints The average values were determined from deflections measured as simulated 4- 8- and 12-kip loads were applied to the pavement on the approach and leave sides of the joints The joints were tested at both inner and outer wheelpaths and at the center of the lane for a total of 18 tests per joint
Figure 10 (Gawedzinski 2004) provides a summary of the LTE verses ESALs as measured over time Figure 11 (Gawedzinski 2004) provides a graph of average pavement temperature at a 4-in depth verses LTE
Current Observations (Gawedzinski 2004)
The Williamsville site is 75 years old and has been subjected to over 101 million ESALs The joints at Williamsville show very little sign of distress or damage The preformed elastomeric joint seal is still intact showing only that it is deeper in the
15
joints under the wheelpaths Overall only very mishynor spalling is displayed at the joints however it is not known if this was due to damage during the cutshyting of the original saw cuts or if it has occurred over time
Evaluation of the FWD data indicate that on avershyage the fiber composite dowel bars perform someshywhat less effectively than the carbon steel control dowel bars Graphs showing the individual joint performance show that changes in deflection and LTE are related to the ldquooverall pavement systemrdquo performance rather than changes in individual joint performance Dips and spikes in deflection and LTE are similar to some degree for all of the joints rather than the joints behaving individually but many of the joints (especially those equipped with FRP bars) are approaching (or have fallen below) the minimum acshyceptable LTE level of 70 percent
More frequent FWD testing is planned for the Wilshyliamsville site in order to evaluate what causes this response for the bars Data show LTE and joint deshyflection do not appear to be affected by changes in pavement temperature It is unknown what the moisshyture content is at the dowel barjoint interface and how much the moisture content effects LTE and joint deflections
Points of Contact
David Lippert (217) 782-8582
Mark Gawedzinski (217) 782-2799 GawedzinskiMJdotilgov
Illinois Department of Transportation Bureau of Materials and Physical Research 126 E Ash Street Springfield IL 62704
References
Gawedzinski M 2000 TE-30 High Performance Rigid Pavements Illinois Project Review Illinois Department of Transportation Springfield
mdashmdashmdash 2004 TE-30 High Performance Rigid Pavements An Update of Illinois Projects Illinois Department of Transportation Springfield
Illinois Department of Transportation (IDOT) 1989 Mechanistic Pavement Design Supplement to Section 7 of the Illinois Department of Transporshytation Design Manual Illinois Department of Transportation Springfield
Table 5 Cumulative ESALs as of the Day of Falling Weight Deflectometer Testing
(Gawedzinski 2004)
DATE CUMULATIVE ESALS
92696 15197
21897 2928175
42297 4851948
92397 10478097
102897 11673290
42798 16371091
111798 21739051
32499 25251204
51399 27196957
92899 31142618
10699 31647308
41300 37106198
61401 57044386
101101 64870239
41702 75513819
10302 86663530
41603 97193091
61103 98418109
10203 100754925
102403 101037149
16
Figure 10 Load transfer efficiency vs ESALs (Gawedzinski 2004)
Figure 11 Load transfer efficiency vs pavement temperature (Gawedzinski 2004)
17
59
74
88
55
74
88
55
Chapter 6 ILLINOIS 2 (Route 59 Naperville)
Introduction
The first TE-30 project constructed in Illinois is located in the southbound lanes of Illinois Route 59 between 75th and 79th Streets just east of Napershyville a suburb of Chicago (see Figure 12) This is IDOTrsquos second project evaluating alternative dowel bar materials and was constructed in 1997 as part of the reconstruction and widening of Illinois Route 59 (Gawedzinski 2000)
Illinois 2Route 59Naperville
Naperville
Springfield
Illinois 2 Route 59 Naperville
59
Naperville
SpringfieldSpringfield
74
88
55
Figure 12 Location of IL 2 project
Study Objectives
The purpose of this project is to continue IDOTrsquos investigation into alternative dowel bar materials by comparing the performance of IDOTrsquos standard steel dowel bars to several different types of altershynative dowel bars (Gawedzinski 2000) This project essentially expands on the IL 1 study by incorporatshying additional alternative dowel bars from several other manufacturers
Secondary objectives of the study include an evaluation of different transverse joint reservoir designs and a comparison of different traffic countshyers Transverse joint reservoir designs include a standard transverse joint configuration containing preformed joint seals narrow-width joints containshying a hot-poured sealant and narrow-width joints left unsealed The traffic counters included in the project are conventional loop detectorspiezo elecshy
tric axle sensors and a new device that measures traffic-induced changes to the earthrsquos magnetic field (Gawedzinski 2000)
Project Design and Layout
This project was constructed in 1997 and consists of a 255-mm (10-in) slab placed on a 305-mm (12-in) aggregate base course (Gawedzinski 2000) A poshyrous granular embankment subgrade (PGES) mateshyrial meeting the gradation shown in Table 6 is loshycated beneath the aggregate base course (Gawedzinski 1997)
Table 6 Gradation of Porous Granular Embankment Subgrade Crushed
Stone Material
SIEVE SIZE PERCENT PASSING
150 mm (6 in)
100 mm (4 in)
50 mm (2 in)
75 μm (200)
97 + 3
90 + 10
45 + 25
5 + 5
Pavement designs for the experimental sections consist of both hinge-joint designs and all-doweled designs As described for IL 1 the hinge-joint deshysign contains conventional doweled transverse joints spaced at 137-m (45-ft) intervals and intershymediate ldquohingerdquo joints containing tie bars at 46-m (15-ft) intervals between the doweled joints (see Figure 6) The hinge joints contain number 6 epshyoxy-coated tie bars 900-mm (36-in) long and placed at 450-mm (18-in) intervals across the joint The all-doweled designs have transverse joints spaced at 46-m (15-ft) intervals and contain dowel bars across every joint The project has three lanes in the southbound direction (total width of 108-m [36-ft]) with the inside and center lanes paved toshygether and the outside lane paved later A tied curb and gutter was placed adjacent to both the inside and outside lanes
In addition to pavement design another variable being evaluated under the study is type of load transfer device The following five load transfer
18
270 ft 450 ft 210 ft 225 ft 150 ft 150 ft 450 ft 450 ft
devices are included (Gawedzinski 1997 Gawedz-inski 2000)
Joint width and joint sealant are other variables that are being evaluated under the study Two of the sections were constructed with 16-mm (062-in) wide transverse joints these were used on the hinge-joint designs only and were sealed with preshyformed elastomeric joint seals conforming to AASHTO M220 (Gawedzinski 2000) The other six sections were constructed with narrow 3-mm (012shyin) transverse joints five of these were sealed with a hot-poured sealant conforming to ASTM D3405 and one section was left unsealed (Gawedzinski 1997)
The layout of the sections is presented in Figure 13 This figure summarizes the main features included in each of the sections The experimental design matrix for this project is shown in Table 7
bull Conventional 38-mm (15-in) diameter epshyoxy-coated steel dowel bars conforming to ASTM M227
bull 38-mm (15-in) diameter polyester and type E fiberglass dowel bars manufactured by RJD Industries
bull 44-mm (175-in) diameter polyester and type E fiberglass dowel bars manufactured by RJD Industries
bull 38-mm (15-in) diameter polyester and type E fiberglass dowel bars manufactured by Corrosion Proof Products Inc
bull 38-mm (15-in) diameter epoxy resin and type E fiberglass dowel bars manufactured by Glasforms Inc
IL Route 59 SB
Section 1Hinge Joint
15-in Steel DowelsWide Joints
Preformed Seal
Section 2Hinge Joint
15-in Fiberglass Dowels(RJD Industries)
Wide JointsPreformed Seal
Section 3All Doweled Joints
15-in Fiberglass Dowels(RJD Industries)
Narrow JointsHot-Poured Sealant
Section 4All Doweled Joints
175-in Fiberglass Dowels(RJD Industries)Narrow Joints
Hot-Poured Sealant
Section 5All Doweled Joints
15-in Fiberglass Dowels(Corrosion Proof Products)
Narrow JointsHot-Poured Sealant
Section 6All Doweled Joints
15-in Fiberglass Dowels(Glasforms Inc)
Narrow JointsHot-Poured Sealant
Section 7All Doweled Joints15-in Steel Dowels
Narrow JointsNo Joint Sealant
Section 8All Doweled Joints15-in Steel Dowels
Narrow JointsHot-Poured Sealant
IL Route 59 SB
Section 1 Hinge Joint
15-in Steel Dowels Wide Joints
Preformed Seal
Section 2 Hinge Joint
15-in Fiberglass Dowels (RJD Industries)
Wide Joints Preformed Seal
Section 3 All Doweled Joints
15-in Fiberglass Dowels (RJD Industries)
Narrow Joints Hot-Poured Sealant
Section 4 All Doweled Joints
175-in Fiberglass Dowels (RJD Industries) Narrow Joints
Hot-Poured Sealant
Section 5 All Doweled Joints
15-in Fiberglass Dowels (Corrosion Proof Products)
Narrow Joints Hot-Poured Sealant
Section 6 All Doweled Joints
15-in Fiberglass Dowels (Glasforms Inc)
Narrow Joints Hot-Poured Sealant
Section 7 All Doweled Joints 15-in Steel Dowels
Narrow Joints No Joint Sealant
Section 8 All Doweled Joints 15-in Steel Dowels
Narrow Joints Hot-Poured Sealant
270 ft 450 ft 210 ft 225 ft 150 ft 150 ft 450 ft 450 ft
Figure 13 Layout of IL 2 project
19
Table 7 Experimental Design Matrix for IL 2
JRCP HINGE-JOINT DESIGN 45-FT JOINT SPACING
JPCP ALL-DOWELED JOINTS 15-FT JOINT SPACING
Preformed Seal
(wide joints)
Hot-Poured Sealant (narrow joints)
No Sealant
Preformed Seal (wide joints)
Hot-Poured Sealant
(narrow joints) No
Sealant
38-mm (15-in) Epoxy-Coated Steel Dowel Bars
Section 1 (270 ft long 6
doweled joints)
Section 8 (450 ft long 30 doweled joints)
Section 7 (450 ft long 30 doweled joints)
38-mm (15-in) Polyes-ter and Type E Fiberglass Dowel Bars (RJD Industries)
Section 2 (450 ft long 10 doweled
joints)
Section 3 (210 ft long 14 doweled joints)
44-mm (175-in) Poly- Section 4 ester and Type E Fi- (225 ft long 15 berglass Dowel Bars doweled joints) (RJD Industries)
38-mm (15-in) Polyes-ter and Type E Fiberglass Dowel Bars (Corrosion Proof Products Inc)
Section 5 (150 ft long 10 doweled joints)
38-mm (15-in) Epoxy- Section 6 Resin and Type E (150 ft long 10 Fiberglass Dowel Bars doweled joints) (Glasforms Inc)
State Monitoring Activities
IDOT collects traffic data for the three southbound and three northbound lanes using two devices bull Peek 241 traffic classifier bull Nu-Metrics Groundhogreg traffic sensors
The Peek 241 uses traditional traffic loop detectors placed in the subbase with piezo electric axle sensors installed in channels sawed in the surface of the pavement (Gawedzinski 1997) The Groundhogreg uses changes in the earthrsquos magnetic field to classify vehishycles and requires only a 178-mm (7-in) diameter hole cored in the new pavement to install the device Howshyever because problems were encountered with the Groundhogreg device no comparisons between the deshyvices are possible (Gawedzinski 2000)
Traffic data for the three experimental southbound lanes are summarized in Table 8 (Gawedzinski 2000) The data are for the period September 25 1997 to January 31 2000 The number of ESALs for each lane
was estimated by applying the percentage of vehicles in each lane to the total number of ESALs that were reported for all three traffic lanes (1515401)
This project is evaluated by IDOT on at least a semishyannual basis Evaluation consists of both distress surshyveys and nondestructive testing using the FWD Reshysults from the FWD testing program are plotted in Figures 14 and 15 for sections 1 through 6 only (Gawedzinski 2000) Figure 14 shows the average load transfer for the six test sections as a function of time whereas Figure 15 shows the average maximum joint deflection measured for the sections as a function of time The best overall load transfer is exhibited by section 1 which contains the conventional steel dowel bars The other sections all vary from about 70 to 85 percent but it is interesting to note how the load transshyfer fluctuates over time presumably because of the season and temperature at the time of testing These LTE values are considered marginal particularly for a pavement that is only a few years old
20
Lo
ad T
ran
sfer
Eff
icie
ncy
()
100
95
90
85
80
75
70
65
60
55
50 S1 S2
Aug-97
Apr-97
Oct-98
Mar-99
Oct-99
S3 S4 S5 S6
T est Section
Jo
int D
efle
ctio
n (m
ils)
900
800
700
600 Aug-97
Apr-97 500 Oct-98
400 Mar-99
Oct-99 300
200
100
000 S1 S2 S3 S4 S5 S6
T est Section
Table 8 Traffic Data for IL 2 (September 25 1997 to January 31 2000) (Gawedzinski 2000)
PROJECT TRAFFIC LANE
TOTAL NUMBER OF VEHICLES OF ALL VEHICLES
ESTIMATED ESALS BASED ON VEHICLE
Outside Lane 1 4687659 286 433404
Middle Lane 2 6040237 368 557668
Center Lane 3 5689235 346 524329
TOTALS 16417687 1000 1515401
Figure 14 Load transfer efficiency on IL 2 (Gawedzinski 2000)
Figure 15 Maximum joint deflections on IL 2 (Gawedzinski 2000)
21
Figure 15 shows that the maximum deflections for all joints is increasing over time with the maximum deshyflection during the October 1999 testing significantly larger for all six sections than the previous maximum deflection values
Preliminary ResultsFindings
After about 3 years of service this project is performshying well None of the joints is exhibiting any signs of distress IDOT will continue monitoring the project to assess the relative performance of the different dowel bar types and of the sealedunsealed joints
One issue for consideration in future installations of fiber composite dowel bars is the method used to seshycure the bar to the basket During construction of the middle and inner lanes of this project it was noted that the fiber composite bars were loose and only partially attached to the upper support wire of the basket (Gawedzinski 1997) A special metal spring clip proshyvided by RJD Industries was ultimately used to secure the dowel bars to the dowel basket and also to provide an additional frictional force to the bar to prevent it from moving as concrete was placed over the basket (Gawedzinski 1997)
Interim Project Status Results and Findings
In August 2002 the Model 241Traffic Classifier was replaced with a Road Reporter manufactured by Intershy
national Traffic CorporationPAT America Inc Daily traffic files are polled periodically and tabulated to provide monthly traffic totals for classification Stanshydard conversion factors used by are used to convert single unit (SU) and multiple unit (MU) truck counts to ESALs In May 2003 land development work on the properties on the east side of IL 59 resulted in an east-west access road intersecting IL 59 at the location of the traffic classifier loops and piezo sensors Traffic signals associated with the new road necessitated reloshycating the traffic classifier site approximately 06 km (04 mi) to the south Work on relocating the site will be complete in 2004 Cumulative ESAL information for each lane as reported by the Illinois Department of Transportation (Gawedzinski 2004) are provided in Table 9
FWD tests are currently performed annually across all of the test sections Certain sections were dropped from the FWD testing for a time due to traffic safety issues These issues were resolved and now FWD results are obtained for both wheelpaths and the center of the lane for all three lanes Visual observations of joint performance are performed periodically noting any changes in the appearance of the pavement Reshysults of the FWD tests are provided in Figures 16 through 18 for the right center and left lanes respecshytively
Table 9 Traffic Data for IL 2 (September 25 1997 to June 16 2003) (Gawedzinski 2004)
CUMULATIVE ESALS
DATE RIGHT LANE CENTER LANE LEFT LANE
82597 1751 4288 1008
4698 73677 146779 33118
101998 160540 306559 71363
32999 210187 412343 95277
101399 319964 614230 141165
42400 393299 761761 173867
101600 480678 909423 212076
51501 560141 981053 280037
5102 661433 1110816 326719
61603 728208 1249667 357084
22
Figure 16 Load transfer efficiency vs ESALs for the right lane (Gawedzinski 2004)
Figure 17 Load transfer efficiency vs ESALs for the center lane (Gawedzinski 2004)
23
Figure 18 Load transfer efficiency vs ESALs for the left lane (Gawedzinski 2004)
Current Observations (Gawedzinski 2004)
Evaluation of the joints shows typical behavior of the joints and the joint sealerfiller material with no obvious signs of spalling or faulting The preformed elastomeric joint sealer remains intact while the ASTM D-6690 (formerly ASTM D-3405) material is acting more as a joint filler in that there are areas across several joints where the material has become debonded from the pavement allowing water and incompressibles into the joint
Observations of the LTE vs time and ESALs graphs as well as the joint deflection vs time and ESALs graphs show somewhat consistent behavior for joint deflection with sections averaging 3 to 5
mils The LTE graphs show behavior consistent with a decrease in joint deflection Figure 19 shows the same type of behavior displayed at the Wilshyliamsville test site (IL 1) Plots of average values show no relationship between LTE or joint deflecshytion and average pavement temperature The control bars (381-mm [15-in] diameter epoxy-coated carshybon steel) have a higher LTE and lower joint deshyflection than any of the fiber composites but the overall performance of the fiber composite bars apshypears to be very close to the behavior of the epoxy-coated steel control set Nevertheless LTE values on the order of 70 to 80 percent after only a few years of service may suggest that the FRP bars are not suitable for long-term performance
24
Figure 19 Average load transfer efficiency vs pavement temperature for all lanes (Gawedzinski 2004)
Points of Contact
David Lippert (217) 782-8582
Mark Gawedzinski (217) 782-2799 GawedzinskiMJdotilgov
Illinois Department of Transportation Bureau of Materials and Physical Research 126 E Ash Street Springfield IL 62704
References
Gawedzinski M 1997 Fiber Composite Dowel Bar Experimental Feature Construction Report Illinois Department of Transportation Springfield
mdashmdashmdash 2000 TE-30 High Performance Rigid Pavements Illinois Project Review Illinois Departshyment of Transportation Springfield
mdashmdashmdash 2004 TE-30 High Performance Concrete Pavements An Update of Illinois Projects Illinois Department of Transportation Springfield
25
72
88
74
55
72
88
74
55
Chapter 7 ILLINOIS 3 (US 67 Jacksonville)
Introduction
The Illinois Department of Transportationrsquos (IDOTrsquos) second TE-30 project and their third evaluating alternative dowel bar materials is loshycated on the two westbound lanes of US Route 67 west of Jacksonville (see Figure 20) This project was constructed in 1999
67
Illinois 3US 67 WBJacksonville
JacksonvilleSpringfield
6767
Illinois 3 US 67 WB Jacksonville
Jacksonville SpringfieldSpringfield
72
88
74
55
Figure 20 Location of IL 3 project
Study Objectives
This project continues IDOTrsquos investigation of alshyternative dowel bar materials and joint sealing efshyfectiveness (Gawedzinski 2000) Several additional fiber composite dowel bars are evaluated in this study that were not included in previous studies and these comparisons are all done using IDOTrsquos now standard all-doweled jointed plain concrete pavement (JPCP) design In addition an unsealed section is included to further investigate the performance of unsealed joints
Project Design and Layout
Constructed in 1999 the basic pavement design for each section is a 250-mm (10-in) thick JPCP placed on a 100-mm (4-in) cement aggregate mixshyture (CAM) base course (Gawedzinski 2000) The existing subgrade was stabilized to a depth of 300 mm (118 in) with lime (Gawedzinski 2000)
Transverse joints are spaced at 46-m (15-ft) intershyvals and tied concrete shoulders are incorporated as part of the construction project
The project consists of seven test sections for evaluating alternative dowel bar materials and unshysealed joints The following load transfer devices are included in the study (Gawedzinski 2000)
bull 38-mm (15-in) diameter polyester and type E fiberglass dowel bars manufactured by RJD Industries
bull 38-mm (15-in) diameter vinyl ester and type E fiberglass dowel bars manufactured by Strongwell (Morrison Molded Fiber Glass Company)
bull 38-mm (15-in) diameter vinyl ester and type E fiberglass dowel bars manufactured by Creative Pultrusions Inc
bull Fiber-Contrade dowel bar manufactured by Concrete Systems Inc and consisting of a fibrillated type E fiberglass and polyester resin tube filled with hydraulic cement
bull 38-mm (15-in) diameter carbon steel rods clad with grade 316 stainless steel manushyfactured by Stelax Industries Inc
bull Conventional 38-mm (15-in) diameter epshyoxy-coated steel dowel bars conforming to ASTM M227
All but one of the sections was sealed with a hot-poured joint sealant conforming to ASTM D 3405 One section was left unsealed to compare the pershyformance of pavements with unsealed joints to that of sealed joints
The layout of the sections is presented in Figure 21 This figure summarizes the main features included in each of the sections The experimental design matrix for this project is shown in Table 10
26
150 ft 150 ft 165 ft 150 ft 150 ft 150 ft 150 ft
UUSS 6677 WWBB
SeSeccttiioonn 11 115-in5-in FFiibbeerglarglassss
DowDoweel Barsl Bars ((RJRJD InD Indudussttrriieess))
SealSealed Joied Joinnttss
SecSecttiioonn 22 115-i5-inn FiFibergbergllassass
DoDowweel Barsl Bars ((MorMorrriissoon Mon Moldldeedd FFiibbeer Gr Gllass Coass Co))
SeSealealedd JoJointsints
SeSectioction 3n 3 115-in F5-in Fiibeberglarglassss
DoDowweell BBaarrss ((CCrreaeatitiveve PuPultltrurusiosionnss
InIncc)) SealSealed Joined Jointsts
SectiSectioon 4n 4 FiFiberglberglass Tass Tubeubess FilFillleded wwiitthh CeCemmentent ((ConConccrete Systrete Systemsems
InIncc)) SeaSealleded JoJointsints
SeSectiction 5on 5 115-5-iinn SSttaaiinlnleessss SStteeeell
ClClaadd DDoowelwel BBaarrss ((StStelelax Inax Industdustrriesies
LtLtdd)) SeSeaalleedd JJooiinntsts
SectiSectioonn 66 115-in5-in EpoEpoxxyy--CoCoatateded
SteelSteel DoDowweell BarsBars UnseUnsealedaled JoJointintss
SecSecttiioonn 77 115-i5-inn EpoxyEpoxy--CoatCoateded
SteeSteel Dowl Doweell BarsBars SeSealealedd JoJointsints
150 ft 150 ft 165 ft 150 ft 150 ft 150 ft 150 ft
Figure 21 Layout of IL 3 project
State Monitoring Activities
IDOT installed an automatic traffic recording stashytion at the project site in February 2000 Traffic data are recorded using a Peek series 3000 ADR traffic classifier (Gawedzinski 2000) No traffic data are currently available Before the pavement was opened to traffic IDOT conducted FWD testshying on the experimental sections in June 1999 Reshysults from the FWD testing program are plotted in Figures 22 and 23 (Gawedzinski 2000) Figure 22
shows the average load transfer for the seven exshyperimental sections in both the driving and passing lanes whereas Figure 23 shows the average maxishymum joint deflection measured for each of the seven experimental sections in both the driving and passing lanes Although the joint deflections are low the load transfer efficiencies (typically beshytween 80 and 90 percent) are not as high as might be expected for a new concrete pavement These initial FWD results will serve as a baseline for comparison with future testing values
Table 10 Experimental Design Matrix for IL 3
250-MM (10-IN) JPCP 46-M (15-FT) JOINT SPACING
SEALED JOINTS (ASTM D3405) UNSEALED JOINTS
38-mm (15-in) diameter polyester and type E fiberglass dowel bars (RJD Industries)
Section 1 (150 ft long 10 joints)
38-mm (15-in) diameter vinyl ester and type E fiberglass dowel bars (Morrison Molded Fiber Glass Company)
Section 2 (150 ft long 10 joints)
38-mm (15-in) diameter vinyl ester and type E fiberglass dowel bars (Creative Pultrusions Inc)
Section 3 (150 ft long 11 joints)
Fiber-Contrade dowel bar consisting of a fibrillated type E fiberglass and polyester resin tube filled with hydraulic cement (Concrete Systems Inc)
Section 4 (150 ft long 10 joints)
38-mm (15-in) diameter carbon steel rods clad with grade 316 stainless steel (Stelax Industries Inc)
Section 5 (150 ft long 10 joints)
38-mm (15-in) diameter epoxy-coated steel dowel bars Section 7 (150 ft long 10 joints)
Section 6 (150 ft long 10 joints)
27
Figure 22 Load transfer efficiency on IL 3 (Gawedzinski 2000)
Figure 23 Maximum joint deflections on IL 3 (Gawedzinski 2000)
Preliminary ResultsFindings
This pavement is performing well after 1 year of service None of the joints are exhibiting any signs of distress IDOT will continue monitoring the proshyject to assess the relative performance of the differshyent dowel bar types and of the sealedunsealed joints
Interim Project Status Results and Findings
FWD tests are conducted semi-annually along with periodic visual observations of joint performance Traffic data are collected using an ADR 3000 manufactured by Peek Traffic The data are periodishy
cally polled and converted to ESALs using standard IDOT conversion factors A summary of the cumushylative ESALs is provided in Table 11
Joints are also periodically observed to look for signs of joint deterioration or distress Joints were formed using a thin saw cut and sealed with an ASTM D 6690 (formerly ASTM D 3405) hot-pour joint seal material Problems affecting ride quality became apparent due to several of the joints being overfilled with the 3405 joint seal material Subseshyquent evaluations noted failure of the 3405 joint seal material to maintain a bond with either side of the pavement at the joint
28
Table 11 Current Traffic for Driving and Passing Lanes (Gawedzinski 2004)
CUMULATIVE ESALS
DATE DRIVING LANE PASSING LANE
62399 0 0
62700 68604 97420
101000 95413 13764
41801 160805 22940
101101 240558 34305
41802 310034 43193
100102 372800 48871
41603 442221 54892
102103 493053 59488
112503 504163
Current Observations (Gawedzinski 2004)
Several joints were observed where the joint seal material was either missing from the wheelpaths or had been pushed deeper in the joint and was debonded from both sides of the pavement joint Small rocks were also compressed into the joint seal material at the joint surface As with the other Illishynois sites no obvious signs of joint distress were apparent during the visual observations
Similar behavior as observed at the older two sites (IL 1 and IL 2) is shown in the following figures The control set (381-mm [15-in] diameter epoxy-coated steel) unsealed epoxy-coated steel bars stainless steel clad carbon steel bars and fibrillated wound fiber composite bars exhibit better LTE and lower joint deflections than the pultruded fiber composite bars but do not show excessive joint deflection indicating failure of the joints The pavement at Jacksonville (IL 3) was constructed on a cement aggregate mixture subbase (CAM 2 with a minimum of 200 lbs of cement per cubic yard)
rather than a granular subbase as in Naperville (IL 2) or a bituminous aggregate mixture subbase (BAM) at Williamsville (IL 1)
An additional FWD test was performed on the drivshying lane of US 67 in November of 2003 to evaluate the joint deflections that had occurred earlier that year Testing was not conducted in the passing lanes due to traffic control problems at the time of the November tests The large shift in average joint deflection vales between the April and October tests necessitated the November retest More frequent testing is scheduled for 2004
Deflection data are presented in Figures 24 through 26 It is observed that the FRP bars are approaching (or exceeding) the critical LTE value of 70 percent calling into question the capability of these load transfer mechanisms to provide long-term performshyance
Points of Contact
David Lippert (217) 782-8582
Mark Gawedzinski (217) 782-2799 GawedzinskiMJdotilgov
Illinois Department of Transportation Bureau of Materials and Physical Research 126 E Ash Street Springfield IL 62704
References
Gawedzinski M 2000 TE-30 High Performance Rigid Pavements Illinois Project Review Illinois Department of Transportation Springfield
mdashmdashmdash 2004 TE-30 High Performance Concrete Pavements An Update of Illinois Projects Illinois Department of Transportation Springfield
29
Figure 24 Driving lane load transfer efficiency vs ESALs (Gawedzinski 2004)
Figure 25 Passing lane load transfer efficiency vs ESALs (Gawedzinski 2004)
30
Figure 26 Average load transfer efficiency vs average pavement temperature (Gawedzinski 2004)
31
2
72
55
74
88
72
55
74
88
Chapter 8 ILLINOIS 4 (Route 2 Dixon)
Introduction
A fourth project evaluating alternative dowel bars was constructed by the Illinois Department of Transportation (IDOT) in April 2000 The experishymental project is located in the driving lane of the northbound direction of Illinois Route 2 in Dixon (see Figure 27) where it replaced an existing conshycrete pavement (Gawedzinski 2000)
Illinois 4Route 2 NB
Dixon
Dixon
Springfield
2
Illinois 4 Route 2 NB
Dixon
Dixon
SpringfieldSpringfield 72
55
74
88
Figure 27 Location of IL 4 project
Study Objectives
Although not an official TE-30 project this project carries on IDOTrsquos investigation of alternative dowel bar materials The alternative dowel bar materials used in the project included stainless steel tubes filled with cement grout stainless steel clad carbon steel tubes and fiber composite tubes filled with cement grout Two different diameters 38 mm (15 in) and 445 mm (175 in) were used for the stainless steel tubes and for the stainless steel clad dowels The fiber composite tubes were formed using a pultrusion process and were approximately 50 mm (2 in) in diameter The pultrusion process produced a much smoother bar compared to the first generation fibrillated bars Additionally two different methods of securing the bars to the basshykets welding and using cable ties were used in the four sections More detailed construction informashytion is provided by Gawedzinski (2004)
Project Design and Layout
The pavement design for each section is a 240-mm (95-in) doweled JPCP placed over a 300-mm (12shyin) granular base course (Gawedzinski 2000) Transverse joints are spaced at 46-m (15-ft) intershyvals and are sealed with a hot-poured sealant A tied curb and gutter is placed adjacent to the outer drivshying lane of the project
The experimental project consists of five test secshytions evaluating the following alternative dowel bar materials (Gawedzinski 2000)
bull Fiber-Contrade dowel bar manufactured by Concrete Systems Inc and consisting of a pultruded fiber composite tube composed of type lsquoErsquo fiberglass and polyester resin and filled with hydraulic cement
bull 38-mm (15-in) diameter 276 mm (0109 in) thick grade 316 stainless steel tube filled with cement grout
bull 445-mm (175-in) diameter 276 mm (0109 in) thick grade 316 stainless steel tube filled with cement grout
bull 38-mm (15-in) diameter carbon steel rods clad with grade 316 stainless steel manushyfactured by Stelax Industries Inc
bull 445-mm (175-in) diameter carbon steel rods clad with grade 316 stainless steel manufactured by Stelax Industries Inc
Conventional load transfer devices are installed in JPCP sections adjacent to the experimental paveshyment sections
State Monitoring Activities
Traffic data are recorded using a Peek series 3000 ADR traffic classifier IDOT obtained baseline FWD deflection data after the pavement was conshystructed and will monitor its performance on at least a semi-annual basis
32
Interim Project Status Results and Findings
Data has been collected on a semi-annual basis for the past 3 years The cumulative ESALs are proshyvided in Table 12 Results of deflection testing are illustrated in Figures 28 and 29
Table 12 Data Collection Date and Cumulative ESALs (Gawedzinski 2004)
DATE CUMULATIVE ESALS
8100 0
5101 20780
10101 50036
42502 62701
10202 76872
4303 93982
10303 125533
Current Observations (Gawedzinski 2004)
At the time of construction all of the test joints were unsealed Visual observations of the joints show all of the joints performing well with slight spalling possibly due to the pavement being cut too early None of the joints show accumulation of inshycompressible materials in the joint or any signifishycant spalling due to the joints ldquolocking uprdquo Addishytional monitoring will continue The LTE and joint deflection graphs show behavior expected for relashytively new pavements
Figure 28 Driving lane load transfer efficiency vs ESALs (Gawedzinski 2004)
33
Figure 29 Average load transfer efficiency vs average pavement temperature (Gawedzinski 2004)
Points of Contact
David Lippert (217) 782-8582
Mark Gawedzinski (217) 782-2799 GawedzinskiMJdotilgov
Illinois Department of Transportation Bureau of Materials and Physical Research 126 E Ash Street Springfield IL 62704
References
Gawedzinski M 2000 TE-30 High Performance Rigid Pavements Illinois Project Review Illinois Department of Transportation Springfield
mdashmdashmdash TE-30 High Performance Concrete Pave-ments An Update of Illinois Projects Illinois Deshypartment of Transportation Springfield
34
Chapter 9 INDIANA 1 (I-65 at SR-60 Clark County)
Introduction
Indiana is interested in building a jointed concrete pavement with an extended performance life Reshysearch has suggested that jointed concrete pavements built with ldquolow slab curvaturerdquo also have extended pavement life This project located on I-65 in Clark County (see Figure 30) includes various construction and materials properties that will be evaluated to asshysess concrete slab response to environment and the resulting stressstrain relationships
Figure 30 Location of IN 1 project
Study Objectives
This project will investigate the relationship between specific construction and materials factors and longshyterm pavement performance by use of an instrumented pavement These experimental sections will have 38 state-of-the-art vibrating wire strain gauges to monitor the strain in the pavement slabs 5 tilt meters to monishytor the curling direction and tendency and 4 time doshymain reflectometers to determine the moisture content in the pavement base and subgrade A total of 186 data acquisition channels and an automated data acshyquisition unit will be employed to monitor the behavshyior of the pavement slabs In addition there will be 75 iButtontrade temperature sensors (sensors in the form of a button that has a processor and battery life of 3 years to process data inside the button) that will monitor the pavement temperature profile inch-by-inch to detershymine the onset of temperature curling in concrete pavement A GroundHog traffic monitoring system
will be also in place to monitor the traffic and vehicle classifications
A weather station to monitor air temperature relative humidity wind speed wind direction precipitation rate of sub-surface temperature and solar radiation will provide data to predict the behavior of the pavement slabs especially the correlation between climatic conshyditions and the pavement behavior response
The results of this experimental project when fully implemented will minimize or eliminate the needs of early pavement rehabilitation and frequent pavement maintenance
Project Design and Layout
Three one-directional lanes featuring a 3556-mm (14shyin) thick slab will be constructed over a 249-km (155-mi) segment of I-65 during the 2004 construcshytion season Data analysis from this project will be directed toward evaluating the following
bull Low built-in curl (controlling temperature gradients during construction)
bull Low sensitivity to moisture warping (low permeability)
bull Low sensitivity to temperature gradients after construction (low thermal coefficients of conshycrete)
bull Fracture properties tensile strength elastic modulus entrained air permeability and thermal expansion from field concrete
bull Materials properties that impact the above properties include low wc aggregate soundshyness and coarse aggregate fracture properties
The estimated time of completion for this project is 36 months The first 12 months will concentrate on a state-of-the practice review of modern instrumentation to measure important parameters that influence the performance of concrete pavement
Static and dynamic sensors will be embedded in the pavement structure at specific locations to measure the
35
appropriate parameters The dynamic sensors are used to measure pavement response to traffic while the static sensors are used to measure the pavement reshysponse to changes of environmental conditions such as variations of temperature moisture and curling during construction after construction and in-service pavement In addition the traffic and weather condishytions will be monitored by using a GroundHog and an RTWin weather station respectively Table 13 sumshymarizes the instrumentation currently being considshyered for installation for this project (Nantung 2004)
The second 12-month period will consist of the data analysis described This period will include laboratory testing in conjunction with the joint project with Purshydue University to complete a finite element analysis damage model slab contact model layered base model and thermal gradient model Data analysis from this project will be analyzed using the new finite element models to determine the damage analysis of two different dimensions of PCC slabs
The final 12 months will include additional analysis and verification of all data analysis to be included in a final report
State Monitoring Activities
Field monitoring will be limited to the first 12 months after construction
Preliminary ResultsFindings
Selection of the state-of-the-art monitoring equipshyment has been completed Currently Indiana DOT is performing laboratory checks on all equipment prior to implementation during construction A summary of the proposed instrumentation for this project is shown in Table 13 (Nantung 2004)
Points of Contact
Lee Gallivan FHWA-Indiana Division 575 N Pennsylvania St Room 254 Indianapolis IN 46204 (317) 226-7493
Tommy E Nantung (765) 463-1521 x248 TNANTUNGindotstateinus
Scott Newbolds (765) 463-1521 x 244
INDOT Research Division 1205 Montgomery PO Box 2279 West Lafayette IN 47906
Reference
Nantung T E 2004 High Performance Concrete Pavement Indiana Public Works News Volume 5 Number 1 Anchor Media Co
Table 13 Summary of Proposed Instrumentation (Nantung 2004)
SENSOR TYPE MEASUREMENT
TYPE PURPOSE
Vibrating Wire Tiltmeter Tilt angle Measure the curling at all four corners of the slab
Time Domain Reflectometer Moisture Measure the moisture content of the soil under the slab
IButtontrade Temperature Measure the temperature profile in the pavement
GroundHogtrade Traffic Measure vehicle volume vehicle speed and length road surface temperature roadway wetdry condition and amount of salt used for anti-icing
RTWintrade Weather Station Weather Measure air temperature relative humidity wind speed wind direction and precipitation
36
80
5
35
Iowa 1bUS 30 Carroll
Iowa 1aHighway 5 Carlisle
80
35
Chapter 10 IOWA 1 (a and b) (Highway 5 Carlisle and US 30 Carroll)
Introduction
The Iowa Department of Transportationrsquos (DOTrsquos) first TE-30 project consists of an evaluation of the effect of concrete mixing time on several critical plastic and hardened concrete properties This inshyvestigation was conducted using several different mix designs for pavements constructed at two difshyferent sites Iowa Highway 5 near Carlisle and US 30 near Carroll (Cable and McDaniel 1998a) The locations of these sites are shown in Figure 31
30
Carroll
Carlisle
Des Moines
80
5
3030
35
Iowa 1b US 30 Carroll
Carroll
Carlisle
Des Moines
Iowa 1a Highway 5 Carlisle
Figure 31 Location of IA 1 projects
Study Objectives
The issue of mixing time has become a concern to the Iowa DOT as several plant manufacturers have claimed consistent and sufficient mixing in as short as 30 seconds (Cable and McDaniel 1998a) Thereshyfore the primary goal of this research project is to
investigate the effect of concrete mixing time on the resultant air content air distribution consolidashytion and workability of concrete used for pavement construction (Cable 1998) Secondary objectives include the evaluation of a contractor-designed concrete mix and the evaluation of an alternative mixer
Project Design and Layout
The investigation of mixing time on concrete propshyerties was conducted at both the Carlisle and Carshyroll test sites Nominal mixing times of 30 45 60 and 90 seconds were selected for evaluation and two different mix designs were used a standard mix developed by the Iowa DOT and a contractor-developed mix (Cable and McDaniel 1998a) No information on the exact composition of the two mixes is available but the contractor mix reportshyedly is a ldquoShilstonerdquo mix containing a uniformly graded aggregate
Two different mixers were also employed in the study A standard 765 m3 (10 yd3) drum mixer was used at the Carlisle project whereas a modified drum mixer employing rotation of blades within the drum was used at the Carroll project (Cable and McDaniel 1998a) The same contractor was emshyployed for the construction of each paving project The experimental design matrix for this study is shown in Table 14
Table 14 Experimental Design Matrix for IA 1
Mixing Time (seconds)
CARLISLE TEST SITE (STANDARD DRUM MIXER)
CARROLL TEST SITE (MODIFIED DRUM MIXER)
Iowa DOT Mix Contractor Mix Iowa DOT Mix Contractor Mix
30 X
45 X X X
60 X X
90 X X
37
State Monitoring Activities
To achieve the objectives of this project the Iowa DOT and the Iowa State University jointly particishypated in the testing and monitoring of the concrete mixing and paving activities The paving was pershyformed in the summer of 1996
The testing methods in ASTM C 94 were used in this study to determine the significance of the mixshying time on the consistency of the concrete mix deshylivered and placed on grade (Cable and McDaniel 1998a) ASTM C 94 is designed to check the conshysistency of the material at the beginning and near the end of the truck discharge Using this standard measurements of slump unit weight air content retained coarse aggregate and compressive strength were obtained and used to compare the consistency of the mix at different points of delivery (Cable and McDaniel 1998a)
At both the Carlisle and Carroll sites the tests listed in Table 15 were conducted for each combination of mixing time and mix design included in the investishygation For the slump unit weight plastic air conshytent and wash tests samples were obtained from three different locations for the same load of mateshy
rial the center of the haul truck the side of the haul truck and on grade in front of the paver (Cable and McDaniel 1998a) Compressive testing of cylinders and cores was performed on concrete retrieved from the same batch as for the slump unit weight air content and wash tests (Cable and McDaniel 1998a) Air void distribution testing was conducted on hardened concrete cores also taken from the same batch (Cable and McDaniel 1998a)
The haul trucks to be tested were selected at ranshydom at approximately frac12- to 1-hour increments (Cashyble and McDaniel 1998a) Trucks were selected for testing only when the paver and plant were in conshytinuous operation to ensure representative samples Sufficient concrete was obtained from each truck to provide for tests of slump unit weight air content and for the preparation of cylinders for compressive testing (Cable and McDaniel 1998a) Upon compleshytion of the unit weight test the material in the unit weight bucket was washed through a sieve to reshymove all fines and cement and then the retained coarse aggregate was weighed and compared to the unit weight and the expected weight of coarse agshygregate in the unit weight bucket (Cable and McDaniel 1998a)
Table 15 Tests Conducted at IA 1 Test Sites
TEST TEST METHODOLOGY TESTING LOCATIONSSPECIMENS
Slump Conducted in accordance with ASTM C143 Center of truck Side of truck On grade in front of paver
PCC unit weight Conducted in accordance with ASTM C138 Center of truck Side of truck On grade in front of paver
Air content (plastic concrete) Conducted in accordance with ASTM C231 Center of truck Side of truck On grade in front of paver
Wash test Conducted in accordance with ASTM C94 Center of truck Side of truck On grade in front of paver
Compressive strength (cylinders) Conducted in accordance with ASTM C42 Cylinders cast from each specific batch
Compressive strength (cores) Conducted in accordance with ASTM C42 Cores obtained from known batch locashytions
Air void distribution (cores) Measured using low-vacuum electron microscope and computer imaging analysis
Cores obtained behind the paver
38
The approximate location of a sampled batch of concrete in the pavement was recorded during the paving operation for later coring operations (Cable and McDaniel 1998a) Core sampling was conshyducted at the noted locations after the concrete had reached a strength of 34 MPa (500 lbfin2)
The instruments used for the air void analysis of hardened concrete cores were a Hitachi 2460 N low-vacuum scanning electron microscope a Tetra back-scattered electron detector Deben stage autoshymation and an Oxford Instrument ISIS x-ray analyshysis system (Cable and McDaniel 1998a) Samples were prepared from the cores and special software was used to determine the area and size of the air voids in each image (Cable and McDaniel 1998a)
No further monitoring or reporting is anticipated This project has now been completed
ResultsFindings
Extensive statistical analyses were conducted on the data collected from each test site Comparisons of key concrete properties (slump unit weight air content and compressive strength) were made beshytween testing location (side center or on grade) and between the various mixing times (30 45 60 and 90 seconds) Based on these analyses the folshylowing general conclusions were drawn (Cable 1998 Cable and McDaniel 1998a)
bull Dump-truck-type hauling units do not signifishycantly change the quality of the material beshying delivered to the paver and should conshytinue to be allowed in addition to agitator-type hauling vehicles
bull Mixing times of 60 seconds or greater do have a positive influence on the physical characteristics of the concrete product and should be retained as the minimum mixing time for all mixer types
bull Mixing times did not significantly affect the hardened air content or distribution for the Iowa DOT mix designs but the data showed conflicting results for the contracshytor-designed mix This may be the result of
a different matrix of coarse and fine aggreshygates in the contractor mix Therefore it is recommended that contractor mix designs should be thoroughly laboratory tested prior to use in the field to determine the impact of admixtures and differences in aggreshygatecement matrix on the physical pershyformance characteristics of the mix
bull Mixing times of less than 60 seconds should be allowed only when steps have been taken to change the mixing process to ensure coating of all aggregates prior to mixer discharge into the hauling unit
bull Visual examination of the mix at the Car-lisle site (30- and 45-second mixing times) indicated visible sand seams (uncoated sand particles) in the discharged material The concrete produced under this set of mixing conditions was also noted to be very diffishycult to place and finish
Points of Contact
Jim Cable Iowa State University Department of Civil and Construction Engineering 378 Town Engineering Building Ames IA 50011 (515) 294-2862
Mark Dunn Iowa Department of Transportation 800 Lincoln Way Ames IA 50011 (515) 239-1111
References
Cable J K 1998 ldquoEvaluation of Mix Time on Conshycrete Consistency and Consolidationrdquo Proceedings Crossroads 2000 Conference Ames IA
Cable J K and L L McDaniel 1998a Effect of Mix Times on PCC Properties Iowa DOT Project HR-1066 Iowa Department of Transportation Ames
39
80
35
Iowa 2US 65 Bypass
Des Moines
80
35
Chapter 11 IOWA 2 (US 65 Des Moines)
Introduction
The Iowa Department of Transportationrsquos second TE-30 project consists of an evaluation of alternashytive dowel bar materials and spacings The experishymental project was constructed in 1997 on the US 65 Bypass near Des Moines (Cable and McDaniel 1998b) Figure 32 shows the location of this project
65Des Moines
80
6565
35
Des Moines
Iowa 2 US 65 Bypass
Des Moines
Figure 32 Location of IA 2 project
Study Objectives
Because of the susceptibility of steel dowel bars to corrosion the Iowa DOT has expressed interest in the use of alternative dowel bar materials to provide load transfer across transverse joints in concrete pavements Therefore one of the goals of this proshyject is the comparative study of concrete pavement joints containing fiber reinforced polymer (FRP) dowel bars stainless steel dowel bars and convenshytional epoxy-coated steel dowel bars under the same design criteria and field conditions (Cable and McDaniel 1998b) Another goal of the project is the investigation of the transverse joint load transfer characteristics of alternative dowel bar spacings (Cable and McDaniel 1998b) This evaluation is a 5-year study being performed through the combined efforts of the Iowa Department of Transportation and the Iowa State University
Project Design and Layout
This project was constructed in 1997 on the northbound lanes of the US 65 Bypass near Des Moines The basic design for the project is a 305shymm (12-in) JPCP on a 152-mm (6-in) granular
base course (Cable and McDaniel 1998b) Transshyverse joints are located at 61-m (20-ft) intervals and are skewed 61 in the counterclockwise direcshytion (Cable and McDaniel 1998b) Both transverse and longitudinal joints are sealed with a hot-poured sealant Number 5 tie bars 914 mm (36 in) long and spaced at 762-mm (30-in) intervals were meshychanically inserted by the paver across the longitushydinal centerline joint (Cable and McDaniel 1998b)
The shoulder for the JPCP is a 203-mm (8-in) asshyphalt concrete (AC) layer paved 24 m (8 ft) wide on the outside edge and 16 m (6 ft) on the inside edge (Cable and McDaniel 1998b) Longitudinal subdrains are located under the outside shoulder and adjacent to the edge of the outside driving lane (Cable and McDaniel 1998b)
Four different load transfer systems are included in the study a fiber composite dowel bar manufacshytured by Hughes Brothers a fiber composite dowel bar manufactured by RJD Industries a solid stainless steel dowel bar and a conventional epoxy-coated steel dowel bar (Cable and McDaniel 1998b) The Hughes Brothers dowel bar is 48 mm (188 in) in diameter whereas the other dowel bars are 38 mm (15 in) in diameter The required dishyameters for the alternative dowel bars were detershymined from laboratory testing and experimental research performed by the manufacturers (Cable and McDaniel 1998b)
A standard spacing of 305 mm (12 in) was used for each load transfer system included in the study In addition sections were constructed using a spacing of 203 mm (8 in) for the alternative dowel bar mashyterials The experimental design matrix for this proshyject is shown in Table 16 and the layout of the test sections is shown in Figure 33 The dowel bar spacshying configurations used on this project are illusshytrated in Figure 34
Fiber composite tie bars were also provided by the fiber composite dowel bar manufacturers for instalshylation in their respective test sections However these fiber composite tie bars had a tendency to ldquofloatrdquo to the top of the surface during or immedishyately after their placement (Cable and McDaniel
40
440 ft 417 ft 100 ft 80 ft 222 ft 556 ft 477 ft
Table 16 Experimental Design Matrix for IA 2
305-MM (12-IN) JPCP 61-M (20-FT) JOINT SPACING (SKEWED)
203-mm (8-in) Dowel Spacing 305-mm (12-in) Dowel Spacing
38-mm (15-in) Diameter Dowel
48-mm (188-in) Diameter Dowel
38-mm (15-in) Diameter Dowel
48-mm (188-in) Diameter Dowel
Fiber composite dowel bars (Hughes Brothers)
Section 1 (440 ft) Section 2 (417 ft)
Fiber composite dowel bars (RJD Industries)
Section 3 (100 ft) Section 4 (80 ft)
Stainless steel dowel bars Section 5 (222 ft) Section 6 (556 ft)
Epoxy-coated steel dowel bars Section 8 (477 ft)
US 65 NB
Section 1188-in Fiber Composite
Dowel Bars(Hughes Brothers)8 in Dowel Spacing
Section 2188-in Fiber Composite
Dowel Bars(Hughes Brothers)
12 in Dowel Spacing
Section 315-in Fiber
Composite DowelBars
(RJD Industries)8 in Dowel Spacing
Section 415-in Fiber
Composite Dowel Bars
(RJD Industries)12 in Dowel Spacing
Section 515-in Stainless
Steel Dowel Bars8 in Dowel Spacing
Section 615-in Stainless Steel
Dowel Bars12 in Dowel Spacing
Section 715-in Epoxy-Coated
Steel Dowel Bars12 in Dowel Spacing
US 65 NB
Section 1 188-in Fiber Composite
Dowel Bars (Hughes Brothers) 8 in Dowel Spacing
Section 2 188-in Fiber Composite
Dowel Bars (Hughes Brothers)
12 in Dowel Spacing
Section 3 15-in Fiber
Composite Dowel Bars
(RJD Industries) 8 in Dowel Spacing
Section 4 15-in Fiber
Composite Dowel Bars
(RJD Industries) 12 in Dowel Spacing
Section 5 15-in Stainless
Steel Dowel Bars 8 in Dowel Spacing
Section 6 15-in Stainless Steel
Dowel Bars 12 in Dowel Spacing
Section 7 15-in Epoxy-Coated
Steel Dowel Bars 12 in Dowel Spacing
440 ft 417 ft 100 ft 80 ft 222 ft 556 ft 477 ft
Figure 33 Layout of IA 2 project
Outer Traffic Lane
Inner Traffic Lane
12 dowels 12-in spacings
12 dowels 12-in spacings
Outer Traffic Lane
Inner Traffic Lane
12 dowels 12-in spacings
12 dowels 12-in spacings
a) 12-ia) 12-inn SpacingSpacingss
Outer Traffic LaneInner Traffic Lane
18 dowels 8-in spacings
18 dowels 8-in spacings
b) 8-in Spacings
Outer Traffic Lane Inner Traffic Lane
18 dowels 8-in spacings
18 dowels 8-in spacings
b) 8-in Spacings
Figure 34 Illustration of dowel bar spacing configurations on IA 2
41
1998b) This was attributed to either an incompatishybility of the automatic tie bar inserter to the smaller diameter of the fiber composite tie bars or to the lighter weight of the fiber composite bars themshyselves (Cable and McDaniel 1998b) After several bars surfaced in succession the epoxy-coated steel tie bars were used on the remainder of the project
State Monitoring Activities
The performance of these test sections was monishytored under a 5-year monitoring program (from the fall of 1997 through the spring of 2003) being conshyducted jointly by the Iowa DOT and the Iowa State University (Cable and Porter 2003) The following monitoring activities were conducted (Cable and Porter 2003)
bull Visual distress survey using LTPP proceshydures As part of these surveys joint openshyings were monitored using PK masonry nails placed along joints in each section and joint faulting was measured using a Georgia Digishytal Faultmeter
bull Deflection testing using a Dynatest Falling Weight Deflectometer (FWD) Within each section deflection testing was performed at three joints and at three center slab locashytions per lane Testing was performed twice a year once in March or April (to represent a ldquoweakrdquo foundation condition) and once in August or September (to represhysent a ldquostrongrdquo foundation condition)
In addition ground penetrating radar (GPR) was used to establish the location (depth and orientashytion) of dowel bars and tie bars (Cable and Porter 2003) At the end of 5 years selected joints in each section were cored and the condition of each dowel bar type was inspected (Cable and Porter 2003)
Preliminary ResultsFindings
During the construction of the project several items were noted to be of importance to future inshystallations of alternative dowel bars in concrete pavements (Cable and McDaniel 1998b)
bull The original method of securing the fiber composite and stainless steel dowel bars to the basket was inadequate To address this plastic zip ties were fastened around each basket brace loop and end of dowel to hold them in place Any excess tie length was cut or turned down to prevent surface finshyishing problems
bull The placement of the stainless steel dowels required three to five people to handle the baskets Future use of stainless steel dowshyels will require ldquoxrdquo braces welded to the basket to prevent side sway and collapse during handling
bull Nails were attached to the bottom of the fishyber composite tie bars to facilitate their loshycation using both cover meters and GPR
bull As stated previously the fiber composite tie bars placed using the automatic tie bar inshyserter on the paver were susceptible to ldquofloatingrdquo to the surface If this is a continushying problem the placement of these bars in tie bar baskets or the use of conventional epshyoxy-coated tie bars may be required
Final ResultsFindings
Project test sections were tested twice a year beshyginning in the fall of 1997 with the final tests in the spring of 2002 (testing could not be performed in the fall of 2000) The results of the FWD testing were interpreted through calculating LTE
The results of the load transfer analysis are illusshytrated in Figure 35 (Cable and Porter 2003) In Figshyure 35 the dowel bars are labeled according to their material and spacing standard epoxy (std epoxy) stainless steel (SS) and fiber composite (FRP) Figure 36 displays the overall average faulting over the period of research (Cable and Porter 2003) Figure 37 illustrates the changes in joint openings over the research period (Cable and Porter 2003) Visual surveys of this project resulted in only mishynor corner cracking being noted immediately after construction There are no visible signs of paveshyment distress that can be associated with joint reinshyforcement or typical highway loading over the 5shyyear monitoring period (Cable and Porter 2003)
42
Std Epoxy SS12 SS 8 15 FRP
12 15 FRP 8 188 FRP
Driving
Passing
90 87
94
79
88
81 80
91
84
92
79
86
77 79
50 55 60 65 70
75 80
85
90
95
188 FRP 12 D o wel T ype amp Scheme 8
Driving Passing
Note FRP = fiber composite SS = stainless steel Std Epoxy = standard epoxy
Figure 35 Average load transfer efficiency for IA 2 project
15 FRP 15 FRP 188 FRP 188 FRP
-0014
-0012
-001
-0008
-0006
-0004
-0002
0 Epoxy12 SS12 SS 8 12 8 12 8
Ave
Fau
lt in
Outside Wheelpath Ave Inside Wheelpath Ave Average
Note FRP = fiber composite SS = stainless steel
Figure 36 Average faulting on IA 2 project
43
Note FRP = fiber composite SS = stainless steel Std Epoxy = standard epoxy
Figure 37 Joint opening trends on IA 2
-02
-015
-01
-005
0
005
01
015
02
025
03
Data Collection Period
Join
t Ope
ning
Cha
nge
(mm
)
Epoxy12 SS12 SS8 15FRP12
15FRP8 188FRP12 188FRP8
Fall 1997
Spring 1998
Fall 1998
Spring 2000
Fall 1999
Spring 1999
Spring 2002
Fall 2001
Spring 2001
The following summaries and conclusions have been reached based on the data gathered during the study (Cable and Porter 2003)
bull All dowel materials tested are performing equally in terms of load transfer joint movement and faulting over the 5-year analysis period
bull Stainless steel dowels do provide load transfer performance equal to or greater than epoxy-coated steel dowels in this study on the average over 5 years
bull FRP dowels of the sizes tested in this reshysearch should be spaced no greater than 203 mm (8 in) apart to gain load transfer performance at the same level as epoxy-coated steel dowels at 305-mm (12-in) spacing
bull No deterioration due to road deicers was found on any of the dowel materials reshytrieved in the 2002 coring operation
Points of Contact
Jim Cable Iowa State University Department of Civil and Construction Engineering 378 Town Engineering Building Ames IA 50011 (515) 294-2862
Mark Dunn Iowa Department of Transportation 800 Lincoln Way Ames IA 50011 (515) 239-1447
References
Cable J K and L L McDaniel 1998b Demon-stration and Field Evaluation of Alternative Port-land Cement Concrete Pavement Reinforcement Materials Iowa DOT Project HR-1069 Iowa Deshypartment of Transportation Ames
Cable J K and M L Porter 2003 Demonstra-tion and Field Evaluation of Alternative Portland Cement Concrete Pavement Reinforcement Mate-rials Iowa DOT Project HR-1069 Iowa State University Ames
44
Chapter 12 IOWA 3 (US 151 LynnJones Counties)
Introduction
This project is located on US 151 in LinnJones Counties (see Figure 38) and is studying the use of fly ash for soil stabilization of subgrades beshyneath concrete pavements The scope of the proshyject includes the use of two different qualities of fly ash and two different qualities of select fill
Figure 38 Location of IA 3 project
Study Objectives
The objective of this research is to evaluate and monitor the performance of pavements conshystructed on treated subgrades with respect to conshytrol sections
Project Design and Layout
The subgrade and pavement for this project are of conventional design and thickness with the only difference in the test sections being the presence of 15 percent fly ash used to treat the subgrade The quantity of fly ash to be used is based upon research performed by Dr Ken Bergeson at Iowa State University (ISU) Two types of fly ash are being evaluated (1) Stoker ash which is a Class C fly ash that has a carbon content too high to be used in concrete mixtures and (2) conventional Class C fly ash (this ash has been used in many stabilization roles and is included as a control) Two types of existing subgrade soils will be evaluated (1) An approved select glacial clay loam and (2) a higher plasticity select glacial clay loam Control sections with untreated soil of both types will also be included Some chemical evaluation of the fly ashes has already been pershyformed at ISU Additional tests from each fly ash
source as delivered will be performed by ISU to monitor chemical variability
The procurement placement and mixing of sub-grade components will be performed by the conshytractor for the project under change order to an existing contract Each test regime will be apshyproximately 16 km (1 mi) long The fly ash will be incorporated into the subgrade using a pulvershyizer and will be placed over the full shoulder-toshyshoulder road width The subgrade will be stabishylized the full width of the pavement and to a depth of 3048 mm (12 in) The base material will be Iowa DOT standard untreated granular drainable base
State Monitoring
The Iowa DOT will perform subgrade modulus tests before during and after placement of the subgrade using a dynamic cone penetrometer Additional bearing tests will be performed after the subgrade has been placed Moisture testing of the soil will be performed on samples taken at the borrow site on grade and from the final mixes Samples of soil will be collected on grade and tested for gradation and soil properties Concrete slump strength and air content will be reported for each test section After paving is complete deflection smoothness and ride testing will be performed annually for 5 years Curling and warpshying will be identified from the smoothness data Deflection differences between slabs exhibiting curling and warping and those without will be investigated The impact of subgrade treatments on curling and warping if any will be noted
Preliminary ResultsFindings
A construction report including photographs and video documentation will be submitted by the Iowa DOT to FHWA A progress report will be submitted after deflection testing is finished summarizing the performance and noting any problems The final report prepared by the Iowa DOT will be due 5 years after completion of the final pavement
45
In January 2004 Iowa DOT indicated that a draft construction report had been completed but it had not yet been made available
Points of Contact
Mark Dunn Research Engineer Materials Office Iowa Department of Transportation 800 Lincoln Way Ames IA 50010 (515) 239-1447
References
None
46
Chapter 13 IOWA 4 (IA 330 Jasper Story and Marshall Counties)
Introduction
The Iowa DOT research project Dowel Bar Optishymization Phase I and II (Porter Guinn and Lundy 2001) and information from other dowel bar reshysearch studies (Porter and Guinn 2002) provided laboratory research results on spacing and bearing stresses for installing conventional round dowels and elliptical dowels Field evaluation and calibrashytion of the results are important to the application of the results to the pavement design process To achieve this goal the Iowa State University in conshyjunction with the Iowa Department of Transportashytion (Iowa DOT) investigated the relative performshyance of elliptical and conventional round dowels in field conditions Test sections were constructed in 2002 on Iowa 330 in Jasper Story and Marshall counties Figure 39 shows the location of this proshyject
Figure 39 Location of IA 4 project
Study Objectives
This project is evaluating the performance of ellipshytical dowels and the constructibility of such devices in an actual construction project Specifically the field research is designed to answer the following questions (Cable Edgar and Williams 2003)
bull What is the relative performance of meshydium- and large-sized elliptical steel dowshyels as compared to that of conventional steel dowels
bull What is the impact of dowel spacing on the relative performance of the elliptical and round dowels in field conditions
bull What is the impact on performance of the various dowel shapes when placed in cut or fill sections of the roadway
bull What constructibility problems if any are associated with the installation of dowel shapes other than round
Project Design and Layout
Two types of elliptical steel dowels (medium and heavy) in addition to conventional 38-mm (15-in) round steel dowels were installed and monitored in this project The specifications of the dowel bars are as follows (Cable Edgar and Williams 2003)
bull Heavy elliptical (major axis is 50013 mm [1969 in] minor axis is 33985 mm [1338 in] area is 1344513 mm2 [2084 in2])
bull Medium elliptical (major axis is 42012 mm [1654 in] minor axis is 38321 mm [1508 in] area is 950321 mm2 [1473 in2])
bull Standard round (diameter is 38 mm [15 in] and area is 1139998 mm2 [1767 in2])
Each type of dowel bar was placed at three differshyent spacings across the transverse joints 305 mm (12 in) 380 mm (15 in) and 460 mm (18 in) Three replicate sections of each dowel size and spacing were placed in cut fill and transition roadway sections
Twelve test sections were constructed where dowel bars were placed only in the wheelpaths A set of four bars at 305-mm (12-in) spacings was installed in each wheelpath Six sections were constructed using elliptical medium dowels and the other six sections using conventional 38-mm (15-in) diameshyter round dowels
Each test section consisted of 20 transverse joints placed at 6-m (20-ft) intervals and separated from the next test section by a minimum of five joints containing 38-mm (15-in) round steel dowels
To measure the actual strain responses within the bars six baskets in the outside lane were fitted with
47
strain gauges The basket configurations chosen for instrumentation were
bull Medium elliptical dowels at 305-mm (12shyin) spacing
bull Medium elliptical dowels at 460-mm (18-in) spacing
bull Heavy elliptical dowels at 305-mm (12-in) spacing
bull Heavy elliptical dowels at 460-mm (18-in) spacing
bull Heavy elliptical dowels at 380-mm (15-in) spacing
bull Standard 38-mm (15-in) dowels at 305-mm (12-in) spacing
State Monitoring Activities
The research team is monitoring the performance of these test sections for 5 years FWD tests visual distress surveys joint faulting and joint opening measurements and longitudinal profile measureshyments are being conducted twice per year (spring and fall) (Cable Edgar and Williams 2003) In addition strain gauge responses were monitored using loaded trucks 1 to 7 days after paving and will be monitored 1 3 and 5 years after paving (Cable Edgar and Williams 2003)
Preliminary ResultsFindings
The following conclusions can be drawn from the construction process (Cable Edgar and Williams 2003)
bull The use of elliptical dowels had no effect on the handling or installation of standard full-lane width dowel baskets
bull The wheelpath-only baskets provide for more options in the pavement placement process are easy to handle and require less dowel
materials However the wheelpath-only basshykets require more time to align on the base than conventional baskets of full-lane width
bull Current construction practices make it somewhat difficult to install and protect the strain gauges during the various phases of construction
A general concern about the use of elliptical dowel bars is their suitability for placement with a dowel bar inserter
Points of Contact
Mark Dunn Iowa Department of Transportation 800 Lincoln Way Ames IA 50011 (515) 239-1447
Max L Porter Iowa State University Center for PCC Pavement Technology 2901 S Loop Drive Suite 3100 Ames IA 50010-8632 (515) 294-8103
References
Cable J K L Edgar and J Williams 2003 Field Evaluation of Elliptical Steel Dowel Perform-ancemdashConstruction Report Iowa State University Ames
Porter M L and R J Guinn 2002 Assessment of Dowel Bar Research Project HR-1080 Final Reshyport Iowa Department of Transportation Ames
Porter M L R Guinn and A Lundy 2001 Dowel Bar Optimization Phases I and II Final Report American Highway Technology and Center for Portland Cement Concrete pavement Technolshyogy Ames
48
Chapter 14 IOWA 5 (Iowa 330 Melbourne)
Introduction
In 2002 the Iowa DOT in conjunction with Iowa State University constructed concrete pavement test sections containing elliptical fiber reinforced polymer (FRP) dowel bars The test sections are located on Iowa 330 just west of Melbourne Iowa (see Figure 40) The primary advantage of FRP dowels over conventional steel dowels is that they are not susceptible to corrosion In addition the benefits of an elliptical shape over circular are the reduction of bearing contact stress between the concrete and the bar This project provides the opshyportunity to evaluate the performance of elliptical FRP dowels compared to both round and elliptical steel dowels installed on the same highway project
Figure 40 Location of IA 5 project
Study Objectives
The goal of this project is the evaluation of the elshyliptical FRP dowels and elliptical dowel bar baskets to provide for transfer of load across the concrete pavement joints (Cable Porter and Guinn 2003)
Project Design and Layout
The elliptical FRP dowel bars used in this project are 457-mm (18-in) long The major and minor axes have dimensions of 5715 and 4928 mm (225 and 194 in) respectively (Cable Porter and Guinn 2003) Dowel bars were placed in the northbound lanes at 30 joint locations each 6 m (20 ft) apart Three different dowel bar spacings (254 305 and 381 mm [10 12 and 15 in]) were used
Figure 41 illustrates the layout of the dowel bars (Cable Porter and Guinn 2003)
The use of FRP material caused an inability to use the conventional method of welding steel dowel bars to the baskets Therefore the dowels were atshytached to the baskets using plastic ties and epoxy (Cable Porter and Guinn 2003) Special care was taken to make sure that when dried the epoxy was strong enough to hold the bars in position during the concrete placement yet brittle enough to crack and allow the bars to move in the longitudinal dishyrection after the concrete had set (Cable Porter and Guinn 2003)
To determine the stresses on the dowel bars at difshyferent spacings one dowel bar from each of the 254- 305- and 381-mm (10- 12- and 15-in) spacshyings was fitted with eight strain gauges The strain gauge positions as shown in Figure 42 (Cable Porshyter and Guinn 2003) were chosen to be the same as the strain gauges placed on the coinciding ellipshytical steel dowel bar project to facilitate a comparishyson between the two types of bars
State Monitoring Activities
The research team is monitoring the performance of these test sections for a period of 5 years Visual distress surveys joint opening and joint faulting measurements FWD tests and profile measureshyments are being conducted twice a year (spring and fall) Load testing using a loaded Iowa DOT tanshydem axle truck was conducted in fall 2002 and winter 2003 and will be conducted in the future only as long as the wiring to the test bars continues to function
Preliminary ResultsFindings
The following conclusions were drawn from this project during the construction process
bull The elliptical FRP dowels can be placed on metal baskets and successfully placed in concrete pavements
bull Testing of the FRP dowel locations indishycates no specific difference with the steel dowels on an adjacent project
49
STA 1372+83
10 Joints (1969 ft [6 m] apart) STA 1372+59 Dowels 15 in (381 mm) (Gaged)
STA 1372+29 STA 1372+23
10 Joints (1969 ft [6 m] apart)STA 1371+93 Dowels 12 in (305 mm)
(Gaged)
STA 1371+69 STA 1371+63
10 Joints (1969 ft [6 m] apart) Dowels 10 in (254 mm)
STA 1371+33 (Gaged)
STA 1371+09
Slab width 2559 ft (78 m)
Figure 41 Layout of dowel bars on IA 5 project
50
15 in 15 in (38 mm) (38 mm)
Top
Bottom 45 in 45 in
(114 mm) (114 mm)
18 in (457 mm)
Figure 42 Location of strain gauges on elliptical FRP dowel bar
Points of Contact
Mark Dunn Iowa Department of Transportation 800 Lincoln Way Ames IA 50011 (515) 239-1447
Max L Porter Iowa State University Center for PCC Pavement Technology 2901 S Loop Drive Suite 3100 Ames IA 50010-8632 (515) 294-8103
Reference
Cable J K M L Porter and R J Guinn 2003 Field Evaluation of Elliptical Fiber Reinforced Polymer Dowel PerformancemdashConstruction Re-port Iowa State University Ames
51
Chapter 15 IOWA 6 (Various Locations)
Introduction
Iowa State University in cooperation with Iowa DOT and Iowa Fly Ash Affiliates (IFAA) started full-scale field tests in 2002 to develop and impleshyment practical guidelines for soil stabilization with a wide range of fly ashes This research will not only benefit the paving industry by emphasizing the importance of subgrade uniformity but it will develop knowledge of successful design and applishycation of soil stabilization with fly ash materials
Study Objectives
The research has four primary objectives (White 2002)
1 Evaluate and document the influence of subgrade uniformity on pavement performshyance from studies of past and test sections selected in this study
2 Determine from field test sections and laboratory analysis how various raw fly ashes hydrated fly ashes (HFA) and conshyditioned fly ashes (CFA) in combination with the wide range of Iowa soil types will bring about uniform properties for sub-grade support
3 Recommend design and construction proshycedures and develop a Ash Stabilization Guide
4 Create a technology transfer seminar to disseminate the knowledge
Project Design and Layout
Several potential fly ash stabilization projects inshycluding sections of US highways 63 and 330 have
been identified for this study Field testing will be conducted to determine engineering properties of subgrade soils such as classification stiffness strength density and moisture content before and after stabilization (White 2002) Laboratory testing will be conducted on various ashsoil mixtures to evaluate the effects of ash on compressive strength volumetric stability and soil index properties of subgrade soils (White 2002)
State Monitoring Activities
At the time of this report the planned monitoring activities are yet to be determined
Preliminary ResultsFindings
No preliminary results or findings are available
Points of Contact
Mark Dunn Iowa Department of Transportation 800 Lincoln Way Ames IA 50011 (515) 239-1447
David J White Iowa State University Center for PCC Pavement Technology 2901 S Loop Drive Suite 3100 Ames IA 50010-8632 (515) 294-8103
Reference
White D W 2002 Field Trials of Guidelines for Soil Stabilizers of Non-Uniform Subgrade SoilsmdashProposal Iowa State University Ames
52
Chapter 16 Iowa 7 and MD 2 (Implementation of TEMP)
Introduction
The most common uses of the Total Environmental Management for Paving (TEMP) system is to preshydict the critical time to open concrete pavements to traffic and to determine the appropriate time for joint sawing activities (Transtec 2002) Concrete strength development and pavement opening times are computed using maturity concepts in which the opening time can be predicted based on the past (known) and future (predicted) concrete temperashytures Maturity methods have been used effectively for a number of years The key advantages of the TEMP system over the state-of-the-practice are automation and prediction At a minimum a TEMP System is comprised of concrete temperature gauges as well as a computer running the TEMP System software An optional portable weather stashytion can be included to further enhance the predicshytive ability of the software
In 2003 a cooperative project was initiated to imshyplement the TEMP system in the field Three canshydidate implementation sites two in Iowa and one in Maryland have been identified for this project The results from this project will help an agency or conshytractor better utilize concrete maturity data and imshyprove the efficiency and quality of concrete paving
Study Objectives
The objectives of this project include proof testing in the field as well as associated implementation activities of the TEMP system These objectives can be categorized as follows (Turner and Ruiz 2003)
bull Demonstrate an automated maturity data collection system that automatically colshylects and relays maturity data in the field
bull Demonstrate an automated maturity data management and reporting system that automatically catalogs maturity data in a fashion suitable for easy reporting and inshyterpretation by the practitioner
bull Demonstrate a system that performs real-time predictions of future concrete strengths and time of opening to traffic
Project Design and Layout
Up to three implementation sites are required for this project which have been tentatively identified as (Turner and Ruiz 2003)
1 US 151 in Jones County Iowa This project is a four-lane relocation and new construcshytion on a new alignment The total length of the project is 993 km (617 mi) from North of Monticello Iowa to Cascade Iowa The pavement cross section is a 240shymm (95-in) JPCP on a 260-mm (102-in) granular base The inside and outside lanes will be 36 m (118 ft) and 42 m (138 ft) wide respectively Perpendicular transshyverse joints will be doweled and spaced at 6-m (20-ft) intervals The pavement will have granular shoulders
2 County roads including 320th Street in Washington County Iowa This project is a combination of four individual sections in Washington County Two sections (650 and 275 km [404 and 171 mi] long) are 67-m (22-ft) wide JPCP on 102-mm (4-in) of rubblized concrete The new concrete layer varies from 254 mm (10 in) at the edges to 178 mm (7 in) at the centerline The pavement will have skewed and dowshyeled transverse joints at a spacing of 46 m (15 ft) and will have granular shoulders A third 436-km (271-mi) long section folshylows the same concrete surface thicknesses but will be constructed on an existing granular surfaced road A fourth section will be approximately 129 km (8 mi) long and will follow the same design for the concrete surface layer but will be conshystructed as whitetopping (on existing asshyphalt) or on granular material
53
3 Frederick Maryland Details on this proshyject are still being collected
Temperature monitoring sensors (iButtonstrade) will be installed into fresh concrete during paving IButshytonstrade will be installed at the mid-depth of the pavement and 03 to 09 m (1 to 3 ft) from the outshyside edge and transverse joint with intervals typishycally between 305 and 305 m (100 and 1000 ft) (Turner and Ruiz 2003)
State Monitoring Activities
Concrete temperature and strength as well as weather conditions (eg temperature wind speed and relative humidity) will be monitored using the TEMP System for 3 to 4 days following placement (Turner and Ruiz 2003)
Preliminary ResultsFindings
No preliminary results or findings are available at this time
Point of Contact
Mark Dunn Iowa Department of Transportation 800 Lincoln Way Ames IA 50011 (515) 239-1447
References
The Transtec Group 2002 Technical Work Plan for Implementation of a Total Environmental Man-agement for Paving (TEMP) System The Transtec Group Inc Austin TX
Turner D J and J M Ruiz 2003 Final Work Plan for Implementation of a Total Environmental Management for Paving (TEMP) System The Transtec Group Inc Austin TX
54
70
35
Kansas 1Highway K-96 Haven
70
35
Chapter 17 KANSAS 1 (Highway K-96 Haven)
Introduction
In 1997 the Kansas Department of Transportation (KDOT) constructed an experimental project under the TE-30 program This project incorporates a wide variety of experimental features from alternashytive dowel bars to alternative sawing practices to different mix designs (Wojakowski 1998) The proshyject is located on Highway K-96 near Haven which is located between Wichita and Hutchinson (see Figure 43)
96
Topeka
Wichita
Hutchinson
Haven
70
96 35
Topeka
Wichita
Hutchinson
Haven
Kansas 1 Highway K-96 Haven
Figure 43 Location of KS 1 project
Study Objectives
Looking for ways to improve PCC pavement pershyformance KDOT implemented this project to speshycifically assess the effects of different design feashytures mix designs and construction practices on the constructibility and performance of PCC paveshyments Benefits expected to be derived from the project include assessments of the following (Woshyjakowski 1998)
bull Feasibility of including recycled waste mashyterials in a two-lift PCC pavement
bull Feasibility of using a harder aggregate of unknown reactivity mitigated with an apshypropriate pozzolan in a two-lift PCC paveshyment
bull Performance of new load transfer devices
bull Life extensions associated with premium materials and concrete mixes
bull Cost-benefit data associated with the varishyous designs
Project Design and Layout
Two phases were defined in the work plan for this project Phase I included evaluating the many difshyferent construction materials and mix designs to be used in the study preparing the plans and specificashytions doing a construction evaluation and evaluatshying and monitoring the project (Wojakowski 1998) Phase II consisted of the actual construction of the test sections
Constructed in the early fall of 1997 the test secshytions are located only in the two eastbound lanes of the four-lane divided highway (Wojakowski 1998) Most test sections are 1-km (06-mi) long The soils in the area are typically silty and sandy loams and the 20-year projected traffic volume is 8000 vehishycles per day which includes 11 percent trucks (Wojakowski 1998)
The nominal pavement structural design for the test sections is a 254-mm (10-in) JPCP over a cement-treated base (CTB) Transverse joints are spaced at 46-m (15-ft) intervals (except for one section) contain 32-mm (125-in) diameter epoxy-coated steel dowels (except for two sections) and are sealed with neoprene compression seals (except for part of one section) (Wojakowski 1998) Longitushydinal joints contain tie bars at 914-mm (36-in) spacings and are sealed with a hot-poured low-modulus sealant (Wojakowski 1998)
Thirteen experimental pavement sections were conshystructed on this project incorporating a wide range of design and construction variables A description of the features of each experimental section is proshyvided below (Wojakowski 1998)
bull Section 1mdashControl section This pavement section reflects the nominal pavement strucshytural design containing 32-mm (125-in) dishyameter dowel bars and placed in a single lift The concrete mixture contains 337 kgm3
(564 lbyd3) of Type II cement a water-cement ratio (wc) of 047 and 65 percent air Three aggregatesmdash35 percent of a coarse
55
limestone (19 mm [075 in] top size) 15 pershycent of a pea gravel and 50 percent of a coarse sandmdashwere used and blended to proshyduce a grading approximating a ldquoShilstonerdquo haystack gradation curve Consolidation of the concrete was specified to be 98 percent of the vibrated unit weight when measured by a nuclear density meter
bull Section 2mdashSingle saw cut The first 31 transverse joints of this section were created using a narrow (6 mm [025 in]) single saw cut and left unsealed whereas the remaining 79 joints were widened and sealed with a hot-poured material Other than the transverse joint sealant other asshypects of this pavement are the same as the nominal pavement structural design
bull Section 3mdashNontraditional dowel type With the same nominal structural design as the control this section incorporates 51shymm (2-in) diameter FiberContrade fiberglass dowels manufactured by Concrete Sysshytems Inc These dowels are a composite fiberglass tube filled with a high-strength cement grout One-half of the length of the bar is machined to a smooth surface of 48 mm (19 in) diameter to allow slippage of the bar as the joint opens and closes The bars are placed on center-to-center spacshyings of 305 mm (12 in)
bull Section 4mdashX-Flextrade load transfer device This short section consisting only of five joints incorporates a unique load transfer device called the X-Flextrade developed at Kansas State University As shown in Figshyure 44 the configuration of the X-Flextrade is such that the ldquoXrdquo part of the device goes across the transverse joint with the far ends curving to make a loop in a continuous deshysign wheel loads are transferred through tension in the ldquoXrdquo part of the device rather than by shear The device is made from 13 mm (05 in) epoxy-coated steel cast bars and spaced at 305-mm (12-in) centers across the joint Other design aspects of this section are the same as the nominal pavement design
bull Section 4a 5 and 6mdashAlternate saws Three sections were constructed that used different lightweight saws for the estabshylishment of the transverse joints Section 4a used a Soff-Cuttrade saw (to depths of 38 and 64 mm [15 and 25 in]) section 5 used a Target saw (to depths of 25 44 and 64 mm [1 175 and 25 in]) and section 6 used a Magnum saw (to depths of 25 44 and 64 mm [1 175 and 25 in]) The rest of the design features of this section are the same as the nominal structural design
Figure 44 Photo of X-Flextrade load transfer devices
56
bull Section 6amdashPolyolefin fiber PCC This short (152-m [500-ft]) section incorporates polyolefin fibers in the PCC mix design The transverse joint spacing was extended to 183 m (60 ft) and the longitudinal lane-lane joint was eliminated The fibers are 157 mm (0062 in) in diameter and were added at the rate of 15 kgm3 (25 lbyd3) The wc of the mix was increased from 045 to 049 to provide additional workability
bull Section 7mdashLongitudinal tining Instead of conventional transverse tining this section incorporates longitudinal tining impressed on the surface of the fresh concrete surface The primary purpose of longitudinal tining is to reduce noise levels produced by passshying vehicles All other design aspects of this section are the same as the nominal structural pavement design
bull Section 8mdashSpecial curing compound A special high solids curing compound conshyforming to ASTM C 1315 was applied to this section The purpose is to compare the effectiveness of the special curing comshypound to the conventional curing comshypound in terms of surface integrity and compressive strength The curing comshypound was applied at the rate of 0036 Lm2
(003 galyd2) which is about half the rate recommended for a rough surface All other design elements for this section are the same as the nominal pavement design
bull Section 9mdashTwo-lift construction with recy-cled asphalt pavement (RAP) This section used a two-lift construction process in which the bottom 178 mm (7 in) of paveshyment used 15 percent recycled asphalt pavement in place of the intermediate-sized well gravel Laboratory testing indicated that this mixture could produce 28-day strengths of 276 MPa (4000 lbfin2) The top lift was placed 76-mm (3-in) thick usshying the standard PCC mixture All other design aspects for this section are the same as the nominal pavement design
bull Section 10mdashLower wc Concrete This secshytion employed a high-range water reducer to lower the wc of the mixture by 005 from the standard wc of 047 The rest of
the pavement design is the same as the nominal structural pavement design
bull Section 11mdashTwo-Lift Construction with Igneous Rock This section used a two-lift construction process in which the top 76 mm (3 in) incorporates rhyolite a hard igshyneous rock The objective of this design is to evaluate the resistance of the pavement to polishing to which the limestone aggreshygates commonly used by KDOT are susshyceptible Because the rhyolite is potentially susceptible to alkali-silica reactivity (ASR) a calcined natural clay pozzolan called DuraPoztrade was used to replace 20 percent of the cement (by weight) in the 76-mm (3-in) surface layer The bottom 178 mm (7 in) of this pavement used a soft high-absorption durable limestone A 25-mm (1-in) maximum size that passed the Statersquos freeze-thaw durability test (ASTM C 666 Procedure B) was used
bull Section 12mdashTwo-Lift Construction with Lower wc Concrete This two-lift conshystruction section used the same lower wc PCC mixture used in section 10 but only in the top 76 mm (3 in) layer The bottom 178 mm (7 in) layer used the same 25-mm (1-in) soft high absorptive limestone used in section 11 The remaining design aspects of this section are the same as the nominal pavement design
bull Section 13mdashRandom Transverse Tining and Special Curing Compound This secshytion was constructed in the spring of 1998 and used a special tining rake that imparted variably spaced transverse impressions on the surface of the fresh concrete to reduce tire-surface noise Additionally the reshymainder of the high-solids special curing compound used on section 8 was applied at the rate of 018 Lm2 (004 galyd2) All other design elements of the section are the same as the nominal pavement design
Table 17 provides the simplified experimental deshysign matrix for the sections included in this project The layout of the pavement test sections is illusshytrated in Figure 45
57
58
Table 17 Simplified Experimental Design Matrix for KS 1
CONVENTIONAL PCC MIX WITH SINGLE-LIFT CONSTRUCTION
TWO-LIFT CON-STRUCTION (RECYCLED
ASPHALT ON BOTTOM)
TWO-LIFT CONSTRUCTION
(IGNEOUSROCK ON TOP)
TWO-LIFT CONSTRUCTION
(LOW WC ONTOP)
PCC MIX WITH POLYOLEFIN
FIBERS
Conventional Sawcutting Equipment
Lightweight Sawcutting Equipment
Conventional Sawcutting Equipment Conventional Sawcutting Equipment
Conventional Sawcutting Equipment
Steel Dowels FiberCon Dowels
X-Flex Device Steel Dowels Steel Dowels Steel Dowels
Steel Dowels
Compression Seals Compression Seals
Hot-Pour Sealant
No Sealant Compression Seals
Compression Seals
Conventional wc
Conventional Curing Compound
Conventional Transverse Tining
Section 1 Section 3 Section 4 Section 4a Section 5 Section 6
Section 2 Section 2 (31 jts)
Section 9 Section 11 Section 12 Section 6a
Longitudinal Tining
Section 7
Random Transverse Tining
High Solids Curing Compound
Conventional Transverse Tining
Section 8
Longitudinal Tining
Random Transverse Tining
Section 13
Lower wc Conventional Curing Compound
Conventional Transverse Tining
Section 10
Kansas High Performance Rigid Pavement Test Sections
96-78 K 4457-01 Reno County
566+95 533+25 516+85 Soft Cut 500+70
Target Magnum 468+95
1 Control Section 2 Single Saw Cut 3 Non-Traditional 4 5 and 6 X-Flex Alternate Saws and 3M Fibers Dowel Type
1 km (3280 lf) 12 km (1640 lf) 12 km (1640 lf) 1 km (3280 lf) (5 X-Flex joints)
Typical construction Single saw cut FiberCon dowels Initial control cuts utilizing no joint sealant Soff-Cut Magnum and Target Early-cut Saws
014 km open 036 km ss 3M polyolefin fibers (500 ft section only) 1 lift placement 1 lift construction 1 lift construction 1 lift construction Shilstone design Shilstone design Shilstone design Shilstone design 564 lb cementcy 564 lb cementcy 564 lb cementcy 564 lb cementcy 65 air 65 air 65 air 65 air 98 consolidation 98 consolidation 98 consolidation 98 consolidation Typical epoxy coated steel dowels (125 dia) Typical dowels Typical dowels Typical dowels outside of X-flex 047 wc used through section 047 wc ratio 1st day 045 wc ratio all day 047 wc ratio for fibers
045 wc ratio 2nd day 045 wc ratio for all other
468+95 435+05 420+10 366+30
7 Special Pavement MarkingLongitudinal Tining 8 ASTM C1315 Cure 9 Two-Lift Recycled Asphalt on Bottom
1 km (3280 lf) 1 km (3280 lf) 1 km (3280 lf)
Longitudinal tining Special high-solids curing compound 15 RAP usage in bottom 7 layer Proprietary pavement marking product Typical concrete mix in top 3
1 lift construction 1 lift construction 2 lift construction Shilstone design Shilstone design 564 lb cementcy 564 lb cementcy 564 lb cementcy 65 air 65 air 65 air in each lift 98 consolidation 98 consolidation 98 consolidation Typical dowels Typical dowels Typical dowels 045 wc ratio through section Single consolidation
3 oz100 lb Masterpave N in RAP mix 045 wc ratio in RAP mix 045 wc ratio in normal mix
366+30 333+30 312+65 289+05 248+90
10 Lower wc Ratio 11 Two-Lift Igneous Rock on Top 12 Two-Lift Low wc on Top
1 km (3280 lf) 063 km (2065 lf) 1 km (3280 lf)
High range water reducer to High absorption limestone in bottom 7 High absorption limestone in bottom 7 lower wc 005 from standard mix Rhyolite aggregate in top 3 High range water reducer in top 3 to
Dura-Poz to counter ASR of Rhyolite lower wc 005 from standard mix 1 lift construction 2 lift construction 2 lift construction Shilstone design Shilstone design Shilstone design 564 lb cementcy 564 lb cementcy 546 lb cementcy 65 air 65 air in each lift 65 air in each lift 98 consolidation 98 consolidation 98 consolidation Typical dowels Typical dowels Typical dowels
Single consolidation Single consolidation
13 Random Pattern Transverse Tining and High Solids Cure Sta 966+44 to 982+15 and 1006+00 to 1026+40 11 km (3611f) All else typical construction
Figure 45 Layout of KS 1 project (Wojakowski 1998)
59
State Monitoring Activities
Construction Monitoring During the construction of the test sections sevshyeral incidents of note were observed by the reshysearchers These are summarized below (Wojashykowski 1998)
bull Section 4 Because they were placed only about 38 mm (15 in) below the surface several of the X-Flextrade load transfer deshyvices were struck and dislodged by the paver during construction Consequently some of these devices had to be replaced by dowels and the transverse joint hand finished
bull Section 5 Sawing with the Soff-Cuttrade lightweight saw began about 3 hours and 20 minutes after the concrete was placed For the 40 joints cut to a depth of 38 mm (1 in) 6 cracks occurred beneath the saw cut after 1 day 18 cracks occurred beshyneath the saw cut after 2 days 23 cracks after 3 days 31 cracks after 4 days 35 cracks after 5 days and 39 cracks after 7 days No cracks were observed within the panels for this section or for any of the secshytions that employed the lightweight sawsSection 6 Intermediate cracks ocshycurred almost immediately after this fiber-reinforced PCC pavement was placed During the first night intermediate cracks formed on 5 of the 8 panels that were paved and by the 5th day after placement 10 cracks had appeared in the 8 panels The panels containing two cracks were noted to be the first two placed on the day that had a high temperature of 35 oC (95 oF) and a low of 21 oC (69 oF)
bull Section 8 The special curing compound was applied with the expectation that imshyproved curing would lead to a more durashyble pavement Unfortunately the envishyronmental conditions at the time of application were quite mild and the acshytual coverage rate (0035 Lm2 [003 galyd2]) was one-half the recommended value
bull Section 9 Limited funding prevented the use of a separate paver for the lower lift
Therefore a belt placerspreader was used for the placement of the lower lift the mix design of which had to be stiffened to accommodate its placement An interval of about 30 minutes was needed between the placement of the two lifts Small depressions were noted when the top lift was dropped on the bottom lift and some intermixing of the two lifts occurred but for the most part the process was workashyble and adequately controlled This same construction procedure was essentially followed for all two-lift sections
bull Section 10 In spite of the lower wc used in the mix design for this section it was found to be workable and easy to finish This workability is attributed to the lubrishycation provided by the high-range water reducer used to reduce the wc
bull Section 13 The weather at the time that this section was constructed in 1998 manshydated the use of cold-weather concreting procedures The special curing compound was applied at the specified rate of 018 Lm2 (004 galyd2)
Early Mix Property Data During the construction of the different sections several key mix design properties were measured These measurements are summarized in Table 18 Generally speaking most of the results appear reasonable for the various mix designs
Performance Monitoring KDOT has been monitoring the performance of these test sections since 1998 The following inshyformation is collected distress data (cracking faulting spalling) joint load transfer efficiency noise and surface friction (Wojakowski 1998)
Preliminary ResultsFindings
Some preliminary results are available from KDOT regarding the costs and performance of these sections These results are described in the following sections
60
Cost Data Construction costs for these sections are summashyrized in Table 19 and illustrated in Figure 46 Some notes regarding these costs are documented by Wojakowski (1998)
bull Section 1 This figure includes the costs of both the mainline pavement and the shoulders
bull Section 3 For the small quantities of this project the costs of the Fiber-Contrade dowels were $2887m ($880ft) as compared to $800m ($244ft) for conventional epoxy-coated steel dowshy
els With a larger project and volume pricing the cost of these dowels could be expected to be around $1640m ($500ft)
bull Sections 4a 5 and 6 The lightweight saws provided minimal savings to the overall construction costs
bull Sections 9 11 and 12 These sections inshycluded a two-lift construction process that added considerable cost The two-lift conshystruction costs included a second batch plant extra hauling of material a concrete belt placer spreader and extra labor for hauling
Table 18 Summary of Early Mix Properties of KS 1 Test Sections (Wojakowski 1998)
CORE AVERAGE COMPRESSIVE
SECTION AVERAGE SLUMP IN
AVERAGE AIR
CONTENT
AVERAGE UNIT WEIGHT
LBFT3
FLEXURAL STRENGTH
LBFIN2
STRENGTH LBFIN2
(28-DAY)
1―Control 06 60 1420 525 (7 days) 4583
2―Single sawcut 10 71 1422 NA NA
3―Nontraditional dowel 10 53 1426 NA NA
4―X-Flextrade NA NA NA NA NA
4a―Lightweight Soff-cut saw NA NA NA NA 4530
5―Lightweight Target saw 10 70 1410 NA NA
6―Lightweight Magnum saw NA NA NA NA NA
6a―Polyolefin fibers 00 52 1410 539 (7 days) 4598
7―Longitudinal tining
8―Special curing compound
9―Two-lift with RAP
08
21
08 (top lift)
08 (bottom lift)
69
74
68
58
1412
1400
1420
1422
NA
NA
NA
517 (5 days)
4665
4760
3843
10―Lower wc
11―Two-lift with igneous rock
12―Two-lift with lower wc
11
20 (top lift)
08 (bottom lift)
10 (top lift)
58
43
59
58
1447
1422
13943
1438
550 (4 days)
583 (8 days)
475 (4 days)
583 (6 days)
5040
4780
NA
12 (bottom lift) 53 13782 583 (6 days)
13―Random tining NA
NA = not available Flexural strengths measured under third-point loading
NA NA NA NA
61
Table 19 Summary of Construction Cost Data for KS 1 (Wojakowski 1998)
COST DIFFERENCE FROM TOTAL SECTION EXPERIMENTAL FEATURE CONTROL $YD2 UNIT COST $YD2
1 Control mdash 2580
2 Unsealed joints ndash067 2513
3 FiberContrade dowels +572 3152
4 X-Flextrade device NA NA
4a Soff-Cut lightweight saw 0 2580
5 Target lightweight saw 0 2580
6 Magnum lightweight saw 0 2580
6a Polyolefin fibers +1563 4143
7 Longitudinal tining 0 2580
8 Special curing compound +083 2663
9 Two-lift construction with RAP +2512 5092
10 Lower wc +003 2583
11 Two-lift construction with igneous rock +2605 5185
12 Two-lift construction with lower wc +2509 5089
13 Random transverse tining 0 2580
NA = Not available (experimental device not commercially available)
6060
5050
4040
3030
2020
1010
00
CCoonnsst
rtruucctiti
oonn CC
oosstt
$$
yydd22
NANA
11 22 33 44 44aa 55 66 66aa 77 88 99 1100 1111 1122 1133 S eS e cc tt iioo nn
Figure 46 Relative construction costs by section for KS 1
62
Early Performance Data KDOT is monitoring the performance of these test sections and has produced two annual reports documenting their early performance (KDOT 1998 KDOT 1999) Visual distress surveys are conshyducted in which cracking joint faulting and joint spalling are recorded The results from these surshyveys are illustrated in Table 20 An examination of this table shows that although a few cracks have occurred in a few of the sections overall these secshy
tions are in good condition Faulting levels are all less than 1 mm (004 in) far below critical faulting thresholds of 25 to 30 mm (010 to 012 in) Joint spalling is observed only on two sections
The initial profile index values for the test sections are shown in Table 20 and plotted in Figure 47 These values are based on a zero-blanking band Followup roughness measurements are not availshyable
Table 20 Summary of Early Performance Data for KS 1 Project (KDOT 1998 KDOT 1999)
SECTION EXPERIMENTAL
FEATURE
1998 INITIAL PROFILE
INDEX MMKM
AVERAGE JOINT FAULTING MM
1998 1999
AVERAGE SPALLING MMJOINT
1998 1999 OTHER NOTED DISTRESSES
1 Control 240 002 002 490 1524
2 Unsealed joints
Sealed joints
000
007
021
010
1 corner crack
2 corner cracks
3 FiberContrade dowels 268 008 025 10-m transverse
crack 8 corner cracks
4 X-Flextrade device 259 000 000
4a Soff-Cut lightweight saw 000 007
5 Target lightweight saw 000 007
6 Magnum lightweight saw
Polyolefin fibers 006 016 16 mid-panel 6a cracks
1 longitudinal crack
7 Longitudinal tining 189
8 Special curing compound 129 002 00 106 169
9 Two-lift construction with RAP 178 005 013
10 Lower wc 178 013 010
11 Two-lift construction with igneous rock
166 002 002
12 Two-lift construction with lower wc
186 013 017 37-m trans crack
13 Random transverse tining 319 003
These cracks in section 6a were retrofitted with dowel bars in 1999
63
IInnitit
iiaal
Pl
Prroo
ffile
ile II
nnddeexx
mmmm
kkmm 350350
300300
250250
200200
150150
100100
5050
00 NNAA
11 22 33 44 44aa 55 66 66aa 77 88 99 1100 1111 1122 1133 S eS e cc tt iioo nn
Figure 47 Comparison of Initial Profile Index of KS 1 test sections (Zero-Blanking Band)
A noise study was conducted by KDOT in October 1998 to assess the effect of the various tining methods (sections 1 7 and 13) (KDOT 1998 KDOT 1999) Noise sampling was recorded from a passenger car and a medium-duty dump truck at three locations adjacent to the roadway The study concluded that there were no significant differences in either the exterior or interior noise levels genershyated by vehicles traveling over these test sections (KDOT 1998 KDOT 1999)
Interim ResultsFindings
The interim performance of these test sections is documented in the 2002 Annual Report (KDOT 2002) and the 2003 Annual Report (KDOT 2003) and summarized in Tables 21 and 22 FWD testing was performed in January 2002 and again in Janushyary 2004 and the results are shown in Figure 48 Based upon the FWD results some of the load transfer devices are exhibiting marginal efficiency particularly for a pavement less than 5 years old
References
Kansas Department of Transportation (KDOT) 1998 High Performance Concrete Pavement K-96 Reno County 1998 Annual Report Kansas Deshypartment of Transportation Topeka
mdashmdashmdash 1999 High Performance Concrete Pave-ment K-96 Reno County 1999 Annual Report Kansas Department of Transportation Topeka
mdashmdashmdash 2002 High Performance Concrete Pave-ment K-96 Reno County 2002 Annual Report Kansas Department of Transportation Topeka
mdashmdashmdash 2003 High Performance Concrete Pave-ment K-96 Reno County 2003 Annual Report Kansas Department of Transportation Topeka
Wojakowski J B 1998 High Performance Con-crete Pavement Report No FHWA-KS-982 Kanshysas Department of Transportation Topeka
64
Table 21 Summary of 2002 Performance Data for KS 1 Project (KDOT 2002)
SECTION EXPERIMENTAL
FEATURE
AVERAGE JOINT FAULTING
MM
2002
AVERAGE SPALLING MMJOINT
2002 OTHER NOTED DISTRESSES
1 Control 002 652
2 Unsealed joints 002 279 1 corner crack
Sealed joints 007 389 6 corner cracks
3 FiberContrade dowels 016 322 7 corner cracks 1 12-m longitudinal crack
4 X-Flextrade device 000 1626
4a Soff-Cut lightweight saw 002 1431
5 Target lightweight saw 007 109
6 Magnum lightweight saw 000 508
6a Polyolefin fibers 023 533 3 new longitudinal cracks
7 Longitudinal tining 007 93
8 Special curing compound 007 279
9 Two-lift construction with RAP 005 178 16 transverse cracks averaging 13 m each
10 Lower wc 015 102
11 Two-lift construction with igneous rock
007 271 395 transverse cracks averaging 04 m each 16 longitudinal cracks averaging 04 mm each
12 Two-lift construction with lower wc 012 127 5 longitudinal cracks from 46 to 914 m each 1 37 m transverse crack
13 Random transverse tining 005 229 2 corner cracks 1 03 m longitudinal crack
65
Table 22 Summary of 2003 Performance Data for KS 1 Project (KDOT 2003)
AVERAGE JOINT FAULTING MM
AVERAGE SPALLING MMJOINT
SECTION EXPERIMENTAL FEATURE 2003 2003 OTHER NOTED DISTRESSES
1 Control 025 415
2 Unsealed joints 008 590 1 corner crack
Sealed joints 007 500 6 corner cracks
3 FiberContrade dowels 022 381 10 corner cracks 1 12-m longitudinal crack
4 X-Flextrade device 040 1067
4a Soff-Cut lightweight saw 007 854
5 Target lightweight saw 004 218
6 Magnum lightweight saw 000 445
6a Polyolefin fibers 019 254
7 Longitudinal tining 007 93
8 Special curing compound 002 423
9 Two-lift construction with RAP 000 110 16 transverse cracks averaging 13 m each light map cracking on 21 of 30 panels
10 Lower wc 012 237
11 Two-lift construction with igneous rock
000 212 17 longitudinal cracks averaging 26 m each many smaller cracks not recorded
12 Two-lift construction with lower wc 008 246 5 longitudinal cracks from 46 to 914 m each 1 37-m transverse crack 1 03-m transverse crack
13 Random transverse tining 007 279 2 corner cracks 1 36-m longitudinal crack
Figure 48 Joint load transfer efficiency on KS 1
66
Chapter 18 KANSAS 2 (Hutchinson)
Introduction
The Kansas Department of Transportation a nashytional leader on pavement smoothness has undershytaken a project to build a PCC pavement that is ldquosuper smoothrdquo and maintains that smoothness for an extended time This project consists of five speshycial sections is located in Hutchinson Kansas and has a construction start date of April 2001 The proshyject is multifaceted The initial smoothness will be monitored and controlled with new equipment innoshyvations while the post-construction smoothness will be evaluated for different construction conditions (weather) mixture properties (wc ratio) and joint spacings
Study Objectives
To build a super-smooth pavement that maintains most of its original smoothness through increased initial smoothness levels as well as through design and mixture improvements
Project Design and Layout
The pavement design consists of a 220-mm (87shyin) slab with 46-m (15-ft) joint spacing a dense cement treated base 32-mm (125-in) diameter dowels spaced at 305 mm (12 in) and a tied conshycrete shoulder The transverse and longitudinal joints are sealed with a preformed compression seal and a low-modulus hot-poured material respecshytively
A definite correlation has been shown between monitoring of the smoothness behind the paver and the head of concrete coming into it A special strike-off bar is being developed to maintain a unishyform head of concrete to help alleviate one signifishycant source of roughness Concrete mixtures have been improved by newer specifications in Kansas but there still appears to be room for making the
mixture more workable without being susceptible to segregation This will be done by increasing the coarse aggregate content to the maximum possible while maintaining a non-segregating grading withshyout gaps Consistency of the mixture and the pavshying operation along with ambient temperatures must also be monitored for any effect on smoothshyness The smoothness of the paving base should also be checked
During the post construction period the temperashyture gradient in the slab will be measured for mornshying and afternoon placements Daily temperature ranges (and solar radiation) can also be monitored for their effect on smoothness Additionally joint spacing can be varied somewhat from a standard spacing of 46-m (15 ft) to as short as 36 m (12 ft) and as much as 52 m (17 ft) for each of the three mixtures proposed for the project
State Monitoring Activities
No information is currently available regarding the State monitoring efforts
Preliminary ResultsFindings
Preliminary results are not available at this time
Point of Contact
Lon Ingram Chief of Materials and Research Kansas Department of Transportation Bureau of Materials and Research 2300 Van Buren Topeka KS 66611-1195 (785) 296-2231
References
None
67
95
Maryland 1US 50
Salisbury Bypass
Chapter 19 MARYLAND 1 (US 50 Salisbury Bypass)
Introduction
Marylandrsquos TE-30 project was constructed in 2001 It is located on the Salisbury Bypass on US 50 in the southeastern part of the State (see Figure 49) The project is being undertaken jointly by the Maryland State Highway Administration (MSHA) the University of Maryland and the FHWA
50
Annapolis
Salisbury
95
5050
Maryland 1 US 50
Salisbury Bypass
Annapolis
Salisbury
Figure 49 Location of MD 1 project
Study Objectives
This project is designed to research the benefits of using fiber-reinforced concrete (FRC) and low-shrinkage concrete in Maryland paving operations (Goulias and Schwartz 1999) The researchers beshylieve that the use of these materials may lead to inshycreases in flexural fatigue resistance and reductions in crack development and slab warping effects (Goulias and Schwartz 1999) The objectives of the study will be completed in three phases
bull Phase ImdashLaboratory examination of the design and performance of fiber-reinforced concrete and low-shrinkage concrete for Maryland conditions
bull Phase IImdashActual construction of the test sections
bull Phase IIImdashShort- and long-term monitorshying of the test sections and quantification of benefits for possible incorporation into PCC pavement design
Project Design and Layout
Laboratory tests were conducted to evaluate the properties of fiber-reinforced and low-shrinkage concrete mixtures Marylandrsquos standard concrete mixture for highway pavements MD Mix 7 was used as the control mixture The low shrinkage mixshytures were developed by using the MD 375 aggreshygate in place of the MD 57 aggregate or by modishyfying the wc ratio The fiber-reinforced mixtures used the mix design of the control mixture by addshying different fiber contents (01 02 03 and 04 percent) Seven mixtures were evaluated and their characteristics are summarized in Table 23 (Goulias and Schwartz 2003) The characteristics of the fiber used in this study are shown in Table 24 (Goulias and Schwartz 2003) The mixture properties evalushyated in the lab included compressive strength unreshystrained shrinkage of hardened concrete restrained shrinkage of plastic concrete flexural strength and toughness fatigue endurance elastic modulus temshyperature slump and air content
Three different concrete pavement test sections were constructed by MSHA in 2001 (Goulias and Schwartz 2003)
bull Control section using MD Mix 7
bull Fiber-reinforced concrete section containing 01 percent polypropylene fiber
bull Low-shrinkage concrete section using MD 375 aggregate
The pavement sections were extensively instrushymented to provide feedback on the structural reshysponses of the different designs
68
Table 23 Mixture Properties of Concrete Used on MD 1
COMPONENT MIX A MIX B MIX C MIX D MIX E MIX F MIX G
Aggregate type 57 57 57 57 57 375 LS 57 LS
wc ratio 044 044 044 044 044 044 040
Air content () 66 46 66 70 58 50 60
Slump (insec) 15 1517 112515 121 062529 1 15
Fiber content 00 01 02 03 04 00 00
Air entrainment 17 oz 19 oz 19 oz 19 oz 19 oz 20 oz 20 oz 100 lbs 100 lbs 100 lbs 100 lbs 100 lbs 100 lbs 100 lbs
Water reducer (M)5 oz (M)5 oz (M)5 oz (M)55 oz (M)6 oz (M)55 oz (H)27 oz 100 lbs 100 lbs 100 lbs 100 lbs 100 lbs 100 lbs 100 lbs
Note (M) = middle range water reducing admixture (H) = high range water reducing admixture LS = low shrinkage Target air content 65
Table 24 Fiber Characteristics for MD 2
ELASTIC LENGTH DIAMETER ASPECT RATIO YIELD STRENGTH MODULUS SPECIFIC
FIBER MM (IN) MM (IN) (LD) MPA (KSI) MPA (KSI) GRAVITY
Polypropylene (Fibrillated)
19 (075)
NA NA 550ndash750 (80ndash110)
3450 (500)
091
State Monitoring Activities
A variety of information has been collected on the three experimental sections (Goulias and Schwartz 2003) Two MSHA trucks (with 18 kip and 32 kip axles) were used for field load testing Condition surveysprofile measurements were conducted using a dipstick device Nondestructive testing was also conducted using an ultrasound device
Interim ResultsFindings
Analyses were carried out utilizing both the lab reshysults and field instrumentation data to evaluate the response and behavior of the control fiber reinshyforced and low shrinkage concrete pavement secshytions and mixtures The following conclusions have been reached (Goulias and Schwartz 2003)
bull The lab results indicated that fibers reduce the workability of concrete However the
use of admixtures permits acceptable levels of workability
bull The flexural strength of concrete for fiber contents gt 01 percent was higher than that of the control concrete mixture The toughshyness of concrete increased with increasing fiber content
bull Shrinkage testing indicated that there were small differences in unrestrained shrinkage for the control and the two low shrinkage mixtures However fiber-reinforced conshycrete mixtures exhibited higher levels of shrinkage
bull The fatigue analysis indicated that the addishytion of polypropylene fibers resulted in higher fatigue strengths The fatigue strength of FRC increased with decreasing fiber content until 03 percent The endurshyance limit expressed as a percentage of the
69
modulus of rupture of the mixture showed an increase with decreasing fiber content until 03 percent Overall the best fatigue performance was obtained for mixes conshytaining 01 percent fiber
bull The field data indicated that overall the secshytions with the 01 percent fiber-reinforced concrete mixture had lower deflections than the control mix and the low shrinkage mixshyture Analytical evaluations indicated that the best estimates of the modulus of sub-grade reaction (k) and elastic modulus of concrete (Ec) are k of 350 lbfin2in and 5000000 lbfin2 respectively
Points of Contact
Dimitrios Goulias University of Maryland Department of Civil and Environmental Engineering 0147A Engineering Lab Building College Park MD 20742 (301) 405-2624
Charles Schwartz University of Maryland Department of Civil and Environmental Engineering College Park MD 20742-0001 (301) 405-1962
References
Goulias D and C Schwartz 1999 High Perform-ance Portland Cement Concrete Pavement Project Work Plan University of Maryland Department of Civil and Environmental Engineering College Park
mdashmdashmdash 2003 High Performance Portland Cement Concrete Pavement Final Research Report Unishyversity of Maryland Department of Civil and Envishyronmental Engineering College Park
70
75
96
75
75
96
75
Chapter 20 MICHIGAN 1 (I-75 Detroit)
Introduction
The Michigan 1 project is located on I-75 (Chrysler Freeway) in downtown Detroit (see Figure 50) Built in 1993 this project came about as a result of an FHWA-sponsored tour of European concrete pavement design and construction practices in 1992 During that tour and a followup tour one mashyjor observation of European concrete design and construction practices was the emphasis placed on the quality of the design materials and construcshytion of the pavement with less concern for higher costs or longer construction periods (FHWA 1992 Larson Vanikar and Forster 1993) The tours genshyerated substantial interest in constructing a ldquoEuroshypean-typerdquo concrete pavement to evaluate its conshystructibility and performance compared to conventional US designs This interest led to the selection of the 16-km (1-mi) test section on I-75 in Detroit (see Figure 50)
The MI 1 project is not a TE-30 project per se but gave rise to the TE-30 program After construction of the project in 1993 interest in constructing simishylar ldquohigh-performancerdquo concrete pavements reshymained high and in 1994 FHWA and industry agreed to pursue this effort and launched the TE-30 program
LansingDetroit
Michigan 1I-75 Detroit
75
Lansing Detroit
Michigan 1 I-75 Detroit
96
75
Figure 50 Location of MI 1 project
71
Study Objectives
The objective of this project is to determine whether innovative features of typical rigid pavement deshysigns used in European countries can be applied cost effectively to conventional design and conshystruction methods used for rigid pavements in the United States (Smiley 1995) The European paveshyment was constructed for the purpose of comparing the European design with conventional designs to demonstrate the applicability of certain European concepts to US highway construction (Weinfurter Smiley and Till 1994)
Project Design and Layout
This project is located in the northbound lanes of Ishy75 and consists of two sections a ldquocontrolrdquo section representing the Michigan Department of Transporshytationrsquos (MDOTrsquos) then-current standard concrete pavement design and the European concrete paveshyment section incorporating several innovative deshysign features (Weinfurter Smiley and Till 1994) The layout of these sections is shown in Figure 51 which also lists some of the key design features of each section
The existing roadbed for the project lies within an approximate 76-m (25-ft) cut section (Weinfurter Smiley and Till 1994) The subgrade is predomishynately a silty clay material which was required to be compacted to 95 percent of its maximum unit weight in accordance with Michiganrsquos One-Point Tshy99 (Proctor) Test (Weinfurter Smiley and Till 1994)
These sections on I-75 contain three to four traffic lanes in each direction In 1993 this portion of I-75 carried about 111000 vehicles per day including 11 percent heavy trucks (Smiley 1995)
Construction of the sections began in July 1993 and was opened to traffic in November of that same year (Smiley 1995) During the 1994 construction season southbound I-75 traffic was detoured onto northbound I-75 while it was reconstructed The entire I-75 reconstruction project was completed in October 1994
13 mi 10 mi
SSeectictioonn 11mdashmdashMichiMichigganan SSttandandaardrd PPaavveemmeentnt SSeeccttiion 2on 2mdashmdashEEuurroopepeaann PPaavveemmeenntt 1111--iin Jn JRRCCPP 1010--iinn JJPPCCPP ((ttwo-wo-lliifftt coconsnsttrrucucttiionon))
4141--fftt TTrrananssvvererssee JJooiinntt SpaSpaccinging 1515--fftt TTrraannsvsverersese JJooiinntt SpSpacaciningg 112255--iinn DDoowelwelss ((ssttaandndarard sd sppacaciinngg)) 112525--iinn DDoowelwelss ((vvarariiaabblly sy sppaacceedd))
4-4-iinn CCeemmeenntt--TTrreeaatteded OOppenen-G-Grraaddeedd DDrraiainanagege CCoourursese ((OOGGDDCC)) 6-6-iinn LeLeanan CCooncncrreettee BaBassee 1122--iinn SaSandnd SuSubbabbassee 1616--iinn AgAggrgregegatatee SuSubbbbasasee TTiieedd PCPCCC ShShououldlderer WWiidedenened Oud Outtssiidde Se Sllaabb
TTiieded PCPCCC ShShououlldderer
13 mi 10 mi
I-75I-75 NBNBWI-375I-375 Waarren Avenuerren Avenue PiPicqucqueette Avtte Avenueenue
Figure 51 Layout of MI 1 project
Section 1mdashMichigan Standard Pavement The Michigan standard section is 21-km (13-mi) long and is located south of the European section The cross section for the Michigan standard secshytion is shown in Figure 52 (Smiley 1995) This is a 279-mm (11-in) JRCP design with transverse joints spaced at 125-m (41-ft) intervals (Weinshyfurter Smiley and Till 1994)
The PCC mix used a higher quality coarse aggreshygate than standard so that the performance could be compared to the European section A 100-mm (4-in) permeable cement-treated base is located beneath the slab The aggregates for the open-graded base were obtained by crushing the existshying I-75 pavement and were stabilized with 6 pershycent cement (Weinfurter Smiley and Till 1994) A geotextile separator is located beneath the open-graded base and above the underlying 305shymm (12-in) sand subbase (Weinfurter Smiley and Till 1994) Longitudinal collector drains (152 mm [6 in] diameter) are located beneath both the inside and outside reinforced concrete shoulders All traffic lanes in this section are 37 m (12 ft) wide
Section 2mdashEuropean Pavement The European pavement section is 16 km (1 mi) long and is located north of the Michigan stanshydard section It consists of a 254-mm (10-in) JPCP that was placed in two lifts (see Figure 53 for the pavement cross section) The layers were placed ldquowet-on-wetrdquo to ensure bonding between the top 64-mm (25-in) concrete layer and the bottom 190-mm (75-in) concrete layer The same sources for cement and aggregate were used in the top and bottom layers except that the course aggregate for the top layer was specified to be a 100 percent crushed basalt rock to provide resistance to polishing (Weinfurter Smiley and Till 1994) Conventional paving equipment was used for the placement of the two layers
The two-layer JPCP was constructed directly on a 152-mm (6-in) lean concrete base (LCB) without the use of a bonding agent Plane-of-weakness joints were sawed in the LCB at transverse and longitudinal locations to match those of the overshylying JPCP slab and thereby prevent reflection cracking (Weinfurter Smiley and Till 1994) The joints were sawed to a depth of 61 mm (24 in) A comparison of the specified concrete properties of the LCB the top layer PCC slab the bottom layer PCC slab and the Michigan standard paveshyment is provided in Table 25 (Weinfurter Smiley and Till 1994)
72
73
Figure 52 Cross section for Michigan standard pavement (Smiley 1995)
74
Figure 53 Cross section for European pavement (Smiley 1995)
Table 25 Comparison of Specified Concrete Properties on MI 1 Project (Weinfurter Smiley and Till 1994)
PORTLAND CEMENT CONCRETE PROPERTY
EUROPEAN PAVEMENT MICHIGAN
STANDARD PAVEMENT TOP LAYER BOTTOM LAYER LCB
28-day compressive strength lbfin2 5500 5000 2500 3500
28-day flexural strength lbfin2 mdash mdash mdash 650
Maximum wc (by weight) 040 042 070 050
Minimum cement content lbyd3 752 588 420 550
Maximum slump in 3 3 3 3
Air content 65 + 15 65 + 15 65 + 15 65 + 15
LCB = lean concrete base
An exposed aggregate surface was specified for the top layer of concrete This exposed aggregate surshyface provides surface texture and is expected to reshyduce noise levels The exposed aggregate surface was produced through a patented process developed by Robuco Ltd of Belgium consisting of the folshylowing steps (Weinfurter Smiley and Till 1994)
bull Evenly spraying the surface with a set reshytarder within 30 minutes of the finishing operation
bull Covering the concrete surface with plastic waterproof sheeting (for a period of apshyproximately 20 hours)
bull Removing the sheeting and brushing the surface with a brushing machine
bull Placing a curing compound on the newly exposed aggregate surface
Joint sawing operations were made through the proshytective sheeting prior to the brushing operation
A 406-mm (16-in) thick nonfrost-susceptible agshygregate subbase was placed directly on the sub-grade and longitudinal edge drains were installed beneath both the inside and outside PCC shoulders (Weinfurter Smiley and Till 1994) The outer lane consisted of a 41-m (135-ft) wide outer slab to reduce critical edge loading encroachments
Transverse contraction joints were spaced at 46-m (15-ft) intervals and were designed to match those joints in the underlying LCB Polyethylene-coated dowel bars 32 mm (125 in) in diameter and 508 mm (20 in) long were placed on chairs at the mid-depth of the composite slab and at the variable spacings shown in Figure 54 (Weinfurter Smiley and Till 1994)
The longitudinal and transverse joints were sealed with an ethylene propylene diene terpolymer (EPDM) seal (Weinfurter Smiley and Till 1994) Similar to conventional neoprene compression seals these seals are placed without a lubrishycantadhesive and require only a clean (but not dry) joint prior to installation (Weinfurter Smiley and Till 1994)
State Monitoring Activities
MDOT has been monitoring the performance of both sections since 1993 Performance data colshylected include surface distress ride quality surface friction and tire noise levels (Weinfurter Smiley and Till 1994) Seasonal pavement deflection measurements are also taken periodically to identify any structural inadequacies that may develop in eishyther pavement section (Weinfurter Smiley and Till 1994) Although limited performance monitoring continues no formal reports have been prepared since 2000
75
LONGITUDINAL JOINTEUROPEAN PAVEMENT
LONGITUDINAL JOINTSYMBOL B
DOWEL BAR
LONGITUDINAL JOINTSYMBOL B
TRANSVERSE CONTRACTION JOINTEUROPEAN PAVEMENT
070
rsquo
075
rsquo0
75rsquo
075
rsquo
080
rsquo
080
rsquo
080
rsquo
080
rsquo
080
rsquo
080
rsquo
080
rsquo
075
rsquo0
75rsquo
080
rsquo
090
rsquo
LONGITUDINAL JOINT SYMBOL B
DOWEL BAR
LONGITUDINAL JOINT SYMBOL B
TRANSVERSE CONTRACTION JOINT EUROPEAN PAVEMENT
LONGITUDINAL JOINT EUROPEAN PAVEMENT
070
rsquo
075
rsquo0
75rsquo
075
rsquo
080
rsquo
080
rsquo
080
rsquo
080
rsquo
080
rsquo
080
rsquo
080
rsquo
075
rsquo0
75rsquo
080
rsquo
090
rsquo
080
rsquo
090
rsquo
3 x3 x 08rsquo08rsquo 3 x3 x 08rsquo08rsquo3 x3 x 16rsquo16rsquo 7 x7 x 16rsquo16rsquo 4 x4 x 08rsquo08rsquo 3 x3 x 16rsquo16rsquo 4 x4 x 08rsquo08rsquo 3 x3 x 16rsquo16rsquo 44 xx 08rsquo08rsquo 3 x3 x 1616rsquorsquo 3 x3 x 008rsquo8rsquo 3 x3 x3 x 16rsquo16rsquo16rsquo
12rsquo12rsquo135rsquo135rsquo 12rsquo12rsquo 135rsquo135rsquo625rsquo625rsquo 650rsquo650rsquo LANLANEELANLANEE LANLANEE LANLANEESHSHOULDOULDERER SHSHOULDOULDERER
DODOWWEELL BBAARR SPSPAACCIINNGG
ALALL BL BAARRSS SSHHAALLLL BEBE 11 frac14frac14rdquordquo DDIIAA 2 200rdquordquo LLOONNGG AANNDD TTYYPEPE A CA COOAATTEDED INSINSTTALALLELED AD ATT HALHALFF DEDEPPTTHH (5rdquo)(5rdquo)
Figure 54 Variable dowel spacings used on European pavement section (Weinfurter Smiley and Till 1994)
ResultsFindings
Initial Construction Findings The construction of the European pavement section was accomplished without any major difficulties Slower production rates were noted much of which is attributed to an unfamiliarity with two-layer conshystruction and exposed aggregate surfaces (Weinshyfurter Smiley and Till 1994) Among some of the specific recommendations for similar future proshyjects include (Weinfurter Smiley and Till 1994)
bull The saw cut depth for longitudinal joints in a two-layer pavement is recommended to be between 40 and 45 percent of the total pavement thickness The saw cut depth for transverse joints is recommended to be beshytween 25 to 30 percent of the total paveshyment thickness
bull The variable spacing of dowel bars in a basket assembly should be arranged such that the spacing between bars actually represents a standard ldquouniformrdquo spacing but with selected bars missing This will save on the costs associated with the fabrication of special dowel bar baskets
bull The top layer of the two-layer pavement should be designed no less than 70 mm (275 in) thick in order to reduce the chance for poor consolidation and a thin surface layer to occur
bull The concrete mixture for the top layer should be revised to eliminate sand partishycles larger than 1 mm (004 in) These coarser particles prevent the coarse aggreshygate in the mixture from ldquolockingrdquo together which is needed in order to reduce noise
bull The environmental ramifications of the dust and slurry generated from the surface brushing operations must be clarified in the design stage There was excessive dust generated during the brushing operation but fortunately the location was not near a resishydential area Disposal of the slurry must meet all local regulations
bull Repair methods need to be developed for exposed aggregate surfaces when the texshyture depth is determined to be out of the specified range
76
One-Year Performance Findings In the first year after the construction of the pavement sections distress surveys skid testing and noise studies were conducted Results of those monitoring activities are given below (Smiley 1995)
bull The first performance evaluation of the project was conducted in October 1994 just prior to the I-75 freeway being opened to normal traffic operations (the southbound lanes had been re-routed on the northbound lanes) Observations from that initial survey include
ndash On the European pavement section only one transverse crack was identishyfied A core retrieved over the crack indicated significant honeycombing It was later determined in conversashytions with the construction project staff that the crack was likely a cold joint between old concrete and a botched attempt to patch fresh conshycrete that had been damaged by conshytractor paving equipment
ndash Occasional surface popouts were noted throughout the European paveshyment section These diameter of these popouts was normally between 25 and 50 mm (1 and 2 in)
ndash The EPDM joint seals on the Euroshypean pavement section appeared to be in very good condition although there was occasional evidence of ldquocamelshyback humpingrdquo on some of the transshyverse joints
ndash The exposed aggregate surface of the European pavement section appeared to have lost macro-texture in the two inner lanes where traffic was during most of 1994 when the southbound lanes were being reconstructed
ndash On the Michigan standard pavement section approximately 50 percent of the 125-m (41-ft) long panels conshytained transverse cracks typical of
JRCP designs The cracks were tight and typically irregular in direction
bull Surface friction was measured on both secshytions in accordance with ASTM E-274 Tests were conducted in November 1993 and again in April 1994 Over that time the overall avshyerage friction number for the European pavement section increased from 38 to 42 while the overall average friction number for the Michigan standard pavement section inshycreased from 46 to 53
bull A traffic noise study was conducted in June 1994 on both the European pavement section and the Michigan standard pavement section Both interior and exterior noise levels were recorded The results from the study indicate that the exposed aggregate surface did not produce the expected reduction in noise levshyels that are perceptible to persons residing adjacent to the project or when traveling by car One possible reason for this is that the exshyposed aggregate surface had too much macro-texture from the excessive spacing of the coarse aggregate particles
Five-Year Performance Findings A 5-year analysis of the performance of the two test sections was just recently completed (Buch Lyles and Becker 2000) This analysis included an evaluashytion of traffic pavement distress roughness surface friction and deflection data obtained on the sections from 1993 to 1998 An economic analysis of each section was also conducted Summaries of these analyses are provided in the following sections
Traffic Pavement performance is typically assessed in terms of how well the pavement stands up to traffic loadshying which is generally expressed in terms of 80-kN (18-kip) equivalent single-axle load (ESAL) applicashytions However because of variable commercial trafshyfic levels and questionable vehicle classification data the 5-year evaluation used total traffic volume as the basis for performance comparisons (Buch Lyles and Becker 2000) The cumulative total traffic volume (traffic in all lanes in one direction) for these sections is shown in Figure 55 (Buch Lyles and Becker 2000)
77
Cum
ulati
ve T
ota
l T
raff
ic V
olu
me
millions
of
vehic
les
120
100
80
60
40
20
0
Euro M ich Std
1992 1993 1994 1995 1996 1997 1998 1999 Y e a r
C u m u la t iv e T o t a l T r a f f ic V o lu m e m i l l io n s o f
v e h ic le s
EuroM ich Std
Cumulative Total Traffic Volume millions of vehicles
C u m u la t iv e T o t a l T r a f f ic V o lu m e m i l l io n s o f
v e h ic le s
111993993993 199419941994 199519951995 120120
100100
8080
111996996996 199719971997
IR
IRI
I
iinnmm
ii
6060
4040
2020
00
Euro M ich Std
00 2200 4400 6600 8800 110000 Cumulative Total Traffic Volume millions of
vehicles
Figure 55 Cumulative total traffic volumes for MI 1 test sections (Buch Lyles and Becker 2000)
Pavement Distress Pavement distress surveys are conducted regularly on Michiganrsquos highways as part of MDOTrsquos paveshyment management activities The condition of a pavement is reported in terms of a distress index (DI) which is computed based on the type extent and severity of distress Data from 1995 and 1997 showed a DI of 0 for the European pavement secshytion indicating a distress-free pavement well below the rehabilitation trigger value of 50 (Buch Lyles and Becker 2000) The 1995 and 1997 DI values for the Michigan standard pavement section are 1 for both years also suggestive of a pavement in very good condition (Buch Lyles and Becker 2000)
Roughness MDOT has monitored the roughness of these pavement sections using an inertial profiler International Roughness Index (IRI) values computed from the measured profiles are shown in Figure 56 as a function of total traffic (Buch Lyles and Becker 2000) The European pavement is noted to be slightly rougher than the Michigan standard pavement but overall the smoothness levels have remained fairly constant It should be noted that IRI values less than 13 mkm (80 inmi) are considered to be smooth (Buch Lyles and Becker 2000)
Figure 56 Computed IRI values for MI 1 test sections (Buch Lyles and Becker 2000)
78
TEST PROPERTY TEST LOCATION
EUROPEAN PAVEMENT MICHIGAN STANDARD PAVEMENT
NOVEMBER 1993
APRIL 1995
NOVEMBER 1993
APRIL 1995
Outside lane 130 mils 141 mils 199 mils 205 mils
Average maximum mid- Lane left of outside lane 137 mils 132 mils 213 mils 207 mils slab deflection
Inside lane 127 mils 133 mils 228 mils 207 mils
Average transverse joint
Outside lane 77 59 68 70
load transfer efficiency Lane left of outside lane 79 62 72 70
Deflection Analysis Surface Friction Deflection testing on the test sections has been pershyformed twice once in November 1993 and once in April 1995 (Buch Lyles and Becker 2000) The 1993 measurements were taken during daylight hours prior to the pavement being opened to traffic the 1995 measurements were taken at night because of lane closure restrictions (Buch Lyles and Becker 2000) An FWD using a 4000-kg (9000-lb) load was used to conduct the testing
Table 26 summarizes the results of the FWD testshying It is observed that the magnitude of the maxishymum mid-slab deflections are less for the European pavement than for the Michigan standard paveshyment which is not surprising given the strong base and thick subbase located beneath the European pavement slab However it is surprising that the load transfer efficiencies for both sections are as low as they are for such new pavements and that the most recent LTEs for the European pavement are less than the Michigan standard pavement One possible reason for this is the wet weather condishytions that had preceded the April 1995 testing which may have contributed to warping of the slabs (Buch Lyles and Becker 2000)
Friction numbers measured for these test sections are shown in Figure 57 (Buch Lyles and Becker 2000) The friction numbers for the Michigan stanshydard pavement section are higher than those of the European pavement section which is somewhat unexpected because of the exposed aggregate surshyface Both sections show an initial increase in fricshytion number which is most likely due to the wearshying off of the curing compound (Buch Lyles and Becker 2000)
Economic Analysis of Pavement Sections It was expected that the European pavement section would cost more to construct than the Michigan standard pavement but the result would be a longer-lasting concrete pavement A cost analysis showed that the European pavement cost about 234 percent more to construct than the Michigan stanshydard pavement (Buch Lyles and Becker 2000) However it should be noted that the European pavement was a demonstration project that was constructed as part of an ldquoopen-houserdquo conference so the costs are not representative of a conventional paving project
Table 26 Summary of Deflection Testing Results for MI 1 Sections (Buch Lyles and Becker 2000)
79
C u m u la t iv e T o t a l T r a f f ic V o lu m e m i l l io n s o f
v e h ic le s
EuroM ich Std
Cumulative Total Traffic Volume millions of vehicles
C u m u la t iv e T o t a l T r a f f ic V o lu m e m i l l io n s o f
v e h ic le s
EuroM ich Std
C u m u la t iv e T o t a l T r a f f ic V o lu m e m i l l io n s o f
v e h ic le s
1993199319931993 1991991991994444 1111999999995555 606060
505050
404040
303030
202020
101010
000
Cumulative Total Traffic Volume millions of vehicles
Fr
Fr
Friii
ccctttiii
ooonnn NNN
uuummm
bbbeeerrr
Euro M ich Std
000 111000 222000 333000 444000
Figure 57 Computed friction numbers for MI 1 test sections (Buch Lyles and Becker 2000)
An economic analysis was conducted to compare the life-cycle costs (LCC) of the European and Michigan standard pavements This required sevshyeral assumptions regarding future performance future maintenance cycles and future rehabilitation schedules Based on the analysis it was determined that the European pavement is not competitive with the Michigan standard pavement However the calculations are theoretical in the sense that the proshyjected time to maintenance and rehabilitation activities are based on MDOT estimates (Buch Lyles and Becker 2000) In addition the construcshytion costs of the European pavement may not be representative since it was a demonstration project Nevertheless the extrapolated data suggest that in order for the European pavement to be competitive it can cost no more than approximately 17 percent more than the Michigan standard pavement (Buch Lyles and Becker 2000)
Point of Contact
Tom Hines Michigan Department of Transportation 8885 Ricks Road PO Box 30049 Lansing MI 48909 (517) 322-5711
References
Buch N R Lyles and L Becker 2000 Cost Effec-tiveness of European Demonstration Project I-75 Detroit Report No RC-1381 Michigan Department of Transportation Lansing
Federal Highway Administration (FHWA) 1992 Report on the 1992 US Tour of European Con-crete Highways FHWA-SA-93-012 Federal Highway Administration Washington DC
Larson R M S Vanikar and S Forster 1993 US Tour of European Concrete Highways (US TECH) Follow-Up Tour of Germany and Aus-triamdashSummary Report FHWA-SA-93-080 Fedshyeral Highway Administration Washington DC
Smiley D L 1995 First Year Performance of the European Concrete Pavement on Northbound I-75mdashDetroit Michigan Research Report R-1338 Michigan Department of Transportation Lansing
Weinfurter J A D L Smiley and R D Till 1994 Construction of European Concrete Pave-ment on Northbound I-75mdashDetroit Michigan Reshysearch Report R-1333 Michigan Department of Transportation Lansing
80
94
90
35
Minnesota 1I-35W Richfield
94
90
35
Chapter 21 MINNESOTA 1 (I-35W Richfield)
Introduction
The Minnesota Department of Transportation (MnDOT) is reconstructing a portion of I-35W in the Minneapolis-St Paul area (see Figure 58) using high-performance concrete pavement concepts Loshycated between I-494 and Highway 62 in Richfield (a suburb of Minneapolis) this project is being parshytially funded under the TE-30 program and is being designed for a 60-year service life (Rettner 1999)
St Paul
Richfield
94
90
35
St Paul
Minnesota 1 I-35W Richfield
Richfield
Figure 58 Location of MN 1 project
Study Objectives
The benefits associated with a pavement that lasts for 60 years include reduced maintenance and user costs (Rettner 1999) However such a pavement is also expected to have a higher initial cost This proshyject has the following objectives (Rettner 1999)
bull Evaluate the costbenefit of designing a pavement to last 60+ years with zero mainshytenance in a very high traffic volume envishyronment
bull Evaluate the performance benefits of using a high performance concrete in an urban paving environment The specific mix will be designed to have high durability using a number of design features including
ndash Low permeability ndash High air content ndash Well-graded aggregate ndash High-quality aggregate ndash Ground granulated blast furnace slag
(GGBFS)
bull Evaluate the durability of dowel bars clad in stainless steel compared to solid stainless steel dowel bars and assess their ability to perform satisfactorily for 60+ years
bull Evaluate the long-term performance of epshyoxy-coated dowel bars compared to stainless steel dowel bars
bull Evaluate the relative performance of 38shymm (15-in) and 44-mm (175-in) diameshyter dowel bars
Project Design and Layout
The nominal pavement design for this project is a 340-mm (134-in) thick JPCP with 46-m (15-ft) transverse joints The slab thickness was developed based on a design traffic of 100 million ESAL apshyplications over the 60-year design period Tied conshycrete shoulders 315-mm (124-in) thick will be included with the expectation that they will carry traffic during construction or during future rehabilishytation activities (Rettner 1999)
The existing sand base course beneath the original pavement is several feet thick and will be left in place for the new PCC pavement It will be capped with 305 mm (12 in) of select granular material which in turn will be topped with a 100-mm (4-in) thick Class 5 dense-graded granular base to provide a paving platform for the new PCC pavement No open-graded base or edge drains are being included in the design
At least five different test sections were originally planned to be constructed as part of this project (Rettner 1999)
bull Section 1mdashJPCP containing a high-performance concrete mixture and 38-mm
81
(15-in) by 457-mm (18-in) stainless steel dowel bars This design will be constructed for 35 joints over five lanes (three driving two shoulders) for a total length of 161 m (525 ft)
bull Section 2mdashJPCP containing a high-performance concrete mixture and 44-mm (175-in) by 457-mm (18-in) stainless steel clad dowel bars This design will be conshystructed for 35 joints over five lanes for a total length of 161 m (525 ft)
bull Section 3mdashJPCP containing a high-performance concrete mixture and 38-mm (15-in) by 457-mm (18-in) stainless steel clad dowel bars This design will be conshystructed over the rest of the mainline paveshyment project (approximately 2500 m [8200 ft])
bull Section 4mdashJPCP containing a high-performance concrete mixture and 38-mm (15-in) by 457-mm (18-in) stainless steel clad dowel bars This will be constructed on all ramps except the bottom of the northshywest exit ramp to CSAH 53 These ramps will be constructed to the same thickness (340-mm [124-in]) as the mainline paveshyment
bull Section 5mdashJPCP containing a high-performance concrete mixture and 38-mm (15-in) by 457-mm (18-in) epoxy-coated dowel bars This will be constructed only at the bottom of the northwest exit ramp to CSAH 53 This ramp will be constructed to
the same thickness (340-mm [124-in]) as the mainline pavement
Table 27 displays the experimental design matrix for this project The section with epoxy-coated dowel bars is located on a ramp because of the deshysire for the entire length of the mainline pavement to last the 60-year design period without traffic disshyruptions that may be required for epoxy-coated dowel bars (Rettner 1999) Indications in Minnesota are that epoxy-coated bars may not last beyond 25 years without significant corrosion (Rettner 1999) In addition a project being constructed immediately north of the current project includes epoxy-coated dowel bars and will also serve as a control section for this variable (Rettner 1999)
The high-performance concrete mix was used throughout the entire project for durability and lonshygevity The aggregate quality specifications were tightened so that only the most durable aggregate sources were eligible including a stipulation limitshying the amount of limestone to no more than 20 percent (Rettner 1999) In addition a well-graded coarse aggregate was used for improved workability without the use of excessive amounts of water reshyducer Other notable features of the concrete mix design include a higher specified air content (6 to 8 percent entrained) for increased freeze-thaw protecshytion the inclusion of ground granulated blast furshynace slag for reduced permeability a 28-day rapid chloride permeability of 2500 coulombs (which according to ASTM C 1202 is a moderate level of permeability) and a water-to-cementitious-material ratio less than 040 (Rettner 1999)
Table 27 Experimental Design Matrix for MN 1 Project
DIAMETER (IN) MAINLINE
PAVEMENT RAMP
PAVEMENT
Stainless Steel Clad Dowel Bar 15 Section 3 Section 4
175 Section 2
Solid Stainless Steel Dowel Bar 15 Section 1
175
Epoxy-Coated Steel Dowel Bar 15 Section 5
175
82
These sections were constructed during the summer of 2000 However there was considerable difficulty in obtaining the required number of stainless steel clad dowel bars from the manufacturer and conseshyquently several modifications to the original exshyperimental design were made during construction Most of the northbound and all of the southbound lanes were constructed with solid stainless steel dowel bars and only a portion of the northbound lanes received stainless steel clad dowel bars Furshythermore the outside shoulders were constructed with plastic-coated bars and it appears as if the exit ramp that was to receive epoxy-coated bars will be also be constructed using plastic-coated bars Fishynally the inside shoulders will not be paved until the 2001 construction season
State Monitoring Activities
MnDOT will monitor the performance of these pavement sections for a minimum of 5 years Pavement distress surveys and ride quality measshyurements will be conducted every other year using standard MnDOT procedures (Rettner 1999) Load transfer efficiency will be measured on the outside lane using the MnDOT FWD on an every other year basis if traffic allows (Rettner 1999)
Preliminary ResultsFindings
Some findings on the use of high performance conshycrete specifications and high performance materials in Minnesota were presented a the 2003 Annual TRB meeting The following sections summarize some of the findings (Turgeon 2003 Rangaraju 2003)
Cement Paste Specification The contractor elected to provide a mix containing 229 kgm3 (384 lbsyd3) cement and 123 kgm3 (206 lbyd3) GGBFS This met all mix requirements inshycluding the RCP test Typically contractors elect to use the 25 percent fly ash mixes under the standard specification Fly ash is approximately half the cost of cement or GGBFS The introduction of GGBFS to the paving process registered some complaints of a ldquostickyrdquo mix from the finishers
The mix was produced concurrently from two batch plants located at the same site using the same mix design This further aggravated the variability in the plastic air contents which ranged from below 5
percent to over 10 percent Upon completion of the project price reductions were assessed for failing plastic air contents Most price reductions related to tests results of around 60 percent but some tests were as low as 40 percent
The hardened air contents as determined using ASTM C457 were determined for the top middle and bottom third of each sample Results ranged from 67 percent to 157 percent with an average value of 106 percent Sixteen of the 26 hardened air contents were above the maximum allowable of 100 percent Only one was below the range minishymum of 70 percent The cores were taken at ranshydom therefore they do not coincide with any of the plastic air tests taken Even so these results do not correspond well with the plastic air contents disshycussed previously Further analysis of the linear traverse results showed the prevalence of small voids with diameters less than 100 microns Few air voids are present in the 150 micron to 250 micron range It has been theorized that the volumetric air meters used to determine plastic air contents are not efficient when measuring small bubbles which could account for the test result differences Small bubbles may be more susceptible to filling with secondary reaction by-products thus undermining the long-term void structure effectiveness The ratio of entrapped to entrained air was determined to be acceptable however this determination was not available until a few months after paving was comshyplete
Aggregate Specification The coarse aggregate supplied consisted of a low carbonate class C gravel This material qualified for the full aggregate quality bonus The contractor added ldquoSafety Gritrdquo No 8 sieve to 95-mm (0375shyin) sand to the typical coarse rock and sand mixshyture to meet the denser gradation requirements
Pavement Thickness The pavement was specified and constructed at a thickness of 340 mm (135 in) The ability to finish the surface avoiding edge slump deformation and meeting the low wc ratio were competing considshyerations that required the contractorrsquos constant atshytention The additional thickness added to the comshyplexity of these issues
83
Load Transfer The first paving was scheduled for fall 1999 but proshyject conflicts delayed it until spring 2000 At that time approximately 75 percent of the required quanshytity of stainless clad bars was available for installashytion To keep the project on schedule plastic-coated dowel bars of the same dimension were substituted and used in the shoulder The opposing direction of traffic was paved in summer 2000 but sufficient stainless steel clad bars were not available Conseshyquently the majority of this work used solid stainless dowel bars at a significant increase in cost
Cost Placement costs are primarily a factor of the comshyplexity of the project and the pavement thickness Projects that include long uninterrupted stretches of pavement are less costly to place since less time is spent mobilizing equipment and setting up For thicker pavements the larger volume of concrete needed to produce an equivalent area of concrete slows production which leads to higher placement costs Edge slump is also a more prevalent problem with thicker pavements The placement bid price for the 340-mm (135-in) pilot HPC project was $755m2 ($631yd2) Four projects let the same year with pavement thickness ranging from 254 mm to 267 mm (100 to 105 in) had an average placeshyment cost of $685m2 ($572yd2) The cost differshyence seems to be primarily due to thickness
The two factors that greatly influence the structural concrete unit price are the project quantity and the ability of paving contractors to produce the material from their own mobile batch plants Small quantity projects or projects without space to set up a portshyable batch plant require the paving contractor to purchase concrete from a local ready-mix supplier at a higher cost Due to the confined location the paving contractor purchased the 22841 m3 (30054 yd3) of concrete from a ready-mix supplier at a unit price of $9740m3 ($7402yd3) This unit price does not reflect any potential incentive disincenshytives Four similarly sized non-HPC projects let that same year had the following quantities and unit bid prices for structural concrete 13824 m3 at $7865m3 (18189 yd3 at $5977yd3) 19838 m3 at $8637m3 (26103 yd3 at $6564yd3) 40806 m3 at $7313m3 (53692 yd3 at $5558yd3) and 7665 m3
at $11618m3 (10085 yd3 at $8830yd3) The difshyferent quantities aggregate availability and project complexities make it difficult to make a direct asshy
sertion as to the added cost of the HPC specificashytion However based upon feedback from the pavshying contractor the added cost for the HPC structural concrete is approximately $1300m3 ($1000yd3)
The unit costs of the different types of dowel bars also varied considerably The epoxy-coated dowel bar cost $520 the 38-mm (15-in) stainless steel clad dowel bar $1160 the 44-mm (175-in) stainless steel clad dowel bar $1430 and the solid stainless steel dowel bar $1970 A 16-km (10-mi) long project consisting of two 36-m (12-ft) lanes and 46-m (15-ft) joint spacing requires 8448 dowel bars yielding a total dowel bar cost of $4392960 for the epoxy-coated dowels $9799680 for the 38-mm (15-in) stainless steel clad dowels $12080640 for the 44-mm (175-in) stainless steel clad dowels and $16642560 for the solid stainless steel dowels The annualized cost for a 60-year design using solid stainless dowels is sigshynificantly higher than the annualized cost of a stanshydard 35-year design (ignoring user costs)
Point of Contact
Curt Turgeon Minnesota Department of Transportation 1400 Gervais Avenue Maplewood MN 55109 Ph (651) 779-5535 Fax (651) 779-5616 curtturgeondotstatemnus
References
Rangaraju P R 2003 Development of Some Per-formance-Based Material Specifications for Minne-sotarsquos High-Performance Concrete Pavement Transportation Research Board Annual Meeting CD-ROM Transportation Research Board Washshyington DC
Rettner D 1999 I-35W High Performance Rigid Pavement Work Plan Minnesota Department of Transportation Maplewood
Turgeon C 2003 Minnesotarsquos High Performance Concrete Pavements Evolution of the Practice Transportation Research Board 2003 Annual Meetshying CD-ROM Transportation Research Board Washington DC
84
94
90
35 Minnesota 2MnRoad Test Facility
Low Volume Road LoopAlbertville
94
90
35
Chapter 22 MINNESOTA 2 (MnRoad Low-Volume Road Facility)
Introduction
The Minnesota Road Research Project (MnRoad) is a major highway research initiative studying the performance of asphalt- concrete- and aggregate-surfaced roadways Opened to traffic in 1994 the purpose of the test road is to gain a better undershystanding of pavement response and pavement beshyhavior to traffic and environmental loadings with the expectation that improvements to existing pavement design and evaluation procedures will result
The MnRoad facility is located near Albertville just northwest of Minneapolis-St Paul (see Figure 59) It consists of two different road segments runshyning parallel to I-94 one a 57-km (35-mi) mainline roadway in the westbound direction carryshying interstate traffic and the other a 40-km (25shymi) low-volume road (LVR) loop exposed to conshytrolled truck weight and traffic loadings A variety of heavily instrumented test sections consisting of different thicknesses of concrete asphalt and agshygregate surfaces as well as other design features have been constructed within each road segment The asphalt sections on the LVR loop were deshysigned to last approximately 3 years and after 5
St PaulAlbertville
94
90
35
St Paul
Minnesota 2 MnRoad Test Facility
Low Volume Road Loop Albertville
Albertville
Figure 59 Location of MN 2 project
years several of these sections have required rehashybilitation or reconstruction (MnDOT 2000) By eliminating one of the deteriorated gravel test secshytions on the LVR three new JPCP test sections (numbered 32 52 and 53) were constructed with partial funding from the TE-30 program (MnDOT 2000) Figure 60 shows the layout of the MnRoad facility and the approximate location of the new test sections
I-94 EBI-94 WB
WB TestLanes
Low Volume RoadTest Loop
To AlbertvilleTo Monticello
32 52470 ft 285 ft 115 ft
Approximate Location ofTest Sections
53
N
I-94 EBI-94 WB
WB Test Lanes
Low Volume Road Test Loop
To AlbertvilleTo Monticello
32 52 470 ft 285 ft 115 ft
Approximate Location of Test Sections
53
N
Figure 60 Approximate location of new LVR test sections at MnRoad facility
85
Study Objectives
These three new test sections were constructed to obtain data not previously considered in the original LVR designs as well as to satisfy the data needs of local agencies (MnDOT 2000) Specific objectives include the following (MnDOT 2000)
bull Characterization of early-age and long-term slab curling and warping
bull Measurement of early-age and long-term internal slab stresses and shrinkage
bull Evaluation of long-term joint load transfer behavior of different dowel bar types
bull Evaluation of the performance of a thin low-cost JPCP for low-volume applicashytions
bull Evaluation of a concrete mixture containing ground granulated blast furnace slag (GGBFS)
bull Validation of sensor readings from other MnRoad test sections
bull Further investigation of the feasibility of retrofitting sensors in a pavement
Project Design and Layout
The three test sections are located on the southern tangent of the LVR near the eastern loop Design characteristics of each section are provided below (MnDOT 2000)
bull Section 32mdash127-mm (5-in) JPCP with 31-m (10-ft) transverse joints The paveshyment rests on a 178-mm (7-in) aggregate base The joints are sealed with a hot-poured joint sealant material and do not contain dowel bars The concrete mix conshytains 35 percent GGBFS
bull Section 52mdash190-mm (75-in) JPCP with 46-m (15-ft) transverse joints A 127-mm (5-in) aggregate base is located beneath the pavement slab The transverse joints are sealed with silicone The outside lane is 40-m (13-ft) wide and the inside lane is 43-m (14-ft) wide Four different load transfer devices are included in the section
ndash 25-mm (1-in) diameter 381-mm (15shyin) long epoxy-coated dowel bars
ndash 32-mm (125-in) diameter 381-mm (15-in) long epoxy-coated dowel bars
ndash 32-mm (125-in) diameter 457-mm (18-in) long fiber-reinforced polymer dowel bars
ndash 38-mm (150-in) diameter 457-mm (18-in) long fiber-reinforced polymer dowel bars
bull Section 53mdash190-mm (75-in) JPCP with 46-m (15-ft) transverse joints A 127-mm (5-in) aggregate base is beneath the paveshyment The transverse joints are sealed with silicone The outside lane is 40-m (13-ft) wide and the inside lane is 43-m (14-ft) wide None of the joints is doweled
Table 28 summarizes some of the key design feashytures for the MN 2 test sections Figure 61 illusshytrates the layout of test sections 52 and 53
Instrumentation layout for these test sections began in April 2000 with actual construction commencing in June (MnDOT 2000) Table 29 summarizes the type and number of sensors in these test sections (Burnham 2001) Concrete paving was performed on June 30 which was immediately followed by 72 hours of continuous monitoring of the internal shrinkage strain and temperatures as well as the external shape of the slabs (MnDOT 2000)
86
SSeectionction 5252 112525-in-in 115500-in-in
diadiammetereter didiamameteterer 112255--iinn FiFibbeerr FiberFiber 100100-in-in
diadiammetereter EEppoxoxy-y-CoCoatateded
DoDowweelsls
ReReinfinfoorcercedd PolyPolymmeerr DoDowweelsls
ReReinfinfoorrcceedd
PolPolyymmeerr DoDowweelsls
diadiammetereter EpoxyEpoxy--CCoatedoated
DoDowweelsls
1414 fftt
SSeectionction 5353
NoNo DoDowweelsls
1313 fftt 00 11 22 33 4 54 5 66 77 8 98 9 10 1110 11 12 1312 13 14 1514 15 16 1716 17 1818 1919 20 2120 21 22 2322 23 24 25 2624 25 26
2626 slabs slabs 1155 fftt 1100 ftft
Table 28 Summary of Design Features for MN 2 Test Sections
DESIGN FEATURE SECTION 32 SECTION 52 SECTION 53
Pavement type JPCP JPCP JPCP
Concrete mix GGBFS Conventional Conventional
Slab thickness in 5 75 75
Base type 7 in aggregate 5 in aggregate 5 in aggregate
Transverse joint spacing ft 10 15 15
Load transfer None (aggregate interlock) 1-in epoxy-coated dowels 125-in epoxy coated dowels 125-in fiber reinforced polymer 150-in fiber reinforced polymer
None (aggregate interlock)
Joint sealant Hot-pour Silicone Silicone
Longitudinal joint tie bars No 4 bars 30-in spacings No 4 bars 30-in spacings No 4 bars 30-in spacings
Lane width ft 12 (both) 13 (outside) 14 (inside)
13 (outside) 14 (inside)
Section length ft 470 285 115
JPCP = jointed plain concrete pavement GGBFS = ground granulated blast furnace slag
Figure 61 Layout of test sections 52 and 53 for MN 2 project
87
Table 29 Sensor Types and Quantities for Test Sections 32 52 and 53
QUANTITIES
SENSOR TYPE MEASUREMENT TYPE MANUFACTURER SECTION 32 SECTION 52 SECTION 53
Concrete embedment sensor Strain Tokyo Sokki 37 87 20
Displacement transducer Joint opening Tokyo Sokki 4 8 4
Invar reference rod Elevation MnDOT 4 4
Stainless steel reference rod Elevation MnDOT 2 5 1
Concrete embedment sensor Strain MicroMeas 8
Psychrometer sensor Relative humidity Wescor 4 4 4
Moisture resistance sensor Relative humidity ELE International 6 6 6
Dynamic Soil Pressure Sensor Pressure Geokon 1 3 3
Static soil pressure sensor Pressure Geokon 1 2 2
Thermocouple (T-type) Temperature Omega 16 16 16
Time domain reflectometer Soil moisture Campbell Scientific 6 4 4
Vibrating wire strain sensor Strain Geokon 16 35 34
State Monitoring Activities
As with all pavements at the MnRoad test facility these sections are subjected to an intensive data colshylection effort In addition to the data obtained from the instrumented slabs within each section visual distress data faulting measurements ride quality and FWD deflection data are collected (MnDOT 2000)
Preliminary Results and Findings
One of the objectives of this study was to evaluate the long-term joint performance of different dowel bar types Preliminary data on the dowel bars is provided below in Figures 62 and 63 The initial load transfer efficiency was lower for the FRP bars compared to the steel dowels by about 5 percent After 2 years in service the load transfer efficiency for the FRP bars dropped from approximately 80 percent to approximately 70 to 75 percent which are considered critical minimum levels The performance of the epoxy-coated steel bars appears relatively constant since construction The differenshytial deflections measured across each joint are still relatively low as can be seen in Figure 63
Another objective of the MN 2 project was to evaluate the early-age and long-term slab curling and warping Early-age profile measurements made using the Dipstick are provided in Figures 64 to 66 The profiles measurements revealed that large posishytive temperature moments can produce sufficient deformation in the slab such that the slab is unsupshyported along the whole length of the transverse joint due to upward curvature Large negative gradients can result in a deformed slab that forces the bottom of the slab into the base layer along the complete length of the transverse joint The total range of movement of the corner of the slab adjacent to the asphalt shoulder for the temperature conditions preshysent during measurement period was approximately 3500 microns The total movement for the corner of the slab adjacent to the longitudinal joint was 2500 microns These measurements were for slabs without dowel or tie bars A more thorough analysis of the early-age performance data can be found in Vandenbossche (2003)
Extensive research has also been performed on the analysis of measured dynamic strains in the thin concrete pavements on the MN2 project An in-depth discussion of the findings is provided by Burnham (2003 2004)
88
0
10
20
30
40
50
60
70
80
90
100 LT
E (
)
7132002 912002 10212002 12102002 1292003 3202003 592003
10 Epoxy steel 125 Epoxy steel 125 FRP 15 FRP
(mils
)
Diff
eren
tial D
efle
ctio
n (m
icro
ns)
00
05
10
15
20
25
30
35
7132002 912002 10212002 12102002 1292003 3202003 592003
10 Epoxy steel 125 Epoxy steel 125 FRP 15 FRP
Load Transfer Efficiency 9000 FWD Load leave side of joint
Figure 62 Load transfer efficiency of joints with different types of dowel bars for MN 2 project
Differential Joint Deflection 9000 FWD Load leave side of joint
Figure 63 Differential deflections across joints with different types of dowel bars for MN 2 project
89
3500
Dis
plac
emen
t m
icro
ns
3000 2500 2000 1500 1000 500
0 -500
-1000 -1500
0 100 200 300 400 500
Distance cm
600
D
ispl
acem
ent
mic
rons
Cell 53 - Diagonal (Replicate of Unrestrained Slabs in Cell 6)
3500 3000 2500 2000 1500 1000
500 0
-500 -1000 -1500
0 100 200 300 400 500 Distance cm
600
Cell 53 - Approach Transverse Joint (Replicate of Unrestrained Slab in Cell 6)
Figure 64 Transverse profile of unrestrained slab in Cell 53 for MN 2 project (Vandenbossche 2003)
Figure 65 Diagonal profile of unrestrained slab in Cell 53 for MN 2 project (Vandenbossche 2003)
90
3000
cron
s
2500 2000 i
nt m 1500
eD
ispl
acem
1000 500
0 -500
-1000 -1500
0 100 200 300 400 500 600 Distance cm
Cell 52 - Diagonal (Replicate of Restrained Slab in Cell 6)
3500
Figure 66 Diagonal profile of restrained slab in Cell 52 for MN 2 project (Vandenbossche 2003)
Point of Contact
Thomas Burnham 1400 Gervais Avenue Maplewood MN 55109 (651) 779-5606 TomBurnhamdotstatemnus
References
Burnham T R 2001 Construction Report for MnRoad PCC Test Cells 32 52 and 53mdashFinal Report Minnesota Department of Transportation Maplewood
mdashmdashmdash 2003 ldquoSeasonal Load Response Behavshyior of a Thin PCC Pavementrdquo Proceedings Eighth International Conference on Low-Volume Roads Transportation Research Record 1819 Transportation Research Board Washington DC
mdashmdashmdash 2004 ldquoLoad Proximity Correlation of Dynamic Strain Measurements in Concrete Paveshymentrdquo Proceedings Second International Con-ference on Accelerated Pavement Testing Minshyneapolis MN
Minnesota Department of Transportation (MnDOT) 2000 New JPCP Test Cells at the MnROAD Project Minnesota Department of Transportation Maplewood
Vandenbossche J M 2003 Interpreting Falling Weight Deflectometer Results for Curled and Warped Portland Cement Concrete Pavements Thesis for the degree Doctor of Philosophy in Civil Engineering University of Minnesota St Paul
91
Chapter 23 MINNESOTA 3 (MnRoad Mainline Road Facility and US 169 Albertville)
Introduction
This study included two projects three test secshytions on US 169 in Elk River and six test sections on I-94 at the Minnesota Road Research (MnRoad) test facility (see Figure 67)
The US 169 site represents a typical application for ultrathin whitetopping Most of the loads are static and the traffic is constantly starting and stopping This section of US 169 carries approxishymately 400000 ESALS per year The few cracks that were present in the existing asphalt pavement were in good condition but the asphalt itself was not especially along the outer edge A large amount of rutting (greater than 25 mm [1 in]) was also present before milling
The I-94 section was in good condition Very few cracks were present on the existing asphalt paveshyment and all were of low severity The roadway is subjected to heavy traffic loadings (over 1 million ESALs per year) Although this is not a typical application it provided the opportunity to monitor the performance of the overlay under accelerated loading conditions and to evaluate ultrathin
Figure 67 Location of MN 3 project
whitetoppings as an overlay alternative for high-volume roads (Vandenbossche and Rettner 1998 Vandenbossche and Rettner 1999)
Study Objectives
The purpose of the test sections was to further evalushyate how whitetopping performs in Minnesota and to determine what design features are desirable to optishymize the life of the pavement These heavily instrushymented sections allow the static and dynamic reshysponse of the pavement under various applied and environmental loading conditions to be measured In doing this a better understanding can be obtained on how to more accurately model whitetopping overlays so that a more efficient design method and performshyance prediction model can be developed
Project Design and Layout
The first project was located on the outer southbound lane of US 169 in Elk River at the intersections of Jackson School and Main streets The first 2402 m (788 ft) north of each intersection was overlaid with 762 mm (3 in) of fiber reinforced concrete and the final 366 m (12 ft) was paved 2032 mm (8 in) thick The original asphalt pavement was constructed in 1961 on a sandy subgrade and consisted of a 1016shymm (4-in) asphalt surface on 127-mm (5-in) of a relatively dense-graded aggregate base and 1524shymm (6-in) of subbase In 1991 508 (2 in) of asphalt was milled and the pavement was overlaid with 381 mm (15 in) of asphalt The average asphalt thickshyness based on a total of 10 cores was 15875 (625 in) Temperature and dynamic and static strain senshysors were installed at the Jackson Street intersection A summary of each test section is provided in Table 30
On the MnRoad project a 3429-mm (135-in) full-depth asphalt pavement was whitetopped with a fishyber-reinforced concrete overlay The original asphalt pavement was constructed in 1993 on a silty-clay subgrade The existing asphalt pavement was previshyously a transition zone that separated the 5- and 10shyyear mainline test cells The test section was divided up into six separate test cells with various thicknesses
92
TEST CELL DESCRIPTION SENSOR NO OF SENSORS
Jackson Street intersection 75 mm ndash 12 m x 12-m panels (3 in ndash 4 ft x 4-ft) Polypropylene fibers
Dynamic strain Static strain Thermocouple
32 4
14
Main Street intersection 75 mm ndash 12 m x 12-m panels (3 in ndash 4 ft x 4-ft) Polypropylene fibers
None
ndash
School Street intersection 75 mm ndash 18 m x 18-m panels (3 in ndash 6 ft x 6-ft) Polyolefin fibers
None
ndash
and joint patterns These cells were instrumented with strain temperature and moisture sensors A summary of the test cells is provided in Table 31
The US 169 test sections were paved on Septemshyber 17 1997 and the I-94 test sections on October 23 1997 All concrete was required to have an air content of 65 percent plusmn 15 percent and a flexural strength of 27579 kPa (400 lbfin2) at 3 days so that the overlays could be opened to traffic The flexural and compressive strengths for the conshycrete on US 169 are provided in Tables 32 and 33 respectively The flexural strengths for both the polypropylene and polyolefin mixes were similar The polypropylene concrete had slightly higher compressive strengths even though the wc ratio for the polyolefin mix was lower Increasing the
fiber content in the polyolefin mix by 8 times that of the polypropylene mix contributed to the lower strength of the polyolefin concrete Both mixes met the Minnesota Department of Transportationrsquos (MnDOTrsquos) flexural and compressive strength reshyquirements
In addition to the material testing on the US 169 proshyject extensive material property testing was also pershyformed on the concrete mixture used to construct the I-94 test sections These material properties are summarized in Tables 34 through 36
Additional information on the concrete mixture deshysign and the construction of these test sections can be found in the report by Vandenbossche and Rettner (1998)
Table 30 Summary of US 169 Whitetopping Test Sections for MN 3 Project
93
MnROAD TEST CELL DESCRIPTION SENSOR NO OF SENSORS
Cell 93 100 mm ndash 12 m x 12-m panels (4 in ndash 4 ft x 4-ft) Polypropylene fibers
Dynamic strain Dynamic asphalt foil strain gauge Static strain Thermocouple Moisture
32 2 8
14 12
Cell 94 75 mm ndash 12 m x 12-m panels (3 in ndash 4 ft x 4-ft) Polypropylene fibers
Dynamic strain 32
Cell 95 75 mm ndash 15 m x 18-m panels (3 in ndash 5 ft x 6-ft) Polyolefin fibers
Dynamic strain Dynamic asphalt foil strain gauge Static strain Thermocouple Moisture
32 2 8
12 12
Cell 96 150 mm ndash 15 m x 18-m panels (6 in ndash 5 ft x 6-ft) Polypropylene fibers
Dynamic strain 32
Cell 97 150 mm ndash 3 m x 37-m panels (6 in ndash 10 ft x 12-ft) Polypropylene fibers
Dynamic strain Dynamic asphalt foil strain gauge Static strain Thermocouple Moisture
32 2 8
16 12
Cell 97b 150 mm ndash 3 m x 37-m panels (6 in ndash 10 ft x 12-ft) Polypropylene fibers Doweled
Nonendash
TIME OF Time of STRENGTH Strength TESTING Testing
CONCRETE WITH POLYPROPYLENE FIBERS CONCRETE WITH POLYPROPYLENE FIBERS (JA(JACKSON STREET INTERSECTION) (LBFIN2) CKSON STREET INTERSECTION) (LBFIN2)
CONCRETE WITH POLYOLEFIN FIBERS
(MAIN STREET INTERSECTION) (LBFIN2)
28-day 590 570
Table 31 Summary of MnRoad Whitetopping Test Sections for MN 3 Project
Table 32 Flexural Strengths for US 169 on the MN 3 Project
94
TIME OF STRENGTH TESTING
CONCRETE WITH POLYPROPYLENE FIBERS
(JACKSON STREET INTERSECTION) (LBFIN2)
CONCRETE WITH POLYPROPYLENE FIBERS
(SCHOOL STREET INTERSECTION) (LBFIN2)
TIME OF STRENGTH TESTING
CONCRETE WITH POLYPROPYLENE FIBERS
(LBFIN2)
TIME OF STRENGTH TESTING
CONCRETE WITH POLYPROPYLENE FIBERS
(LBFIN2)
TIME OF STRENGTH TESTING
CONCRETE WITH POLYPROPYLENE FIBERS
Table 33 Compressive Strengths for US 169 on the MN 3 Project
CONCRETE WITH POLYOLEFIN FIBERS
(MAIN STREET INTERSECTION) (LBFIN2)
28-day 4900 4900 4400
28-day 5400 5900 5300
Table 34 Compressive Strengths for I-94 on the MN 3 Project
CONCRETE WITH POLYOLEFIN FIBERS
(LBFIN2)
1-day 2000 1600
3-day 3900 2900
7-day 4800 4200
14-day 5500 4800
28-day 6100 5300
Table 35 Elastic Moduli for I-94 on the MN 3 Project
CONCRETE WITH POLYOLEFIN FIBERS
(LBFIN2)
7-day 45 x 10-6 43 x 10-6
28-day 48 x 10-6 44 x 10-6
Table 36 Poissonrsquos Ratio for I-94 on the MN 3 Project
CONCRETE WITH POLYOLEFIN FIBERS
7-day 019 019
28-day 019 019
95
State Monitoring Activities
Climatic static strain and dynamic strain data are collected periodically throughout the year on the US 169 project On the I-94 project temperature moisture and static strain data was collected every 15 minutes since construction Dynamic strain data was collected for both static and dyshynamic truck loads and in conjunction with FWD testing four times per year once during each seashyson Distress ride and faulting data was also colshylected four times per year
Preliminary ResultsFindings
Distinct cracking patterns developed within each test section The UTW test sections with a 122-m x 122-m (4-ft x 4-ft) joint pattern contained corshyner breaks and transverse cracks The corner breaks occurred primarily along the inside longishytudinal joint and the laneshoulder (LS) longitushydinal joint while the transverse cracks developed in the panels adjacent to the shoulder The transshyverse cracks typically develop approximately 13 of the length of the panel away from the transshyverse joint The test section with the 183-m x 183-m (6-ft x 6-ft) joint pattern performed sigshynificantly better because the longitudinal joint does not lie in the inside wheelpath This signifishycantly reduces the edge and corner stresses Very tight longitudinal cracks developed on the 1524shymm (6-in) overlay with a 183-m x 183-m (6-ft x 6-ft) joint pattern on I-94 Reflective cracking was not observed in any of the test sections although reflective cracking has been found to occur in UTW placed on thicker HMA pavements such as on I-94 (Vandenbossche 2003) The strains measured on I-94 were consistently lower than those on US 169 even when measshyurements were made at higher HMA temperashytures The reduction in strain is a result of the inshycrease in thickness and quality of the HMA on Ishy94 and an increase in the bond strength between the two layers Increases in the temperature of the HMA also produce much smaller increases in strain on I-94 compared to US 169 except for the strains measured at mid-panel Strains at mid-panel on the I-94 project approach those measured at mid-panel on the US 169 project It was found that applying a load when the HMA temperature is high produces similar strains in the UTW reshy
gardless of the thickness of the HMA layer when a good bond is obtained (Vandenbossche 2003) The strain measurements emphasize the importance of the support provided by the HMA layer A reducshytion in this support occurs when the temperature of the HMA is increased or when the HMA begins to ravel The results from the strain measurements and the cores pulled from the test section indicate the HMA ravels at a faster rate along the joints where there is greater access for the water to enter the pavement structure The lane-shoulder joint is the most difficult to keep sealed and therefore the HMA along this joint was found to be more susceptible to strippingraveling Consideration should be given to sealing this joint to limit the water coming into contact with the HMA layer (Vandenbossche 2003) Repairs were made on three of the six MnROAD test sections on June 20 2001 after over 47 million ESALs The repairs were made to 13 different areas in the ultrathin whitetopping test sections In the secshytion with a 3-in overlay and 5-ft by 5-ft joint spacing four panels were repaired (two locations) Eighteen panels were repaired (six locations) in the section with a 3-in overlay and 4-ft by 4-ft joint spacing Nineteen panels were repaired (five locations) in the section with a 4-in overlay and 4-ft by 4-ft panels A detailed description on the repair techniques used was provided by Vandenbossche and Fagerness (2002)
Current Project Status Results and Findings
The test sections on US 169 were in service between September 1997 and September 1999 During that period the sections accumulated approximately 670000 equivalent single-axle loads (assuming a 1524-mm (6-in) portland cement concrete pavement and a terminal serviceability of 25) Additional inshyformation on the performance of these test sections can be found in the report by Vandenbossche (2002)
Three of the test sections on I-94 will be reconshystructed in the summer of 2004 The new test sections will consist of a 127-mm (5-in) and a 1016-mm (4shyin) overlay with 152-m x 183-m (5-ft x 6-ft) panels Half of each section will have sealed joints and the joints in the other half of each test section will remain unsealed The monitoring activities will be similar to that for the original whitetopping test sections The new test sections will be instrumented with temperashyture moisture and static and dynamic strain gauges
96
Point of Contact
Thomas Burnham 1400 Gervais Ave Maplewood MN 55109 (651) 779-5606 TomBurnhamdotstatemnus
References
Vandenbossche J M 2003 ldquoPerformance Analyshysis of Ultra-thin Whitetopping Intersections on US-169rdquo Transportation Research Record 1823 Transportation Research Board Washington DC
mdashmdashmdash 2002 The Construction and Performance of Ultra-thin Whitetopping Intersections on US-169 Final Report Minnesota Department of Transportation St Paul
Vandenbossche J M and A J Fagerness 2002 ldquoPerformance Analysis and Repair of Ultra-thin and Thin Whitetopping at MnROADrdquo Transportation Research Record 1809 Transportation Research Board Washington DC
Vandenbossche J M and D L Rettner 1999 ldquoOne-Year Performance Summary of Whitetopping Test Sections at the MnROAD Test Facilityrdquo Pro-ceedings International Conference on Accelerated Pavement Testing Reno NV
mdashmdashmdash 1998 The Construction of US-169 and I-94 Experimental Whitetopping Test Sections in Minne-sota Minnesota Department of Transportation St Paul
97
55
20
Mississippi 1US 72 Corinth
55
20
Chapter 24 MISSISSIPPI 1 (US 72 Corinth)
Introduction
The Mississippi Department of Transportation (MDOT) constructed an experimental project in 2001 under the TE-30 program to investigate the performance of a resin-modified pavement (RMP) RMPs are a new composite paving mateshyrial consisting of a thin layer (50 mm [2 in]) of open-graded hot mix asphalt (HMA) whose intershynal voids (approximately 30 percent) are filled with a latex rubber-modified portland cement grout (MDOT 1999) RMPs provide a tough and durable pavement surface that resists rutting surshyface abrasion and deterioration due to fuel spillshyage (Anderton 1996) To date they have been used almost exclusively on military bases but current research suggests they are suitable for any low-speed traffic application where resistance to heavy loads tracked vehicle traffic or fuel spillshyage is required (Anderton 1996) The cost of an RMP is typically about 50 to 80 percent higher than a comparable HMA pavement but about 30 to 60 percent less than a comparable PCC paveshyment design (Anderton 1996)
To evaluate the performance of RMP the MDOT constructed a series of test sections under the TEshy30 program on US 72 in Corinth (see Figure 68) in 2001 These test sections were constructed at
Jackson
72
Jackson
55
20
Mississippi 1 US 72 Corinth
7272
Figure 68 Location of MS 1 project
98
two HMA pavement intersections on US 72 that have a history of rutting and high traffic loading For comshyparison purposes an alternative pavement was conshystructed at each intersection adjacent to the RMP but in the opposite traffic direction One of the alternative pavements was an ultrathin whitetopping (UTW) deshysign the other was a polymer-modified HMA paveshyment
Study Objectives
The objective of this project is to construct a demonshystration RMP highway project and compare its pershyformance to that of a UTW overlay and a polymer-modified HMA overlay
Project Design and Layout
The construction of this experimental project took place from April to June of 2001 A total of four test sections were constructed at two different intersecshytions on US 72 in Corinth
bull Intersection of US 72 and Hinton Street South Parkway and Liddon Lake Road
ndash RMP in eastbound lanes
ndash UTW overlay in westbound lanes
bull Intersection of US 72 and Cass Street
ndash RMP in eastbound lanes
ndash Polymer-modified HMA overlay in westbound lanes
Figure 69 shows the layout of the test sections at the intersection of US 72 and Hinton Street South Parkshyway and Liddon Lake Road while Figure 70 shows the layout of the test sections at the intersection of US 72 and Cass Street
The existing HMA pavement varied in thickness from 250 to 350 mm (10 to 14 in) and was exhibitshying rutting typically between 25 and 38 mm (1 and 15 in) This portion of US 72 carried approximately 22600 vehicles per day in 2000 (including about 10 percent heavy trucks) The projected cumulative
KESALs in one direction for 20-year design life are 11257 and 7257 for rigid and flexible paveshyments respectively
At both intersection locations the RMP was conshystructed 50 mm (2 in) thick The existing HMA pavement was first milled to a depth of 50 mm (2 in) after which a 50-mm (2-in) lift of open-graded HMA (PG 67-22) was placed The cement grout containing a resin additive PL-7 was applied to the open-graded HMA the following day
A 5000 lbfin2 air-entrained concrete mix containshying fibrillated polypropylene fibers was utilized for the UTW that was placed at the intersection of US 72 and Hinton Street The existing HMA pavement was first milled to a depth of 75 mm (3 in) The 75-mm (3-in) UTW was then placed with green sawing of the slabs conducted using
South Parkway
US 72 WB
US 72 WB
Soff-Cut saws The UTW was sawed into 09-m (3-ft) square slabs
The polymer-modified HMA overlay was placed at the US 72 and Cass Street intersection The existing HMA pavement was first milled to a depth of 100 mm (4 in) The polymer-modified HMA with a 125 mm (05 in) nominal maximum aggregate size (NMAS) and a PG 82-22 asphalt binder was then placed in two 50-mm (2-in) lifts
The excess milling of the existing pavement during the construction increased the unit costs of UTM and RMP sections The unit cost of RMP sections was further increased by the removal of a portion of the sections due to the lack of full-depth grout penetrashytion The estimated and actual unit costs for these overlay treatments are shown in Figure 71
Lidden Lake Road
474 ft
3 in ultrathin whitetopping 3 ft Χ 3 ft panels
2 in resin-modified pavement
310 ft
US 72 EB
US 72 EB
Hinton Street
Figure 69 Layout of test sections at the intersection of US 72 and Hinton Street South Parkway and Liddon Lake Road
99
Cass Street
450 ft
4 in hot mix asphalt PG 82-22
2 in resin-modified pavement
US 72 WB
US 72 WB
US 72 EB
US 72 EB
290 ft
Hinton Street
Figure 70 Layout of test sections at the intersection of US 72 and Cass Street
3 UTW 2 RMP 4 HMA
Test Section
Figure 71 Relative unit costs of the test sections
0
5
10
15
20
25
30
35
40
Uni
t Cos
t ($
sqy
d) Estimated
Actual
100
AT HINTON
State Monitoring Activities
Construction Monitoring During the construction of test sections several incidents were observed by the researchers that might affect long-term pavement performance These are summarized below (Battey 2002)
bull After the inside lanes of both RMP secshytions were constructed the temperature in Corinth dropped to 32 oF during the night The severe cold slowed down the curing of the grout to such an extent that it apshypeared to be ldquopowdering uprdquo on the surshyface However the next day as the temshyperature warmed up the powdering condition was not evident and the grout appeared to be gaining strength
bull During the construction of the right lane of the HMA section 10 vehicles drove on the fresh asphalt mat before the breakshydown roller could begin compacting the section The rutting due to the early traffic averaged 22 mm (009 in) in the left wheelpath and 1 mm (004 in) in the right wheelpath
Performance Monitoring MDOT will monitor the performance of these test sections for a period of 5 years Performance data collected include Profile Index (PI) International
Roughness Index (IRI) and skid number Rutting data are also being collected for the HMA section
Preliminary ResultsFindings
Some preliminary performance data collected under the monitoring program are summarized in Table 37 (andashd) The monitoring of the construction and pershyformance of these test sections has led to the followshying conclusions and recommendations (Battey 2002)
bull Table 37 indicates that the smoothness of the UTW test section is less than satisfactory suggesting the need for smoothness incentive provisions
bull In the construction of RMP the gradation of the open-graded asphalt mix must be careshyfully controlled to ensure the target 30 pershycent air void level is obtained Sufficient curshying time (no less than 72 hours of above 50 oF temperature) should be provided for the grout to obtain its design compressive strength
bull The initial skid resistance of the RMP secshytions is less than satisfactory However as traffic begins to wear the top film of grout off the sections the skid numbers begin to imshyprove to more acceptable levels
Table 37(a) International Roughness Index (IRI) Measured on the MS 1 Test Sections (mmkm)
DATE ULTRATHIN
WHITETOPPING RESIN-MODIFIED PAVEMENT
AT CASS HOT MIX ASPHALT
April 2001 542 204 236
July 2001 475 178 212 141
August 2001 454 176 201 132
IRI was collected in the right wheelpath using MDOTrsquos ARRB Transport Research Walking Profiler IRI is the average IRI of both wheelpaths collected using MDOTrsquos High Speed ldquoSouth Dakota Typerdquo Profiler
101
DATE
ULTRATHIN WHITETOPPING
RESIN-MODIFIED PAVEMENT AT CASS AT HINTON
HOT MIX ASPHALT
PI 02 PI 00 PI 02 PI 00 PI 02 PI 00 PI 02 PI 00
April 2001 10003 14828 1142 278 2353 5921
June 2001 1603 3524
DATE ULTRATHIN
WHITETOPPING RESIN-MODIFIED PAVEMENT
AT CASS AT HINTON HOT MIX ASPHALT
April 2001 368
May 2001 332 244 234
July 2001 333 298 318 358
August 2001 378 371 380 369
December 2001 442 387 394 349
RUTTING (IN) DATE LEFT WHEELPATH RIGHT WHEELPATH
July 2001 009 004
December 2001 013 008
Table 37(b) Profile Index Measured on the MS 1 Test Sections (inmi)
PI was collected in the right wheelpath using a ldquoCalifornia Typerdquo Profilograph and analyzed with both 0 and 02 in blanking bands
Table 37(c) Friction Numbers Measured on the MS 1 Test Sections
Skid resistance tests were conducted in the outside lane of each section with a test speed of 40 mihr
Table 37(d) Rutting Measured in the MS 1 HMA Test Section (in)
Point of Contact
Randy Battey Mississippi Department of Transportation P O Box 1850 Jackson MS 39215-1850 (601) 359-7648
References
Anderton G L 1996 Userrsquos Guide Resin Modi-fied Pavement Miscellaneous Paper GL-96-7 US Army Center for Public Works Alexandria VA
Battey R L 2002 Construction Testing and Preliminary Performance Report on the Resin Modified Pavement Demonstration Project Work Order Document Work Order DTFH71-99shyTE030-MS-12 (State Study No 137) Mississippi Department of Transportation Jackson
Mississippi Department of Transportation (MDOT) 1999 High Performance Concrete Pavement Work Order Document Work Order DTFH71-99-TE30-MS-12 (State Study No 137) Mississippi Department of Transportation Jackshyson
102
70
44
29
Missouri 1I 29 SB Rock Port
70
44
29
Chapter 25 MISSOURI 1 (I-29 Rock Port)
Introduction
As part of the TE-30 program the Missouri Deshypartment of Transportation (MoDOT) constructed an experimental unbonded concrete overlay in 1998 Located in the southbound lanes of I-29 just west of Rock Port (see Figure 72) the overlay includes test sections of conventional unbonded overlays steel fiber-reinforced overlays and polyolefin fiber-reinforced overlays all with varyshying thicknesses (MoDOT 2000)
- Jefferson City
Kansas City
Rock Port
70
44
29
Missouri 1 I-29 SB Rock Port Jefferson City
Kansas City
Rock Port
Figure 72 Location of MO 1 project
Study Objectives
The overall objective of this study is to compare the performance of fiber-reinforced unbonded concrete overlays to that of conventional unshybonded concrete overlays (MoDOT 2000) The addition of the fibers to the concrete mix is exshypected to increase the service life of the overlay by increasing the ldquotoughnessrdquo and post-cracking behavior of the concrete (Mindess and Young 1981) Toughness is defined as the total energy required to break a specimen and the addition of fibers gives concrete a considerable amount of apparent ductility before ultimate failure of the specimen (Mindess and Young 1981)
Project Design and Layout
This project constructed in 1998 consists of eight test sections each 762 m (2500 ft) long (MoDOT 2000) Of the eight test sections three sections
incorporate steel fibers in the concrete mix three secshytions incorporate polyolefin fibers in the mix and two sections use a conventional concrete mixture The layout of these test sections is illustrated in Figshyure 73 (MoDOT 2000)
All of the test sections are unbonded concrete overshylays placed over an existing 229-mm (9-in) jointed reinforced concrete pavement (JRCP) that has 187-m (615-ft) transverse joint spacing (MoDOT 2000) A 25-mm (1-in) asphaltic interlayer treated with white curing compound was used to isolate the concrete overshylays from the underlying pavement (MoDOT 2000)
Based on a laboratory evaluation of fiber-reinforced mixes conducted by the DOT and on the recommenshydations of the fiber manufacturers two fibers were selected for the I-29 project (MoDOT 2000)
bull 50-mm (2-in) 3M polyolefin fibers The fishybers are straight with an aspect ratio (lengthdiameter) of 79 and were applied at a dosage rate of 148 kgm3 (25 lbyd3)
bull 60-mm (24-in) Dramix steel fibers These fibers have hooked ends to promote bonding an aspect ratio of 75 and were applied at a dosage rate of 445 kgm3 (75 lbyd3)
Each of the fiber-reinforced sections are differentishyated by slab thickness with thicknesses of 229 mm (9 in) 152 mm (6 in) and 127 mm (5 in) included in the study Furthermore within each fiber-reinforced test section four subsections with variable joint spacshyings (46 m [15 ft] 91 m [30 ft] 183 m [60 ft] and 61 m [200 ft]) are also included The two control secshytions for the project are a 229-mm (9-in) unbonded JPCP with 46-m (15-ft) transverse joints and a 279shymm (11-in) unbonded JPCP with 46-m (15-ft) transshyverse joints The experimental design matrix for the project is provided in Table 38
Paraffin-treated epoxy-coated steel dowel bars were included in all test sections The 279-mm (11-in) test section contained 38-mm (15-in) diameter bars whereas the rest of the test sections contained 32-mm (125-in) diameter bars Transverse joints were sealed with a hot-poured elastic sealant
103
Figure 73 Layout of MO 1 test sections (MoDOT 2000)
Table 38 Experimental Design Matrix for MO 1
UNBONDED OVERLAY PORTLAND CONCRETE CEMENT
CONVENTIONAL Steel Fiber Polyolefin Fiber
5 in Slab Thickness
15-ft Joint Spacing Section 7 Section 8
30-ft Joint Spacing Section 7 Section 8
60-ft Joint Spacing Section 7 Section 8
200-ft Joint Spacing Section 7 Section 8
6 in Slab Thickness
15-ft Joint Spacing Section 6 Section 5
30-ft Joint Spacing Section 6 Section 5
60-ft Joint Spacing Section 6 Section 5
200-ft Joint Spacing Section 6 Section 5
9 in Slab Thickness
15-ft Joint Spacing Section 1 Section 2 Section 3
30-ft Joint Spacing Section 2 Section 3
60-ft Joint Spacing Section 2 Section 3
200-ft Joint Spacing Section 2 Section 3
11 in Slab Thickness 15-ft Joint Spacing Section 4
104
State Monitoring Activities
MoDOT is monitoring the performance of these sections annually for a minimum of 5 years with additional monitoring thereafter conducted as apshypropriate Data collection activities include paveshyment distress surveys roughness measurements surface friction testing and FWD testing
During construction the properties of the materishyals were monitored The fiber-reinforced concrete overlay mix had a wc of 039 and utilized a limeshystone coarse aggregate with a 13 mm (05 in) top size (MoDOT 2000) Nonuniform distribution of the fibers was observed particularly for the polyshyolefin fibers (MoDOT 2000) Mixing times were increased batch sizes were decreased and the order of mixer loading was altered to address this concern and these seemed to increase the unishyformity of the fiber distribution in the concrete (MoDOT 2000)
Initial finishing of the overlays used a burlap drag but this was later changed to an unweighted carpet drag because it was found that the fibers became caught in the burlap such that some fibers and agshygregate were pulled from the top layer of the overshylay (MoDOT 2000) In lieu of the conventional transverse tining texturing method the final surshyface texture was established by diamond grinding the overlay 21 days after construction for smoothshyness and rideability (MoDOT 2000) Following
grinding profilograph readings averaged less than 017 mkm (11 inmi) (0 blanking band) resulting in a smoothness bonus for the contractor (MoDOT 2000)
The in-place construction costs for these paveshyment sections are shown in Figure 74 (MoDOT 2000) This figure shows that the initial cost of the fiber-reinforced sections is higher than the cost of the conventional sections (the cost of furnishing the steel fiber concrete and the polyolefin fiber concrete was $5622 and $7177 more per m2 [$47 and $60 more per yd2] respectively than the conshyventional concrete)
Preliminary ResultsFindings
Preliminary resultsfindings are based on the first 2 years of performance monitoring of these test sections After nearly 2 years of service the overshyall performance of these sections was good alshythough a few of the sections performed poorly (MoDOT 2000) In particular the thin 127-mm (5-in) sections both steel and polyolefin reinshyforced exhibited a large amount of transverse cracking In addition the 152-mm (6-in) steel fiber-reinforced section also showed significant transverse cracking Figure 75 summarizes the cracking data collected up to 1999 on these test sections (MoDOT 2000)
Relative Cost of Test Sections
$000
$20000000
$40000000
$60000000
$80000000
$100000000 Cost per mile - 38 width
9 9 9 11 6 6 5 5 Plain Steel Poly Plain Poly Steel Steel Poly TS 1 TS 2 TS 3 TS 4 TS 5 TS 6 TS 7 TS 8
Figure 74 Relative cost of MO 1 test sections (MoDOT 2000)
105
Most of the transverse cracks that had developed were not located above joints or cracks in the exshyisting pavement so they did not appear to be reshyflective cracks (MoDOT 2000) In fact most of the cracks on the thin steel fiber-reinforced secshytions were parallel to and located within 03 m (1 ft) of the transverse joints whereas the cracks in the thin polyolefin fiber-reinforced sections were located away from the joints near mid-panel (MoDOT 2000) Because of the problems of the cracking and subsequent spalling the test sections 7 and 8 were replaced with full-depth concrete in 2000
Four general conclusions are drawn from the pershyformance data collected up to 1999 (MoDOT 2000)
bull The steel fiber-reinforced test sections exhibited more transverse cracking than the polyolefin fishyber-reinforced test sections
bull The longer panels exhibited more cracking than the short panels
bull The thinner overlay sections exhibited more cracking than the thicker sections
bull Cracks that had developed in the steel fiber-reinforced test sections were tighter than those in the polyolefin fiber-reinforced test sections (3 mm [012 in] vs 6 mm [025 in])
0
2
4
6
8
10
12
Feet
of
Cra
ckin
gP
anel
9 in Plain - TS 1
9 in Steel - TS 2
9 in Poly - TS 3
11 in Plain - TS 4
6 in Poly - TS 5
6 in Steel - TS 6
5 in Steel - TS 7
5 in Poly - TS 8
July
-98
Sep
tem
bershy
98
Nov
embe
rshy98
Janu
ary-
99
Mar
ch-9
9
May
-99
July
-99
Approximate Date of Survey
Figure 75 Transverse cracking on MO 1 test sections (MoDOT 2000)
Interim ResultsFindings
Although no formal reports have been developed since the 2000 summary MoDOT has provided additional performance data for inclusion in this report (Chojnacki 2004) Cracking surveys were conducted in December 2003 on these test secshytions and the results are shown in Figure 76 (Choshyjnacki 2004) These data have been combined with the previous data to produce Figure 77
In 2003 joint repairs were performed at several locashytions where transverse cracks existed near joints and spalling had occurred The deteriorated areas were replaced with a full-lane-width concrete patch at least 18 m (6 ft) long The patches were tied at one end with 19-mm (075-in) epoxy-coated tie bars and doweled at the other end with 19-mm (075-in) epshyoxy-coated dowel bars (Chojnacki 2004)
106
000
200
400
600
800
1000
1200
1400
1600
Cra
ck L
engt
h (ft
pan
el)
Transverse Longitudinal
1 2 3 4 5 6
Section
Figure 76 Transverse and longitudinal cracking on MO 1 test sections (Chojnacki 2004)
Transverse Cracking by Entire Test Section
14
0
2
4
6
8
10
12
Jul-98 Nov-99 Mar-01 Aug-02 Dec-03
Approximate Date of Survey
Feet
of C
rack
ing
Pane
l
9 in Plain - T S1
9 in St eel - T S2
9 in Poly - T S3
11 in Plain - T S4
6 in Poly - T S5
6 in St eel - T S6
5 in St eel - T S7
5 in Poly - T S8
Figure 77 Transverse cracking on MO 1 test sections
Point of Contact
Tim Chojnacki Missouri Department of Transportation 1617 Missouri Boulevard PO Box 270 Jefferson City MO 65102 (573) 751-1040 TimothyChojnackimodotmogov
References
Chojnacki T 2004 Performance Data from MO1 Test Sections Missouri Department of Transportashytion Jefferson City
Mindess S and J F Young 1981 Concrete Pren-tice-Hall Inc Englewood Cliffs NJ
Missouri Department of Transportation (MoDOT) 2000 Test SectionsmdashUnbonded Concrete Overlay Internal Technical Summary Missouri Department of Transportation Jefferson City
107
Chapter 26 NEW HAMPSHIRE HPCP PROJECT
Introduction
Under the TE-30 program the University of New Hampshire in conjunction with the New Hampshyshire Department of Transportation developed definitions of and showcase presentations for high-performance concrete in both bridge and pavement applications A CD-ROM was produced containing the definitions as well as the presentashytion materials and accompanying speaker notes (Goodspeed 1999) On the pavement applications side a demonstration computer program allowing the optimization of several concrete pavement variables was also developed
Study Objectives
The objectives of this project include the develshyopment of performance classifications for high-performance concrete pavement (HPCP) the disshysemination of information on HPCP through sevshyeral showcase presentations and the development of computer program that develops optimized pavement designs based on performance and varishyable constraints
ResultsFindings
HPCP Definitions To aid in the development of high-performance concrete pavement designs three HPCP classifications were developed These classifications provide recommended values or ranges for different slab base and subgrade properties and also maximum limits on various pavement performance parameters The concept is that pavements subjected to higher traffic loadings or designed for longer service lives require stronger more durable materials and more stringent performance requirements Table 39 summarizes the recommended performance characteristics for three different HPCP classifications (Goodspeed 1999) It is noted that some of the performance characteristics are not defined and also that the criteria for several of the design characteristics (eg permeability and
ability and friction number) are not compatible with the selected performance classification
Optimization Computer Program The High Performance Concrete Pavement Optishymization Program is available for use by State highway agencies (Goodspeed 1999) The comshyputer program allows for one or more key design variables to be selected for optimization subject to certain constraints Generally slab thickness is the design variable that will be optimized although other design variables such as joint spacing or PCC compressive strength can also be selected for optimization
When optimizing acceptable ranges must be enshytered for each variable being optimized Furthershymore a cost equation must also be defined for each variable being optimized The cost equation relates the cost of the variable to the design of the pavement system Several default cost equations are provided for key variables but users may also define their own unique cost equations (Goodspeed 1999)
Constraint parameters for various performance indicators must also be defined These are genershyally equations that link the different design varishyables to pavement performance Again several default constraint parameters are contained in the program (for example the 1993 AASHTO design procedure [AASHTO 1993] and the 1998 AASHTO Supplement [AASHTO 1998]) but users may define their own unique performance equations (Goodspeed 1999)
After defining the optimization variables and the constraint parameters the user runs the optimizashytion program to obtain the cost result and the valshyues associated for each optimization variable A summary report window is generated that summashyrizes the selected constraint equations the optimishyzation variable limits the parameters the cost equation results and the optimized variable reshysults (Goodspeed 1999)
108
RECOMMENDED RANGE OR VALUE
DESIGN CHARACTERISTICS PERFORMANCE
CLASSIFICATION 1 PERFORMANCE
CLASSIFICATION 2 PERFORMANCE
CLASSIFICATION 3
System Parameters ESAL applications millions 50ndash150 gt 150
Maximum bearing stress lbfin2 2 4 6
Limiting IRI rating 15 175
Limiting faulting inmi 20 15 10
Limiting transverse cracksmi 30 20
Design life years 20 30 gt 40
Design reliability 75ndash85 85ndash95
Terminal serviceability index 250 30
PCC Slab Materials Modulus of rupture lbfin2 500ndash650 650ndash700 gt 700
Elastic modulus lbfin2 25ndash50 50ndash100 gt 100
Freeze-thaw (ASTM C666) 60ndash80 gt 80
Scaling (ASTM C672) x = 4 5 x = 2 3 x = 0 1
Abrasion (ASTM C944-90a) 1ndash2 05ndash1 lt 05
Permeability (ASTM C1202) coulombs 1000 2000 3000
Coarse aggregate (AASHTO M80-87) class D C B
Fine aggregate (AASHTO M6-93) class B A
Slab Constructibility Fast track hours to 3000 lbfin2 lt 24 lt 18 lt 12
Slab Performance Mean friction number (ASTM E 274) 40ndash50 35ndash40 30ndash35
Initial smoothness (profilograph) inmi 9 7 6
Texture (ASTM E965) in 013 013ndash025 025ndash030
Joint Materials Rubberized asphalt (ASTM D1190 D3405) 15ndash20 20ndash30 gt 30
Low-Modulus RA (ASTM D3405) 30ndash40 40ndash50 gt 50
Nonself-leveling silicone (ASTM D3893) 30ndash40 40ndash50 gt 50
Self-leveling silicone (ASTM D3893) 30ndash40 40ndash50 gt 50
Preformed compression seal (ASTM D2628) 45ndash65 65ndash85 gt 85
Joint Constructibility Load transfer coefficient J 30ndash32 28ndash30 lt 28
Joint Performance Joint faulting in lt 013 lt 010
Base Materials Liquid limit (AASHTO T89) 25ndash28 28ndash32 gt 32
Plastic limit (AASHTO T90) lt 10 lt 20
Abrasion (ASTM C131) 50 max
Drainage coefficient Cd 09ndash11 11ndash12 gt 12
Stabilized base k-value lbfin2in 100ndash200 200ndash300 gt 300
Subgrade k-value lbfin2in 100 150ndash200 200ndash250
Subgrade CBR 60ndash70 70ndash80 gt 80
Base Constructibility In-place recycling lt 10 lt 20 lt 30
Speed ftday lt 500 lt 1500 lt 3000
Base Performance Erosion resistance (CTB) 3ndash5 5ndash7 7ndash8
Friction coefficient f 09ndash12 12ndash20 gt 20
Table 39 Summary of Design Characteristics for HPCP Classifications (Goodspeed 1999)
109
Program Availability The software program is currently available and free upon request The software can be requested from either the New Hampshire Technology Transfer (T2) Center or the Florida T2 Center
Charles Goodspeed University of New Hampshire Kingsbury Hall Room 236 Durham NH 03824 (603) 862-1443 chgicisunxunhedu
Gib Peaslee University of Florida Civil Engineering Department Transportation Research Center PO Box 116585 512 Wiel Hall Gainesville FL 32611-6585 (352) 392-2371 ext 245 gibceufledu
Point of Contact
Charles H Goodspeed University of New Hampshire Kingsbury Hall Room 236 Durham NH 03824 (603) 862-1443 chgicisunxunhedu
References
American Association of State Highway and Transshyportation Officials (AASHTO) 1993 Guide for De-sign of Pavement Structures American Association of State Highway and Transportation Officials Washington DC
mdashmdashmdash 1998 Supplement to the Guide for Design of Pavement Structures American Association of State Highway and Transportation Officials Washington DC
Goodspeed C H 1999 High Performance Concrete for Bridge and Pavement Applications CD-ROM (with HPCP definitions presentation files and comshyputer program) Durham NH
110
71
70
Ohio 1 2 and 3US 50 Athens
77
71
70
77
Chapter 27 OHIO 1 2 AND 3 (US Route 50 Athens)
Introduction
Under the TE-30 program the Ohio Department of Transportation (ODOT) constructed three experishymental pavement projects on US 50 approximately 8 km (5 mi) east of the city of Athens (see Figure 78) The projects incorporate a variety of experishymental design features including high-performance concrete mixtures utilizing ground granulated blast furnace slag (GGBFS) (OH 1) alternative dowel bar materials (OH 2) and alternative joint sealing materials (OH 3) (Ioannides et al 1999 Sargand 2000 Hawkins et al 2000) Although each project was funded separately under the TE-30 program they are all located on the same section of roadway and share many of the same design and construction attributes as well as the same traffic and environshymental loadings therefore these projects are all described together in this chapter
50
Columbus
Athens
71
70
5050
Ohio 1 2 and 3 US 50 Athens
Columbus
Athens
77
Figure 78 Location of OH 1 2 and 3 projects
Study Objectives
The study objectives for the overall US 50 paveshyment project may be broken out by each specific study For OH 1 the evaluation of GGBFS the primary objective is to evaluate the effectiveness of GGBFS as a partial cement replacement in PCC pavements The expectation of adding GGBFS to a concrete mix is the achievement of increased
workability increased durability and increased long-term strength
For OH 2 the evaluation of alternative dowel bar materials the general purposes of the study are to evaluate dowel response under a variety of loading and environmental conditions and to compare the measured responses of different types of dowel bars (Sargand 2000) Specific objectives include the folshylowing (Sargand 2000)
bull Instrument standard steel and fiberglass dowels for the monitoring of strain induced by curing changing environmental condishytions and applied dynamic forces
bull Record strain measurements periodically over time to determine forces induced in the dowel bars during curing and during changing environmental conditions
bull Record strain measurements in the dowel bars as dynamic loads are applied with the FWD
bull Evaluate strain histories recorded for the in-service pavement
For OH 3 the evaluation of joint sealing materials the objectives are to (Ioannides et al 1999)
bull Assess the effectiveness of a variety of joint sealing practices employed after the initial sawing of joints and to examine their reshypercussions in terms of reduced construcshytion times and life cycle costs
bull Identify those materials and procedures that are most cost effective
bull Determine the effect of joint sealing techshyniques on pavement performance
Project Design and Layout
General Design Information The US 50 project is a 105-km (65-mi) segment of highway that was reconstructed and expanded to a new four-lane divided facility The eastbound lanes
111
of the project were constructed in the fall of 1997 and the westbound lanes were constructed in the fall of 1998 (Ioannides et al 1999)
The 20-year design traffic loading for this pavement is approximately 11 million ESAL applications The subgrade over the project site is predominantly a silty clay material (Ioannides et al 1999)
The cross-sectional design for the projects is a 254shymm (10-in) JRCP placed over a 102-mm (4-in) open-graded base course The open-graded base course in the eastbound direction is a ldquoNew Jerseyrdquo type nonstabilized base whereas the open-graded base course in the westbound direction is a ldquoIowardquo type nonstabilized base (Ioannides et al 1999) A 152-mm (6-in) crushed aggregate subbase is loshycated beneath the open-graded bases and is topped with a bituminous prime coat to prevent migration of fines into the open-graded layers (Ioannides et al 1999) Table 40 provides the actual project gradashytions for these materials A 102-mm (4-in) under-drain was placed at both the outside and inside edges of the pavement to collect infiltrated moisture from the open-graded bases (Ioannides et al 1999)
The slabs are reinforced with smooth welded wire fabric (WWF) to control random cracking (Sargand 2000) Wire style designation W85 x W4mdash6x12 was specified meaning that the longitudinal wires
have a cross sectional area of 548 mm2 (0085 in2) and are spaced 152 mm (6 in) apart and the transshyverse wires have a cross-sectional area of 258 mm2
(004 in2) and are spaced 305 mm (12 in) apart This style designation translates to a longitudinal steel content of 014 percent
The transverse joints are spaced at fixed 64-m (21shyft) intervals and contain 38-mm (15-in) diameter 457-mm (18-in) long epoxy-coated dowel bars on 305-mm (12-in) centers (Sargand 2000) However some of the joints within the alternative dowel bar project contain either fiberglass dowels or stainless steel tubes filled with concrete (Sargand 2000) Transverse joints were sealed with a preformed compression sealant except for the joints within the joint sealant project The longitudinal centerline joint is tied with 16-mm (062-in) diameter 760shymm (30-in) long deformed bars spaced at 760-mm (30-in) intervals (Ioannides et al 1999)
Plain concrete shoulders were paved separately from the mainline pavement These were tied to the mainline pavement using 16-mm (062-in) diameshyter 76-mm (30-in) long deformed tie bars The outside shoulder is 3 m (10 ft) wide and the inside shoulder is 12 m (4 ft) wide (Ioannides 1999)
Table 40 Comparison of Actual Base and Subbase Gradations Used on Ohio US 50 Project
TOTAL PERCENT PASSING
SIEVE SIZE NEW JERSEY OPEN-GRADED
BASE (EB) IOWA OPEN-GRADED
BASE (WB) CRUSHED AGGREGATE
SUBBASE (EBWB)
2 in 100
1frac12 in 100
1 in 100
8 12 30 25
16 6 19 18
30 4 15 14
40 4 12 13
50 4 9 12
100 3 6 10
200 32 56 98
112
US 50 WB
OH 1 GGBFS Study104+40 to 436+00
Both Directions
OH 1 Control Section (No GGBFS in mix) 92+3425 to 104+40
US 50 EB
Project Layout Information As described previously the US 50 project actually includes three projects one evaluating GGBFS one evaluating alternative dowel bar materials and one evaluating joint sealant materials In addition a conshytrol section that does not contain GGBFS is located at the western end of the project The general layout of these projects is shown in Figure 79 More deshytailed information on each project is provided in the following sections
OH 1 Evaluation of Ground Granulated Blast Furnace Slag
The entire 105-km (65-mi) length of the US 50 project was constructed using a high-performance concrete mix consisting of a Type I cement with GGBFS replacing 25 percent of the cement (Sarshygand 2000) An AASHTO 8 gravel (013 mm [05 in] top size) was used for the coarse aggreshygate and a natural sand was used for the fine agshygregate (Sargand 2000) A wc of 044 was used in the mix design The complete PCC mix design is shown in Table 41
Begin Project STA92+3425
OH 3 Joint Seal Study 133+60 to
231+00
Begin Project STA 92+3425
OH 3 Joint Seal Study 133+60 to
231+00
US 50 WB
Samples from the concrete mix used in the actual paving operation were tested in the laboratory and showed a 28-day compressive strength of 276 MPa (4000 lbfin2) and a 28-day modulus of rupture of 276 MPa (400 lbfin2) (Sargand 2000) The 28-day static modulus of elasticity was 2592 GPa (3760000 lbfin2) (Sargand 2000)
As previously mentioned a control pavement section that does not contain GGBFS in the concrete mix is located at the western end of the project between stations 92+354 and 104+40 Other than the mix deshysign the design of the control section is the same as the GGBFS section
OH 2 Evaluation of Alternative Dowel Bars
Three types of dowel bars were used in the dowel bar project epoxy-coated steel dowel bars fiberglass dowel bars (manufactured by RJD Industries Inc) and stainless steel (type 304) tubes filled with conshycrete The diameter of the steel and fiberglass dowels bars is 38 mm (15 in) while the stainless steel tubes have an outer diameter of 38 mm (15 in) and an inshyner diameter of 34 mm (135 in) (Sargand 2000) All bars are 457 mm (18 in) long
OH 3 JOH 3 Jooint Sint Seal Seal Sttudyudy 260260++000 t0 too 2290+0090+00
End Project STA436+00
End Project STA 436+00
OH 3 Joint SealStudy
154+00 to 231+00 OH 3 Joint Seal Study260+00 to 290+00
OH 2 Dowel Bar Study
104+40 to 154+00
OH 3 Joint Seal Study
154+00 to 231+00 OH 3 Joint Seal Study 260+00 to 290+00
OH 2 Dowel Bar Study
104+40 to 154+00
US 50 EB
OH 1 Control Section (No GGBFS in mix) 92+3425 to 104+40
OH 1 GGBFS Study 104+40 to 436+00
Both Directions
Figure 79 Layout of experimental projects on Ohio US 50
113
762 mm(30 in)
198 m(78 n)
366 m(12 ft)
152 m(60 in)137 m
(54 in)
229 mm (9 in)
640 m(21 ft)
Thermocouples
Table 41 Concrete Pavement Mix Design Used on Ohio US 50 Project
PCC MIX DESIGN COMPONENT QUANTITY
Natural Sand 1437 lbyd3
AASHTO 8 Aggregate 1374 lbyd3
Type I Cement 412 lbyd3
Water 236 lbyd3
Ground granulated blast furnace slag 138 lbyd3
Water Reducer 11 ozyd3
Air Entraining Agent 165 ozyd3
Design Air 8
Design Slump 3 in
Most of the US 50 project contains conventional epoxy-coated steel dowel bars However three
specific test sections each incorporating one of the load transfer devices under study were set up near the western-most limits of the project in the eastbound direction to instrument dowel response and to compare the performance of the different load transfer devices Each test section is made up of six consecutive joints with the middle two joints containing instrumented dowel bars (see Figure 80) The concrete-filled stainless steel bars were not instrumented because the thin wall thickness did not permit the necessary installation operation to protect the lead wires of the gauges (Sargand 2001)
Three dowel bars within each joint are instrushymented The instrumented bars are located at disshytances of 152 mm (6 in) 762 mm (30 in) and 1980 mm (78 in) from the outside edge of the pavement as shown in Figure 81 (Sargand 2000)
DoDowel Test Sectiowel Test Sectionn (6(6 jointsjoints for efor eaach dch doowel twel tyyppee))
21 ft
Traffic
Traffic
21 ft
Traffic
Traffic
InInstrustrummentented Joed Jointsints
Figure 80 Layout of dowel test sections on Ohio US 50 project
TrTraaffffiicc FlowFlow
366 m (12 ft)
Dowel 1Dowel 1
Dowel 2
Dowel 3
InstrumentedDowels
Dowel 2
Dowel 3
152 mm (6 in)
i
Thermocouples
508 mm (20 in)
Joint 1 Joint 2
Dowel 1Dowel 1
Dowel 2
Dowel 3
Instrumented Dowels
Dowel 2
Dowel 3
152 mm (6 in)
762 mm (30 in)
198 m (78 in)
Thermocouples
152 m (60 in)137 m
(54 in)
229 mm (9 in)
508 mm (20 in)
Joint 1 Joint 2
640 m (21 ft)
Thermocouples
Figure 81 Dowel instrumentation layout for Ohio US 50 project (Sargand 2000)
114
Each instrumented dowel bar contained a uniaxial strain gauge on the top and the bottom of the bar and one 45-degree rosette on the side The uniaxshyial gauges measure environmental and dynamic strains while the rosette gauges measure only dyshynamic strains (Sargand 2000)
Two thermocouple units were also installed near each instrumented joint to measure temperatures in the concrete slab One unit housed three sensors that measure temperatures at depths of 102 178 and 254 mm (4 7 and 10 in) from the surface and the second unit consists of a single sensor measuring temperatures at a depth of 25 mm (1 in) below the surface (Sargand 2000)
OH 3 Evaluation of Joint Sealing Materials
The joint sealant test sections are located in both the eastbound and westbound directions and feashyture a total of nine different joint sealants In addishytion several pavement sections containing no sealant are included in the study
Table 42 summarizes the location of the different sealant materials in each direction as well as the joint channel configuration (see Figure 82) used for each material (Hawkins Ioannides and Minkarah 2000) The westbound sections each represent replicate sealant sections of those in the eastbound lanes with the exception of the Watson Bowman WB-687 in the eastbound lanes which was replicated using the Watson Bowman WBshy812 in the westbound lanes (Ioannides et al 1999) The eastbound lanes were sealed in Octoshyber and November of 1997 whereas the westshybound lanes were sealed in December 1998 (silishycone and compression seals) and April 1999 (hotshypoured sealants) (Ioannides et al 1999)
State Monitoring Activities
The Ohio DOT in conjunction with researchers from several State universities monitored the pershyformance of these pavements for 5 years Annual condition surveys and profile measurements were conducted along with special FWD testing on the instrumented joints In addition detailed joint sealant evaluations following SHRP procedures were performed annually on a selected samples of each sealant material
ResultsFindings
Overall pavement performance on this project has been mixed and may be related to the small top size of the coarse aggregate the small percentage of reinshyforcing steel and the poor support from the nonstashybilized bases Specific findings for each specific study are presented in the following sections
OH 1 Evaluation of Ground Granulated Blast Furnace Slag The final report by Sargand Edwards and Khoury (2002) provides the results for this study Several factors related to the performance of the HPC paveshyment containing 25 percent GGBFS have been evaluated with the following results
bull Temperature gradients generated between the top and bottom of concrete slabs during the cure period can have a significant impact on the development of early cracks HPC paveshyment sections placed in October 1997 experishyenced gradients of 10 oC and developed cracking within 18 hours of placement One HPC and one standard pavement section placed in October 1998 experienced gradients of only 5 oC and did not develop cracking The higher temperature gradient in 1997 reshysulted from a cold front that moved in shortly after the placement of the concrete
bull Large values of strain recorded with the vishybrating wire strain gauges and maturity measshyurements indicated that the HP 1 and HP 2 sections could be expected to crack as was observed in the field HP 3 constructed 1 year later of the same concrete mix but during a period of warmer weather did not develop cracks In this case both strain and maturity data collected in the field indicated a low probability of cracking
bull Results from HIPERPAV also suggested that sections HP 1 and HP 2 would crack while HP 3 would not Predicted strength curves were calculated for the placements in addishytion to those provided by the standard HIPERPAV prediction model
115
Table 42 Sealant Materials Used in Joint Sealant Study on Ohio US 50 Project (Hawkins Ioannides and Minkarah 2000)
JOINT SEALANT SEALANT BEGIN END CONFIGURA- SECTION NO OF MATERIAL TYPE STATION STATION TION LENGTH FT JOINTS
Eastbound Direction
TechStar W-050 Preformed 154+00 160+00 5 600 29
No Sealant mdash 160+00 166+00 6 600 29
Dow 890-SL Silicone 166+00 172+00 3 600 29
Crafco 444 Hot Pour 172+00 188+00 1 1600 76
Crafco 903-SL Silicone 188+00 194+00 1 600 29
Watson Bowman WB-687 Preformed 194+00 200+00 5 600 27
Crafco 902 Silicone Silicone 200+00 206+00 1 600 29
Crafco 903-SL Silicone 206+00 213+00 4 700 33
Dow 890-SL Silicone 213+00 219+00 4 600 29
No Sealant mdash 219+00 225+00 2 600 28
Delastic V-687 Preformed 225+00 231+00 5 600 29
Crafco 221 Hot Pour 260+00 266+00 1 600 29
Dow 890-SL Silicone 266+00 272+00 1 600 28
Dow 888 Silicone 272+00 284+00 1 1200 57
Dow 888 Silicone 284+00 290+00 1 600 29
Westbound Direction
TechStar W-050 Preformed 133+60 139+60 5 600 29
No Sealant mdash 139+60 166+00 2 2640 126
Dow 890-SL Silicone 166+00 172+00 3 600 29
Crafco 221 Hot Pour 172+00 188+00 1 1600 76
Crafco 903-SL Silicone 188+00 194+00 1 600 29
Crafco 903-SL Silicone 194+00 200+00 1 600 29
Dow 890-SL Silicone 200+00 206+00 1 600 28
Crafco 444 Hot Pour 206+00 213+00 1 700 33
Dow 888 Silicone 213+00 219+00 1 600 28
Delastic V-687 Preformed 219+00 225+00 5 600 29
Watson Bowman WB-812 Preformed 225+00 231+00 5 600 28
Dow 888 Silicone 260+00 266+00 1 600 29
Crafco 903-SL Silicone 266+00 272+00 4 600 28
Dow 890-SL Silicone 272+00 284+00 4 1200 57
No Sealant mdash 284+00 290+00 6 600 29
116
1 frac12 in
3 frac14 in
18 in
3 frac14 in 3 frac14 in 3 frac14 in
1 frac12 in
3 frac14 in
18 in
1 in
3 frac14 in
18 in
1 frac12 in
3 frac14 in
18 in
3 frac14 in 3 frac14 in 3 frac14 in
1 frac12 in
3 frac14 in
18 in
1 in
3 frac14 in
18 in
1 in
3 frac14 in
18 in
14 - 38 in
14 - 38 in
frac12 inBacker Rod
Detail 1
14 - 38 in
14 - 38 in
frac12 inBacker Rod
Detail 1
1 frac12 in
3 frac14 in
18 in
14 - 38 in
14 - 38 in
frac12 in Backer Rod
Detail 1
333888 plusmnplusmnplusmn 111161616 ininin
DDDDeeee Dtail 3tail 3tail 3tail 3 DDeeetail 5tail 5tail 5
111444 plusmnplusmnplusmn 111161616 ininin
111444 --- 333888 ininin
333161616 --- 555161616 ininin
111888 plusmnplusmnplusmn 111161616 ininin 111888 plusmnplusmnplusmn 111161616 ininin
3 frac14 in 3 frac14 in 3 frac14 in frac14 infrac14 infrac14 in
Backer RodBacker RodBacker Rod
14 plusmn 116 in
14 - 38 in
14 - 38 in
516 inBacker Rod
14 plusmn 116 in
14 - 38 in
14 - 38 in
516 inBacker Rod
14 plusmn 116 in
14 - 38 in
14 - 38 in
516 inBacker Rod
1 in
3 frac14 in
14 plusmn 116 in
14 - 38 in
14 - 38 in
516 in Backer Rod
18 in
38 plusmn 116 in
CompressionSeal
38 plusmn 116 in
CompressionSeal
1 frac12 in
3 frac14 in
18 in
38 plusmn 116 in
Compression Seal
DDDeeetail 2tail 2tail 2 DDDeeetail 4tail 4tail 4 DDDeeetail 6tail 6tail 6
Figure 82 Joint channel configurations used in sealant study on Ohio US 50 project (Hawkins Ioannides and Minkarah 2000)
bull Section HP 3 had less initial warping than did section SP (standard ODOT paving concrete) Sections HP 1 and 2 developed cracking precluding effective curling measurement of these slabs
Based on the laboratory results and field data obshytained in this study the following conclusions were derived (Sargand Edwards and Khoury 2002)
bull Temperature gradients generated between the surface and bottom of concrete slabs during the curing process can have a sigshynificant impact on the formation of early cracks
bull Section HP 3 had less initial warping than did section SP constructed with standard ODOT class C concrete
bull FWD data indicated that under similar loadshying conditions the HP 3 section experienced slightly less deflection at joints than the SP section
bull With limited data available it was suggested that the moisture in the base at sealed and unshysealed joints was similar In some cases however moisture under sealed conditions was observed to be slightly higher indicating that joint seals might trap moisture under the pavement
bull During FWD testing the deflection at sealed joints was generally higher than at unsealed joints
OH 2 Evaluation of Alternative Dowel Bars An analysis of the strains in both the fiberglass and steel dowel bars under environmental and dynamic
117
loading was conducted (ORITE 1998 Sargand evaluation of PCC pavement joints (Sargand 2001) 2000 Sargand 2001) Major findings from that Because of the high bearing stresses that can be gen-analysis include (Sargand 2000 Sargand 2001) erated in concrete surrounding dowel bars this pashy
bull In addition to transferring dynamic load across PCC pavement joints dowel bars serve as a mechanism to reduce the curlshying and warping of slabs due to curing and temperature and moisture gradients in the slabs
bull Steel and fiberglass dowels both experishyenced higher moments from environshymental factors than from dynamic loadshying The dynamic bending stresses induced by a 569 kN (12800 lb) load were considerably less than the environshymental bending stresses induced by a 3 oC (54 oF) temperature gradient
bull Steel bars induced greater environmental bending moments than fiberglass bars
bull Significant stresses were induced by steel dowel bars early in the life of this paveshyment as it cured late in the construction season under minimal temperature and thermal gradients in the slab Concrete pavements paved in the summer under more severe conditions may reveal even larger environmental stresses
bull Both types of dowels induced a permashynent bending moment in the PCC slabs during curing the magnitude of which is a function of bar stiffness
bull Curling and warping during the first few days after concrete placement can result in large bearing stresses being applied to the concrete around the dowels This stress may exceed the strength of the conshycrete at that early age and result in some permanent loss of contact around the bars
bull Steel bars transferred greater dynamic bending moments and vertical shear stresses across transverse joints than fishyberglass bars of the same size
Given these findings it is concluded that the efshyfects of environmental cycling and dynamic loadshying both must be included in the design and
rameter should be considered in dowel bar design especially during the first few days after placement of concrete (Sargand 2001)
It is noted that these results are based on the analysis of the instrumented steel and fiberglass dowel bars only The stainless steel tubes were not instrumented for the reason stated earlier
OH 3 Evaluation of Joint Sealing Materials The results from this experiment through the 2001 performance evaluation have resulted in several obshyservations (Ioannides et al 1999 Hawkins Ioanshynides and Minkarah 2000)
bull The silicone and hot-poured sealants in the eastbound lanes are in fair to poor condition typically suffering from full-depth adhesion failure
bull The worst of the sealed sections were those with a narrow joint width of 3 mm (012 in) In these installations the sealant material had overflowed and run onto the pavement surshyface
bull There is a significant difference in the pershyformance of the same joint seal materials from EB (constructed in 1997) and WB (conshystructed in 1998) This difference is attribshyuted to improvements in installation temperashytures experience and equipment
bull The joints in this experiment were cleaned only by water- and air-blasting even when the sealant manufacturers recommended sand blasting This suggests that some of the adheshysion loss may be due to an inadequate cleanshying process
bull Both the Watson Bowman and the Delastic compression seals have performed by far best overall in both directions In the WB direcshytion the silicones have performed best but were poor in the EB The performance of the hot pour materials is very different being far better in WB in general However the Crafco 221 material did relatively well in one EB test section The TechStar compression seal
118
however has developed significant adheshysion failure and has sunk into the joint
bull The compression seals have performed by far best overall in both directions In the WB direction the silicones have pershyformed best but were poor in the EB The performance of the hot pour materials is very different being far better in WB in general However the Crafco 221 mateshyrial did relatively well in one EB test secshytion
bull Hot pour material appears to have pershyformed better when installed within the manufacturers recommended temperature range No specific temperature range is recommended for the silicone materials
bull Roughness measurements made using PSI IRI and Mays meter do not provide any conclusive trends relating to paveshyment performance
bull Assessment of joint seal efficiency has little relationship to pavement condition at this time It is recommended to reseal the EB sites except for the two compression seals for continued performance monitoring
bull The Techstar W-050 material performed poorly in both directions and is considered unsuitable for pavement applications
bull Currently the unsealed sections seem to have more spalling corner and midslab cracking distress than others although there is no conshyclusive pavement performance related trends as yet
A summary of estimated joint sealant costs on this project is provided in Table 43 (Ioannides et al 1999) These costs are based solely on the material costs themselves and do not include the costs of backer rods adhesives or labor
Table 43 Summary of Sealant Costs on Ohio US 50 Project (Ioannides et al 1999)
MATERIAL UNIT COST ESTIMATED COSTJOINT
Dow 890-SL $4800gal $1227
Crafco 903-SL $3600gal $950
Dow 888 $4200gal $1074
Crafco 902 $3900gal $997
Crafco 444 $1050gal $268
Crafco 221 $025lb $064
Watson Bowman WB-812 $103ft $4326
Watson Bowman WB-687 $072ft $3024
Delastic V-687 $066ft $2772
TechStar V-050 $865ft $36330
119
Points of Contact
Roger Green Ohio Department of Transportation Office of Pavement Engineering 1980 West Broad Street Columbus OH 43223 (614) 995-5993
Anastasios Ioannides University of Cincinnati Department of Civil and Environmental Engineering 741 Baldwin Hall (ML-0071) PO Box 210071 Cincinnati OH 45221-0071 (513) 556-3137
Shad Sargand Ohio University Ohio Research Institute for Transportation and the Environment Department of Civil and Environmental Engineering Stocker Center Athens OH 45701 (740) 593-1467
References
Hawkins B K A M Ioannides and I A Minkarah 2000 To Seal or Not to Seal Con-struction of a Field Experiment to Resolve an Age-Old Dilemma Preprint Paper No 00-0552 79th Annual Meeting of the Transportation Reshysearch Board Washington DC
Ioannides A M I A Minkarah B K Hawkins and J Sander 1999 Ohio Route 50 Joint Sealant ExperimentmdashConstruction Report (Phases 1 and 2) and Performance to Date (1997ndash1999) Ohio Department of Transportation Columbus
Ohio Research Institute for Transportation and the Environment (ORITE) 1998 Measurement of Dowel Bar Response in Rigid Pavement ORITEshy1 Ohio Department of Transportation Columbus
Sargand S M 2000 Performance of Dowel Bars and Rigid Pavement Draft Final Report Ohio Department of Transportation Columbus
mdashmdashmdash 2001 Performance of Dowel Bars and Rigid Pavement Final Report Ohio Department of Transportation Columbus
Sargand S M W Edwards and I Khoury 2002 Application of High Performance Concrete in the Pavement System Structural Response of High Performance Concrete Pavement Final Report Ohio Department of Transportation Columbus
120
Chapter 28 Ohio 4 (US 35 Jamestown)
Introduction
The Ohio Research Institute for Transportation and the Environment at the Department of Civil Engineering at Ohio University in conjunction with the Ohio Department of Transportation have conducted extensive pavement research activities during the past decade As a part of the TE-30 program this study has undertaken a comparative evaluation of the available nondestructive test deshyvices for measuring the support of subgrade and aggregate base layers of pavement sections The study considers the means and results of data measurements of various testing devices includshying their application and ease of use The test secshytion selected for this project is located on US 35 in Jamestown Ohio (see Figure 83)
Figure 83 Location of OH 4 project
Study Objectives
Variability in pavement support resulting from variations in subgrade and base layer support valshyues result in significant variation in pavement pershyformance Deficiencies relative to design assumpshytions result in reduced pavement performance Conventional laboratory testing has not been efshyfective in capturing field variation The use of nondestructive testing methods to assess paveshyment conditions and to predict pavement performshyance depends upon the quality and reliability of the data obtained
The principal objective of the study is to measure the structural characteristics of the subgrade and base layers on a section of US 35 with various
NDT devices during construction and compare the output from the devices in the context of assessing structural conditions and variability Nondestructive testing was performed using a nuclear density gauge the Humboldt Stiffness Gauge the German plate load device a falling weight deflectometer and a dynamic cone penetrometer
Project Design and Layout
A 6096-m (2000-ft) test section was selected in the eastbound lanes of a 85-km (53-mi) construction project on US 35 in Jamestown Ohio The test locashytion was judged to have relatively uniform topogshyraphical and subsurface soil conditions The paveshyment consists of a four-lane divided highway with two 36-m (12-ft) lanes a 3-m (10-ft) outside shoulshyder and a 18-m (6-ft) inside shoulder The pavement cross section consists of 2286-mm (9-in) JRCP a 1016-mm (4-in) unstabilized drainable base and a 1524-mm (6-in) dense-graded aggregate base all over a prepared subgrade
Subgrade samples were collected and identified as silty clay (AASHTO Classification A-6) with a liquid limit of 228 percent a plastic limit of 167 percent and a plasticity index of 61 percent Laboratory resilshyient modulus tests were conducted in accordance with SHRP Protocol P-46
State Monitoring Activities
Initial moisture and density data were collected along the centerline and right wheelpath of the eastbound driving lane at 152-m (50-ft) intervals with a nuclear density gauge Other nondestructive testing was also typically conducted at intervals of 152 m (50 ft) exshycept for the German plate load test whose testing frequency was increased to 305 (100 ft) because of the time required to conduct each test
Laboratory resilient modulus testing was performed on material samples from the project materials to provide a comparison of results Tests were pershyformed at several confining pressure levels including 207 345 689 1034 and 1379 kPa (3 5 10 15 and 20 lbfin2) The moisture content of the materials is also known to affect the results
121
ResultsFindings
Overall results indicated that each device has a useful function in evaluating subgrade and base uniformity conditions The laboratory resilient modulus test is limited to materials sampled at specific designated locations Additionally the results are very much a function of test conditions The level of confining pressure used during the testing was found to have an effect on the comshyputed modulus values as described by Sargand Edwards and Salimath (2001)
The nuclear density gauge is limited to a layer thickness measurement of 3048 mm (12 in) and greatly affected by nonuniformity within the layshyers tested It is a quick means of controlling the uniformity of material density during construcshytion The density measurements recorded can be correlated with material stiffness
The DCP is a quick automated field test method for evaluating the in situ stiffness of layers in a highway pavement structure It measures the strength and stiffness of subgrade and unstabilized base layers The DCPrsquos ability to penetrate into underlying layers and accurately locate zones of
weakness represent its greatest advantage over other tests considered The automated device includes software for storing and reporting the collected data
The Humboldt Gauge measures stiffness of the upper 1524 mm (6 in) of material by electrical impedance In this respect it is quite different from the other NDT devices considered in this study as the other devices measure the composite response of the upper layer measured and any supporting layers beneath The Humboldt gauge was considered effective for monitoring the integrity of individual material layers as they are being placed
The remaining devices identified significant paveshyment support variation along the length of the test Because the Humboldt Gauge only measures to a depth of 1524 mm (6 in) its variation represented is much smaller than that indicated by the other devices Both stiffness and calculated moduli values were evaluated for each device with sample results proshyvided in Table 44
The large load FWD represented 29483- to 40823shykg (6500- to 9000-lb) loads while the small load repshyresented 15876- to 20412-kg (3500- to 4500-lb) loads
Table 44 Stiffness and Modulus Sample Results from OH 4 Testing
Nondestructive Test Stiffness lbfin Modulus lbfin2
Subgrade (15 stations)
Humboldt Gauge 88758 18750
FWD Large load 249703 22610
FWD Small load 210785 19090
1st Cycle
German Plate 131889 11960
2nd Cycle
153795 13930
Composite Base (16 stations)
Humboldt Gauge 129730 27410
FWD Large load 252747 36220
FWD Small load 257114 40970
1st Cycle
German Plate 67793 16870
2nd Cycle
206533 44500
FWD = falling weight deflectometer
122
The FWD and the German plate load test are conshysidered effective for measuring the total composshyite stiffness of the in situ pavement structures Comparisons of the devices and the Humboldt Gauge are difficult since each generates load difshyferently to a different depth and uses different equations to convert surface deflections to layer modulus The dynamic loading applied by the FWD typically results in higher material stiffness than static loads used in the German plate test The Humboldt Gauge produces small excitations which limits its depth of effectiveness
Points of Contact
Roger Green Ohio Department of Transportation Office of Pavement Engineering 1980 West Broad Street Columbus OH 43223 (614) 995-5993
Shad Sargand Ohio University Ohio Research Institute for Transportation and the Environment Department of Civil and Environmental Engineering Stocker Center Athens OH 45701 (740) 593-1467
The FWD has a definite advantage over the plate load testing because of its speed of testing The plate load test is much more labor intensive and requires more test time at a single location The DCP is considered useful for identifying and locating the cause(s) of low stiffness identified with FWD results which will likely cause premature failure within a pavement structure
Reference
Sargand S M W F Edwards and S Salimath 2001 Evaluation of Soil Stiffness Via Non-destructive Testing Final Report Ohio Department of Transportashytion Columbus
123
Chapter 29 PENNSYLVANIA 1 (SR 22 Murrysville)
Introduction
Pennsylvaniarsquos first project to be funded in part under the TE-30 program will be on Section B01 on SR 22 in Murrysville just east of Pittsburgh (see Figure 84) This project is unique in that is a cooperative effort with the public (Pennsylvania Department of Transportation [PENNDOT] and FHWA) and private sector (Mascaro Construcshytion) as well as academia (University of Pittsshyburgh) The project will be constructed in the fall of 2004
Figure 84 Location of PA 1 project
Study Objectives
One of the primary objectives for this project is to evaluate HIPERPAV a computer program that can be used to evaluate the early-age behavior of concrete pavements This study will evaluate the ability of HIPERPAV to predict strength gain and to model early-age stress development Other obshyjectives of particular interest to PENNDOT inshyclude addressing needs for the new mechanistic-empirical pavement design guide Six additional objectives will be addressed in this study
1 Characterize thermal gradients throughout the pavement structure
2 Characterize moisture gradients throughshyout the pavement structure
3 Quantify construction curling and seashysonal and diurnal curling
4 Develop suitable strength correlations
5 Monitor slab performance over time
6 Characterize slab response to environmental and applied loads
Project Design and Layout
Four test cells will be constructed on a four-lane dishyvided highway The project layout is provided in Figshyure 84 and a summary of the design features for each cell is provided in Table 45
The types of instrumentation to be installed on this pavement project include the following
bull Environmental Sensors o Moisture gauges o Thermocouples o Time domain reflectometers
bull Static Sensors o Static strain gauges o Static pressure cells
bull Dynamic Sensors o Dynamic Strain gauges o Dynamic pressure cells
Environmental and static data collection will be automated and collected every 15 minutes Dynamic data will be collected manually All data will be stored in a database housed at the University of Pittsshyburgh
State Monitoring Activities
The test sections will be monitored seasonally by the University of Pittsburgh This will include making Dipstick measurements performing distress surveys and collecting dynamic strain data from various truck types weights and axle configurations Ride data and FWD testing will be performed by PENNDOT Seashysonal monitoring will be performed for 4 years
Preliminary ResultsFindings
No preliminary results are available
124
Table 45 Design Features for the PA 1 Project
DESIGN FEATURE CELL 1 CELL 2 CELL 3 CELL 4
Pavement type JPCP JPCP JPCP JPCP
Tie bars Yes No No Yes
Dowel bars 125 in No No 125 in
Slab thickness 12 in 12 in 12 in 12 in
Base type Asphalt treated Asphalt treated Asphalt treated Asphalt treated
Lane width 12 ft 12 ft 12 ft 12 ft
Dynamic sensors Yes Yes No No
Static and environmental sensors No No Yes Yes
Point of Contact
Julie M Vandenbossche University of Pittsburgh 934 Benedum Hall 3700 Ohara St Pittsburgh PA 15261 (412) 624-9879 jmvengrpittedu
125
90 29
South Dakota 1US 83 Pierre
90 29
Chapter 30 SOUTH DAKOTA 1 (US Route 83 Pierre)
Introduction
In the early 1990s the South Dakota Department of Transportation (SDDOT) investigated the use of non-metallic fiber reinforced concrete (NMFRC) on several small bridge and highway applications (Ramakrishnan 1995 Ramakrishnan 1997) Although the NMFRC performed well in each application a strong need for additional inshyformation on the design construction and pershyformance of NMFRC pavements was identified Thus this project located on US 83 northeast of Pierre (see Figure 85) was constructed in 1996 under the TE-30 program to allow on a larger scale the evaluation of NMFRC pavements with different slab thicknesses joint spacings and the need for transverse joint load transfer (Ramashykrishnan and Tolmare 1998)
83
Pierre
83
90 29
8383
South Dakota 1 US 83 Pierre
Pierre
8383
Figure 85 Location of SD 1 project
Study Objectives
In order to more fully assess the suitability of NMFRC in full-depth concrete this project
was constructed to accomplish the following objecshytives (Ramakrishnan and Tolmare 1998)
bull Develop NMFRC full-depth pavement deshysigns that will enhance PCC pavement pershyformance including appropriate slab thickshynesses joint load transfer designs and joint spacings
bull Evaluate the constructibility and performance of NMFRC full-depth pavement
bull Evaluate the economic impacts of using NMFRC full-depth pavement
Project Design and Layout
This project was constructed in 1996 on US 83 northshyeast of Pierre between mileage reference markers (MRMs) 144 and 145 (Ramakrishnan and Tolmare 1998) The new pavement is a two-lane roadway (each lane 43 m [14 ft] wide) and was constructed on an existing gravel base course Eight different test sections are included in the project one control secshytion and seven non-metallic fiber reinforced concrete pavement (NMFRCP) sections Figure 86 illustrates the layout of the test sections and Table 46 summashyrizes the design features of the test sections Table 47 presents the experimental design matrix for the proshyject
The NMFRCP sections used polyolefin fibers manushyfactured by the 3M company These fibers are purshyported to provide mechanical improvements to the concrete and are also non-corrodible and resistant to chemicals (Ramakrishnan and Tolmare 1998) The NMFRCP mix design used in this project is shown in Table 48 (Ramakrishnan and Tolmare 1998)
126
225500 fftt 224455 fftt 550000 fftt 11000000 fftt 449900 ftft 550000 ftft 449900 fftt 11229900 fftt
SBSB14 ft14 ft LaneLane
BB FFAA CC DD EE HHGG NB14 ft14 ft NB
LaneLane
SSeeccttion Aion A SSeeccttion Cion C SeSection Ection E SeSection Gction G SeSection Hction H 8 in8 in JJPPCPCP 665 i5 inn NNMMFRFRCPCP 8 in8 in NMNMFRCPFRCP 88 in NMin NMFRCPFRCP 88 iinn NMNMFRCPFRCP
DoDowweeleled Jod Jointsints NoNo DDoowweellss DoDowweeleled Jod Jointsints NoNo DoDowweelsls No DoNo Dowweelsls 2020 fftt JJooiinntt SpSpaciacinngg 3535 fftt JoJointint SpSpacingacing 3535 fftt JoJointint SpSpacingacing NNoo JJooiinntsts3535 fftt JJooiinntt SpSpacaciningg
SeSection Bction B SeSectctioionn DD SeSection Fction F 88 iinn NMNMFRCPFRCP6655 in NMin NMFRCPFRCP 88 iinn NMNMFRCPFRCP
NoNo DowDoweelsls DowDoweelleedd JoJoininttss No DoNo Dowweelsls 2525 fftt JoJointint SpaSpaccinging 2525 fftt JoJointint SpaSpaccinging2525 fftt JoJoinintt SSppaaccinging
Figure 86 Layout of SD 1 test sections (Ramakrishnan and Tolmare 1998)
Table 46 Design Features of SD 1 Test Sections (Ramakrishnan and Tolmare 1998)
TEST SECTION
LENGTH FT
THICKNESS IN
JOINT SPACING FT
VOLUME OF FIBERCONCRETE YD3 TYPE DOWELED
A 1000 JPCP 80 Yes 20 0
B 250 FRCP (25 lbyd3) 65 No 25 173
C 245 FRCP (25 lbyd3) 65 No 35 170
D 500 FRCP (25 lbyd3) 80 Yes 25 346
E 490 FRCP (25 lbyd3) 80 Yes 35 339
F 500 FRCP (25 lbyd3) 80 No 25 346
G 490 FRCP (25 lbyd3) 80 No 35 339
H 1290 FRCP (25 lbyd )3 80 No None 892
Table 47 Experimental Design Matrix for SD 1
JPCP NMFRCP
Doweled Nondoweled Doweled Nondoweled
20 ft Joints
25 ft Joints Section B65-in Slab
35 ft Joints Section C
No Joints
20 ft Joints Section A
25 ft Joints Section D Section F 8-in Slab
35 ft Joints Section E Section G
No Joints Section H
127
Table 48 NMFRCP Mix Design Used in SD 1 Project (Ramakrishnan and Tolmare 1998)
MIX COMPONENT QUANTITY
Cement (Type II) 510 lbyd3
Fly ash (Type F) 112 lbyd3
Water 264 lbyd3
Limestone coarse aggregate 1417 lbyd3
Fine aggregate 1417 lbyd3
Polyolefin fibers 25 lbyd3
Slump 1ndash2 in
Air content 6 + 15 percent
Preliminary ResultsFindings
The monitoring of the design construction and early performance of these pavement sections had led to the following conclusions regarding the use of NMFRC pavements (Ramakrishnan and Tolshymare 1998)
bull The same construction techniques and construction equipment can be used in the batching and placement of fiber-reinforced concrete pavements The only modification needed in the batching procshyess is the addition of a plastic tube to fashycilitate the introduction of the fibers However some additional mixing time may be required for NMFRC pavements
bull No differences in the riding quality of the pavement sections could be established All of the pavement sections met the smoothness criteria for new pavement construction
bull During the construction of these test secshytions both cylinders and beams were cast for later laboratory testing A comparison of the flexural strengths for beams cast from concrete used on different days of
paving is shown in Figure 87 these are the average of three beam breaks for each of the following specimens
ndash ldquoP1rdquo indicates specimens collected from the northbound NMFRC paving operashytions on August 15 1996
ndash ldquoP2rdquo indicates specimens collected from a portion of the southbound NMFRC paving operations on August 26 1996
ndash ldquoP3rdquo indicates specimens collected from the rest of the southbound NMFRC pavshying operations on August 27 1996
ndash ldquoControlrdquo indicates specimens collected from the northbound control section paved on August 15 1996
The strengths of the NMFRC specimens are observed to be greater than that of the control section although on average the percent inshycrease is only about 20 percent However other laboratory tests of toughness impact fatigue endurance limit and post-crack load carrying capacity suggested that the strucshytural properties of the fiber-modified conshycrete had been improved
128
o After about 3 years of service condition surveys of the paveshyment sections revealed that transshyverse cracks had occurred only in the section without joints (section H) These cracks occurred at apshyproximately 26-m (85-ft) intershyvals No other distresses were noted within the pavement secshytions
bull Data from FWD testing showed that the load transfer was less in the NMFRC pavement sections compared to the conshytrol section (see Figure 88) In general the load transfer was less in sections with longer joint spacings thinner slabs or nondoweled joints The longer joint spacshyings of the nondoweled NMFRC paveshyments reduce the effectiveness of the agshygregate interlock at the joints even though they contain fibers This suggests that the doweling recommendations for
Fle
xura
l S
trength
psi
8 0 0
7 0 0
6 0 0
5 0 0
4 0 0
3 0 0
2 0 0
1 0 0
0
bull conventional PCC pavements also apply to fiber reinforced concrete pavements Unforshytunately direct comparisons of load transfer could not be made between the control secshytion and the NMFRC sections because joint spacing was not held constant in the experishymental design
bull The initial cost of the 203-mm (8-in) JPCP was $1836m2 ($1535yd2) whereas the inishytial cost of the 203-mm (8-in) NMFRC was $3457m2 ($2890yd2) (both based on an 85-m [28-ft] wide pavement) A life cycle cost analysis of both designs showed that the conventional design was 61 and 31 percent cheaper than the NMFRC design for analysis periods of 40 and 60 years respectively Nevertheless there may be special design situations in which longer joint spacings thinner slabs or more efficient performance may dictate the use of NMFRC pavements
7 - D a y
2 8 - D a y
P 1 P 2 P 3 C o n t r o l
S p e c im e n D e s ig n a t io n
Figure 87 Summary of flexural strength tests for SD 1 (Ramakrishnan and Tolmare 1998)
129
0
1 0
2 0
3 0
4 0
5 0
6 0
7 0
8 0
9 0
1 0 0
Load T
ransf
er
Effic
iency
S e c t io n S e c t io n S e c t io n S e c t io n S e c t io n S e c t io n S e c t io n S e c t io n
A B C D E F G H
S e c t io n
Figure 88 Load transfer efficiencies for SD 1 sections
Interim ResultsFindings
Distress surveys conducted on these test sections in February 2004 revealed no apparent distress of any kind except for the uncontrolled transverse cracks in section H (Johnston and Huft 2004) The uncontrolled transverse cracks showed no faultshying spalling etc and remained narrow The entire pavement section was uniform in appearance and in good condition (Johnston amp Huft 2004)
Points of Contact
Dave Huft South Dakota Department of Transportation 700 East Broadway Avenue Pierre SD 57501-2586 (605) 773-3292 DaveHuftstatesdus
Venkataswamy Ramakrishnan Department of Civil and Environmental Engineering SD School of Mines and Technology 501 E St Joseph Street Rapid City SD 57701-3995 (605) 394-2403
References
Johnston D and D Huft 2004 Distress Survey Results of the Non-Metallic Fiber Reinforced Concrete Pavement Test Sections on US 83 Eshymail communication from South Dakota Department of Transportation Pierre
Ramakrishnan V 1995 Evaluation of Non-Metallic Fiber Reinforced Concrete in PCC Pavements and Structures Report No SD94-04-I South Dakota Department of Transportation Pishyerre
mdashmdashmdash 1997 Demonstration of Polyolefin Fiber Reinforced Concrete in Bridge Replacement Reshyport No 5095-22 South Dakota Department of Transportation Pierre
Ramakrishnan V and N S Tolmare 1998 Evaluation of Non-Metallic Fiber Reinforced Concrete in New Full Depth PCC Pavements Reshyport No SD96-15-F South Dakota Department of Transportation Pierre
130
Chapter 31 TENNESSEE 1 (I-65 Nashville)
Introduction
Over the past decade significant progress has been made in the development of performance-related specifications (PRS) for the acceptance of newly constructed jointed plain concrete paveshyment (JPCP) A PRS is able to relate the construcshytion acceptance quality characteristics (AQCs) (eg smoothness thickness strength air content and percent consolidation around dowels) to the levels of expected pavement performance and fushyture life cycle costs (LCCs) thus providing the basis for rational acceptance and price adjustment decisions The PRS methodology has been verishyfied through the use of shadow specifications on actual construction projects
In this study the Tennessee Department of Transshyportation (TDOT) is implementing PRS on a field trail basis under a FHWA contract Should the implementation of PRS in this project be successshyful TDOT would be able to use PRS in more proshyjects without outside assistance and would be able to achieve the full benefits of PRS
Study Objectives
The main objective of this project is to evaluate the practicality and effectiveness of PRS for JPCP based on a real-world field trial in Tennessee The long-term benefits of PRS expected to be derived from this project include (Gharaibeh 2003)
bull Better linkage between design and conshystruction
bull Higher quality pavements (through incenshytives)
bull Testing that focuses on key quality charshyacteristics that relate to the pavementrsquos long-term performance
bull Incentives and disincentives that are justishyfied through reductions or increases in life cycle costs
bull Specifications that give contractors more flexibility responsibility and accountability
bull Incentive to contractors to be more innovashytive and more competitive
bull Lower ldquofear factorrdquo for contractors and less administrative complexity for the agency than warrantees
Project Design and Layout
TDOT provided the following candidate projects for the implementation of PRS (Gharaibeh 2003)
bull I-65 north of Nashville This project is ongoshying and consists of widening a 56-km (35shymi) long roadway from 6 to 10 lanes with the existing concrete pavement to be reconshystructed Paving is expected to take place in March or April 2004
bull I-75 north of Chattanooga and I-65 north of Nashville These projects are expected to be let in December 2004 However paving could take place 2 to 3 years after letting
After a project coordination meeting it was recomshymended to TDOT that the most practical option is to implement PRS on a portion of the ongoing I-65 proshyject
State Monitoring Activities
No final decisions have been made regarding the State monitoring activities
Preliminary ResultsFindings
Acceptance test results from three concrete pavement projects that were constructed in Tennessee in the past 5 years were obtained and analyzed The project-wide results are summarized in Table 49 These reshysults will assist in establishing the target values (mean and standard deviation) for the PRS project considering the quality levels achieved in these past projects (Gharaibeh 2003)
131
Point of Contact
Sam Tyson Federal Highway Administration Office of Infrastructure Office of Pavement Technology (HIPT) 400 7th Street SW Washington DC 20590 (202) 366-1326
Reference
Gharaibeh N G 2003 Performance-Related Speci-fications (PRS) Field Trial in Tennessee Quarterly Progress Report to the Federal Highway Administrashytion
Table 49 Summary of Past Concrete Pavement Projects in Tennessee
ATTRIBUTE PROJECT 1 PROJECT 2 PROJECT 3
Tennessee Department of Transportation Identification
SP 33003-4154-04 (Contract No
4359)
IM-40-2(71)87 57001-8172-44
(Contract No 4559)
NH-I-75-1(95)3 33005-3161-44
(Contract No 5356)
Location I-24 Hamilton County
I-40 Madison and Henderson Counties
I-75 Hamilton County
Approximate length mi 276 802 32
Project period 1997-2000 1997 1999-2001
28-day compressive strength lbfin2
Field average 6432 5247 6046
Field standard deviation 892 315 625
Specifications Min 3000 Min 3000 Min 3000
Thickness in
Field average NA NA 1204
Field standard deviation NA NA 011
Specifications NA NA 1200
Air content
Field Average 546 511 514
Field standard deviation 051 011 044
Specifications 3-8 3-8 3-8
PI inmi
Field Average 255 NA 253
Field standard deviation 088 NA 071
Specifications 5 NA 4
132
81
64
64
95
81
64
64
95
Chapter 32 VIRGINIA 1 (I-64 Newport News)
Introduction
Concrete pavements constructed in Virginia over 20 years ago commonly incorporated a 50-mm (2-in) maximum coarse aggregate size in the PCC mix design (Ozyildirim 2000) These pavements genershyally performed well but over time concerns with the availability stockpiling and segregation of the aggregate led to a reduction in the specified maxishymum coarse aggregate size (Ozyildirim 2000) However while smaller coarse aggregate size is inherently more durable concrete using smaller coarse aggregate commonly exhibits greater shrinkshyage (and increased potential for slab cracking) beshycause of increased paste requirements Larger maximum coarse aggregate sizes on the other hand require less paste less cementitious material and less water thereby resulting in reduced shrinkage they also provide increased mechanical interlock at joints and cracks (Ozyildirim 2000)
To investigate the effect of maximum coarse aggreshygate on concrete material properties and pavement performance the Virginia Department of Transporshytation (VDOT) constructed an experimental conshycrete pavement project as part of the TE-30 proshygram The project is located on I-64 near Newport News (see Figure 89) and was constructed in 1998 and 1999 (Ozyildirim 2000)
Virginia 1I-64 Newport News
NewportNews
Richmond
Virginia 1 I-64 Newport News
Newport News
81
64
Richmond64
95
Figure 89 Location of VA 1 project
Study Objectives
The objectives of this project are (Ozyildirim 2000)
bull To develop concrete mixtures that have low shrinkage and high flexural strength
bull To determine the properties of such conshycretes
bull To instrument and test jointed pavement slabs for volumetric changes
bull To determine the air void distribution (inshydicative of consolidation) from cores
Project Design and Layout
This project was constructed on I-64 in Newport News beginning about 24 km (15 mi) west of Route 143 and ending about 16 km (1 mi) east of Route 143 (Ozyildirim 2000) The project involved removing and replacing the two existing traffic lanes in both the eastbound and westbound direcshytions and constructing an additional lane in each direction (Ozyildirim 2000) The nominal pavement design used for these sections is as follows (Ozyshyildirim 2001)
bull 280-mm (11-in) JPCP
bull 75-mm (3-in) asphalt-stabilized open-graded drainage layer (OGDL)
bull 150-mm (6-in) cement-treated subbase
bull 46-m (15-ft) transverse joint spacing
bull Silicone sealant in all transverse joints
bull 32-mm (125-in) diameter epoxy-coated steel dowel bars (511 mm [18 in] long and spaced 300 mm [12 in] apart)
bull Widened slabs (43 m [14 ft]) in the outer traffic lane
133
646 f646 ftt 45450 f0 ftt 374374 fftt
14 f14 ftt
SectSectiioonn 1 W1 WBB SSectectiioonn 2 W2 WBB SectSectiioonn 3 W3 WBB12 f12 ftt
2-2-inin AggrAggregaegattee wwGGGGBBFFSS 1-1-in Ain Aggrggregategatee wwGGGGBBFFSS 1-1-inin AAggrggregategatee wwFFllyasyashh
12 f12 ftt
WesWesttboundbound (N(Noovveemmberber 11998)998) 447272 fftt 495 f495 ftt 515 f515 ftt
12 f12 ftt
SSectectiioonn 3 E3 E SBB Sectectiioon 1n 1 EBEB SSectectiioon 2n 2 EBEB12 f12 ftt
1-1-in Aggrin Aggregaegattee wwFFllyyaass 2-hh 2-inin AggrAggregegatatee wwGGGGBBFFSS 1-1-inin AggrAggregaegattee wwGGGGBBFFSS
14 f14 ftt
EaEastbound (Jstbound (Julyuly 19199999))
NomNomiinnaall PPaavveemmeentnt DDesiesiggnn (a(allll sectisectioonnss)) 11-in11-in JPJPCPCP
3-in3-in AAssphphaltalt OOGGDDLL 6-in6-in CCTTBB
1515-ft-ft JoJointint SSpacinpacingg 1125-i25-inn DoweDowelsls
Three experimental sections were constructed in the westbound lanes in November 1998 and then replishycated in the construction of the eastbound lanes in July 1999 (Ozyildirim 2000) Each of the three sections incorporated a different concrete mix design (Ozyshyildirim 2001)
bull Section 1 EBWBmdashconcrete mixture using a 50-mm (2-in) maximum coarse aggregate and including ground granulated blast furshynace slag (GGBFS)
bull Section 2 EBWBmdashconcrete mixture using a 25-mm (1-in) maximum coarse aggregate and including GGBFS
bull Section 3 EBWBmdashconcrete mixture using a 25-mm (1-in) maximum coarse aggregate and including Class F fly ash This section represents VDOTrsquos current conventional concrete mix design
Figure 90 illustrates the layout of these test secshytions while Table 50 summarizes the concrete mix design information The mix designs for sections 1 and 2 contain 30 percent slag whereas the mix deshysign for section 3 contains 25 percent fly ash The
coarse aggregate was a crushed biotite gneiss and granite whereas the fine aggregate was a natural sand (Ozyildirim 2001) The coarse aggregate used in section 1 was a blend of No 3 and No 57 aggreshygates (Ozyildirim 2001)
Comparing the mix design of section 1 (the larger aggregate) with the mix designs for the other two sections it is observed that the use of the larger agshygregate did slightly reduce the required quantities of water and cementitious materials (Ozyildirim 2000)
Dowel bars were placed in baskets at the predetershymined joint locations prior to the paving operations (Ozyildirim 2001) Transverse joints were cut inishytially 475 mm (019 in) wide to a depth of one-third of the slab thickness (Ozyildirim 2001) A secondary cut was made 2 weeks later to establish the joint reservoir for the silicone sealant
A water-based curing compound was used to cure the pavement except that the appropriate materials could not be obtained during the placement of the westbound lanes (Ozyildirim 2001) Consequently a white plastic sheeting was used to cure the paveshyment for 10 days (Ozyildirim 2001)
Figure 90 Layout of VA 1 test sections (Ozyildirim 2000)
134
MATERIAL SECTION 1
(SLAG MIX 2) SECTION 2
(SLAB MIX 1) SECTION 3 (FLY ASH)
Portland cement quantity lbyd3 (kgm3) 374 (222) 394 (234) 423 (251)
GGBFS quantity lbyd3 (kgm3) 160 (95) 169 (100) mdash
Class F fly ash quantity lbyd3 (kgm3) mdash mdash 142 (84)
Pozzolan quantity lbyd3 (kgm3) 30 percent 30 percent 25 percent
Course aggregate No 357 57 57
Maximum top size in (mm) 2 in (50 mm) 1 in (25 mm) 1 in (25 mm)
Course aggregate quantity lbyd3 (kgm3) 1935 (1148) 1841 (1092) 1841 (1092)
Fine aggregate quantity lbyd3 (kgm3) 1171 (695) 1217 (722) 1229 (729)
Water lbyd3 (kgm3) 243 (144) 249 (148) 249 (148)
Water-to-cementitious materials ratio (wcm) 045 044 044
Admixtures Air entraining agent + retarder
Air entraining agent + retarder
Air entraining agent + retarder
Table 50 Concrete Mix Designs Used in VA 1 Project (Ozyildirim 2000)
During construction one outside slab in each of the three sections in the westbound lanes was inshystrumented to record strains displacements and temperatures in the slab (Ozyildirim 2000) Two vibrating wire strain gauges were placed in the middle of each slab one 38 mm (15 in) from the top of the slab and one 38 mm (15 in) from the bottom of the slab (Ozyildirim 2000) Two addishytional vibrating wire strain gauges were tied to two stainless steel stakes and driven into the base (Ozyildirim 2001) The gauges were placed 2 m (65 ft) from the outside edge to avoid the vibrator of the paver (Ozyildirim 2001)
Two linear variable differential transformers (LVDTs) were installed in each of the slag conshycrete pavement sections to measure vertical disshyplacements due to curling (Ozyildirim 2001) One LVDT was placed at the center of the slab and the other 280 mm (11 in) from the joint (Ozyildirim 2001)
Type T thermocouples were placed at each locashytion in the slab where the vibrating gauges were placed The thermocouples were placed at 6 mm (025 in) 76 mm (3 in) 140 mm (55 in) 203 mm (8 in) and 273 mm (1075 in) above the base (Ozyildirim 2001) In addition the vibrating
wire gauges included thermistors that provide temshyperatures at the each location (Ozyildirim 2001)
Finally 10 consecutive joints in each section were instrumented to monitor transverse joint movements (Ozyildirim 2001) Gauges were placed on either side of the joints 1 week after paving (Ozyildirim 2001)
State Monitoring Activities
During and immediately after construction VDOT conducted an evaluation of the fresh and hardened concrete properties of each pavement section Table 51 summarizes some of the selected concrete propershyties obtained from the monitoring Both the fresh concrete properties and the hardened concrete propershyties generally met design requirements but there was a noticeable difference in the properties of the mixshytures between the westbound and eastbound lanes Generally speaking the westbound lanes had lower strengths and higher air contents than the eastbound lanes
Comparisons of the different mixes show that the slag mixes (sections 1 and 2) have higher strengths than the fly ash mixes Interestingly the section 2 mixes had higher strengths than the section 1 mixes even though the section 1 mixes had a larger coarse aggregate size
135
SECTION 1 (2-IN AGG WSLAG)
SECTION 2 (1-IN AGG WSLAG)
SECTION 3 (1 IN AGG WFLY ASH)
SPECIMEN SIZE IN CONCRETE PROPERTY EB WB EB WB EB WB
Fresh Concrete
Slump in
Air
Concrete temperature oF
Unit weight lbyd3
Hardened Concrete
28-day compressive strength lbf
28-day flexural strength lbfin2
Permeability coulombs
1-year shrinkage
Freeze-Thaw Data at 300 cycle
Weight loss
Durability rating
6 x 12
6 x 6 x 20
4 x 4
6 x 6 x 200
088
430
865
1456
5446
704
1364
0041
150
525
67
1442
4530
670
1774
0052
188
495
855
1470
5540
783
1548
0044
125
580
68
1456
4625
685
1672
0059
150
420
820
1476
4612
mdash
680
mdash
125
545
67
1438
3920
mdash
1265
mdash
in2
s (ASTM C 666 Procedure A except air dried 1 week and 2 NaCl in test solution)
53
69
40
91
23
88
60
89
116
82
141
83
The chloride ion permeability test measures the electrical conductance of a sample and VDOT specifies a maximum of 3500 coulombs (Ozyshyildirim 2001) All of the mixtures exhibit permeshyabilities much less than that value with the fly ash mixtures the lowest of all of the mixtures All of the sections exhibited similar shrinkage values with the section 1 mixture (containing the largest maximum coarse aggregate size) exhibiting the least amount of shrinkage
The acceptance criteria for freeze-thaw data shown in Table 51 are a weight loss of 7 percent or less and a durability factor of 60 or more (Ozyshyildirim 2001) All mixtures complied with these requirements except the fly ash mixtures exceeded the allowable weight loss However this is a seshyvere test and the fly ash mixtures are expected to
perform satisfactorily in the field provided that they have adequate strength and an adequate air void sysshytem (Ozyildirim 2001)
Monitoring of the instrumented slabs was conducted during the first several weeks after construction along with transverse joint movements Generally larger thermal gradients were observed for section 2 but all of the differences were really quite small (Ozyildirim 2001) Section 1 (larger aggregate) showed less curling than section 2 but again the difshyferences were small (Ozyildirim 2001) Limited FWD testing showed nearly identical load transfer efficiencies of 85 85 and 88 percent for section 1 2 and 3 respectively (Ozyildirim 2001)
Table 51 Summary of Concrete Properties Measured on VA 1 Project (Ozyildirim 2000)
136
After 2 years and 6 months of service respecshytively both the westbound sections and the eastshybound sections are in excellent condition with no distress or scaling (Ozyildirim 2001) VDOT will continue monitoring the performance of these pavements and will produce a final report in 2004 (Ozyildirim 2000)
Preliminary ResultsFindings
This project has illustrated that air-entrained pavshying concrete with satisfactory strength low pershymeability and volume stability can be prepared using concrete with Class F fly ash or slag and with 25- and 50-mm (1- and 2-in) maximum size aggregates (Ozyildirim 2000 Ozyildirim 2001) The larger maximum size aggregate is expected to provide better performance in the field and it will be monitored over the next 5 years Although the reduction in water and cement contents was minimal for the mix with the larger sized aggreshygate the use of a more uniform combined grading is expected to reduce water and paste demands (Ozyildirim 2000 Ozyildirim 2001) The instrushymentation did not provide any strong results reshygarding the relative performance of the different pavement sections (Ozyildirim 2000 Ozyildirim 2001)
Project Status
No interim field testing results have been published nor were they available for this update However an additional field evaluation will be conducted in the spring of 2004 that will include FWD and automated distress measurements Results of these field reviews will be included in the final project report that is slated to be complete in August 2004
Point of Contact
Celik Ozyildirim Virginia Transportation Research Council 530 Edgemont Road Charlottesville VA 22903 (434) 293-1977 celikvdotstatevaus
References
Ozyildirim C 2000 Evaluation of High-Performance Concrete Pavement in Newport News VA Draft Interim Report Virginia Transportation Research Council Charlottesville
mdashmdashmdash 2001 ldquoEvaluation of High-Performance Concrete Pavement in Newport News VArdquo Preprint Paper 01-3173 80th Annual Meeting of the Transshyportation Research Board Washington DC
137
Virginia 2Route 288Richmond
81
64
64
95
Virginia 3US 29
Madison Heights
81
64
64
95
Chapter 33 VIRGINIA 2 (Route 288 Richmond) and VIRGINIA 3 (US 29 Madison Heights)
Introduction
VDOT constructed two additional high-performance concrete pavements under the TE-30 program Virginia 2 is located on Route 288 near Richmond and Virginia 3 is located on US 29 near Madison Heights (see Figure 91) These pavements are both continuously reinforced concrete paveshyment (CRCP) designs that are incorporating conshycrete mixtures expected to provide high flexural strengths and low shrinkage
29
MadisonHeights
Richmond288
2929
Virginia 2 Route 288 Richmond
Madison Heights
81
64
Richmond64
95
Virginia 3 US 29
Madison Heights
288288
Figure 91 Location of VA 2 and VA 3 projects
Study Objectives
These two pavement projects share the following objectives
bull Develop concrete mixes that have low shrinkage and high flexural strength
bull Assess aggregate particle shape using a video grader
bull Determine the material properties of high performance concrete including compressive strength flexural strength elastic modulus coefficient of thermal expansion permeabilshyity and drying shrinkage
bull Continuously monitor the speed of the paver and the frequency of the vibrators during the construction of the pavement
bull Investigate the effect of longitudinal steel content on the development of cracking
Curing of the sections (curing compound vs burlap wet cure) may also be investigated as part of the investigation
Project Design and Layout
The project on Route 288 was paved in mid-December 2003 Samples and data were gathered during the construction The paving materials will be tested as per the AASHTO 2002 guidelines No speshycific information regarding the actual pavement conshystruction or the results from any followup testing is currently available
The Madison Heights project (located on US Route 29) has not yet been constructed consequently no information is currently available
State Monitoring Activities
Once these projects are constructed the State will monishytor the performance of the sections for 5 years
Preliminary ResultsFindings
No preliminary results or findings are available
Point of Contact
Celik Ozyildirim Virginia Transportation Research Council 530 Edgemont Road Charlottesville VA 22903 (434) 293-1977 celikvdotstatevaus
138
Chapter 34 Washington 1 (SR 395 Kennewick)
Introduction
Traditionally reconstruction of urban intersecshytions with portland cement concrete pavement (PCCP) requires several weeks and complex trafshyfic management plans However with accelerated paving construction techniques concrete can meet opening strengths in less than 12 hours providing quick public access to a high-quality long-lasting pavement In the fall of 2000 the Washington State Department of Transportation (WSDOT) reconstructed an asphalt concrete (AC) intersecshytion with PCC over a weekend in a 70-hour peshyriod The intersection is located at SR 395 and West Kennewick Avenue in the City of Kenneshywick Washington (see Figure 92) The successful completion of this project demonstrates that conshycrete can be used successfully for the rapid reconshystruction of urban intersections
Figure 92 Location of WA 1 project
Study Objectives
The goal of this project is to develop a body of knowledge and tools for accelerated reconstrucshytion of urban intersections using PCC To achieve this goal three classes of activities were investishygated methods to accelerate the rate of concrete strength gain methods to minimize the construcshytion time and traffic control strategies to minishymize user delay (Nemati et al 2003)
Project Design and Layout
Before reconstruction the HMA pavement exhibited severe rutting as much as 508 to 1016 mm (2 to 4 in) (Nemati et al 2003) Traffic volume passing through the intersection is as high as 30000 vpd inshycluding 20 percent heavy trucks (Nemati et al 2003) A 3-day weekend closure beginning on Thursday evening was adopted for the intersection reconstrucshytion Efforts were focused on the following aspects
Public Relations and Traffic Management Many individuals especially business owners in the affected areas were contacted personally by WSDOT personnel Pre-construction meetings were held with the City council and the public to encourage active involvement of all the affected parties The media was utilized to alert the public to the upcoming conshystruction and to keep them up to date on the schedule A multistaged traffic detour plan was implemented that provided local access access to commercial sites and special routes for heavy trucks passing through the area These activities were aimed at makshying the closures as organized and painless as possible for the public
Concrete Mixture Properties For this project the concrete mix design was critical in maintaining the accelerated schedule ASTM C 150 Type III portland cement was used to provide rapid strength gain Table 52 shows the concrete mix design used in this project while Table 53 shows the characteristics of the concrete delivered to the site (Nemati et al 2003) Figure 93 shows the strength-maturity relationship that was developed for the speshycific concrete mixture used in the intersection reconshystruction (Nemati et al 2003) According to WSDOT requirements a minimum concrete compressive strength of 172369 kPa (2500 lbfin2) must be achieved in order for the intersection to be opened to traffic Figure 93 indicates that this mixture is capashyble of reaching the opening strength approximately 8 hours after placement
139
Construction The contractor prepared and executed an hourly progress schedule during the intersection closure Figure 94 shows the contractorrsquos critical path method schedule (Nemati et al 2003) The apshyproach legs were rebuilt in the days prior to the complete intersection closure A rotomill was used to remove the existing pavement and base at the intersection to a depth of 3048 mm (12 in) which was accomplished in a single pass Conshycrete was placed in alternate sections and then the sides of the newly placed pavements acted as forms for the interim sections In this way a sigshynificant amount of time was saved by not erecting and removing side forms for the interim sections
In this project liquid curing compounds meeting ASTM C309 requirements were applied to the surshyface and exposed edges of the concrete pavement at a rate of one gallon per 139 m2 (150 ft2) The sawcutshyting at the intersection typically began within 6 hours of concrete placement After sawing the joints were sealed with a hot-poured asphaltic material Maturity meters were used in this project to monitor the strength gain in the concrete and determine the appropriate time for stripping forms and opening the pavement to traffic The intersection was opened to traffic on Sunday between 400 pm and 600 pm well ahead of the originally scheduled 600 am Monday morning opening
Table 52 Concrete Mix Design Used on WA 1 Project
MATERIAL TYPE QUANTITY
Cement (lbsyd3) ASTM C150 Type III 705
15 in 940
Aggregate (lbsyd3) 075 in 799
0375-in Pea Gravel 140
Sand (lbsyd3) Coarse
Fine
590
481
Water (lbsyd3) minus 254
Air-entraining admixture (ozyd3) ASTM C260 11
Water-reducing admixture (ozyd3) ASTM C494 303
Set-retarding admixture (ozyd3) ASTM C494 Delvo 176
Table 53 Characteristics of Concrete Used on WA 1
CHARACTERISTIC TEST RESULT
Slump
wc ratio
Air content
Unit weight
Concrete temperature
Air temperature
325 in
036
63 percent
1498 lbft3
85 degF
82 degF
140
WSDOT Strength Requirement for Opening to Traffic
1000
2000
3000
4000
5000
0 8 16 24 32 40 48 56 64 72 80
Time (Hours)
Com
pres
sive
Str
engt
h (p
si)
Figure 93 Strength-time relationship developed for WA 1 project
Figure 94 Contractorrsquos critical path method schedule for WA 1 project
141
Opening) 8 (Excavation) 5 (Grading)
Place Concrete)
ResultsFindings
The reconstruction of the intersection at SR 395 and Kennewick Avenue using accelerated construction techniques and complete weekend closure was completed successfully The intersection was opened to traffic 16 hours ahead of the scheduled opening time The breakdown of the time actually spent on each activity during the reconstruction is shown in Figure 95 (Nemati et al 2003) As a result of the traffic control and public relation manageshyment complaints from the public were reduced by over 70 percent compared to a project constructed 2 years before (Nemati et al 2003) The unit price for reconstruction of the intersection at SR 395 and Kennewick Avenue is 16826m2 ($1558ft2) (Nemati et al 2003)
Construction Activity 2 (Delay) 1 (Closing
4 (Prep For Roadway)
1 (Clean Roadway)
5 (Joint Seal) 1 (Conduit
5 (Clean Repair) Joints)
14 (Cure)
27 (Form amp
11 (Sawcutting)
Closing Roadway Excavation Grading Conduit Repair Form and Place Concrete Sawcutting Cure Clean Joints Joint Seal Clean Roadway Prep Roadway for Opening to Traffic Delay
Figure 95 Breakdown of time consumed by each construction activity on WA 1 project
Points of Contact
Kamran M Nemati University of Washington PO Box 95233 Seattle Washington 98145-2233 (206) 685-4439 nematiuwashingtonedu
Jeff S Uhlmeyer (360) 709-5485 UhlmeyJwsdotwagov
Linda M Pierce (360) 709-5470 PierceLwsdotwagov
Washington State Department of Transportation PO Box 47365 Olympia WA 98504-7365
Reference
Nemati K M J S Uhlmeyer L M Pierce and J R Powell 2003 Accelerated Construction of Ur-ban Intersections with Portland Cement Concrete Pavement (PCCP) Final Report Federal Highway Administration Washington DC
142
Chapter 35 WEST VIRGINIA 1
Introduction
As part of a comprehensive research program invesshytigating the use of glass fiber-reinforced plastic (GFRP) reinforcing bars in concrete pavements the West Virginia University initiated a research study consisting of three research elements (1) construcshytion and evaluation of GFRP-doweled pavement sections (2) investigation of moisture diffusion in GFRP dowels and (3) construction and evaluation of a CRCP pavement section containing GFRP re-bars The use of GFRP bars in lieu of steel bars is expected to alleviate the problems associated with steel corrosion and steel distress At the conclusion of the project a workshop and technology transfer initiative are scheduled to be held
Study Objectives
As mentioned above three separate investigations are being conducted under this research project Specific objectives of each investigation are deshyscribed below
GFRP Dowel Study The objectives of this study are to (Li 2004 Vijay GangaRao and Li 2004)
1 Evaluate the use of GFRP dowel bars as load transfer devices in JPCP under HS-25 static and fatigue loads and compare their response with JPCP consisting of steel dowels This includes the conduct of laboshyratory and field evaluations of JPCP with both GFRP and steel dowels as well as the conduct of analytical modeling of dowel reshysponse in terms of maximum bending deshyflection relative deflection and bearing stress
2 Evaluate the long-term performance of field rehabilitation of JPCP using GFRP dowels
Moisture Diffusion Study This is a laboratory study with the following objecshytives (Gupta Rana and GangaRao 2004)
1 Measure the diffusion coefficients and equilibrium moisture contents and estabshy
lish the mechanism of water diffusion through neat and glass fiber-reinforced DERAKANE 411-350 Momentum vinyl ester resin bars
2 Reduce the diffusion coefficient through GFRPs by dispersing nanoclay in the mashytrix
3 Study the effect of clay loading on the difshyfusion properties of GFRPs by varying the amount of clay (1 2 and 5 percent by weight)
4 Study the effect of alkaline and saline solushytions on the diffusion of water through GFRPs
5 Take scanning electron microscope (SEM) images of damage at the surface of GFRP after prolonged immersion in distilled washyter
6 Determine the changes in tensile strength and impact strength of vinyl ester-clay nanocomposites with varying amounts of nanoclay and correlate the results with available theories
7 Use dynamic mechanical analysis (DMA) to study the structural changes due to imshymersion in distilled water for extended peshyriods
GFRP Rebars in CRCP Study The objectives of this study are to (GangaRao Chen and Vijay 2003 Choi and Chen 2005)
1 Design and construct a CRCP that used GFRP bars for longitudinal reinforcement
2 Evaluate the performance of GFRP-reinforced CRCP in relation to convenshytional steel-reinforced CRCP during the winter and summer seasons in terms of
bull Crack spacing and crack width
bull Crack-cluster ratio and percentage of ldquoYrdquo cracking
143
Both the GFRP-reinforced CRCP and the conventional steel-reinforced CRCP will be constructed on the same project and will share the same pavement thickness base design traffic loadings and environmental conditions
3 Check the existing design and construction methodologies given by the 1993 AASHTO Pavement Design Guide for the performshyance of conventional steel-reinforced CRCP and suggest necessary modifications for CRCP with GFRP reinforcement
Project Design and Layout
GFRP Dowel Study The study of GFRP dowels consists of both laborashytory and field investigations Laboratory tests conshyducted in this study include static and repeated load applications on 2794- and 3048-mm (11- and 12shyin) thick slabs containing both 254- and 381-mm (10- and 15-in) diameter steel and GFRP dowels placed at 1524- and 3048-mm (6- and 12-in) spacshyings
For the field investigation GFRP dowel bars were included the Corridor H project on Rt 219 near Elkins WV Both 254- and 381-mm (10- and 15shyin) diameter GFRP dowels were installed in the field at 1524-2032-2286- and 3048-mm (6- 8- 9- and 12-in) spacings Load calibrated field tests were conducted on these pavements in 2002 and 2003 using a WVDOT truck The 381-mm (15-in) diameter GFRP dowel bars were also utilized for pavement rehabilitation near the junction of Rt 857 and Rt 119 on University Avenue in Morgantown WV Field data collected through automatic data acquisition system included strain and joint deflecshytions (which were used for assessing joint load transfer efficiency) relative deflections across the joints and overall pavement performance
Moisture Diffusion Study Diffusion of water through GFRPs is being studied gravimetrically by performing transient water upshytake experiments on glass fiber-reinforced and non-reinforced nanocomposites in distilled water alkashyline solutions and saline solutions A diffusion mechanism will be proposed for both glass fiber-reinforced and nonreinforced nanocomposites based on the experimental results Equations will also be
proposed to predict the changes in diffusion behavshyior with temperature SEM images will be taken to estimate the damage of the fiber surface after exshytended exposure to distilled water tensile tests and fracture tests will be carried out on nonreinforced nanocomposites with various clay loadings and DMA tests will be carried out to study changes in glass transition temperature (Tg) storage modulus and loss modulus with clay loading Results of these laboratory experiments will be correlated with available theories
GFRP Rebars in CRCP Study Analytical modeling and finite element (FE) analyshysis of CRCP reinforced with GFRP bars have been carried out at WVU (Vijay and GangaRao 1999 Chen and Choi 2002 2003 2004) Based on the laboratory and FE analysis results designs for a GFRP-reinforced CRCP section and a conventional steel-reinforced CRCP control section have been developed but a suitable project site has not yet been identified
Current Project Status Results and Findings
Some preliminary findings and recommendations are available from the study of GFRP dowels (Li 2004 Vijay GangaRao and Li 2004) These are presented below
Findings from GFRP Dowel Study 1 In this research GFRP dowels were found to be
acceptable alternatives to traditional steel dowshyels for transferring joint loads in JPCP paveshyments Joints with GFRP dowels provided adeshyquate deflection load transfer efficiency exceeding the minimum values recommended by AASHTO (75 percent) and ACPA (60 pershycent) in both laboratory tests and field tests
2 GFRP dowel-concrete interfaces in slab 1 and slab 4 after 5 million load cycles were found to be in excellent condition with no visible damage microcracking or separation between the GFRP dowel and surrounding concrete
3 The greater flexibility of the GFRP dowels reshysults in a shorter distance to the point of inflecshytion (no bending in the GFRP dowel) compared to steel dowels The required length of 381-mm (15-in) GFRP dowels is 65 percent of that for
144
a steel dowel with same diameter The required length of a 254-mm (1-in) GFRP dowel is 69 percent of that for a steel dowel with same dishyameter The bearing stress at the joint face is greater with the GFRP dowel compared to a steel dowel
4 Under static load testing slabs with smaller diameter GFRP dowel and shorter spacings provided lower relative deflections than GFRP dowels with larger diameter and longer spacshyings During fatigue loading up to 5 million cyshycles the relative deflection of the slab with smaller GFRP diameter bars and shorter spacshyings and a 1016-mm (04-in) joint width inshycreased from 03251 mm (00128 in) to 20396 mm (00803 in) over a range from 2 million to 5 million cycles whereas the relative deflection of the slab with larger GFRP diameter bars and longer spacings and a 635-mm (025-in) joint width decreased from 0635 mm (0025 in) to 04318 mm (0017 in) over the range from 2 million to 5 million cycles
5 The LTE of slabs with 254-mm (1-in) diameshyter GFRP bars spaced at 1524-mm (6-in) inshytervals was 72 percent after 5 million load cyshycles The LTE of slabs on a strong base and with 381-mm (15-in) diameter GFRP bars spaced at 3048-mm (12-in) intervals was greater than 80 percent whereas the same setshyup on slabs with poor base support conditions exhibited an LTE of 55 percent Hence it is very important to ensure adequate support conshyditions
6 The LTE affects the slab integrity and slab stresses whereas relative deflection affects ride comfort and impact on slab at joints It is imshyportant to consider both LTE and relative deshyflections when the performance of JPCP is evaluated For example at 5 million cycles the slab with 381-mm (15-in) diameter GFRP dowels spaced at 3048-mm (12-in) intervals exhibited 55 percent LTE but its relative deshyflection (04318 mm [0017 in]) was less than that of the slab with 254-mm (1-in) diameter GFRP dowels spaced at 1524-mm (6-in) intershyvals (LTE of 72 percent and a relative deflecshytion of 20396 mm [00803 in])
Findings from GFRP CRCP Study The concrete stresses induced in a GFRP-reinforced concrete slab due to concrete shrinkage or temperashyture variations have been analytically calculated in comparison to those induced in a steel reinforced concrete slab and the validity of the analytical model has been verified numerically and experishymentally The analytical solution indicates that a low Youngrsquos modulus of GFRP rebars results in a stress reduction in concrete slabs The thermal stress in concrete can be either tensile or compresshysive depending on temperature variations the coefshyficient of thermal expansions (CTEs) of the conshycrete and the type of GFRP reinforcement
From comparison with the FE calculation the anashylytical solution of average axial concrete stresses is shown to be valid throughout the longitudinal (x-) direction especially in the vicinity of the slabrsquos middle section where the maximum average axial stresses in concrete appeared Meanwhile the comshyparison also reveals the applicability of the FE method to the CRCP analysis A 5-ft CRCP segshyment FE model was built to simulate the behavior of the CRCP and to study the effects of the CRCP-design considerations (such as the CTE of concrete the subbase friction and the bond-slip between concrete and reinforcement) on the stress developshyment and crack width in the CRCP It is shown that using concrete with a lower CTE reduces the conshycretersquos tensile stress level when exposed to a temshyperature drop and a weaker bond between the conshycrete and reinforcement also decreases the concrete tensile stress level in the CRCP and the tensile reinshyforcement stress level at its cracks With a higher subbase friction the CRCP is more likely to crack from its bottom area since the concrete stress level at the bottom will be higher than that at the top This suggests that one can control crack spacing and crack widths of GFRP-reinforced CRCP by increasing the amount of reinforcement reducing the bond between the concrete and reinforcement or reducing the bond between the slab and the base
From the FE study a feasible longitudinal reinshyforcement design for a 254-mm (10-in) GFRP-reinforced CRCP has been developed by evaluating concrete stress levels in 1-m (35-ft) 15-m (5-ft) and 24-m (8-ft) long CRCP-slab segments Using 6 longitudinal GFRP rebars at 1524-mm (6-in) spacings at the mid-depth of the slab is shown to be an economically feasible design for GFRP-CRCP
145
on the flexible subbase (or lime-treated clay sub-base) In addition 5 GFRP-rebars spaced at 48 in will be adequate as transverse reinforcement
Higher CTE higher Youngrsquos modulus lower tenshysile strength and greater drying shrinkage of the concrete appear to reduce the crack spacing in the CRCP However even though the crack width is generally narrower as the crack spacing is smaller it can open wider after the crack formation stabishylizes This occurs when the ambient temperature and air humidity levels drop enough to cause sigshynificant concrete volume changes such that the crack width of those smaller crack spacing sections will become larger Increased subbase friction levshyels always cause shorter crack spacings followed by a narrower crack width for all cases From the mechanistic analysis results either of the GFRP-CRCPs with the limestone sandstone and siliceous river gravel concrete on asphalt-stabilized subbase seems to perform satisfactorily without raising the GFRP-reinforcement ratio In addition the subbase that can provide a bond-slip of about 1789 kPamm (5000 lbfin2in) is able to guarantee a satisfactory performance of the GFRP-reinforced CRCP with granite concrete
The designs of a 2794-mm (11-in) GFRP-reinforced CRCP and a conventional steel-reinforced CRCP sections were prepared in 2003 The final designs of the sections may vary dependshying upon the location of the experimental sections
Points of Contact
Hota V S GangaRao PhD PE Professor (304) 293-7608 ext 2634 HotaGangaraomailwvuedu
Hung-Liang (Roger) Chen PhD Professor (304) 293-3031 ext 2631 hchenwvuedu
P V Vijay PhD Assistant Professor (304) 293-7608 ext 2660 pvijaywvuedu
Constructed Facilities Center College of Engineering and Mineral Resources West Virginia University Morgantown WV 26506
References
Chen H L and J H Choi 2002 ldquoEffects of GFRP Reinforcing Rebars on Shrinkage and Thermal Stresses in Concreterdquo Proceedings of the 15th ASCE Engineering Mechanics Conference Columbia Unishyversity New York NY
mdashmdashmdash 2004 ldquoEffects of GFRP Reinforcing Re-bars on Shrinkage and Thermal Stresses in Conshytinuously Reinforced Concrete Pavementrdquo submitshyted to ACI Structural Journal American Concrete Institute Farmington Hills MI
Choi J H and H L Chen 2003 ldquoDesign Considerashytions of GFRP-Reinforced CRCPrdquo Field Applications of FRP Reinforcement Case Studies SP-215 Amerishycan Concrete Institute Farmington Hills MI
mdashmdashmdash 2005 Development and Deployment of Second Generation FRP Composite Applied to Concrete Pavements (Task 3 Continuously Rein-forced Concrete Pavement) Draft Final Report for USDOTFHWA Project DTFH61-99-X-0078 Federal Highway Administration Washington DC
GangaRao H V S H L Chen and P V Vijay 2003 Field Implementation and Performance Evaluation of CRCP with FRP Composite Bars West Virginia University Work Plan Federal Highway Administration Washington DC
Gupta R H Rana and H V S GangaRao 2004 Moisture Diffusion through Neat and Glass-Fiber Reinforced Vinyl Ester Resin Containing Nano-Clay Draft Final Report CFC 04-102 Federal Highway Administration Washington DC
Li H 2004 Evaluation of Jointed Plain Concrete Pavement (JPCP) with FRP Dowels Masterrsquos Theshysis West Virginia University Morgantown
Vijay P V and H V S GangaRao 1999 Develop-ment of Fiber Reinforced Plastics for Highway Appli-cation Aging Behavior of Concrete Beams Rein-forced with GFRP Bars CFC-WVU Report No 99shy265 (WVDOH RP T-699-FRP1) West Virginia Deshypartment of Transportation Charleston
Vijay P V H V S GangaRao and H Li 2004 Evaluation of Jointed Plain Concrete Pavements (JPCP) with FRP Dowels Draft Final Report CFC 04-101 Federal Highway Administration Washingshyton DC
146
39
Wisconsin 1Highway 29 WB
Abbotsford
94
94
Original 1994Test Sections
Owen
39
94
94
Chapter 36 WISCONSIN 1 (Highway 29 Abbotsford)
Introduction
In the early 1990s the Wisconsin Department of Transportation (WisDOT) began investigating noise levels produced by concrete pavement finishing practices (Kuemmel et al 2000) In 1994 Wisconshysin constructed 16 concrete pavement sections inshycorporating different experimental textures the reshysults of which led to some preliminary recommendations on concrete pavement surface texturing (Kuemmel et al 1996)
At about the same time several other states (Coloshyrado Iowa Michigan Minnesota and North Dashykota) constructed concrete pavements with experishymental surface texturing and there arose an acute need to uniformly collect and analyze the data from all of the test sections and develop national guideshylines for recommended surface texturing practices To address this need WisDOT and FHWA conshytracted with Marquette University and the HNTB Corporation to collect noise texture and friction characteristics from the now six states and prepare a final report documenting the findings (Kuemmel et al 2000) Concurrently under the TE-30 program additional concrete pavement test sections were constructed in Wisconsin to afford a more complete range of surface textures (Kuemmel et al 2000) These new test sections were constructed in the westbound lanes of Highway 29 west of Abbots-ford (see Figure 96) and are located just east of the original 1994 Wisconsin test sections (Kuemmel et al 2000)
Study Objectives
The major objective of this project is to develop national guidelines for texturing PCC pavements based on national experience (Kuemmel et al 2000) This objective was to be accomplished by performing the following (Kuemmel et al 2000)
bull Construction of 10 additional test sites in Wisconsin
29
MilwaukeeMadison
Abbotsford
Owen
39
Wisconsin 1 Highway 29 WB
Abbotsford
292994
94 MilwaukeeMadison
Abbotsford
Owen
Original 1994 Test Sections
Owen
Figure 96 Location of WI 1 project
bull Measurement of interior and exterior noise levels surface friction and texture on test sites in Wisconsin Colorado Iowa Michishygan Minnesota and North Dakota as well as on 8 of the original 16 Wisconsin test sections
bull Application of Fast Fourier Transform (FFT) methods for both interior and exteshyrior noise measurements to help resolve discrepancies in subjective noise measureshyments
bull Assessment of public perception to road noise through the use of standard audiology testing by a panel of non-highway agency raters
bull Development of recommended pavement textures and demonstration at an open house and workshop near the new Wisconshysin test sections
147
Project Design and Layout
New Wisconsin Sections The 10 new Wisconsin test sections were conshystructed in 1997 in the westbound lanes of Highway 29 west of Abbotsford (Kuemmel et al 2000) These sections are all 16 km (1 mi) long and share the same pavement design differing only surface texture On this project the following 10 surface textures were constructed (Kuemmel et al 2000)
1 Random transverse tining 25-mm (1-in) average spacing (Random 1)
2 Random transverse tining 19-mm (075-in) average spacing (Random 2)
3 Uniform transverse tining 25-mm (1-in) spacing
4 Random 1 skewed tining 16 left hand forshyward (LHF)
5 Random 2 skewed tining 16 LHF
6 Random 1 skewed tining 14 LHF
7 Random 2 skewed tining 14 LHF
8 Random 1 longitudinal tining
9 Random 2 longitudinal tining
10 Uniform longitudinal tining 25-mm (1-in) spacing
All texturing was preceded by a longitudinal turf drag (LTD) and all tining depths were specified to be 3 mm (012 in) (Kuemmel et al 2000)
Additional Analysis Sections Several additional sections both within Wisconsin and from other states were brought into the study to expand the analysis Characteristics of these secshytions are described below
Additional Wisconsin Sections
As previously noted 8 of the 16 original 1994 Wisshyconsin sections were included in this evaluation six other experimental pavement sections from I-43 and four other sections from throughout the State were also included (Kuemmel et al 2000) The surface texturing of these additional Wisconsin sections are described below (Kuemmel et al 2000)
bull Highway 29 Owen
ndash 25 mm (1 in) uniform longitudinal
ndash 25 mm (1 in) uniform skewed 16 LHF 15 mm (006 in) depth
ndash 13 mm (05 in) uniform transverse
ndash 13 mm (05 in) uniform transverse 15 mm (006 in) depth
ndash 19 mm (075 in) uniform transverse
ndash Manufactured random
ndash 25 mm (1 in) uniform transverse (forshymer WisDOT standard)
ndash Skidabrader (a blasted set but uncured PCC pavement with longitudinal turf drag only prior to treatment)
bull I-43 Milwaukee
ndash SHRP AC Pavement (built in 1992)
ndash Standard AC dense-graded pavement (1992)
ndash Standard AC dense-graded pavement (1993)
ndash Stone matrix asphalt (SMA) pavement 16 mm (062 in) top size (1993)
ndash Diamond ground PCC pavement (built in 1978 ground in 1993)
ndash SMA pavement 9 mm (038 in) top size aggregate (1992)
bull Highway 29 eastbound random transverse tining 21 mm (083 in) average spacing (1994)
bull US 51 north of Merrill random transverse tining 25 mm (1 in) average spacing (1996)
bull US 151 near Beaver Dam random transshyverse tining 25 mm (1 in) average spacing (1996)
bull Highway 26 near Jefferson random transshyverse tining 25 mm (1 in) average spacing (1996)
148
Colorado Sections
The Colorado DOT constructed nine test sections on I-70 near Deertrail in 1994 six of which were included in this study (Kuemmel et al 2000)
bull 25 mm (1 in) uniform transverse tining (Colorado DOTrsquos then standard)
bull 19 mm (075 in) average random transshyverse tining (repeating pattern of 16 22 and 19 mm [063 087 and 075 in])
bull 13 mm (05 in) uniform transverse tining
bull 19 mm (075 in) average random transshyverse saw cut (repeating pattern of 16 22 and 19 mm [063 087 and 075 in])
bull 19 mm (075 in) uniform longitudinal saw cut
bull 19 mm (075 in) uniform longitudinal tinshying
LTD preceded all surface texturing and the impresshysions were specified to be 3 mm (012 in) deep and 3 mm (012 in) wide (Kuemmel et al 2000)
Iowa Sections
In 1993 the Iowa DOT constructed nine test secshytions on Highway 163 northeast of Des Moines and the following seven sections were selected for inshyclusion in this study (Kuemmel et al 2000)
bull 13 mm (05 in) uniform transverse 3 to 5 mm (012 to 02 in) deep
bull 19 mm (075 in) uniform transverse 3 mm (012 in) deep
bull 19 mm (075 in) uniform longitudinal 15 mm (006 in) deep
bull 19 mm (075 in) uniform longitudinal 3 to 5 mm (012 to 02 in) deep
bull 19 mm (075 in) variable transverse 3 to 5 mm (012 to 02 in) deep
bull Milled PCC pavement (carbide ground)
bull 13 mm (05 in) uniform transverse sawed
All texturing was preceded by LTD
Michigan Sections
The two sections in the Michigan I-75 experimental project (see chapter 10) were selected for inclusion in this study (Kuemmel et al 2000) These include both a standard texture (25-mm [1-in] uniform transverse tining) and a European exposed aggreshygate surface
Minnesota Sections
Eight pavement sections with various surface texshyturings were included from Minnesota LTD preshyceded all texturing activities for the 8 selected secshytions (Kuemmel et al 2000)
bull US 169 section with 19 mm (075 in) unishyform longitudinal tining (built in 1996)US 169 section with 19 mm (075 in) random transverse tining (1996)
bull US 12 section with 19 mm (075 in) ranshydom transverse tining (1996)
bull Highway 55 with 38 mm (150 in) random transverse tining (built in 1994)
bull I-494 section with longitudinal turf drag only (1990)
bull US 169 section with 38 mm (150 in) ranshydom transverse tining (1994)
bull US 169 section with LTD only (1996)
bull US 169 section with 19 mm (075 in) unishyform longitudinal tining (1996)
North Dakota Sections In 1994 North Dakota constructed nine test sections incorporating different surface texturing on I-94 near Eaglersquos Nest of which six were selected for this study (Kuemmel et al 2000)
bull 25 mm (1 in) uniform skewed tining 16 RHF
bull 19 mm (075 in) uniform transverse tining
bull Variable (26 51 76 and 102 mm [1 2 3 and 4 in]) random transverse tining
bull 13 mm (05 in) uniform transverse tining
149
bull 19 mm (075 in) uniform longitudinal tinshying
bull 25 mm (1 in) uniform transverse tining (for control)
All surface texturing was preceded by LTD
State Monitoring Activities
A total of 57 pavement test sections from 6 states were ultimately included in the study Representing a wide variety of surface textures each of these pavement sections was evaluated in 1999 for the following properties (Kuemmel et al 2000)
bull Interior and exterior noise levels measured with a real-time acoustical analyzer using the FFT analysis
bull Subjective rating of interior noise levels by 24 people on 21 of the test sections The subjecshytive ratings were performed on digital reshycordings of interior noise levels made during the interior noise measurements
bull Surface texture measurements using the FHWArsquos Road Surface Analyzer (ROSAN) Computations of mean profile depth (MPD) and estimated texture depth (ETD) were obshytained from the measurements Sand patch testing providing an estimate of the texture depth was also conducted on most test secshytions in Wisconsin
bull Surface friction collected by the participating SHAs This testing was conducted in accorshydance with ASTM E274 and was conducted in close proximity to the time that the texture and noise measurements were obtained
ResultsFindings
A comprehensive analysis of the noise texture and surface friction data collected from the 57 sections was conducted and yielded the following conclushysions (Kuemmel et al 2000)
bull The depth of the tining varies considerably between pavement test sections as well as within a test section In many cases specishyfied tining depths were not achieved
bull Uniformly tined pavements exhibit discrete frequencies that produce an annoying ldquowhinerdquo to travelers
bull Transversely tined pavements with the widshyest and deepest textures were often among the noisiest
bull AC and longitudinally tined PCC paveshyments exhibit the lowest exterior noise levshyels while still providing adequate texture Longitudinal uniform spacings of 19 mm (075 in) reduce the impact on motorcycles and compact vehicles However splash and spray have been noted to be greater on lonshygitudinally tined pavements
bull The longitudinally tined PCC pavements the randomly skewed (16) tined paveshyments and an AC pavement exhibit the lowest interior noise levels while still proshyviding adequate texture
bull Random transverse tining is very sensitive to the spacing pattern When the spacings become more uniform discrete frequencies may develop resulting in an objectionable whine
bull Randomly skewed (16) tined pavements can be constructed relatively easily exhibit low interior noise levels and no discrete frequencies and have the best subjective ranking They have higher levels of exterior noise than longitudinally tined PCC and AC pavements but lower than random transshyverse PCC pavements They also exhibit good friction and texture
bull The diamond-ground PCC pavement alshythough not as quiet as other PCC paveshyments did not exhibit any predominant freshyquency or spike
Figure 97 summarizes the surface friction data (measured at 64 kmhr [40 mihr] and with a bald tire) collected for the Wisconsin 1 sections (Kuemshymel et al 2000) All but one of these sections exshyhibit friction numbers greater than 40 with the lowshyest exhibited by Section 8 (random longitudinal tining)
Figure 98 shows the relative ranking of the noise levels for all of the different pavement surface texshy
150
8080
FFNN
40 B
40 B
KKeeyy toto WI 1 SeWI 1 Sectictioonnss 11 RanRandom tdom trransansvveerrsse tie tinniingng 2255-m-mm (m (11-shy
iinn) av) avereraaggee spspaciacinng (g (RRandandoomm 1)1)6060 22 RanRandom tdom trransansvveerrsse tie tinniingng 1199-m-mmm
((00775-5-in)in) aavveerraage spage spacciinng (g (RRanandom 2)dom 2) 33 UnifUniformorm trtraannssvverse tierse tiningning 2255-m-mmm (1-(1shy
iinn) spacing) spacing 44 RanRandom 1 skewdom 1 skeweedd titinniingng 16 l16 leefftt hahandnd4040
ffoorwrward (ard (LLHFHF)) 55 RanRandom 2 skewdom 2 skeweedd titinniingng 16 LH16 LHFF 66 RanRandom 1 skewdom 1 skeweedd titinniingng 14 LH14 LHFF 77 RanRandom 2 skewdom 2 skeweedd titinniingng 14 LH14 LHFF
2020 88 RanRandom 1 ldom 1 loonnggiittududiinnaall titiningning 99 RanRandom 2 ldom 2 loonnggiittududiinnaall titiningning 1010UUnifnifoormrm lloongitudinalngitudinal titinniinngg 25-m 25-mmm ((11-shy
iinn) spacing) spacing 00
11 22 33 44 55 66 77 88 99 1100
WWII 11 SeSeccttioion Nn Nuumbemberr
tures in terms of subjective ratings interior noise levels and exterior noise levels (Kuemmel et al 2000)
Based on the results of the data analysis the followshying primary recommendations were developed (Kuemmel et al 2000)
bull If overall noise considerations are parashymount longitudinal tining that provides satshyisfactory friction may be considered A unishyform tine spacing of 19 mm (075 in) will provide adequate friction and according to other studies will minimize effects on small tired vehicles However the safety aspects of longitudinal tining have not been documented
bull If subjective perceptions and texture considshyerations are paramount a randomly skewed (16) textured pavement offset the opposite of any skewing of the transverse joints may be used This pattern achieves the texture and friction of a conventional transversely tined pavement while also obtaining most of the noise reductions associated with longitushydinal tining
bull If texture considerations are paramount and a skewed pattern is impractical randomly spaced transverse tining may be employed However this should be carefully designed and built using a highly variable spacing A 3-m (10-ft) long rake with spacings beshytween 10 and 76 mm (04 and 30 in) deshysigned using spectral analysis is recomshymended and has been successfully tested by three states
bull Diamond grinding if sufficiently deep to remove most of the uniform transverse texshyture can be considered a treatment for PCC pavements with excessive whine
It should be noted that at least one State evaluated the surface texture recommendation presented above but did not achieve low-noise pavements (Scofield 2003) A new technical advisory on pavement surface texture is currently under develshyopment by the FHWA
Figure 97 Surface friction of WI 1 test sections (Kuemmel et al 2000)
151
Points of Contact
Debbie Bischoff Wisconsin Department of Transportation 3502 Kinsman Boulevard Madison WI 53704 (608) 246-7957 debrabischoffdotstatewius
David A Kuemmel (414) 288-3528 davidkuemmelmarquetteedu
Ronald C Sonntag (414) 288-5734 ronaldsonntagmarquetteedu
Marquette University Department of Civil and Environmental Engineering PO Box 1881 Milwaukee WI 53201-1881
References
Kuemmel D A J R Jaeckel A Satanovsky S F Shober and M M Dobersek 1996 ldquoNoise Characshyteristics of Pavement Surface Texture in Wisconsinrdquo Transportation Research Record 1544 Transportashytion Research Board Washington DC
Kuemmel D A R C Sonntag J A Crovetti Y Becker J R Jaeckel and A Satanovsky 2000 Noise and Texture on PCC PavementsmdashResults of a Multi-State Study Report Number WISPR-08-99 Wisconsin Department of Transportation Madison WI (also available at httpchtemarquetteedu noiseamptextureindexhtml)
Scofield L 2003 SR202 PCCP Whisper Grinding Test Sections Final Report Arizona Department of Transportation Phoenix
152
0
2
4
6
8
10
12
14
16
18
20
1 9 mm 1 9 mm S HR P AC P Trans var 2 5 mm Euro p ean 3 8 mm Trans Trans 1 9 M illed Trans 1 3 Gro und 2 5 mm 2 5 mm Truly 1 3 mm 3 8 mm 1 9 mm R and o m 2 5 mm
Ran
k
0
2
4
6
8
10
12
14
16
18
20
1 9 mm 1 9 mm S HR P AC P Trans var 2 5 mm Euro p ean 3 8 mm Trans Trans 1 9 M illed Trans 1 3 Gro und 2 5 mm 2 5 mm Truly 1 3 mm 3 8 mm 1 9 mm R and o m 2 5 mm
Ran
k
154
rraannd o md o m raranndd oo mm 2 6 2 6 5 2 5 2 7 8 7 8 lolo nngg TeTexxtt uurree rraannd o md o m ss aawweed d 1 31 3 mmmm (3(3 -5-5 SS uurfarfaccee mmmm (3(3 -5-5 PP C C PC C P raranndd oo mm (C(C OO SS tt dd )) RR aannd o md o m t rt raannss (( 11 55 raranndd oo mm ununiiffoo rrmm tt rraanns s as s aww t rt raannss s ks keeww 11 66 s ks keeww 11 44 1 0 4 m1 0 4 mmm t rt raannss LL TTDD mmmm mm dmm d )) mm dmm d )) t rt raannss ((ZZiigg nnaag o )g o ) mm dmm d )) t rt raannss t rt raannss cucutt ss
SSuubjbjececttiivvee IInntteerriioror dBdB AA EExxtteerriioror dBdB AA
Figure 98 Relative noise rankings of pavement surface texturings (Kuemmel et al 2000)
39
94
94
Wisconsin 3Highway 29
Hatley to Wittenberg
Wisconsin 2Highway 29 EB
Owen to Abbotsford
39
94
94
Chapter 37 WISCONSIN 2 (Highway 29 Owen) and WISCONSIN 3 (Highway 29 Hatley)
Introduction
In the summer of 1997 WisDOT constructed two experimental concrete pavement projects on Highway 29 to investigate the constructibility and cost effectiveness of alternative concrete paveshyment designs (Crovetti 1999 Crovetti and Bischshyoff 2001) Constructed with partial funding from the TE-30 program one project (designated WI 2) is located in the eastbound lanes of Highway 29 between Owen and Abbotsford while the other project (designated WI 3) is located in both lanes of Highway 29 between Hatley and Wittenberg (see Figure 99) The WI 3 test sections are also part of FHWArsquos ongoing Strategic Highway Reshysearch Program (SHRP) study Because of the similarities and complementary design of these two projects they are considered together in this chapter
29
MilwaukeeMadison
Abbotsford
OwenHatley
Wittenberg
39
292994
94 MilwaukeeMadison
Abbotsford
Owen
Wisconsin 3 Highway 29
Hatley to Wittenberg
Hatley
Wittenberg
Wisconsin 2 Highway 29 EB
Owen to Abbotsford
Figure 99 Location of WI 2 and WI 3 projects
Study Objectives
The overall objective of these projects is to evalushyate the constructibility and cost-effectiveness of alternative concrete pavement designs (Crovetti 1999) Among the different concrete pavement designs and design features being investigated in these projects are (Crovetti 1999)
bull Reduced number of dowel bar across transverse joints
bull Alternative dowel bar materials for transshyverse joint load transfer
bull Variable thickness pavement cross secshytion
Project Design and Layout
Wisconsin 2 The WI 2 project is located only in the eastbound lanes of Highway 29 It was constructed in Sepshytember 1997 and includes both alternative dowel bar materials and alternative dowel bar layouts (Crovetti 1999 Crovetti and Bischoff 2001)
bull Alternative Dowel Bar Materials
ndash Standard epoxy-coated steel dowel bars
ndash Solid stainless steel dowel bars manufactured by Avesta Sheffield
ndash Fiber-reinforced polymer (FRP) comshyposite dowel bars manufactured by Glasforms
ndash FRP composite dowel bars manufacshytured by Creative Pultrusions
ndash FRP composite dowel bars manufacshytured by RJD Industries
ndash Stainless steel tubes filled with morshytar manufactured by Damascus Bishop
bull Alternative Dowel Bar Layouts
ndash Standard dowel layout (dowels spaced at 305-mm [12-in] intervals)
ndash Alternative dowel layout 1 (three dowels in each wheelpath)
154
12 f12 ftt InInner Lanener Lane
SSttaandarndardd DDoowweell LLaayyooutut ((2266 ddoowweelsls at 12at 12-in s-in sppaacings)cings)
AAllteterrnnatiativve Dowe Doweell LayLayout 1out 1 (3 dow(3 doweellss peperr wwhheelpeelpaatthh))
AAlltteerrnnaattiivve De Doowweel Layl Layoutout 22 ((44 dowdoweells in outers in outer wwhheeeelpalpatthh
3 dow3 doweellss in all othein all otherr wwhheeeelplpathsaths))
AAlltteerrnnaattiivve De Doowweel Layl Layoutout 33 ((44 dodowweels in outerls in outer wwhheeeelpalpatthh
3 do3 dowweels in all otherls in all other wwhheeeelpalpatthhss 1 dow1 doweell aatt ououtteer edr edge)ge)
AAlltteerrnnaattiivve De Doowweel Layl Layoutout 44 (3 dow(3 doweellss in allin all wwhheelpeelpaathsths
11 dowdoweell nnearear oouuterter eeddggee))
14 f14 ftt OutOuteer Lar Lanene
ndash Alternative dowel layout 2 (four dowshyels in outer wheelpath three in all other wheelpaths)
ndash Alternative dowel layout 3 (four dowshyels in outer wheelpath three in all other wheelpaths one dowel at outer edge)
ndash Alternative dowel layout 4 (three dowshyels in all wheelpaths one dowel near outer edge)
The alternative dowel bar layouts used on this project are illustrated in Figure 100 These layouts were selected to reduce dowel bar requirements while still maintaining standard placement locashytions used in Wisconsin (Crovetti 1999)
The nominal pavement design for these pavement sections is a 275-mm (11-in) JPCP with skewed variable joint spacing of 52-61-55-58 m (17-20shy18-19 ft) (Crovetti 1999)
The dowel bars were 38 mm (15 in) in diameter and were placed using an automated dowel bar inserter (DBI) The transverse joints were left unshysealed
The pavement was constructed over existing base materials that were salvaged from the in-place structure including 230 mm (9 in) of existing dense-graded crushed aggregate subbase and 125 mm (5 in) of existing dense-graded crushed agshygregate base An additional 50 mm (2 in) of new dense-graded aggregate base was placed prior to the PCC paving
Figure 101 shows the approximate layout of the 11 test and 2 control sections in the WI 2 project using the original section nomenclature adopted by the researchers Nominal 161-m (528-ft) long pavement segments generally consisting of 29 joints were selected from within each test section for long-term monitoring (Crovetti 1999) Table 54 provides the experimental design matrix for the project
Figure 100 Alternative dowel bar layouts used on WI 2
155
SeSeccttiioon CPn CP SSectectioionn 4E4E1111--iinn JPJPCPCP TrTransansiitiontion 1111--iin Jn JPPCCPPFRFRPP CoCompompossiteite BBaarsrs 1111-i-inn JPJPCPCP SStteeleel DDoowweellss((CCrreeaattiivve Pue Pullttrrususiionsons)) StSteeeell DDoowelwelss DoDowweel Layl Layoouutt 44StStanandardard Dd Doowelwel LLaayyououtt StStanandardard Dd Doowelwel LLaayyououtt
SSeeccttion RJion RJDD SeSectctiioonn 3S3S1111-i-inn JPJPCPCP 11-11-iinn JJPPCCPP
(R(RJD InJD Indudustries)stries) FRP CFRP Coompompossiteite BBaarsrs
StStaiainlnlesesss StSteeeell DDoowelwelss StStanandardard Dd Doowelwel LLaayyoutout DDoowelwel LaLayoutyout 33
SSectectioionn 2E2E SeSeccttiioon C2n C2 1111--iin Jn JPPCCPP 11-11-iinn JJPPCCPP
SStteeleel DDoowweellss StSteeeel Dol Dowweellss DoDowweell LayLayoouutt 22 SSttaandarndard Dd Doowewell LLaayyououtt
1212 fftt TrafTrafffiicc
1414 fftt
1818785785 fftt 16121612 fftt 15551555 fftt 16165151 fftt 367367 5959 11226969 16201620 fftt 11556611 fftt 62426242 fftt 53405340 fftt 42184218 fftt 55226688 ftft 66550044 ftft
SeSeccttiion GFon GF 1111-i-inn JPJPCPCP
FRP CFRP Coompompossiteite BBaarsrs (Gla(Glasfsfoorrms)ms)
StStanandardard Dd Doowelwel LLaayyoutout
SeSection 4Sction 4S SSeection 3ction 3EE Sbb Seection 1ction 1EE 1111--iinn JJPPCCPP 11-11-iinn JJPPCC 11PP 11-i-inn JPJPCPCP
SSttaiainlnlesesss StSteeleel DDoowelwelss StSteeeel Dowl Dowee Stlsls Steeeell DDoowelwelss DDoowweell LaLayyooutut 44 DoDowweell LayLayoouutt D33 Doowelwel LaLayyooutut 11
SeSeccttiion C1on C1 SeSeccttiion HFon HF SSectectioionn 3E3Eaa 11-11-iinn JJPPCCPP 11-11-iinn JJPPCCPP 11-11-iinn JJPPCCPP
StSteeeel Dol Dowweellss StStaiainlnleessss StSteeeell TTuubbeess StSteeeel Dol Dowweellss SSttaandandarrdd DDoowewell LaLayouyoutt FilFillleedd wwithith MortaMortarr DDoowelwel LaLayoutyout 33
(Dama(Damascuscus-s-BBiishoshopp)) SSttaandandarrdd DDoowewell LaLayouyoutt
Figure 101 Approximate layout of WI 2 test sections
Table 54 Experimental Design Matrix for WI 2
11-IN JPCP 17-20-18-19 FT JOINT SPACING
Standard Dowel Layout
Alternative Dowel Layout 1
Alternative Dowel Layout 2
Alternative Dowel Layout 3
Alternative Dowel Layout 4
Standard Epoxy-Coated Steel Dowels
Section C1 Section C2
Section 1E Section 2E Section 3Ea Section 3Eb
Section 4E
Solid Stainless Steel Dowels (Avesta Sheffield) Section 3S Section 4S
FRP Composite Dowel Bars (Creative Pultrusions)
Section CP
FRP Composite Dowel Bars (Glasforms) Section GF
FRP Composite Dowel Bars (RJD Industries)
Section RJD
Stainless Steel Tubes Filled With Mortar (Damascus-Bishop) Section HF
156
14 ft Ou14 ft Outsidetside WWiidendened Slabed Slab
12 ft Inne12 ft Inner Laner Lane 1212 ft Outer Laneft Outer Lane
Paint StripePaint Stripe forfor
8 in
11 in
12 ft Lane
Base
PCC SlabDeformed Tie Bar8 in
11 in
12 ft Lane
Base
PCC Slab Deformed Tie Bar
tion
Wisconsin 3 The westbound lanes of the WI 3 project were constructed in June 1997 whereas the eastbound lanes were constructed in October 1997 (Crovetti 1999) The project includes the evaluation of a variable thickness cross section an alternative dowel bar layout and alternative dowel bar mateshyrials The variable thickness cross section uses a 275 mm (11 in) thickness at the outside edge of the outer lane that then tapers to a thickness of 200 mm (8 in) at the far edge of the inner lane (see Figure 102) The goal is the more efficient use of materials in areas subjected to greater trafshyfic loading resulting in more cost-effective deshysigns
The following alternative dowel bar materials are also included on the WI 3 project (Crovetti 1999)
bull Standard epoxy-coated dowel bars
bull FRP composite dowel bars manufactured by MMFG
bull FRP composite dowel bars manufactured by Glasforms
bull FRP composite dowel bars manufactured by Creative Pultrusions
bull FRP composite dowel bars manufactured by RJD Industries
bull Solid stainless steel dowel bars manufacshytured by Slater Steels
The nominal pavement design for these pavement sections is a 275-mm (11-in) JPCP with a unishyform joint spacing of 55 m (18 ft) However as previously described one section has a variable thickness cross section varying from 275 mm (11 in) for the outer lane and then tapering to 203 mm (8 in) at the edge of the inner lane The pavement rests on a 150-mm (6-in) crushed agshygregate base course and the transverse joints conshytain 38-mm (15-in) diameter dowels and are not sealed
Six sections are included in the WI 3 project The approximate layout of the WI 3 sections being monitored is shown in Figure 103 All dowel bars were placed on baskets prior to paving (Crovetti 1999) It is noted that within the section incorposhyrating various FRP composite dowel bars (Section FR) some of the composite dowel bars were imshyproperly distributed between the 37-m (12-ft) and 43-m (14-ft) baskets resulting in different manushyfacturersrsquo bars being placed across some of the inner and outer traffic lanes (Crovetti 1999) The location of the different manufacturersrsquo dowel bars is shown by lane in the blowup illustration in Figure 103
The experimental design matrix for the WI 3 proshyject is shown in Table 55 Most of the dowel mashyterials are placed in the standard dowel layout although one section is placed in alternative dowel layout 1 As previously mentioned all of these sections are included in the SHRP study and the SHRP code is provided in Table 55 for each secshy
Figure 102 Variable cross section used on WI 3
157
SeSeccttiion TRon TR SecSecttiioon Cn C11
8 -8 - 1111 in JPCPin JPCP 1111 iinn JJPPCCPP StSteeeell DDoowelwelss SStteeeel Dowl Doweelsls
SSttananddaarrdd DDoowewell LaLayoyoutut StanStandard Dowdard Doweel Lal Layyoutout
WBWB TTrrafficaffic
1212 fftt 1414 fftt
SeSeccttiion RJon RJDD SSeeccttiioon FRn FR 1111 iinn JJPPCCPP 1111 iinn JJPPCCPP
FFRRP ComP Comppositeosite DDoowweelsls ((RRJD InJD Indudustrstriies)es)
FFRRP ComP Comppositeosite DDoowweelsls (Glasf(Glasfororms Crms Creaeatitivvee
StanStandard Dowdard Doweel Lal Layyoutout PuPultrltruusiosionns Ms MMMFFGG)) StanStandard Dowdard Doweel Lal Layyoutout
InInnerner LLaneane MMMMFFGG GlasGlas GlasGlas MMFMMFGG ++
GlasGlas CPCP
SeSectctiioonn 11EE 1111 iinn JJPPCCPP
SStteel Doweel Doweelsls DoDowweel Lal Layyoouutt 11
1414 fftt
1212 fftt
EBEB TTrraffiafficc
SeSeccttiion SSon SS 1111 iinn JJPPCCPP
SSoolliid Sd Sttaaiinlnlesesss SStteeeell DDoowewellss StanStandard Dowdard Doweel Lal Layyoutout
OuteOuterr LLaneane MMMMFFGG MMMMFFGG MMMMFFGG CCPP CPCP
1 Jo1 Joiinntt 11 JoinJointt 225252 fftt 180180 fftt 110808 fftt
Figure 103 Approximate layout of WI 3 monitoring sections
11-IN JPCP 18-FT JOINT SPACING
8- TO 11-IN JPCP 18-FT JOINT SPACING
Standard Dowel Layout
Section TR (SHRP 550263)
Standard Dowel Layout
Section C1 (SHRP 550259)
Section SS (SHRP 550265)
Section FR (SHRP 550264A)
Section RJD (SHRP 550264B)
Alternative Dowel Layout 1
Section 1E (SHRP 550260)
Standard Epoxy-Coated Steel Dowels
Solid Stainless Steel Dowels (Slater Steels)
FRP Composite Bars (MMFG Glasforms Creative Pultrusions)
FRP Composite Dowel Bars (RJD Industries)
Table 55 Experimental Design Matrix for WI 3
158
State Monitoring Activities
WisDOT in conjunction with Marquette Univershysity is monitoring the performance of these pavement test sections Four types of monitoring activities are used (Crovetti 1999 Crovetti and Bischoff 2001)
bull Dowel bar location studymdash2 months after construction
bull FWD testingmdashimmediately prior to pavshying immediately after paving and after 6 and 12 months of trafficking
bull Distress surveysmdashimmediately after pavshying and after 6 and 12 months of traffickshying The distress surveys are being conshyducted over a nominal 161-m (528-ft) pavement segment selected from within each test section
bull Ride quality surveysmdashusing a pavement profiler and measured on the sections afshyter approximately 1 and 3 years of sershyvice
Continued monitoring of these sections in the form of FWD testing distress surveys and ride quality surveys will continue through 2004 (Crovetti and Bischoff 2001)
Preliminary ResultsFindings
Even though these sections are only 3 years old some significant findings have been revealed through their early monitoring These findings are described in the following sections by type of monitoring activshyity
Construction Monitoring A dowel bar inserter (DBI) was used during the conshystruction of WI 2 The DBI easily accommodated the various types of dowel bar materials used in the study and the various dowel layout patterns with minimal disruption to the paving operations (Crovetti 1999)
Dowel Bar Location Study With the purpose of determining the depth longitushydinal position and transverse position of each dowel bar a dowel bar location study was performed on the WI 2 project 2 months after construction using an impact echo device (Crovetti 1999) A summary of the study results are provided in Table 56 (Crovetti 1999) Generally it appears that the dowel bars are slightly deeper than the mid-depth of the slab (140 mm [55 in]) and that some vertical skewing of the dowels occurred across the joint It should be noted that dowel depth data were inconclusive for the stainless steel tubes and the solid stainless steel dowshyels and that the device could not provide exact longishytudinal and transverse positions of each dowel end (Crovetti 1999)
Table 56 Summary of Dowel Bar Location Study Results From WI 2 (Crovetti 1999)
TEST SECTION NO OF JOINTS
TESTED
AVERAGE DEPTH WEST SIDE OF
JOINT IN
AVERAGE DEPTH EAST SIDE OF
JOINT IN AVERAGE DEPTH
VARIATION IN
C1 (epoxy-coated steel dowel) 1 604 586 018
CP (FRP composite dowel) 2 617 597 021
GF (FRP composite dowel) 5 612 600 047
RJD (FRP composite dowel) 7 604 605 020
159
FWD Testing FWD testing has been conducted several times since the construction of these test sections Table 57 summarizes the backcalculated k-value and concrete elastic modulus as well as the total joint deflection (defined as the sum of the deflections from both the loaded and unloaded sides of the joint) obtained from the FWD testing (Crovetti 1999) Generally the test results are fairly consisshytent over time although greater variability was noticed in the June 1998 tests for both directions presumably because of higher slab temperature gradients (Crovetti 1999) Apparent increases in total joint deflections may be due to FWD testing conducted in the early morning when upward slab curling is likely
Transverse joint load transfer efficiencies were also measured on all test sections using the FWD Figure 104 illustrates the average transverse joint load transfer for the outermost wheelpath of the WI 2 project while Figure 105 illustrates the avshyerage transverse joint load transfer for the outershymost wheelpath of the WI 3 project (Crovetti 1999) For WI 2 the late season tests (October 1997 and November 1998) indicate significantly reduced LTE in the composite doweled sections and in dowel layout 1 as compared to the control sections (Crovetti 1999) The LTE measured in the summer do not indicate any significant differshyences within the test sections probably because of the increased aggregate interlock brought about by the closing of the joints due to the warmer temshyperatures (Crovetti 1999) Overall the low LTE values of the FRP bars (between 60 and 75 pershycent in many cases) is a cause of concern
For WI 3 Figure 105 shows that the FRP composite dowel sections and dowel layout 1 experience a reshyduction in LTE in the November 1998 test results there is also a slight reduction in the LTE of the stainless steel section (Crovetti 1999) Again howshyever the lower LTE values for the FRP bars are a concern
Distress Surveys Distress surveys were conducted for both WI 2 and WI 3 in June and December 1998 Some joint distress (spalling chipping and fraying of the transverse joints) was observed and is primarily attributable to the joint sawing operations that dislodged aggregate particles near the joint faces (Crovetti and Bischoff 2001) However this joint spalling has not yet proshygressed to the point to be considered as low severity based on the Wisconsin DOT Pavement Distress guidelines (Crovetti and Bischoff 2001) Other than the minor joint spalling no transverse faulting slab cracking or other surface distress has been observed to date (Crovetti and Bischoff 2001)
Ride Quality Surveys Figure 106 presents the average international roughshyness index (IRI) measurements in the outer lane of the WI 2 and WI 3 pavement sections (Crovetti and Bischoff 2001) These measurements were recorded in the summer of 1998 and the winter of 2000 Alshythough there is some variability in the data most of the test sections are performing comparably to the control sections (Crovetti and Bischoff 2001)
Table 57 Summary of FWD Test Results for WI 2 and WI 3 Projects (Crovetti 1999)
WI 2 WI 3
EB LANES EB LANES WB LANES PROPERTY Oct 97 Jun 98 Nov 98 Oct 97 Jun 98 Nov 98 Jun 98 Nov 98
Dynamic k-value lbfin2in 312 255 254 364 324 324 255 222
PCC Elastic Modulus lbfin2 3560000 3870000 4820000 3970000 5990000 6060000 5290000 6130000
Total 9000-lb Joint Deflection mils 896 777 818 670 556 848 623 711
160
1 0 0
9 0
8 0
7 0
6 0
5 0
4 0
3 0
2 0
1 0
0
Load T
ransf
er
Effic
iency
C 1 C P G F R J D H F 3 S 4 S 4 E 3 E 2 E 1 E C 2
T e s t S e c t io n
Oct 97 Jun 98 Nov 98
Points of Contact
Debbie Bischoff Wisconsin Department of Transportation 3502 Kinsman Boulevard Madison WI 53704 (608) 246-7957
James A Crovetti Marquette University Department of Civil and Environmental Engineering PO Box 1881 Milwaukee WI 53201-1881 (414) 288-7382
References
Crovetti J A 1999 Cost Effective Concrete Pave-ment Cross-Sections Report No WISPR 12-99 Wisconsin Department of Transportation Madison
Crovetti J A and D Bischoff 2001 ldquoConstruction and Performance of Alternative Concrete Pavement Designs in Wisconsinrdquo Preprint Paper No 01-2782 80th Annual Meeting of the Transportation Research Board Washington DC
Figure 104 Transverse joint load transfer for outermost wheelpath on WI 2 (Crovetti 1999)
161
1 0 0
9 0
8 0 y
cen 7 0
ici 6 0 f
Ef
5 0
er
f 4 0 sn
ar 3 0
Td 2 0
ao
L 1 0
0
R J D F R S S 1 E C 1 T R
T e s t S e c t io n
Oct 97 Jun 98 Nov 98
IRI
inm
i
110
100
90
80
70
60
50
40
30
20
10
0
1998 2000
C1 1E 2E 3Ea 4E 4S 3S 3Eb HF RJD GF CP C2 1E FR RJD SS TR C1
Wisconsin 2 Sections Wisconsin 3 Sections
Figure 105 Transverse joint load transfer for outermost wheelpath on WI 3 (Crovetti 1999)
Figure 106 Average IRI values in the outer traffic lanes of WI 2 and WI 3 pavement sections (Crovetti and Bischoff 2001)
162
Chapter 38 WISCONSIN 4 (I-90 Tomah)
Introduction
In September 2002 the Wisconsin Department of Transportation (WisDOT) constructed a high pershyformance concrete pavement section with a design life of 50 years with no maintenance anticipated over that period The project is located on I-90 in Monroe County immediately west of the intersecshytion with STH 16 and approximately 129 km (8 mi) west of the split in Tomah of I-90 and Ishy94 The test sections are located in the eastbound lanes with the termination of the test sections at structure B-41-111 The general project location is illustrated in Figure 107
Figure 107 Location of WI 4 project
Study Objectives
The objective of this study was to construct a pavement that would last for 50 years Specific design factors considered were
bull The use of deicing agents especially salts may cause premature pavement failure due to determination of the load transfer devices made of plain and epoxy-coated steel
bull Slab curling is also a cause of premature pavement failure One key to a long-life pavement is that the pavement is built
upon a firm foundation and remains in conshytact with such Concrete pavements respond to the environment by changing in three ways built-in curvature temperature curling and moisture warping When the slab is curled away from the foundation premature cracking may result from stresses incurred
Some of the benefits of providing this type of techshynology to Wisconsin are the anticipated lower longshyterm pavement maintenance costs and reduced rehashybilitation and replacement costs due to a longer initial service life Wisconsin is also beginning to focus on user cost delays If a longer lasting pavement is deshyveloped and placed user cost delays will decrease as well as increasing safety by reducing the exposure of construction and maintenance crews to traffic
Project Design and Layout
The test sections are located in the two eastbound lanes of I-90 The project was split into two test secshytions and one control section as follows (Kemp 2004)
bull Test section 1 is 227 m (745 ft) long with two 36-m (12-ft) lanes and tied concrete shoulders (inside shoulder 12 m (4 ft) wide and outside shoulder 3 m (10 ft) wide)
bull Test section 2 is 2423 m (795 ft) long with two 36-m (12-ft) lanes and tied concrete shoulders (inside shoulder 12 m [4 ft] wide and outside shoulder 3 m [10 ft] wide) Stainless steel dowels were used for the load transfer devices utilizing a non-corrodible basket system for the test sections Shoulders were tied to the pavement using stainless steel tie bars
bull The control section is 2423 m (795 ft) long with two 36-m (12-ft) lanes and asphaltic shoulders (inside shoulder 12 m [4 ft] wide and outside shoulder 3 m [10 ft] wide) Epshyoxy-coated dowels placed in standard steel baskets were used for load transfer at the joints
163
The current WisDOT pavement design guidelines specify a structure with the following characterisshytics will be suitable for pavements with a 20-year pavement life
bull 3048-mm (12-in) thick doweled JPCP
bull 1016-mm (4-in) open-graded base course
bull 1524-mm (6-in) dense-graded base course
The 50-year design had the following characterisshytics
bull 3429-mm (135-in) doweled JPCP
bull 1016-mm (4-in) open-graded base course (No2)
bull 1524-mm (6-in) dense-graded base course
In addition to the standard design an increased base section was engineered to carry the improved pavement section This is to provide a more static base than the standard base and original subgrade The section has the following properties
bull 3429-mm (135-in) doweled JPCP
bull 1016-mm (4-in) open-graded base course (No 20)
bull 254-mm (10-in) dense-graded base course (a two-layer system with the first 1524 mm [6 in] being a 762-mm [3-in] maximum size and the remaining 1016shymm [4-in] being a 381-mm [15-in] maximum size well graded base course)
bull 4064-mm (16-in) of breaker run
State Monitoring Activities
The test section is monitored using Wisconsinrsquos Pavement Monitoring Van This van is equipped with laser sensors to measure the profile The lashyser measurements are used to calculate an Internashytional Roughness Index (IRI) The van is also equipped with video cameras that are able to log the section of the highway of interest and later analyzed for pavement distress The results of the
analysis are used to calculate a Pavement Distress Index (PDI)
A fatigue life will be calculated based upon a back-calculated elastic module This is calculated from a FWD testing results performed on the various secshytions
Rapid chloride permeability tests will be performed at 28 90 and 365 days to indicate the concretersquos reshysistance to infiltration of salts In addition the stanshydard tests of air content slump and compressive strength will be monitored at 3 7 28 90 and 365 days Thermocouples were installed to monitor the temperature of the slab during the curing period along with documentation of the temperature of the base course
The FHWA Office of Pavement Technology will evaluate the slab in relationship to warpage and curl during the initial curing period In addition to these tests regular visual inspections will be conducted and traffic and weather data will be recorded from an automated site located near the project
Preliminary ResultsFindings
The pavement sections were constructed on Septemshyber 24 2002 The concrete was a standard mix design utilizing local materials Type I cement was used in conjunction with a Class C fly ash at a substitution rate of 25 percent Dowel bars were 381-mm (15shyin) diameter Type 316 solid stainless steel 4572 mm (18 in) long and spaced across the joints at 3048-mm (12-in) spacings The transverse joints are perpendicular and spaced at fixed 46-m (15-ft) intershyvals
The dowels were placed in baskets on the grade The baskets were constructed from stainless steel wire The wire had a diameter of 32 mm (0125 in) which made the baskets flexible To compensate for this flexibility the baskets were cut in half on the jobsite Epoxy-coated steel tie bars were then driven in the ground in front of the baskets to keep the frame from moving forward when the paver passed over them (see Figure 108) Additionally a concrete spreader deposited 15 to 23 m3 (2 to 3 yd3) of wet concrete on top of the basket assemblies prior to the slip-form paver moving over the dowel baskets Visual inspecshytion during the paving along with verification from a dowel bar locater confirmed that the dowels had
164
stayed in place Dowel baskets for future projects should be constructed with a 48-mm (01875-in) minimum diameter wire to avoid these issues
Test section 1 was paved shorter than originally planned and totaled 227 m (745 ft) A construcshytion joint extended into the test section by 152 m (50 ft) This joint is to allow the doweled JPCP to abut to the existing CRCP Stainless steel tie bars for adjoining the shoulder were used in the test sections The spacing was unintentionally altered from 30 in center-to-center spacing to 24 in censhyter-to-center spacing This caused the addition used of epoxy-coated tie bar in the last 213 m (70 ft) of test section 2
Points of Contact
Peter Kemp New ProductsNew Methods Engineer (608) 246-7953 peterkempdotstatewius
Steven Krebs Chief Pavements Engineer (608) 246-5399
David Leo Larson (608) 246-7950
Wisconsin Department of Transportation 3502 Kinsman Boulevard Madison WI 53704
Reference
Kemp P 2004 High Performance Concrete Pave-ment Construction Report Draft Report WI-04-03 Wisconsin Department of Transportation Madison
Figure 108 Stainless steel dowels and basket on WI 4 (Kemp 2004)
165
Chapter 39 FEDERAL HIGHWAY ADMINISTRATION 1 (FHWArsquos Pavement Test Facility McLean VA)
Introduction
A joint venture between FHWA and the American Concrete Pavement Association (ACPA) was initishyated in 1998 to study the design and performance of ultrathin whitetopping (UTW) overlays The reshysearch consisted of constructing eight 152-m (50-ft) test lanes of UTW placed on an existing hot mix asphalt (HMA) surface Loading of the test sections occurred between May 1998 and November 1999
Study Objectives
The objective of the study was to validate the deshysign equations and performance prediction models used in the ACPA UTW design procedure The specific research objectives were as follows
bull Evaluate UTW performance under conshytrolled wheel-loads and temperature
bull Study the effects of a range of design feashytures (thickness joint spacing and fiber reshyinforcement) on the performance of UTW
bull Measure pavement response and develop mechanistic models based on these responses
bull Verify existing models and develop new modshyels for predicting load-carrying capacity
Project Design and Layout
The test sections were loaded by two accelerated load testing machines capable of applying simulated truck loads under a controlled pavement temperashyture A single wheel load of either 10 or 12 kips was applied and the speed of the loaded tire was a conshystant 16 kmhr (10 mihr) An average of 35000 loads were applied per week The HMA was 5 years old and a range of severities of rutting were present prior to milling The HMA was milled to a depth of either 635 or 889 mm (25 or 35 in) depending on the depth of the rutting that was present The thickshyness of the overlay was equal to the milled depth so the existing elevation could be maintained The deshysign parameters for each test section are provided in Table 58 and a layout of the test sections is proshyvided in Figure 109
Table 58 Test Section Design Parameters for FHWA 1 Project (CTL 2001)
FIBERS IN DESIGN LANE NO
PCC OVERLAY THICK (IN)
HMA THICK (IN)
HMA MIXTURE BINDER1
JOINT SPACING (FT)
CONCRETE MIXTURE
12-KIP LOAD APPLICATIONS2
5 25 55 SM AC-10 4 x 4 Yes 210000
6 25 55 SM AC-20 4 x 4 No 140000
7 25 55 SM PM 3 x 3 Yes 420000
8 25 55 SM PM 3 x 3 No 350000
9 35 45 SM AC-5 6 x 6 Yes 350000
10 35 45 BM AC-20 6 x 6 No 245000
11 35 45 BM AC-5 4 x 4 Yes 455000
12 35 45 BM AC-20 4 x 4 No 350000
1SM = surface mixture BM = base mixture PM = polymer modified asphalt 2Estimated design life was calculated using ACPA design procedure based on as-built strengths overlay design thicknesses and 12-kip loads
166
ALF = accelerated loading facility LVDT = linear value displacement transducers THK = thick
Figure 109 Layout of test sections and instrumentation for FHWA 1 project (FHWA 2004)
The test sections were instrumented with between 15 and 18 dynamic strain gauges The gauges were installed near the top and bottom of the conshycrete overlay and on the surface of HMA Deflecshytions were measured in the interior of the slab and adjacent to the joint using linear variable disshyplacement transducers
State Monitoring Activities
Monitoring activities included collecting distress data and measuring faulting and roughness Deshyflections and strains induced by the applied wheel loads were also recorded Laboratory data colshylected included layer modulus values flexural strengths and bond strengths
Preliminary ResultsFindings
A summary of the performance of the test sections is provided in Table 59 Although a few of the sections exhibited significant cracking many exshyperienced very little cracking The primary types of distress documented were corner transverse and longitudinal cracks with corner cracking beshy
ing the most predominant distress A small amount of faulting along some of the longitudinal and transshyverse joints was measured but overall very little faulting developed Test sections that contained an HMA with binders having a higher penetration tended to exhibit a slightly higher level of cracking Reducing the panel size when overlaying an HMA with a soft binder tended to increase the performance of the overlay
Design recommendations based on the findings from this study are being prepared and the database of information produced will be available to the public in conjunction with a report on the contents of the database
Current Project Status Results and Findings
The cracked slabs in Lane 6 and Lane 10 were reshypaired on April 28 2000 Mostly panels with multishyple cracks or loose or missing pieces of concrete were replaced Five panels were replaced in Lane 6 and three panels in Lane 10 The steps followed in performing the repairs appear below
167
Table 59 Performance of UTW Test Sections (CTL 2001 FHWA 2004)
NUMBER OF PANELS RANGE OF RANGE OF
LANE ACTUAL NUMBER OF EXHIBITING LONGITUDINAL TRANSVERSE NO LOAD APPLICATIONS PANELS LOADED CRACKING FAULTING (IN) FAULTING (IN)
5 194500 12 kips 12 18 01-07 None
6 359000 12 kips 12 11 01-03 None
7 283500 12 kips 16 4 0-01 None
8 628000 12 kips 16 3 01-02 0-01
9 266000 12 kips 8 10 01-003 0-02
10 441000 12 kips 8 4 01-02 0-02
11 310000 10 kips 12 6 01-06 None 762630 12 kips
12 310000 10 kips 12 4 0-003 0-04 762630 12 kips
1 Identify panels to be repaired
2 Mark boundaries for saw cuts which should be at located at least 1016 mm (4 in) on the inside of each joint
3 Perform saw cuts
4 Used jackhammer to break-up slabs and to dislodge the bonded portions of the concrete overlay from the HMA
5 Remove debris and clean surface in the repair area
6 Place new concrete
7 Saw joints
The average depth of the repair area after the panels were removed for Lane 6 was 965 mm (38 in) and 1194 mm (47 in) for Lane 10 This resulted in an increase in overlay thickness of 33 mm (13 in) for the repairs in Lane 6 and 33 mm (13 in) for the reshypairs in Lane 10 More information on the repairs can be found in the report prepared by CTL (2001)
The slump air content concrete temperature and unit weight of the repair concrete were measured The compressive strength split tensile strength modulus of rupture and modulus of elasticity of
the concrete were also measured Information on the test results is available in the report prepared by CTL (2001)
Four panels were also removed from Lane 9 to investigate the removal of slabs using a small front-end loader Additional loadings were not applied to Lane 9
Additional 12-kip dual wheel loads were applied to each lane beginning 8 days after the repair and continuing until early August 2000 During this time Lane 6 accumulated 400000 load repetitions and Lane 10 427000 repetitions Two of the five panels repaired in Lane 6 exhibited cracking and two of the three panels repaired in Lane 10 cracked These cracks were primarily corner cracks
Point of Contact
James Sherwood Office of Infrastructure Research and Development Turner-Fairbank Highway Research Center 6300 Georgetown Pike McLean VA 22101 jamessherwoodfhwadotgov (202) 493-3150
168
References
Construction Technologies Laboratories Inc (CTL) 2001 UTW Pavement Repair Demonstra-tion Final Report Innovative Research Foundashytion Falls Church VA
Federal Highway Administration (FHWA) 2004 Ultra-Thin Whitetopping (UTW) Project httpwwwtfhrcgovpavement utwwebutwhtm
169
Chapter 40 Various States MIT Scan-2
Introduction
Dowel bar placement is critical for providing proper load transfer for concrete pavements Misaligned dowels can lock up the joint and cause premature failure However the ability to identify the accushyracy of dowel bar placement is difficult A new deshyvice MIT Scan-2 developed by MIT GmbH Dresshyden Germany was created for the specific purpose
of locating steel dowel and tie bars in concrete pavements Figure 110 provides a close-up view of the device (ERES 2003) In 2003 the FHWA conshyducted laboratory and field evaluation of the MIT Scan-2 technology to assess its performance in deshytermining dowel bar location It is anticipated that MIT Scan-2 will become an important monitoring tool in QAQC procedures
Figure 110 Close-up view of MIT Scan-2
Study Objectives
The objectives of this project are the following (ERES 2003)
bull Provide laboratory and field evaluashytion of MIT Scan-2 to assess accuracy and repeatability of measurements of dowel position
bull Compare MIT Scan-2 measurements with measurements of other devices such as cover meter and ground peneshytrating radar (GPR)
bull Demonstrate MIT Scan-2 to contracshytors and State DOT personnel and colshylect their comments on usability of this device
bull Develop recommendations for use of MIT Scan-2 in QAQC procedures by contractors and State DOTs and develop comprehensive training material
170
Project Design and Layout
The laboratory testing program was designed to verify the measurement accuracy determine the overall standard deviation of measurement error and identify factors affecting measurement results for MIT Scan-2 The following laboratory tests were identified (ERES 2003)
bull Determine repeatability of measurements
bull Determine the absolute measurement ershyror
bull Document that the measurements are not afshyfected by cover material or water
bull Determine the effects of common factors (variability in bar length presence of metal objects and water) encountered in the field
bull Determine the effects of dowel basketsmdash properly cut baskets only
Other than the basic objectives no specific plans were developed for the field testing since the feashysibility of field testing depends on the availability of projects (ERES 2003)
Preliminary ResultsFindings
Literature Review Summary A comprehensive literature search was conducted to evaluate various types of cover meters GPR and MIT Scan-2 in determining dowel bar alignshyment The cover meters and MIT Scan-2 were noted to have the following advantages over GPR (ERES 2003)
bull The weather conditions (dry vs wet) do not affect measurement results
bull Testing can be conducted on ldquogreenrdquo conshycrete
The main disadvantage of cover meters and MIT Scan-2 is that the presence of other metal affects the measurement results In addition to the advanshytages mentioned above however MIT Scan-2 is able to scan the entire joint and determine the loshy
cation and alignment of all dowels in one measureshyment (ERES 2003)
Laboratory Testing Results The first series of laboratory testing was completed during August 2003 Preliminary results from the laboratory testing confirmed the MITrsquos claim on the accuracy of Scan-2 (ERES 2003)
bull Depth +2 mm (00787 in)
bull Horizontal misalignment +2 mm (00787 in)
bull Vertical misalignment +2 mm (00787 in)
bull Side shift +5 mm (01968 in)
bull Repeatability +2 mm (00787 in)
With the rail fixed the measurements from one series of repeated testing had the following standard deviashytions (ERES 2003)
bull Horizontal misalignment 06 mm (00236 in)
bull Vertical misalignment 04 mm (00157 in)
bull Side shift 05 mm (00197 in)
These results are for the bars with misalignment less than 13 mm (05118 in) The variability is somewhat higher for bars with greater misalignment
Field Testing Results Limited field testing conducted in Reno Nevada showed that for dowel bars placed in baskets the presence of the metal basket interferes with the MIT Scan-2 measurement results However if the transshyport ties for the basket are cut good results can be obtained (ERES 2003) MIT is in the process of deshyveloping software that can compensate for the presshyence of the basket
Even without the basket software however the field testing results showed that MIT Scan-2 can be a useshyful tool for detecting problems with dowel placement Figure 111a shows an example of dowel basket that is pulled apart during construction resulting in seshyverely misaligned bars Figure 111b is an example of properly placed dowel basket (ERES 2003)
171
Point of Contact
Sam Tyson Federal Highway Administration Office of Infrastructure Office of Pavement Technology (HIPT) 400 7th Street SW Washington DC 20590 (202) 366-1326
Reference
ERES Consultants Inc (ERES) 2003 Use of Mag-netic Tomography Technology to Evaluate Dowel Placement Quarterly Progress Report to Federal Highway Administration
(a) (b)
Figure 111 Example sectional contour map (tomography) of electro-magnetic signal detected by MIT Scan-2 a) severely distorted basket
with bars pulled out b) properly placed dowel basket
172
APPENDIX A
TE-30 PROJECT SUMMARY TABLE
APPENDIX A TE-30 PROJECT SUMMARY TABLE
STATE AND PROJECT DESIGNATION TE-30 DESIGN FEATURES EVALUATED RANGE OF STUDY VARIABLES LOCATION
NUMBER OF SECTIONS
YEAR BUILT
PROJECT LENGTH
NO OF LANES (1-DIR)
SLAB THICKNESS BASE TYPE
JOINT SPACING
LOAD TRANSFER
JOINT SEALANT
SHOULDER TYPE
California CA 1 No Precast Post-Tension Concrete Pavement Single Application of TX Design Standards Pending 1 10 in 8 ft
Colorado
CO 1 No Thin Whitetopping Thickness (39 in 45 in 66 in) Jt Spacing (4 x 4 6 x 6 6 x 9 ft)
SH 121 Wadsworth 4 2001 4 mi 2 Varies HMA Varies No
CO 2 No Precast Concrete Repairs Const ruction Methods (Michigan amp Colorado) I-25 Loveland 1 2004 450 panels 2 12 ft Yes Yes Tied PCC
Illinois
IL 1 No Alternative Dowel Bar Materials Fiber composite bars (15 in) Epoxy coated steel bars (15 in)
I-55 SB Williamsville
4 Joints with Fiber Bars 3 control
1996 315 ft 1 1125 in JRCP BAM 45 ft
(15 ft hinges)
15 in dowels (various types)
Preformed (HP in hinge
joints)
Widened Slab + PCC Shldr
IL 2 Yes Alternative Dowel Bar Materials SealedNonsealed Joints
Epoxy-coated steel bars (15 in) Polyester and fiberglass bars (15 and 175 in) Epoxy-resin and fiberglass bars (15 in) Sealed and nonsealed Hinge Joint JRCP and Conventional JRCP
IL 59 SB Naperville 8 1997 2355 ft 3 10 in JRCP
10 in JPCP
12 in AGG over porous embankment
45 ft (15 ft hinges)
15 ft
15 to 175 in dowels (various types)
Preformed HP
None
Tied curb and gutter
IL 3 Yes Alternative Dowel Bar Materials SealedNonsealed Joints
Polyester and fiberglass bars (15 in) Vinyl ester and fiberglass bars (15 in) Cement-filled fiberglass and polyester resin tubes Carbon steel rods with stainless steel cladding (15 in) Epoxy-coated steel dowels (15 in) Sealed and nonsealed joints
US 67 WB Jacksonville
7 (5 for dowels 2 for sealing)
1999 1065 ft 2 10 in JPCP 4 in CAM II 12 in LSS 15 ft
15 in dowels (various types)
HP No Seal Tied PCC
IL 4 No Alternative Dowel Bar Materials
Cement-filled fiber composite tubes Cement-filled stainless steel tubes (15 and 175 in) Carbon steel rods with stainless steel cladding (15 and 175 in)
SR 2 NB Dixon (driving lanes
only) 5 2000 2 95 in JPCP 12 in AGG 15 ft
15 to 175 in dowels (various types)
HP Tied curb and gutter
Indiana IN 1 Yes Mixed design Low shrinkage and Low curling and warping Improve fracture properties
I-65 at SR-60 Clark County 3 2002 155 mi 3 14 in AGG 18 ft and 15 ft
(experimental) Dowels (1 in) NA concrete
Iowa IA 1a Yes PCC Mixing Times Iowa DOT and contractor mixes 45- 60- and 90-second mixing times
IA 5 Carlisle
1996
36 mi JPCP
IA 1b Yes PCC Mixing Times 30- and 45-second mixing time US 30 Carroll 1996 22 mi JPCP
IA 2 Yes Alternative Dowel Bar Materials Alternative Dowel Bar Spacings
Fiber composite (15 and 188 in at 8 and 12 in spacing) Stainless steel (15 in at 8 and 12 in spacing) Epoxy-coated steel (15 in at 12 in spacing)
US 65 Bypass Des Moines 8 1997 2432 ft 2 12 in JPCP 6 in AGG 20 ft
(skewed)
15 to 188 in dowels (various types)
HP HMA
IA 3 Yes Subgrade Stabilization Fly Ash Stoke Ash
US 151 in LinnJones Counties
4 (test sections plus
control)
2000ndash 2001 7100 m
2 lanesndash
dir
240 mm thick
pavement
Fly-ash stabilized
base 6m joint spacing Doweled
joints HP bitumishy
nous Granular
IA 4 No Alternative Dowel Bar Shapes Heavy Elliptical Bars (2084 sq in) Medium Elliptical Bars (1473 sq in) Standard Round Bars ( 15 in dia)
IA 330 21 2002 10500 ft 2 20 ft Dowels (various types)
IA 5 No Elliptical Fiber Reinforced Polymer Dowel Bars Dowel Bar Spacing (10 12 15 in) IA 330 Melbourne 3 2002 180 m 2 6 m FRP Elliptical
Dowels
STATE AND PROJECT DESIGNATION TE-30 DESIGN FEATURES EVALUATED RANGE OF STUDY VARIABLES LOCATION
NUMBER OF SECTIONS
YEAR BUILT
PROJECT LENGTH
NO OF LANES (1-DIR)
SLAB THICKNESS BASE TYPE
JOINT SPACING
LOAD TRANSFER
JOINT SEALANT
SHOULDER TYPE
IA 6 No Field Trials of Guidelines for Soil Stabilizers of Non-Uniform Subgrade Soils
Raw Hydrated amp Conditioned Fly Ash Various (pending) Various (pending)
IA 7 No Implementation of Total Environshymental Management for Paving (TEMP)
Up to 3 Implementation Sites Pending 3 Pending
Kansas
KS 1 Yes
Alternative Dowel Bar Materials Fiber PCC Alternative PCC Mix Designs Joint Sawing Alternatives Joint Sealing Alternatives Surface Texturing Two-Lift Construction
Epoxy dowels fiber composite bars and X-Flex Polyolefin fibers Lower wc mix Early-cut saws (3 types) Preformed HP and no seal Longitudinal and random tining Two-lift construction (3 types) High solids curing compound
Highway K-96 EB Haven 13 1997 61 mi 2 10 in JPCP
10 in FRCP CTB 15 ft
125 in to 2 in
dowels (various types)
X-Flex device
Preformed HP
None HMA
KS 2 Yes Smoothness Monitoring of Plastic Concrete Smoothness monitoring of plastic concrete Hutchinson KS 5 2001 12401 m 1 220 mm
Dense cement
treated base 5 m
1 frac14 in dowels at 12 in centers
Transverse-Preformed neoprene
compression Longitudinal-low modulus
hot pour
Tied concrete
Maryland MD 1 Yes PCC Mix Design
Fiber PCC
Conventional PCC Polypropylene fiber reinforced PCC Low shrinkage PCC (large coarse aggregate size)
US 50 Salisbury Bypass 3 2001 JPCP
FRCP
Michigan MI 1 No Two-Lift Construction Exposed Aggregate Surface Thick Foundation
JRCP and JPCP OGDL and LCB Subbase thickness Surface texturing
I-75 NB (Chrysler Freeway) Detroit 2 1993 21 mi 2 to 3 11 in JRCP
10 in JPCP 4 in OGDL 6 in LCB
41 ft 15 ft
125 in dowels
(variably spaced on
JPCP)
HP Preformed
PCC Shldr Widened Slab + PCC Shldr
Minnesota
MN 1 Yes Alternative Dowel Bar Materials PCC Mix Design
High performance PCC mix (high air content low wc high quality aggregate GGBFS) Stainless steel dowels (15 and 17 in) Epoxy-coated steel bars (15 in)
I-35W Richfield 5 2000 1 mi 3 134 in JPCP 5 in AGG 15 ft
15 to 17 in dowels (various types)
HP PCC
MN 2 Yes Alternative Dowel Bar Materials DoweledNondoweled Joints
PCC Mix Design
5 and 75 in JPCP High performance PCC mix with GGBFS Dowelednondoweled joints
Epoxy-coated dowels (1 and 125 in diameter) Fiber composite dowels (125 and 150 in diameter)
MnRoad Low-Volume Road
Facility Albertville 3 2000 870 ft 2 5 in JPCP
75 in JPCP 7 in AGG 5 in AGG
10 ft 15 ft
None 1 to 15 in
dowels (various types)
HP Silicone None
Widened Slab + Granular
MN 3 No Ultrathin Whitetopping Instrumented sections with varying thickness and joint spacings
MnROAD Mainline Road Facility and US 169 Albertville
9 1997 788 ft per section
3 in
4 in
6 in
Mississippi MS 1 Yes Alternative PCC Paving Material (Resin Modified Pavement)
Resin modified pavement Ultrathin whitetopping Polymer-modified HMA overlay
US 72 Corinth
4 (2 RMP 1 UTW 1 HMA) 2001 Approx
900 ft 2 2 in RMP 3 in UTW 4 in HMA
Existing HMA pavement
RMP NA UTW 3 ft HMA NA
RMP NA UTW None HMA NA
RMP NA UTW None HMA NA
Missouri MO 1 Yes Fiber PCC Slab Thickness Joint Spacing
Conventional JPCP (9 and 11 in) Steel fibers (5 6 and 9 in) Polyolefin fibers (5 6 and 9 in) 15 30 60 and 200 ft joint spacings
I-29 SB Rock Port 8 1998 39 mi 2
9 and 11 in JPCP
5 6 9 in FRCP
Underlying 9 in JRCP with 615 ft joint
spacing
15 ft 30 ft 60 ft 200 ft
125 and 15 in epoxy
coated steel dowels
HP AC
New Hampshire NH 1 Yes Definition of HPCP Design Optimization NA NA NA NA NA NA NA NA NA NA NA NA
STATE AND PROJECT DESIGNATION TE-30 DESIGN FEATURES EVALUATED RANGE OF STUDY VARIABLES LOCATION
NUMBER OF SECTIONS
YEAR BUILT
PROJECT LENGTH
NO OF LANES (1-DIR)
SLAB THICKNESS BASE TYPE
JOINT SPACING
LOAD TRANSFER
JOINT SEALANT
SHOULDER TYPE
Ohio
OH 1 Yes PCC Mix Design PCC mix with GGBFS Conventional PCC mix US 50 Athens 2 1997 105 mi 2 10 in JRCP
4 in Perm AGG
6 in AGG subbase
21 ft 15 in epoxy coated steel
bars HP PCC
OH 2 Yes Alternative Dowel Bar Materials Fiberglass bars (15 in) Epoxy coated steel bars (15 in) Stainless steel tubes filled with concrete
US 50 Athens 3 1997 378 ft 2 10 in JRCP
4 in Perm AGG
6 in AGG subbase
21 ft 15 in dowels
(various types)
HP PCC
OH 3 Yes SealedNonsealed Joints
Hot Poured Sealants Silicone Sealants Neoprene Sealants No Seal
US 50 Athens
14 (28 including replicates)
1997shy1998 20 mi 2 10 in JRCP
4 in Perm AGG
6 in AGG subbase
21 ft 15 in epoxy coated steel
bars
HP Silicone
Preformed None
PCC
OH 4 No Evaluation of nondestructive test devices for measuring the support of subgrade and aggregate base layers
Nuclear Gauge Humboldt Gauge FWD Large Load FWD Small Load German Plate
US 35 Jamesshytown 1 2000 526 mi 2 9 in JRCP
4 in drainable base 6rdquo
dense graded aggregate
Pennsylvania PA 1 Yes Evaluation of HIPERPAV
Tie Bars (YesNo) Dowel Bars (YesNo) Static Sensors (YesNo) Dynamic Sensors (YesNot)
SR 22 Murrysshyville 4 Fall 2004 210 ft 2 12 in Asphalt
Treated 15 ft Dowels (125
in when used)
South Dakota SD 1 Yes
Fiber PCC DoweledNondoweled Joints Joint Spacing
Polyolefin fiber reinforced concrete (doweled and non-doweled 65 and 8 in thick 0 25 and 35 ft joints) Conventional concrete (8 in thick 20 ft doweled joints)
US 83 Pierre 8 1996 4765 ft 1
65 and 8 in FRCP
8 in JPCP Gravel
20 ft 25 ft 35 ft None
Dowels (1 in epoxy coated
steel bars) No Dowels
HP Widened Slab + Granular
Virginia
VA 1 Yes PCC Mix Design 2 in top size aggregate with GGBFS 1 in top size aggregate with GGBFS 1 in top size aggregate with Class F fly ash
I-64 Newport News 3 1998shy
1999 238 mi 3 11 in JPCP Asphalt-treated OGDL 15 ft
125 in epoxy coated steel
bars Silicone Widened Slab
+ HMA
VA 2 Yes PCC Mix Design Steel Contents
Low shrinkage and high flexural strength mixes Various longitudinal steel contents
VA 288 Richmond
2000
CRCP NA NA NA
VA 3 Yes PCC Mix Design Steel Contents
Low shrinkage and high flexural strength mixes Various longitudinal steel contents
US 29 Madison Heights 2000 CRCP NA NA NA
Washington WA 1 No PCC Mix Design and Construction at Intersections
Evaluate rapid reconstruction of urban intersections by looking at methods to accelerate the rate of concrete strength gain methods to minimize the construction time and traffic control strategies to minimize user delay
SR 395 Kenneshywick 1 2000 Intersecshy
tion
West Virginia WV 1 No GFRP Dowel Bars
GFRP Reinforced CRCP Evaluate the potential use of GFRP dowel bars in JPCP and GFRP reinforcing for CRCP Pending
Wisconsin WI 1 Yes Surface Texturing
Random transverse tining (2 levels) Uniform transverse tining Random skewed tining (4 levels) Random longitudinal tining (2 levels) Uniform longitudinal tining
WI 29 Abbotsford
10 (+47 from
other states) 1997 10 mi 2 JPCP 17-20-18-19 ft
variable Dowels None Widened Slab + HMA
WI 2 Yes Alternative Dowel Bar Materials Alternative Dowel Bar Spacings
Fiber reinforced polymer composite dowels Solid stainless steel dowels Hollow coremortar filled stainless steel dowels Epoxy-coated dowels Dowel placement (5 layouts)
WI 29 EB Owen 13 1997 106 mi 2 11 in JPCP
2 in AGG 5 in AGG (in
place) 9 in AGG (in
place)
17-20-18-19 ft variable
15 in Dowels (various types)
None Widened Slab + HMA
NO OF STATE AND NUMBER OF YEAR PROJECT LANES SLAB JOINT LOAD JOINT SHOULDER
PROJECT DESIGNATION TE-30 DESIGN FEATURES EVALUATED RANGE OF STUDY VARIABLES LOCATION SECTIONS BUILT LENGTH (1-DIR) THICKNESS BASE TYPE SPACING TRANSFER SEALANT TYPE
WI 3 Yes
Alternative Dowel Bar Materials Alternative Dowel Bar Spacings Trapezoidal Cross Section
Conventional thickness (12 in) Variable thickness (8-11 in) Fiber composite dowels stainless steel dowels epoxy-coated steel dowels Dowel placement (2 layouts)
WI 29 Hatley 6 1997 2
11 in JPCP 8-11 in JPCP
6 in AGG 18 ft 15 in Dowels
(various types)
None Widened Slab + HMA
WI 4 Yes Alternative Dowel Bar Materials PCC Mix Design
High performance PCC mix (Class C fly ash 04 water to cement ratio) Stainless steel dowels (15) 24-36 in dense graded base
12-24 in select granular back fill
4 inches of open graded base
I-90 approx 8 mi W of split of I-90 and I-94 Monroe
County
2 test sections and 1 control
section 2002 2500 ft 2
135 in research
slab 12 in control slab
Std 4rdquo OGDL 6rdquo dense graded ndash
Mod 4rdquo open graded
drained 10rdquo dense graded
15 ft joint spacing
18 in long 15 in dia Stainless
steel
None concrete
Federal Highway
Administration FHWA 1 No Ultrathin Whitetopping Validate the design equations and performance predicshy
tion models used in the ACPA UTW design procedure
FHWArsquos Pavement Test
Facility McLean VA
8 1998ndash 1999 400 ft 1
25 in UTW
35 in UTW
(fibers varied)
HMA
3 x 3 ft
4 x 4 ft
6 x 6 ft
Various States No MIT Scan-2 Conducted laboratory and field evaluation of MIT Scan-2 Various Ongoing Ongoing
KEY
AGG = aggregate GFRP = glass fiber reinforced polymer JRCP = jointed reinforced concrete pavement PCC = portland cement concrete BAM = bituminous aggregate mixture GGBFS = ground granulated blast furnace slag LCB = lean concrete base RMP = resin-modified pavement CAM = cement aggregate mixture HMA = hot mix asphalt LSS = lime stabilized subgrade UTW = ultrathin whitetopping CRCP = continuously reinforced concrete pavement HP = hot-poured sealant NA = not applicable FRCP = fiber-reinforced concrete pavement JPCP = jointed plain concrete pavement OGDL = open-graded drainage layer
APPENDIX B
BIBLIOGRAPHIC LISTING OF PROJECT REFERENCES BY STATE
APPENDIX B
BIBLIOGRAPHIC LISTING OF PROJECT REFERENCES BY STATE
Colorado
Buch N 2002 Field Trials of Concrete Pavement Product and Process TechnologymdashPrecast Panel System for Full Depth Pavement Repairs Technical Proposal Michigan State University East Lansing
mdashmdashmdash 2003 Field Trials of Concrete Pavement Product and Process TechnologymdashPrecast Panel System for Full Depth Pavement Repairs Quarterly Progress Report Michigan State University East Lansing
Construction Technology Laboratories Inc (CTL) 2001 Whitetopping Pavements in Colorado and Revision of the TWT Design Procedure Innovative Pavement Research Foundation Falls Church VA
Sheehan M J S M Tarr and S D Tayabji 2004 Instrumentation and Field Testing of Thin White-topping Pavement in Colorado and Revision of the Existing Colorado Thin Whitetopping Procedure Report No CDOT-DTD-R-2004-12 Colorado Deshypartment of Transportation Denver
Tarr S M M J Sheehan and P A Okamoto 1998 Guidelines for the Thickness Design of Bonded Whitetopping Pavement in the State of Colorado Report No CDOT-DTD-R-98-10 Coloshyrado Department of Transportation Denver
URETEK 2004 httpwwwuretekusacom servicesstitch_in_timeindexhtm
Illinois
Gawedzinski M 1997 Fiber Composite Dowel Bar Experimental Feature Construction Report Illinois Department of Transportation Springfield
mdashmdashmdash 2000 TE-30 High Performance Rigid Pavements Illinois Project Review Illinois Departshyment of Transportation Springfield
mdashmdashmdash 2004 TE-30 High Performance Rigid Pave-ments An Update of Illinois Projects Illinois Departshyment of Transportation Springfield
Illinois Department of Transportation (IDOT) 1989 Mechanistic Pavement Design Supplement to Section 7 of the Illinois Department of Transpor-tation Design Manual Illinois Department of Transportation Springfield
Indiana
Nantung T E 2004 High Performance Concrete Pavement Indiana Public Works News Volume 5 Number 1 Anchor Media Co
Iowa
Cable J K 1998 ldquoEvaluation of Mix Time on Conshycrete Consistency and Consolidationrdquo Proceedings Crossroads 2000 Conference Ames IA
Cable J K and L L McDaniel 1998a Effect of Mix Times on PCC Properties Iowa DOT Project HR-1066 Iowa Department of Transportation Ames
mdashmdashmdash 1998b Demonstration and Field Evalua-tion of Alternative Portland Cement Concrete Pavement Reinforcement Materials Iowa DOT Proshyject HR-1069 Iowa Department of Transportation Ames
Cable J K L Edgar and J Williams 2003 Field Evaluation of Elliptical Steel Dowel Performancemdash Construction Report Iowa State University Ames
Cable J K and M L Porter 2003 Demonstration and Field Evaluation of Alternative Portland Ce-ment Concrete Pavement Reinforcement Materials Iowa DOT Project HR-1069 Iowa State University Ames
Porter M L and R J Guinn 2002 Assessment of Dowel Bar Research Project HR-1080 Final Reshyport Iowa Department of Transportation Ames
Cable J K M L Porter and R J Guinn 2003 Field Evaluation of Elliptical Fiber Reinforced Poly-mer Dowel PerformancemdashConstruction Report Iowa State University Ames
179
Porter M L R Guinn and A Lundy 2001 Dowel Bar Optimization Phases I and II Final Reshyport American Highway Technology and Center for Portland Cement Concrete pavement Technolshyogy Ames
The Transtec Group 2002 Technical Work Plan for Implementation of a Total Environmental Man-agement for Paving (TEMP) System The Transtec Group Inc Austin TX
Turner D J and J M Ruiz 2003 Final Work Plan for Implementation of a Total Environmental Management for Paving (TEMP) System The Transhystec Group Inc Austin TX
White D W 2002 Field Trials of Guidelines for Soil Stabilizers of Non-Uniform Subgrade SoilsmdashProposal Iowa State University Ames
Kansas
Kansas Department of Transportation (KDOT) 1998 High Performance Concrete Pavement K-96 Reno County 1998 Annual Report Kansas Deshypartment of Transportation Topeka
mdashmdashmdash 1999 High Performance Concrete Pave-ment K-96 Reno County 1999 Annual Report Kansas Department of Transportation Topeka
mdashmdashmdash 2002 High Performance Concrete Pave-ment K-96 Reno County 2002 Annual Report Kansas Department of Transportation Topeka
mdashmdashmdash 2003 High Performance Concrete Pave-ment K-96 Reno County 2003 Annual Report Kansas Department of Transportation Topeka
Wojakowski J B 1998 High Performance Con-crete Pavement Report No FHWA-KS-982 Kanshysas Department of Transportation Topeka
Maryland
Goulias D and C Schwartz 1999 High Perform-ance Portland Cement Concrete Pavement Project Work Plan University of Maryland Department of Civil and Environmental Engineering College Park
mdashmdashmdash 2003 High Performance Portland Cement Concrete Pavement Final Research Report Unishy
versity of Maryland Department of Civil and Envishyronmental Engineering College Park
Michigan
Buch N R Lyles and L Becker 2000 Cost Effec-tiveness of European Demonstration Project I-75 Detroit Report No RC-1381 Michigan Department of Transportation Lansing
Federal Highway Administration (FHWA) 1992 Report on the 1992 US Tour of European Con-crete Highways FHWA-SA-93-012 Federal Highshyway Administration Washington DC
Larson R M S Vanikar and S Forster 1993 US Tour of European Concrete Highways (US TECH) Follow-Up Tour of Germany and Austriamdash Summary Report FHWA-SA-93-080 Federal Highway Administration Washington DC
Smiley D L 1995 First Year Performance of the European Concrete Pavement on Northbound I-75mdashDetroit Michigan Research Report R-1338 Michigan Department of Transportation Lansing
Weinfurter J A D L Smiley and R D Till 1994 Construction of European Concrete Pave-ment on Northbound I-75mdashDetroit Michigan Reshysearch Report R-1333 Michigan Department of Transportation Lansing
Minnesota
Burnham T R 2001 Construction Report for MnRoad PCC Test Cells 32 52 and 53mdashFinal Report Minnesota Department of Transportation Maplewood
mdashmdashmdash 2003 ldquoSeasonal Load Response Behavior of a Thin PCC Pavementrdquo Proceedings Eighth International Conference on Low-Volume Roads Transportation Research Record 1819 Transportashytion Research Board Washington DC
mdashmdashmdash 2004 ldquoLoad Proximity Correlation of Dyshynamic Strain Measurements in Concrete Pavementrdquo Proceedings Second International Conference on Accelerated Pavement Testing Minneapolis MN
Minnesota Department of Transportation (MnDOT) 2000 New JPCP Test Cells at the
180
MnROAD Project Minnesota Department of Transportation Maplewood
Rangaraju P R 2003 Development of Some Per-formance-Based Material Specifications for Minne-sotarsquos High-Performance Concrete Pavement Transportation Research Board Annual Meeting CD-ROM Transportation Research Board Washshyington DC
Rettner D 1999 I-35W High Performance Rigid Pavement Work Plan Minnesota Department of Transportation Maplewood
Turgeon C 2003 Minnesotarsquos High Performance Concrete Pavements Evolution of the Practice Transportation Research Board 2003 Annual Meetshying CD-ROM Transportation Research Board Washington DC
Vandenbossche J M 2002 The Construction and Performance of Ultra-thin Whitetopping Intersections on US-169 Final Report Minnesota Department of Transportation St Paul
mdashmdashmdash 2003 Interpreting Falling Weight Deflec-tometer Results for Curled and Warped Portland Cement Concrete Pavements Thesis for the degree Doctor of Philosophy in Civil Engineering Univershysity of Minnesota St Paul
mdashmdashmdash 2003 ldquoPerformance Analysis of Ultra-thin Whitetopping Intersections on US-169rdquo Transpor-tation Research Record 1823 Transportation Reshysearch Board Washington DC
Vandenbossche J M and D L Rettner 1998 The Construction of US-169 and I-94 Experimental Whitetopping Test Sections in Minnesota Minneshysota Department of Transportation St Paul
mdashmdashmdash 1999 ldquoOne-Year Performance Summary of Whitetopping Test Sections at the MnROAD Test Facilityrdquo Proceedings International Conference on Accelerated Pavement Testing Reno NV
Vandenbossche J M and A J Fagerness 2002 ldquoPerformance Analysis and Repair of Ultra-thin and Thin Whitetopping at MnROADrdquo Transporta-tion Research Record 1809 Transportation Reshysearch Board Washington DC
Mississippi
Anderton G L 1996 Userrsquos Guide Resin Modi-fied Pavement Miscellaneous Paper GL-96-7 US Army Center for Public Works Alexandria VA
Battey R L 2002 Construction Testing and Pre-liminary Performance Report on the Resin Modified Pavement Demonstration Project Work Order Document Work Order DTFH71-99-TE030-MS-12 (State Study No 137) Mississippi Department of Transportation Jackson
Mississippi Department of Transportation (MDOT) 1999 High Performance Concrete Pavement Work Order Document Work Order DTFH71-99-TE30shyMS-12 (State Study No 137) Mississippi Departshyment of Transportation Jackson
Missouri
Chojnacki T 2004 Performance Data from MO1 Test Sections Missouri Department of Transportashytion Jefferson City
Missouri Department of Transportation (MoDOT) 2000 Test SectionsmdashUnbonded Concrete Overlay Internal Technical Summary Missouri Department of Transportation Jefferson City
New Hampshire
American Association of State Highway and Transshyportation Officials (AASHTO) 1993 Guide for Design of Pavement Structures American Associashytion of State Highway and Transportation Officials Washington DC
mdashmdashmdash 1998 Supplement to the Guide for Design of Pavement Structures American Association of State Highway and Transportation Officials Washshyington DC
Goodspeed C H 1999 High Performance Con-crete for Bridge and Pavement Applications CDshyROM (with HPCP definitions presentation files and computer program) Durham NH
Ohio
Hawkins B K A M Ioannides and I A Minkarah 2000 To Seal or Not to Seal Construc-
181
tion of a Field Experiment to Resolve an Age-Old Dilemma Preprint Paper No 00-0552 79th Annual Meeting of the Transportation Research Board Washington DC
Ioannides A M I A Minkarah B K Hawkins and J Sander 1999 Ohio Route 50 Joint Sealant ExperimentmdashConstruction Report (Phases 1 and 2) and Performance to Date (1997ndash1999) Ohio Deshypartment of Transportation Columbus
Ohio Research Institute for Transportation and the Environment (ORITE) 1998 Measurement of Dowel Bar Response in Rigid Pavement ORITE-1 Ohio Department of Transportation Columbus
Sargand S M 2000 Performance of Dowel Bars and Rigid Pavement Draft Final Report Ohio Deshypartment of Transportation Columbus
mdashmdashmdash 2001 Performance of Dowel Bars and Rigid Pavement Final Report Ohio Department of Transportation Columbus
Sargand S M W F Edwards and S Salimath 2001 Evaluation of Soil Stiffness Via Non-destructive Testing Final Report Ohio Department of Transportation Columbus
Sargand S M W Edwards and I Khoury 2002 Application of High Performance Concrete in the Pavement System Structural Response of High Per-formance Concrete Pavement Final Report Ohio Department of Transportation Columbus
South Dakota
Johnston D and D Huft 2004 Distress Survey Results of the Non-Metallic Fiber Reinforced Con-crete Pavement Test Sections on US 83 E-Mail communication from South Dakota Department of Transportation Pierre
Ramakrishnan V 1995 Evaluation of Non-Metallic Fiber Reinforced Concrete in PCC Pave-ments and Structures Report No SD94-04-I South Dakota Department of Transportation Pierre
mdashmdashmdash 1997 Demonstration of Polyolefin Fiber Reinforced Concrete in Bridge Replacement Report No 5095-22 South Dakota Department of Transshyportation Pierre
Ramakrishnan V and N S Tolmare 1998 Evaluation of Non-Metallic Fiber Reinforced Con-crete in New Full Depth PCC Pavements Report No SD96-15-F South Dakota Department of Transportation Pierre
Tennessee
Gharaibeh N G 2003 Performance-Related Specifications (PRS) Field Trial in Tennessee Quarterly Progress Report to the Federal Highway Administration
Virginia
Ozyildirim C 2000 Evaluation of High-Performance Concrete Pavement in Newport News VA Draft Interim Report Virginia Transportation Research Council Charlottesville
mdashmdashmdash 2001 ldquoEvaluation of High-Performance Concrete Pavement in Newport News VArdquo Pre-print Paper 01-3173 80th Annual Meeting of the Transportation Research Board Washington DC
Washington
Nemati K M J S Uhlmeyer L M Pierce and J R Powell 2003 Accelerated Construction of Ur-ban Intersections with Portland Cement Concrete Pavement (PCCP) Final Report Federal Highway Administration Washington DC
West Virginia
Chen H L and J H Choi 2002 ldquoEffects of GFRP Reinforcing Rebars on Shrinkage and Thershymal Stresses in Concreterdquo Proceedings of the 15th ASCE Engineering Mechanics Conference Columshybia University New York NY
mdashmdashmdash 2004 ldquoEffects of GFRP Reinforcing Re-bars on Shrinkage and Thermal Stresses in Conshytinuously Reinforced Concrete Pavementrdquo submitshyted to ACI Structural Journal American Concrete Institute Farmington Hills MI
Choi J H and H L Chen 2003 ldquoDesign Considshyerations of GFRP-Reinforced CRCP rdquo Field Appli-cations of FRP Reinforcement Case Studies SPshy215 American Concrete Institute Farmington Hills MI
182
mdashmdashmdash 2005 Development and Deployment of Second Generation FRP Composite Applied to Concrete Pavements (Task 3 Continuously Rein-forced Concrete Pavement) Draft Final Report for USDOTFHWA Project DTFH61-99-X-0078 Federal Highway Administration Washington DC
GangaRao H V S H L Chen and P V Vijay 2003 Field Implementation and Performance Evaluation of CRCP with FRP Composite Bars West Virginia University Work Plan Federal Highway Administration Washington DC
Gupta R H Rana and H V S GangaRao 2004 Moisture Diffusion through Neat and Glass-Fiber Reinforced Vinyl Ester Resin Containing Nano-Clay Draft Final Report CFC 04-102 Federal Highway Administration Washington DC
Li H 2004 Evaluation of Jointed Plain Concrete Pavement (JPCP) with FRP Dowels Masterrsquos Theshysis West Virginia University Morgantown
Vijay P V and H V S GangaRao 1999 Devel-opment of Fiber Reinforced Plastics for Highway Application Aging Behavior of Concrete Beams Reinforced with GFRP Bars CFC- WVU Report No 99-265 (WVDOH RP T-699-FRP1) West Virginia Department of Transportation Charleston
Vijay P V H V S GangaRao and H Li 2004 Evaluation of Jointed Plain Concrete Pavements (JPCP) with FRP Dowels Draft Final Report CFC 04-101 Federal Highway Administration Washingshyton DC
Wisconsin
Crovetti J A 1999 Cost Effective Concrete Pave-ment Cross-Sections Report No WISPR 12-99 Wisconsin Department of Transportation Madison
Crovetti J A and D Bischoff 2001 ldquoConstrucshytion and Performance of Alternative Concrete Pavement Designs in Wisconsinrdquo Preprint Paper No 01-2782 80th Annual Meeting of the Transporshytation Research Board Washington DC
Kemp P 2004 High Performance Concrete Pave-ment Construction Report Draft Report WI-04-03 Wisconsin Department of Transportation Madison
Kuemmel D A J R Jaeckel A Satanovsky S F Shober and M M Dobersek 1996 ldquoNoise Characshyteristics of Pavement Surface Texture in Wisconshysinrdquo Transportation Research Record 1544 Transshyportation Research Board Washington DC
Kuemmel D A R C Sonntag J A Crovetti Y Becker J R Jaeckel and A Satanovsky 2000 Noise and Texture on PCC PavementsmdashResults of a Multi-State Study Report Number WISPR-08-99 Wisconsin Department of Transportation Madison (also available at httpchtemarquetteedu noiseamptextureindexhtml)
Scofield L 2003 SR202 PCCP Whisper Grinding Test Sections Final Report Arizona Department of Transportation Phoenix
183