high lightning flash density storms in the...
TRANSCRIPT

HIGH LIGHTNING FLASH DENSITY STORMS IN THE SOUTHERN GREAT LAKES REGION
Stephen Clodman
Atmospheric Environment Service of Canada Toronto, Ontario, Canada
William Chisholm
Ontario Hydro Technologies Toronto, Ontario, CalJada
Abstract
The occurrence and causes of high flash density thunderstorms over southern Ontario and the adjoining Great Lakes are studied. The lightning data set, using magnetic direction finding, was evaluated and its accuracy estimated. Cloud-toground flash totals were then found for two warm seasons, 1989 and 1990. A large variation in flash totals and in the number of high flash density storms was found with the maximum flash density in a southwest-northeast band in southwestern Ontario. The authors have related the variability to surface differences between land and water temperature, and air circulation near the lake shoreline.
Quasi-stationary storms were found to cause most of the greatest flash densities in the data period. Therefore, four of these storms are studied in some detail. For one storm with rainfall up to 450 mm (18 in.), a good match wasfound between lightning flashes and rainfall. Lake breeze frontal zones and other lake shore convergence zones may initiate and sustain these storms, so that strong low-level wind is not needed for development. These storms are about 15 km in diameter, last up to several hours and cause heavy rainfall. Instability and moisture conditions are moderate to strong. The synoptic scale map shows the storm to be in tropical air under the subtropical high, or else near a deep low.
1. Introduction
We have begun a project to collect and study different types of thunderstonn data in Canada. The initial phase uses lightning flash data covering southern Ontario and the nearby Great Lakes. Data are collected as described below. We intend to show the variation of lightning flash density in this area, especially for high density occurrences. To further reveal the causes of flash variability, we will examine quasi-stationary stonns with high flash density and rainfall. We will also discuss the role of the Great Lakes in thunderstorm evolution, and derive forecast rules.
Lightning flash data have been applied to thunderstorm studies in a number of ways. Lopez and Holle (1986) show the strong local maxima of flash distributions in the Rocky Mountains and on the Florida coast. Flash data are used for forecast verification in Watson et al. (1991). Peckham et al. (1984) count the flashes for individual storms in the Tampa Bay area to find their typical flash rate and duration. Regarding case studies, Williams et al. (1989) and Kane (1991, 1993) show that frequent lightning from a storm signals severe weather such as downbursts and tornadoes.
Over water, the character of the water surface influences the storms. In this respect, Orville (1990) shows that the cold season flash rates are much greater over warm than over cold Atlantic
34
Ocean water. At the coast, stonns are again stimulated more effectively by warm water; thunder-day charts of Court and Griffiths (1986) show maxima along the Florida and Gulf of Mexico coasts where the water is warm, but not along the United States Atlantic coast further north where the water is colder.
Quasi-stationary (QS) thunderstonns are known to be common over Florida and some other places (U.S. Weather Bureau 1949; Peckham et al. 1984; and Fleming et al. 1984). However, strong low-level wind gives an inflow of moist air needed to sustain the storm (Newton 1963). Since stonn travel is highly correlated with the wind speed of the lower troposphere (U.S. Weather Bureau 1949), this usually implies at least moderate storm travel speed for intense storms. Thus an intense QS storm would seem to be relatively unusual and to require particular conditions to sustain it. Nevertheless, storms with low wind speed and wind shear are occasionally severe, in particular for heavy rainfall storms, as shown for China by Ping (1980). Ping shows a storm isohyet pattern over coastal China with a peak of almost 600 mm (24 in.). Although Ping does not describe the stonn motion, its small area suggests a QS storm. Kane (1993) describes a QS storm near Chesapeake Bay in the eastern United States producing up to 110 mm (4.5 in.) of rain. Fleming et al. (1984) show that many heavy rainfall storms in the northeastern United States are slow-moving. Their data show some tendency of such stonns to cluster near the Atlantic Ocean and its bays, the Great Lakes, and the Appalachian Mountains. (By Ontario practice, the severe storm definition includes heavy rainfall [Noga 1990].)
A certain number of heavy rainfall stonns close to the Great Lakes are quasi-stationary, by which we mean that the dense part of the radar echo or lightning flash moves 25 km h- I
(14 mi h- I , 7 m S-I) or less. Shenfeld and Thompson (1962) document two such storms near western Lake Ontario, each giving a peak rainfall of about 90 mm (3.5 in.). Murphy (1991) shows a storm giving 200 mm (8 in.) of rain near western Lake Erie with a small tornado. The first (local) stage of this stonn appears to be quasi-stationary. An even more remarkable event was the "Harrow" storm of 19-20 July 1989, giving up to 450 mm (18 in.) of rain with a peak 90 mm h- I (3.5 in. h- I
)
at a point near western Lake Erie. This is described by Conway and Leduc (1989), and by Leduc and Conway (1990) .
Buechler et al. (1990) show in Alabama that the cloud-toground (CG) lightning flash rate tends to increase with the rain rate, especially at storm peak time. From their data there is about 15 X 106 kg of rain for each CG flash at peak storm intensity but usually more rain per flash averaged over the storm. Buechler et al. also find that daily flash count has little correlation with wind shear. Thus, high flash density can be associated with heavy rainfall and with low vertical wind shear (Ping 1980) and QS storms. This wind shear is that on the larger scale measured by routine radiosonde ascents. However,

Volume 19 Number 1 August, 1994
46°-1-- ._ ._._
I I
44°' '1'-'-I I'Chica 0
42".
I I
illiam ~ j _ ·_ ·-t- · .
\
\ - . ~
75°
Fig. 1. Map of part of Ontario and Great Lakes with lightning detector stations shown (and with those in southern Ontario named). Canadian Shield boundary and major urban areas are shown. Box surrounds study area. Upper air stations in or near study area are identified by their standard three-letter code.
the shear on the storm scale may be different. Near shore, a lake breeze (or sea-breeze) front convergence gives a local wind shear that may provide a sustained low level inflow to sustain the storm.
We will show that the lightning flash density is highest in a band over southwestern Ontario near the southern Great Lakes. Storms there tend to have high flash counts. Lake breezes, and the proximity of warm water in summer, may be significant causes of this flash density. Severe storms with high flash count and rainfall sometimes occur here in a quasi-stationary form. We will describe some features of these storms. We will discuss the causes of these storms, suggesting that they are caused by lake effects in low-wind environments with suitable air mass conditions.
2. Lightning Data Processing
a. Ughtning data network Krider et al. (1976) establish a wideband, gated, magnetic,
direction finding (DF) method for detecting cloud-to-ground (CG) lightning from its radiated electromagnetic field. Sixteen DF receivers using this principle are located in the province of Ontario, as shown in Fig. 1. The Ontario lightning location network is operated jointly by the Ontario Ministry of Natural Resources, Ontario Hydro (the provincial electrical power utility), and the Atmospheric Environment Service of Canada. Four of the DF sites are located within the study area of 41-46°N, 77-84°W, but other nearby sites also provide data for the study area. This area is shown in greater detail in Fig. 2. Since this is the first meteorological study using this data set, we will describe the data processing in some detail.
Each DF site reports direction finder observations (DFOs) that consist of a station number, the time, the bearing to the detected flash, the number of return strokes in the flash, and the first-stroke peak radiated field. Positive flashes (carrying
Lake Huron 176m
35
Fig. 2. Great Lakes basin within study area with contours (m) of elevation and lake surface elevations above mean sea level (Botts and Krushelnicki 1987).
positive charge to ground) are distinguished from negative flashes. The DF receivers were set to high gain. Raw data were gathered from 2 May to 7 September 1989, and from 23 April to 26 September 1990, with a few gaps of up to 10 h III
the records.
b. Direction finder observations analyzed The DFOs were analyzed to give reliable stroke locations
using the following method.
1) The DFOs were sorted by time. When two or more stations registered a flash within 8 ms, these DFOs are assumed to represent the same flash and, therefore, are grouped.
2) Systematic errors in bearing for each station were determined as follows. Three or more grouped bearing lines were adjusted to cross at a single optimum flash location using the least-squares method of Orville Jr. (1987). The bearings to this computed location correct the raw DFO bearings. These corrections to the raw DFO bearings were tabulated over many groups (each group measuring one flash) . After filtering, the corrections as a function of bearing were fitted to sinusoids as in Passi and Lopez (1989).
3) The final bearing corrections were applied to two or more grouped DFOs to give a final flash location, using the Orville Jr. (1987) method.
4) The emitted signal strengths were computed from the measured peak field strengths. Here the received signal strength decays as the inverse distance from DF station to flash location. A further correction for loss of signal energy into the ground was made as in Herodotou et al. (1993).
In favorable areas of the network, the remaining uncorrected site and random errors suggest location uncertainties of less than 1 km. The error can occasionally become more than 10 km along baselines between stations, or at places far from the

r
36
stations. To reduce the number of such bad data, only data with three or more DFOs for a flash (3 + DF data) were used for this study. The 3 + OF data requirement reduces the probability of detection (PD) of a flash . Orville (1991) suggests that accepting two or more DFOs per flash (2 + DF data) gives a PD of 70%. We confirmed this for our data at Toronto using an allsky camera. The ratio of the size of 3 + DF to 2 + DF data sets is about 0.6 across the study area. Thus the 3 + DF flash densities recorded here are about 40-50% (0.6 times 70%) of the actual CG flash density.
c. Probability of detection estimated The PO for a region can be estimated from the following
statistics. Higher PD is implied by:
1) lower di stance from the region to the DF receivers;
2) lower minimum observed stroke amplitude for flashes detected in the region;
3) lower mean of the log-normal distribution of stroke amplitude in the region;
4) high er ratio of 3 + DF to 2 + DF data set size in the region; and
5) higher average number of DF receivers reporting each flash in the region.
We consider that the PD will be significantly reduced for regions for which minimum estimated stroke amplitude is more than 16 kA, since flashes of lesser amplitude are not being recorded. This occurs for distances of more than 250 km from a DF station (Lopez et aJ. 1991). The southeast and southwest corners of our study area are fUl1her than this from the nearest three DF stations. These corners had less favorable statistical values (see above) than the center of the study area. This suggests that flash densities in these corners are underestimated relati ve to the center of the area. The northeast corner of the area also had indications of lower PD, the causes of which are not clearly known.
3. Overall Flash Variability
a. Total flash count To get a broad basic picture of thunderstorm behavior in the
area we will briefly display statistics of the spatial variation of the lightning flash count. This will help show the physical storm causes acting in the area, especially those related to the Great Lakes, and so lead to the specific case studies given below.
Figure 3 gives total measured density of 3 + DF flashes. A strong maximum band of lightning density runs WSW-ENE from southeastern Michigan to north of western Lake Ontario. The fl ash count decreases greatly to the north and east. The minima in the southeast and southwest corners of Fig. 3 are likely to be due to di stance from the detectors. The minimum in the northeast corner is probably strengthened by the lower PD there (see above). On the other hand, the belt of low values to the north is close to the detector array and is thought to be reasonably accurate. Orville (1991) points out that more years of data are needed to obtain a quantitatively accurate chart of total lightning occunence, but we feel that the main maximum and minimum features of Fig. 3 are large and strong enough to be genuine. Orville (1994) di splays the average flash density for the adjoining part of the United States. Thunder-day and thunder-hour charts (Crozier et al. 1988) also show a storm maximum in southwestern Ontario, but the location-to-location
46'
41'
84'
National Weather Digest
,,::: ,' . .... '
,.
......
.... .
77'
Fig. 3. Total flash density per square kilometer per year (within annual data period) averaged over 1989 and 1990. Flash counts in this and other diagrams are cloud-to-ground and 3 + DF (see text) .
differences are not as great as for the flash count. Charts from Crozier et al. are not reliable over the lakes because of their use of land-based observed data.
The diurnal variation of the flashes varies somewhat over the area, but in general gives an overall flash maximum in late afternoon with high values extending into the evening. The diurnal variation is usually but not always stronger in the south of the area than in the north. Seasonal variation is quite strong, with a peak in June and July.
To study the high flash density storms in more detail, Fig. 4 gives locations of high flash density cases. If the indicated flash density for a grid square (0.1 degrees Latitude X 0.125 degrees Longitude) was above 0.5 km - 2 for at least one individual day, that square is marked. The locations of high storm flash densi ty are usually in the main band of high total density (Fig. 3), or over adjoining lake areas. On the other hand, locations north of 44 ON have almost no high flash density storms.
b. Physical interpretation The increase in flash density towards the south is probably
partly a latitudinal variation. In addition, the flash count is somewhat greater on the west side of the area than on the east side, which may reflect the continental effect increasing convective weather towards the center of North America. However, since the distances are only a couple of hundred kilometers, we do not think these large scale effects are the main explanations.
The lake surface temperature is predominately 10-22°C in the warm season compared with 20-30°C in the daytime for the land. Lake temperatures are detailed in Irbe (1992). Of the three lakes in the area, Lake Erie is generally warmest, Lake Ontario next warmest, and Lake Huron-Georgian Bay coldest in early summer. Lake Erie is warmest in its southwestern portion, Lake Huron-Georgian Bay is warmest in southern Lake Huron, and Lake Ontario's temperature is fairly constant from east to west.

Volume 19 Number I August, 1994
Fig. 4. Locations of high storm flash density and case studies. Grid squares marked. have at least one day in study period over 1.0 flash km - 2; those marked + have at least one day over 0.5 flash km - 2 but none over 1.0 flash km - 2• Specific quasi-stationary storm locations: open circles = storms discussed in this paper, open squares = storms (61,62) from Shenfeld and Thomson (1962) and (91) from Murphy (1991).
The lake areas do not have high annual flash density (Fig. 3), but high flash density storms sometimes occur over the warmer water (Fig. 4) . The reduced annual flash density over water seems to reflect reduced instability due to low surface temperatures. Eichenlaub (1979) finds that Lake Michigan has 14% less summer precipitation than the surrounding land. Comparing over-water areas, the highest flash density is over southwestern Lake Erie (note this density is underestimated due to distance from the detector array). Lakes Ontario and Huron have fewer total flashes and fewer high density storms (Fig. 4) than Lake Erie. Within Lake Huron-Georgian Bay, the greatest activity is towards the south. These variations all tend to show an increase of convective activity with surface water temperature, similar to the result for the Atlantic Ocean in Orville (1990) .
Figure 3 shows high total flash density over land near Lake Erie, western Lake Ontario, and southern Lake Huron, and there is a strong diurnal cycle of flash frequency there. These areas also tend to have high flash density days. Thus, lake shore circulations, such as lake breezes, may have a role in setting up convective storms.
In lake breezes, wind blowing on shore converges with the large scale wind, producing upward motion along a line, which may be near the shore or a few tens of kilometers inland (Estoque and Gross 1981). Storms are stimulated along the line of upward motion and may be severe (Chandik and Lyons 1971 ; Eichenlaub 1979). Ocean sea breezes are similar: Watson et al. (1991) find convergence to be a good predictor, and Pielke and Mahrer (1978) show numerically simulated convergence to be near storm activity. Instability and moisture would be favored by warm temperatures both of the land and the lake, and the convergence line of rising air releases instability. However,
37
Newton (1963) requires strong low-level wind, whereas lake breezes occur during light large-scale wind. It seems that if a storm remains near the lake breeze convergence zone, this convergence gives a local inflow, so that strong low-level wind on the large scale is not needed. The funneling of wind along the length of a lake can cause a similar effect; when the air reaches the downwind shore it will create a convergence zone.
4. Case Studies-Quasi-stationary Storms
a. General
While most storms in the region travel towards the northeast or southeast quadrants, some are quasi-stationary (QS), which we have defined to be motion of about 7 m s - I (25 km h - I,
14 kt) or less in any direction. Partly because these storms move slowly, they are apt to give high rainfall totals and lightning flash densities. Various specific severe QS storms are shown in Fig. 4 and discussed briefly above. Conway and Leduc (1989) and Leduc and Conway (1990) document the "Harrow" record rainfall storm of 19-20 July 1989 and its synoptic scale environment. Kane (1993) does the same for a storm near Chesapeake Bay. For our data set, the cases with the highest point lightning flash densities were 24 June, 25 July and 26 July, all in 1989. The Harrow storm, and the three high fl ash density storms, are all QS, with highest flash density located as shown in Fig. 4. These four cases are discussed below.
b. Harrow storm
The Harrow storm occurred about 0000 to 2000 UTC 20 July 1989 (2000 EDT 19 July-1600 EDT 20 July), extending from the evening to the next afternoon. Leduc and Conway (1990) state that the maximum analyzed point rainfall of 450 mm ( 18 in.) exceeds all previous records for Ontario, Michigan, and Ohio. The storm rainfall isohyets are shown in Fig. 5. Figure 6 presents the isopleths of recorded storm CG flash density (3 + OF), perhaps somewhat underestimated due to distance from the detector stations . The Harrow station (42 °02'N, 82°54'W) had a recording rain gauge that recorded 265 mm (10.5 in.) ofrain. From these data, shown in Conway and Leduc (1989), the rain rate of Fig. 7 is calculated. Figure 7 also shows a time trace of flash rate, both for the storm as a whole and for the area within 7 km of the Harrow station. Based on Leduc and Conway (1990) and on the rainfall data, we divide the storm into phases (Fig. 7).
Table 1 summarizes the upper air data for 0000 UTC 20 July. The Convective A vail able Potential Energy (CAPE) is the amount of positive energy (j kg - I) between the virtual temperature of the parcel ascent and the environment curve, with no entrainment. The parcel begins with the average temperature and dew point temperature in the lowest 3000 ft (900 m) with ascent beginning at the ground. (This definition may not be identical to some other CAPE definitions in the literature.) The Showalter Index (SI) is a parcel-environment temperature difference at 500 mb, the parcel being lifted from 850 mb (SI < 0 if the parcel is warmer than the environment). Precipitable water (PW) is the amount of water vapor in a vertical column of air. Figure 8 is a 500-mb chart and Fig. 9 a surface chart for the same time.
Since the atmospheric regimes north and south of the front are different, both Flint (FNT) to the north and Dayton (DAY) to the south are shown in Table 1. The low level (1-5 km) wind at Dayton was mainly from the south to southwest, veering and increasing with height near the ground, at about 10m s - 1
with slight wind shear. At Flint, this wind was from the east,

38
Fig. 5. Harrow storm (19-20 July 1989) rainfall isohyets (mm), based on Conway and Leduc (1989).
veering with height, with speed about 10 m s -I. Upper air conditions at 1200 UTC 20 July were similar, except that there is a vertically narrow band of 20 m s -I wind at 1.5 km at Flint, and the low layer of very light wind at Dayton is deeper. The low and frontal system shown in Fig. 8 moved slowly north during the storm period.
Leduc and Conway (1990) attribute the cause of the storm partly to synoptic scale factors (nearby low and front) and partly to lake effect. They consider that a northeast wind was funneled along the length of Lake Erie creating a convergence zone at the end of the lake where the storm formed. In addition, they suggest that a lake breeze may have contributed to the last part (Phase 3) of the storm.
The Phase 1 lightning (refer to Figs. 5-7) began 2330 UTe 19 July, and was nearly stationary on a small area. After a minimum, the flash rate increases again to start Phase 2, reaching three prominent maxima coinciding with rain rate maxima. Throughout this period the lightning area moves about 1.5 m s - 1 (3 kt) to the east. The active area at any time is about 200 km2 (80 mi2), with a few flashes scattered outside. Later the storm moved eastward more rapidly, with another flash maxi-
National Weather Digest
r .., ,
km I 10 20
'-----I...I _.....II
L ~
Fig. 6. Harrow storm lightning. Total storm flash density (units flash km - 2): solid = >2, dark hatched = 1-2, light hatched = 0.5-1. Circled plus sign indicates area of greatest positive flash density.
mum to the east, and then ceased. Phase 3 began with redevelopment again near Harrow, but less actively than Phase 2. The storm moved southward 1.5 m S - 1 (3 kt), and dissipated at 2100 UTC 20 July. Further away, 19-20 July had significant flash concentrations near southern Lake Huron, near eastern Lake Erie, and in western Ohio.
From the lightning analysis, the end of the relatively minor Phase 1 merged with the beginning of Phase 2. However, Phase 3, which caused about 40% of the rain, was an entirely separate storm. We do not know why Phase 3 formed at the same place, a feature that was essential to the record rainfall. Perhaps some remnant effect of Phase 2 was involved. The local lightning flash rate matches quite well with the rain rate for Phase 2, with short-term peaks coinciding. However, the rain rate does not coincide as well with the flash rate for the other phases .
Figures 5 and 6 show that the area of maximum rainfall is within the region west of Harrow with over 2 flashes km - 2
(peak storm density about 3 flashes km - 2). The area with over 0.5 flashes km- 2 closely matches that with more than 150 mm (6 in.) of rain. Assuming 40% probability of flash detection (see discussion above), this implies about 120 X 106 kg of rain
Table 1. Upper-air data for the 19-20 July 1989 case, taken at 0000 UTC 20 July 1989 at (a) Flint, Michigan (FNT) and (b) Dayton, Ohio (DAY). Pressure (P) is in mb, temperature (T) and dew point (TO) in DC, wind direction (UO) in degrees and wind speed (US) in m S-1 (kt in parentheses). Selected mandatory levels are shown from the ground to the tropopause. Convective indices (see text): CAPE-convective available potential energy (j kg- 1
); SI-Showalter Index; and PWprecipitable water (mm).
P T TO UO US P T TO UO US
200 -55.6 227 14 (27) 118 -63.6 255 12 (23) 250 -47.7 211 8 (16) 175 -54.1 231 28 (54) 350 -30.3 -60.3 182 6 (12) 250 -44.1 231 30 (58) 500 -9.9 -11.3 138 4 (8) 350 -26.2 -31.9 243 14 (27) 700 3.9 1.4 105 8 (16) 500 -9.9 -20.0 227 12 (23) 850 12.5 11.4 085 12 (23) 700 5.7 2.2 223 8 (16) 983 19.4 18.0 060 3 (6) 850 15.5 13.4 170 5 (10) CAPE = 0 81 = 1.9 PW = 39 971 22.5 19.7 135 3 (6)
CAPE = 227 81 = -1.6 PW = 39 (a)
(b)

Volume 19 Number 1 August, 1994
1-< 125 Z PHASE 1 PHAS ,,?
;:J : 0 I,
U 100 ~, J I"~ I ,
:c , :' I I , I , I
(/) • I I I I
-<e: 75 . I
I I I ..J I I . ~ I , I
I II
Co.l 50 :' .
1-< ::J ,-, z 25 .... ..-: .;.., - 0
()():()() ()4:{){)
I I I I ,
I I , I' , , ''. I
I I - I
" I ,
I'
OH:O()
I I'
I'. I
I I , I
I I ,
I I ,-, , ,
PHASE 3
I -12:0()
39
25{)
200 ~ E
150 ..s 1-<
100 ~
J UL Y 191 J ULY 20 TlME OF DA Y (UTe)
Fig. 7. Harrow storm flash and rainfall rates 0000 to 2000 UTC 20 July 1989. Total flash count (within box 41.4-42.6°N, 82-84°W) is dashed; Harrow station count (within 7 km) is solid. Rain rate, derived from the Harrow recording rain gauge (Conway and Leduc 1989), is in raindrop symbols. Storm phases from text are also shown.
per actual CO flash, but this ratio is somewhat less in the active part of Phase 2 (Fig. 7). This overall rain-to-flash ratio for the storm is higher than that found by Buechler et al. (1990). Kane (1993) also shows a close correspondence between storm lightning density and isohyets for a QS storm.
The pattern of positive flashes is quite interesting. The main storm area (>0.5 flashes Ian -2) has 1400 recorded flashes, all negative. However, there are about 75 recorded positive flashes scattered beyond the main storm area, with the greatest concentration 30-50 Ian north of the storm maximum (Fig. 6). This bipole type of flash pattern is discussed theoretically by Williams (1989) and for individual cases by Orville et al. (1988).
Fig. 8. Harrow storm synoptic situation-500-mb chart 0000 UTC 20 July 1989. Solid lines are height contours every 60 m and dashed lines are 1000-500 mb thickness contours every 60 m. Symbol ® in center of figure indicates storm location.
c. High flash density storms Figures 4 and 10-12 locate the 24 June, 25 July, and 26 July
high flash density events, showing the time evolution of the storms. There were few positive flashes-about 3% for 24 June and less than 0.5% for the other days-with no bipole pattern. Tables 2-4 give upper air data. Average low level (1-6 km) wind for all three cases was about 7-10 m s - I (14-20 kt) with little vertical shear (1-2 X 10- 3 sec - I) . Each day had widespread clusters of flashes separated by areas of no flashes; activity is relatively high over land in southwestern Ontario and further southwestward into the United States. Each day had a peak 3 + DF flash density of near 5 Ian - 2 (12 mi - 2) over
Fig. 9. Harrow storm synoptic situation-surface chart 0000 UTC 20 July 1989. Lines are isobars every 4 mb. Also see Fig. 8.
40
, 43.5°
. . . . . . .
~i .... t .::::.....;2:
80.5° 79.5°
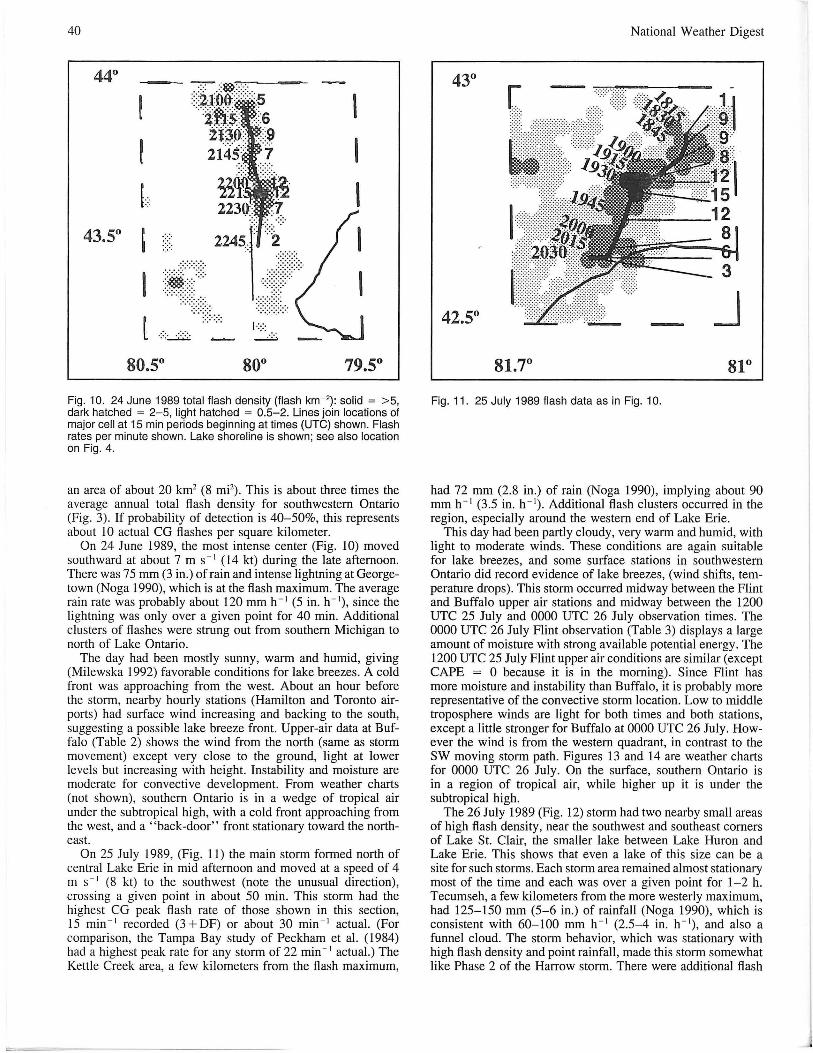
Fig. 10. 24 June 1989 total flash density (flash km - 2): solid = >5, dark hatched = 2-5, light hatched = 0.5-2. Lines join locations of major cell at 15 min periods beginning at times (UTC) shown. Flash rates per minute shown. Lake shoreline is shown; see also location on Fig. 4.
an area of about 20 km2 (8 mi2). This is about three times the
average annual total flash density for southwestern Ontario (Fig. 3). If probability of detection is 40-50%, this represents about 10 actual CG flashes per square kilometer.
On 24 June 1989, the most intense center (Fig. 10) moved southward at about 7 m S-I (14 kt) during the late afternoon. There was 75 mm (3 in.) of rain and intense lightning at Georgetown (Noga 1990), which is at the flash maximum. The average rain rate was probably about 120 mm h- I (5 in. h- '), since the lightning was only over a given point for 40 min. Additional clusters of flashes were strung out from southern Michigan to north of Lake Ontario.
The day had been mostly sunny, warm and humid, giving (Milewska 1992) favorable conditions for lake breezes. A cold front was approaching from the west. About an hour before the storm, nearby hourly stations (Hamilton and Toronto airports) had surface wind increasing and backing to the south, suggesting a possible lake breeze front. Upper-air data at Buffalo (Table 2) shows the wind from the north (same as storm movement) except very close to the ground, light at lower levels but increasing with height. Instability and moisture are moderate for convective development. From weather charts (not shown), southern Ontario is in a wedge of tropical air under the SUbtropical high, with a cold front approaching from the west, and a "back-door" front stationary toward the northeast.
On 25 July 1989, (Fig. 11) the main storm formed north of central Lake Erie in mid afternoon and moved at a speed of 4 m s - I (8 kt) to the southwest (note the unusual direction), crossing a given point in about 50 min. This storm had the highest CG peak flash rate of those shown in this section, 15 min - 1 recorded (3 + DF) or about 30 min -I actual. (For comparison, the Tampa Bay study of Peckham et al. (1984) had a highest peak rate for any storm of 22 min - I actual.) The Kettle Creek area, a few kilometers from the flash maximum,
National Weather Digest
42.5° J
Fig. 11. 25 July 1989 flash data as in Fig. 10.
had 72 mm (2.8 in.) of rain (Noga 1990), implying about 90 mm h- ' (3.5 in. h- '). Additional flash clusters occurred in the region, especially around the western end of Lake Erie.
This day had been partly cloudy, very warm and humid, with light to moderate winds. These conditions are again suitable for lake breezes, and some surface stations in southwestern Ontario did record evidence of lake breezes, (wind shifts, temperature drops). This storm occurred midway between the Flint and Buffalo upper air stations and midway between the 1200 UTC 25 July and 0000 UTC 26 July observation times. The 0000 UTC 26 July Flint observation (Table 3) displays a large amount of moisture with strong available potential energy. The 1200 UTC 25 July Flint upper air conditions are similar (except CAPE = 0 because it is in the morning). Since Flint has more moisture and instability than Buffalo, it is probably more representative of the convective storm location. Low to middle troposphere winds are light for both times and both stations, except a little stronger for Buffalo at 0000 UTC 26 July. However the wind is from the western quadrant, in contrast to the SW moving storm path. Figures 13 and 14 are weather charts for 0000 UTC 26 July. On the surface, southern Ontario is in a region of tropical air, while higher up it is under the subtropical high.
The 26 July 1989 (Fig. 12) storm had two nearby small areas of high flash density, near the southwest and southeast corners of Lake St. Clair, the smaller lake between Lake Huron and Lake Erie. This shows that even a lake of this size can be a site for such storms. Each stoml area remained almost stationary most of the time and each was over a given point for 1-2 h. Tecumseh, a few kilometers from the more westerly maximum, had 125-150 mm (5-6 in.) of rainfall (Noga 1990), which is consistent with 60-100 mm h- ' (2.5-4 in. h- '), and also a funnel cloud. The storm behavior, which was stationary with high flash density and point rainfall, made this storm somewhat like Phase 2 of the Harrow storm. There were additional flash

Volume 19 Number 1 August, 1994
83.2° 82°
Fig. 12. 26 July 1989 flash data. Flash rate is in time sequence downward for eastem cell and leftward for westem cell. Also see Fig. 10.
clusters near the lakes that day in southwestern Ontario, and in Michigan and Ohio.
This day had been partly cloudy to overcast, warm and humid, and fairly windy in most places with scattered showers in southwestern Ontario. Although the conditions were not as favorable to lake breezes as were 24 June and 25 July, an apparent lake breeze wind shift did occur at Belle River on the south shore of Lake St. Clair a few hours before the storm. Upper air data (Table 4) showed light WNW winds in the low to mid troposphere, with strong moisture and instability . The synoptic situation is similar to that of the previous day shown in Figs. 13-14, except that a weak surface trough is approaching the storm location from the west.
d. Quasi-stationary case study discussion All four storms examined above have the following features.
1) Each event happened in late spring or summer.
2) Each occurred during a period (19-27 June 1989, 19-27 July 1989) of sustained storm activity, both QS and non-QS.
3) The instantaneous flash pattern covered a circle or broad ellipse of about 200 km2 (80 mi2) with the highest flash rate recorded near the center.
4) There were more thunderstorms in the study area on the same day separated by areas of little or no activity.
5) The location of maximum flash density was over land, but within 40 km of one of the Great Lakes, and was in an area of high flash totals (Figs. 3-4).
6) Very high to extreme rainfall rates and totals occun'ed over a small area at or near the flash density maximum.
7) Wind speed and wind shear in the low to middle troposphere were relatively low (except north of the Harrow storm) keeping the storms slow-moving.
8) From their locations and behavior we believe that lake shore air circulation was likely important to some or all of the storms. Lake breezes probably occurred on all four days; in addition there was a convergence zone of along-lake wind at the Harrow
41
Table 2. Upper-air data, as in Table 1, for the 24 June 1989 case, taken at Buffalo, New York (BUF) at 0000 UTe 25 June. p
159 250 350 500 700 850 991 CAPE = 172
T
-69.1 -47.0 -27.0 -8.7
6.6 17.4 24.8
81 = 1.6
TO
-40.0 -24.8 -3.6
9.3 18.4
PW = 42
UO
336 339 344 347 357 353 190
US
20 (39) 24 (47) 18 (35) 13 (25)
6 (12) 7 (14) 3 (6)
Table 3. Upper-air data, as in Table 1, for the 25 July 1989 case, taken at Flint, Michigan (FNT) at 0000 UTe 26 July. p T
143 -68.2 250 -43.9 350 -25.4 500 -7.4 700 8.0 850 17.7 995 30.0 CAPE = 1518 81 = -0.3
TO
-35.9 -12.4
2.1 13.4 21.8
PW = 47
UO
295 263 299 294 249 276 210
US
9 (17) 12 (23) 10 (19) 4 (8) 7 (14) 5 (10) 2 (4)
Table 4. Upper-air data, as in Table 1, for the 26 July 1989 case, taken at Flint, Michigan (FNT) at 0000 UTe 27 July.
P T TO UO US
150 -65.0 273 11 (21) 250 -44.1 288 17 (33) 350 -25.3 -44.7 293 9 (17) 500 -7.3 -17.1 293 6 (12) 700 7.7 4 .2 305 5 (10) 850 17.5 16.0 282 6 (12) 992 30.1 21.1 240 3 (6) CAPE = 989 81 = - 2.6 PW = 47
storm. The resulting low-level convergences can both initiate and maintain strong convection by creating a local wind shear, even though there is little shear on the large scale. Thus Newton 's severe storm condition of strong low-level wind may not be needed; the low level inflow can be supplied by a Iakegenerated circulation.
From the upper air wind data we may draw further inferences . First, the 24 June 1989 storm was the only one for which the storm movement direction and speed were the same as the 1-6 km wind direction. We conclude that although a QS storm may move exactly with the wind, it is not safe to assume that it will do so. Mesoscale wind variations as well as the specific behavior of the lake breeze front may cause a specific storm to move differently . Second, the upper troposphere wind is not too great; if it were excessive, it would probably break up the storm prematurely.
The moisture and instability conditions cover a range from moderately suitable for convection to fairly strong. We infer that moderate large scale moisture and instability conditions are compatible with intense QS storms. Apparently the causes particular to QS storms can supplement the larger scale convec-
J

42
Fig. 13. 25 July 1989 storm synoptic situation-500-mb chart 0000 UTC 26 July 1989 as in Fig. 8.
tive conditions to produce a strong storm. The detailed moisture profile, seen in the complete upper air data, can also vary. The 0000 UTC 25 June Buffalo ascent has two thin dry layers in the lower troposphere. The 0000 UTC 20 July Dayton ascent has a deep dry layer aloft, but the simultaneous Flint ascent has high relative humidity throughout. The 0000 UTC 26 July and 27 July Flint ascents are fairly moist throughout.
The two pairs of weather charts (Figs. 8-9 and 13-14) show two basic synoptic scale weather patterns compatible with QS storms. Logically, light winds, and therefore weak pressure gradients, are required. There should be the presence of tropical air to provide heat and moisture. One way this is possible is for the upper subtropical high or a ridge connected to it to move northward over the area. At the surface, the storm location would usually be in a wedge of tropical air. Figures 13-14, for 25 July 1989, show this map type. Two of the other cases, 24 June and 26 July 1989 (not shown) are basically similar, except that a surface front (24 June) or weak trough (26 July) is approaching the location.
However, there is a second possibility, in which an upper low or trough is over the storm location, so that the pressure gradient is again weak. The corresponding surface map would place the storm near a strong low with the main front bordering the tropical air. The cyclone system would be in position to help cause the QS storm. The Harrow storm of 19-20 July 1989, shown in Figs. 8-9, is of this type. The system described by Kane (1993) is similar in that the storm is under an upper air trough and near an E-W surface trough (probably a front).
5. Summary
a. Study conclusions The average annual fl ash density for the region is highest
over southwestern Ontario, but considerably less over the lakes and less over the land to the north and northeast. Strong flash development is most likely over the land and water areas of southwestern Ontario south of 44°N. Convection is suppressed
National Weather Digest
Fig. 14. 25 July 1989 storm synoptic situation-surface chart 0000 UTC 26 July 1989 as in Fig. 9.
by cold water, but can be enhanced by lake breezes and other lake circulations producing convergence zones. For these reasons, the risk of severe events is sensitive to location.
Quasi-stationary storms with high flash density and rainfall tend to form over land beside the warmer lakes, causing high flash totals there. These storms tend to have the following features: 1) an area of about 200 km2 (80 mF); 2) they usually last about 2 h but sometimes much longer; 3) they can move slowly in any direction, and not necessarily with the wind; 4) two or more storms of varying intensity often form, separated by clear areas; 5) spatial and temporal variations in flash rate coincide fairly well with those of rain rate ; and 6) positive flash counts are fairly low, but a bipole pattern can occur (separate areas of positive and negative flashes).
b. Forecasting guidance The following factors provide guidance in forecasting these
storms. Convergence zones created by lake breezes and other lake effects can promote these storms, providing the needed low-level inflow when large-scale low-level wind shear is lacking. Wind speed is low in the lower troposphere and low to moderate higher up. Moisture and instability, as measured by standard indices, are moderate to strong, and there mayor may not be dry layers aloft. Certain periods, when the air mass has enough instability and moisture and the tropospheric wind speed is low, would be favorable for these storms. For example, an advance northward of the summer subtropical high can give the right conditions. Alternatively, QS storms can form in a deep surface to upper air low at the polar front. Because they occur in low wind speed environments, QS storms would usually occur when other types of severe storms are not expected and not occur when other types are expected.
The forecaster should watch radar or satellite charts to see whether cloud formations tend to stagnate, and if so, whether convective growth is occurring near the lake shores. Then he or she should be alert to the development of small, high intensity radar echoes or lightning flash patterns; these can occur quite rapidly .

Volume 19 Number 1 August, 1994
c. Follow-on study
We have validated our Ontario lightning data set so that it might be used for present and future research. More generally, we have shown the use of lightning data in defining storm variability in a region and studying specific cases. We hope in the future to improve the lightning data to make it more accurate and cover more area and more years. Weare broadening the study of quasi-stationary storms to include radar data at various heights to see if the variations of radar echo strength coincide with those of lightning flash rate. This should provide clues about the physical processes involved, and improve short-range forecasting. Moreover, one might examine Doppler radar and satellite images might be examined for further evidence of coincident lake breeze fronts, and to help establish the reason for storm growth in specific places.
Authors
Stephen Clodman is a Research Scientist with the Atmospheric Environment Service of Canada. He obtained a Bachelor's degree in Applied Mathematics from the University of Waterloo, Ontario, Canada (1968), a Master's degree in Geophysical Fluid Dynamics from Princeton University, New Jersey, U.S.A. (1971), and a Ph.D. in Environmental Fluid Mechanics from the University of Waterloo (1975). His responsibility is research in support of weather forecasting and other applications. His past projects have included pattern study of surface pressure fields and lake wind wave modeling. His present work involves bringing together different types of Canadian thunderstorm data and using this data for specific studies. He is a member of the American Meteorological Society and of the International Association for Great Lakes Research. He is the chairman of the Canadian Lake Meteorology Group (informal group of Canadian scientists studying this subject).
William Chisholm is an Engineer/Scientist at Ontario Hydro Technologies. He obtained a BASc with honors in Engineering Science from the University of Toronto, Ontario, Canada (1977), an M.Eng. in Electrical Engineering from the University of Toronto (1979), and a Ph.D. in Electrical Engineering from the University of Waterloo (1983). His research interests include lightning, electrical transients, grounding, and electrical insulation performance under severe conditions. He is a Registered Professional Engineer (Ontario) and is a Senior Member of the Institute of Electrical and Electronics Engineers.
References
Botts, L., and B. Krushelnicki, 1987: The Great Lakes. An environmental atlas and resource book. U.S. Envir. Prot. Agency, Chicago, IL, and Environment Canada, Toronto, ON, 44 pp.
Buechler, D. E., et aI., 1990: Lightning/rainfall relationships during COHMEX. 16th COil! Severe Local Storms and Con! on Atmos. Elect., Preprints, Amer. Meteor. Soc., Boston, MA, 710-714.
Chandik, J. F., and W. A. Lyons, 1971: Thunderstorms and the lake breeze front. 7th Con! on Severe Local Storms, Preprints, Amer. Meteor. Soc., Boston, MA, 218-225.
Conway, F. 1., and M. 1. Leduc, 1989: The HaITOW event. Atmos. Envir. Serv., Toronto, Ont. Region Tech. Note, ORTN-89-7, 12 pp.
Court, A., and J. F. Griffiths, 1986: Thunderstorm climatology. Thunderstorm MOl1J/wlogy and Dynamics, 2nd edit., E. Kessler, Ed., Univ. of Oklahoma Pr., Norman, OK, 9-39.
Crozier, C. L., et a!., 1988: Some observations and characteristics of lightning ground discharges in Southern Ontario. Atmos.-Ocean, 26, 399-436.
43
Eichenlaub, V., 1979: Weather and climate of the Great Lakes region. U. of Notre Dame Pr., Notre Dame, IN, 335 pp.
Estoque, M. A., and J. M. Gross, 1981: Further studies of a lake breeze. Part II: Theoretical study. MOil. Wea. Rev., 109,619-634.
Fleming, E., et a!., 1984: Characteristics of eastern region convective flash flood events in GOES imagery. 10th Con! Weather Forecasting and Analysis, Preprints, Amer. Meteor. Soc. , Boston, MA, 409-417.
Herodotou, N., et a!., 1993: Distribution of lightning peak stroke CUITents in Ontario using an LLP system. IEEE Transact. on Power Delivery, 8, 1331-1339.
Irbe, G. J., 1992: Great Lakes suiface water temperature climatology. Atmos. Envir. Servo of Canada, Toronto, ON, Climatological Studies No. 43, 215 pp.
Kane, R. J., 1991: Correlating lightning to severe local stonns in the Northeastern United States. Wea. Forecasting, 6, 3-12.
_____ , 1993: Lightning-rainfall relationships in an isolated thunderstorm over the mid-Atlantic states. Nat. Wea. Dig., 18, 3,2-14.
Krider, E. P., et aI., 1976: A gated wideband magnetic direction finder for lightning return strokes. 1. Appl. Meteor., 15, 301-306.
Leduc, M. J., and F. J. Conway, 1990: The Harrow event July 19-20, 1989. 16th Con! Severe Local Storms and COil! on Atmos. Elect., Preprints, Amer. Meteor. Soc., Boston, MA, 648-651.
Lopez, R. E., and R. L. Holle, 1986: Diurnal and spatial variability of lightning activity in northeastern Colorado and central Florida during the summer. Mon. Wea. Rev., 114, 1288-1312.
_____ , et a!., 1991: Comparison of signal strength of positive and negative c1oud-to-ground lightning flashes in northeastern Colorado.l. Geophys. Res., 94, 13319-13328.
Milewska, E., 1992: The lake breeze in near shore wind forecasting . Atmos. Envir. Servo of Canada, Toronto, Ont. Region Tech. Note, ORTN-92-4, 43 pp.
Murphy, B. P., 1991: Tornado and flash flood in Southwestern Ontario on 31 May, 1991. Atmos. Envir. Serv. of Canada, Toronto, Ont. Region Tech. Note, ORTN-91-3, 8 pp.
Newton, C. W., 1963: Dynamics of severe convective storms. Severe local storms, Amer. Meteor. Soc. Meteor. Monogr., 5, 27, 33-58.
Noga, T., 1990: The Ontario Weather Centre summer severe weather season and program-1989. Atmos. Envir. Servo of Canada, Toronto, Ont. Region Tech. Note, ORTN-90-1, 24 pp.
Orville, R. E., Jr., 1987: An analytical solution to obtain the optimum source location using multiple direction finders on a spherical surface. 1. Geophys. Res., 92, 10877-10886.
Orville, R. E., 1990: Winter lightning along the east coast. Geophys. Res. Lett., 17,713-715.
_____ , 1991: Lightning ground flash density in the contiguous United States-1989. Mon. Wea. Rev. , 119,573-577.
_____ , 1994: Cloud-to-ground flash characteristics in the contiguous United States: 1989-1991. 1. Geophys. Res., 99, 10833-10841.
_____ , et a!., 1988: Bipole pattern revealed by lightning locations in mesoscale storm systems. Geophys. Res. Lett., 15, 129-132.
Passi, R. M., and R. E. Lopez, 1989: A parametric estimation of systematic en'ors in networks of magnetic direction finders. 1. Geophys. Res., 94, 13319-13328.

44
Peckham, D. W., et aI., 1984: Lightning phenomenology in the Tampa Bay area. 1. Geophys. Res., 89, 11789-11805.
Pielke, R. A., and Y. Mahrer, 1978: Verification analysis of the University of Virginia three-dimensional mesoscale model prediction over south Florida for 1 July 1973. Mon. Wea. Rev., 106, 1568-1589.
Ping, Z. X., 1980: Severe storms research in China. Bull. Amer. Meteor. Soc., 61, 12-21.
Shenfeld, L., and F. D. Thompson, 1962: The thunderstorms of August 9th, 1961, at Hamilton, Ontario. Meteor. Branch of Canada (now Atmos. Envir. Servo of Canada), Toronto, ON, CIR-3683, TEC-417, 24 pp.
CD-ROM SOURCEBOOK
FOR THE ATMOSPHERIC, . OCEANIC, EARTH 'SPACE SCIENCES 1994 Edition
National Weather Digest
U.S. Weather Bureau, 1949: The thunderstorm. Report of the thunderstorm project. U.S. Weather Bureau, Washington, DC, 287 pp.
Watson, A. J., et aI. , 1991: Surface wind convergence as a short term predictor of cloud-to-ground lightning at Kennedy Space Centre. Wea. Forecasting, 6, 49-64.
Williams, E. R., 1989: The tripole structure of thunderstorms. J. Geophys. Res., 94, 13151-13167.
_____ , et aI., 1989: The relationship between lightning type and convective state of thunderclouds. J. Geophys. Res., 94, 13213-13220.
J