high-level meeting of regional associations of … · powers of cre. constitutional existence and...
TRANSCRIPT

Guillermo Zúñiga Martínez
Commissioner
Regulatory Commission of Energy
July 11th , 2017
Budapest, Hungary.
Opinions are sole responsibility of the speaker, only for informative matters, and by no means express an official position with respect to the subjects to be discussed within the scope of the Regulatory Energy Commission.
“The new framework for distributed generation in Mexico”
5th High-Level Meeting of Regional Associations
of Emerging Markets

The special report of the International Energy Agency, "Mexico Energy Outlook", compares the estimated benefits of the Energy
Reform to 2040, with a scenario without reform
Oil production would be about 1 mb/d lower than in the “With Reform” scenario;
Electricity rates for industrial consumers would be 14% higher by 2040;
The cost of generating and delivering electricity to the residential sector would be 16% higher; The additional cumulative subsidy would be USD 50 billion;
Economy of Mexico would be 4% lower.
Oil and gas production will increase and imports of petroleum products will decline;
Lower electricity rates for industrial consumers;
Subsidies will be phased out by 2035;
The economy of Mexico will double, be more efficient and its energy intensity will improve;
Mexico would not meet its clean energy objectives and its objectives for reducing GHG emissions;
Mexico will achieve its 35% clean energy generation objective by 2024 and reduce its GHG emissions;
Energy efficiency standards will significantly reduce Mexico's energy consumption.
With Reform Constitutional
× Without Reform Constitutional
Source: https://www.iea.org/publications/freepublications/publication/MexicoEnergyOutlook.pdf
CRE’s nature and
powers

The energy reform deeply modified the nature and powers of CRE.
Constitutional existence and powers;
7-years staggered appointments;
Independence from central government
Budgetary autonomy;
Subject to rigorous contact rules;
Acts subject to maximum transparency;
Board of directors: 7 Commissioners, appointed by the President and confirmed by
the Senate.
7 Commissioners Immovables through their
periods
CRE’s new features

Hyd
rocarb
on
s
Ele
ctr
icit
y
Exploration/
Extraction Refining/
Processing
Transportation Storage Distribution Commercialization
and retail Transportation
Generation ISO
Transmission Distribution
Supply and
commercialization
ISO
5
The reform allows to carry out new activities by the private sector, through different schemes…

1st auction: USD 2.6 billions
auction : USD 4 billions
Generation: USD 98.7 billions
Transmisión: USD 15.3 billions
Distribución: USD 17.7 billions*
Round 1:
1st bidding round: USD 2.7 billions
2nd bidding round: USD 3.1 billions
3rd bidding round : USD 1.1 billions
4th bidding round : USD 34.4 billions
Trión: 11.0 billions
Round 2:
1st bidding round: USD 8.2 billions
2nd bidding round: USD 5.0 billions
3rd bidding round: USD 1.0 billions
Sísmic: USD 2.5 billions
NG Pipelines: USD 16 billions
Fuels pipelines: USD 16 billions
• Transportation & Storage: USD 4.0 billions
• Distribución y Expendio: USD 12.0 billions
Exploration and Extraction:
Round 1&2 Natural Gas and Fuels
Electricity
* Estimated investment by Prodesen 2016- 2030. Source: Secretaría de Energía
A total of 88 companies –from 19 different countries- have been
awarded with contracts for the development of hydrocarbons and
electricity projects.
…resulting in important investments in every activity in the energy sector.
Inversión comprometida:
U70 mil millones de dólares
Estimated investment:
USD 239 billions Value of auctions/contracts entered into :
USD 78.2 billions

Renewables & Distributed
Generation

The trend of global investment is towards renewable energies
Global investment by energy source in 2016
68%
32%
Renewables Conventional Energy

Source: World Energy Outlook 2016
At a global level, renewables will become the most important fuels in the period 2015-2040.
MTOE: Million Tonnes of Oil Equivalent

Where is the investment growth taking place in LatAm?
Source: Latin America Energy Review
Wind & solar energy investments in Mexico will represent 40% and 57% of the total invested in the region
for the 2017-2020 period, respectively.

Source: Sener
Combined Cycle 50%
Conventional Thermal
[PORCENTAJE]
Coal-fired 11%
Turbo Gas 4%
Renewables 23%
Combined Cycle 36%
Coal-fired 2%
Renewables 62%
2015 2030
An important increase in the use of renewables for the period 2015-2030, will be held in Mexico.
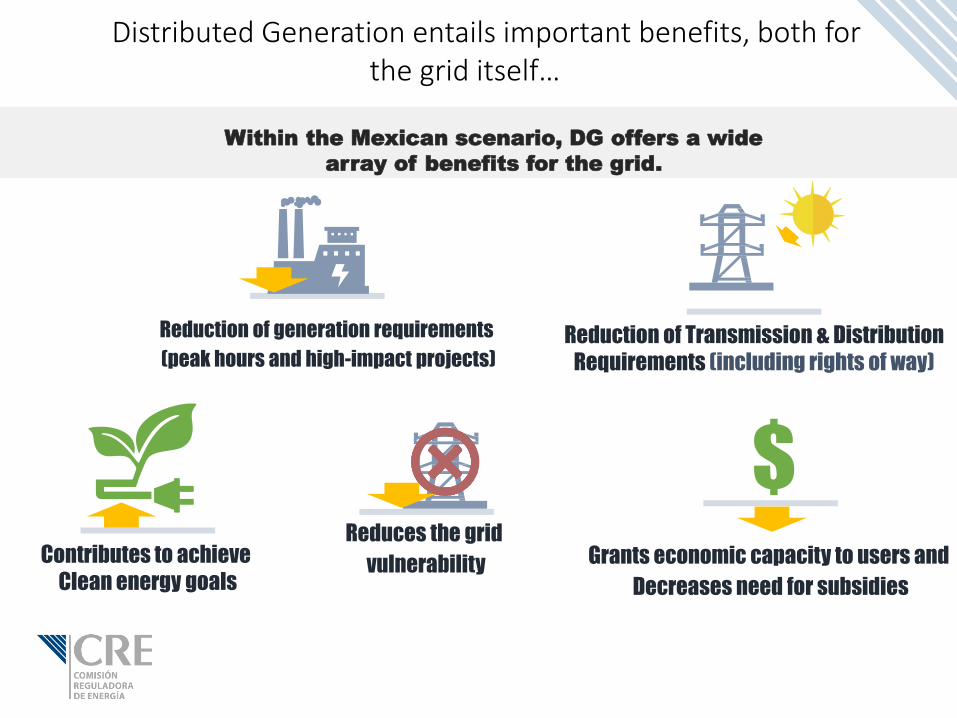
Distributed Generation entails important benefits, both for the grid itself…
Reduction of Transmission & Distribution
Requirements (including rights of way)
Grants economic capacity to users and
Decreases need for subsidies
Reduction of generation requirements
(peak hours and high-impact projects)
Contributes to achieve
Clean energy goals
Reduces the grid
vulnerability
Within the Mexican scenario, DG offers a wide
array of benefits for the grid.

…as well as for those subjects who are directly benefited from carrying out this activity.
Small
generators will
be able to
interconnect
their power
plants to the distribution grid
Regulatory
simplification
Simple and
straigthforward
contracts
Reduction of
response
terms
(Maximum
term of 18
days)
Technical and
administrative
guidelines in
favor to the
user
New
compensation
models (Net-
metering, Net
billing and Total Sale )
DG benefits for the users that invest in DG
18
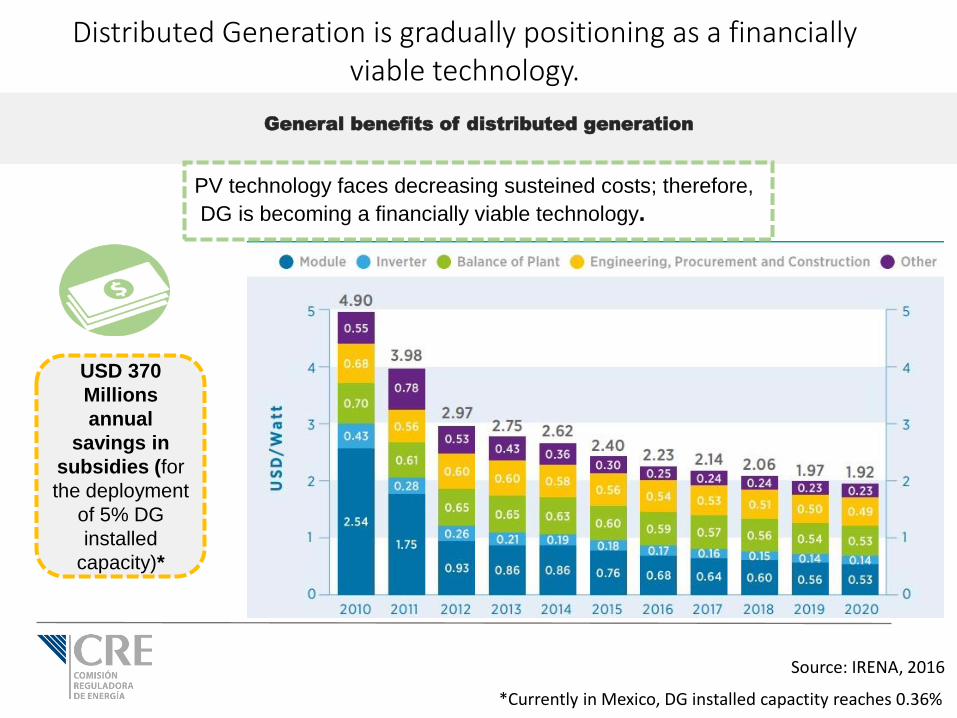
USD 370
Millions
annual
savings in
subsidies (for
the deployment
of 5% DG
installed
capacity)*
Distributed Generation is gradually positioning as a financially viable technology.
Source: IRENA, 2016
*Currently in Mexico, DG installed capactity reaches 0.36%
General benefits of distributed generation
PV technology faces decreasing susteined costs; therefore,
DG is becoming a financially viable technology.

The potential of distributed generation in Mexico is important, due to the geographic and climatological conditions of the country.
Average daily solar radiation in Mexico
5.5 kWh/m2
per day
Annual average
irradiation
GD Installed
capacity
GD Installed
capacity
247 MW 7,200 MW
Evolution of solar panel costs (1977-2013)
Fuen
te: C
lean
tech
nic
a
6 kWh/m2
per day
Annual average
irradiation

The development of small-scale photovoltaic installations is increasing...
Own elaboration with data provided by the CFE. * Cut-off date as of December 31, 2016
0.003 0.021 0.121 0.667 3.8 10.2 14.2
32.7
55.6
130
0.024 0.145 0.812 4.6 14.8
29.1 61.8
117.5
247.6
2007 2008 2009 2010 2011 2012 2013 2014 2015 2016
Installed capacity (MW)
Capacidad instalada (Anual)
Capacidad Instalada (Acumulado)
70% 134%
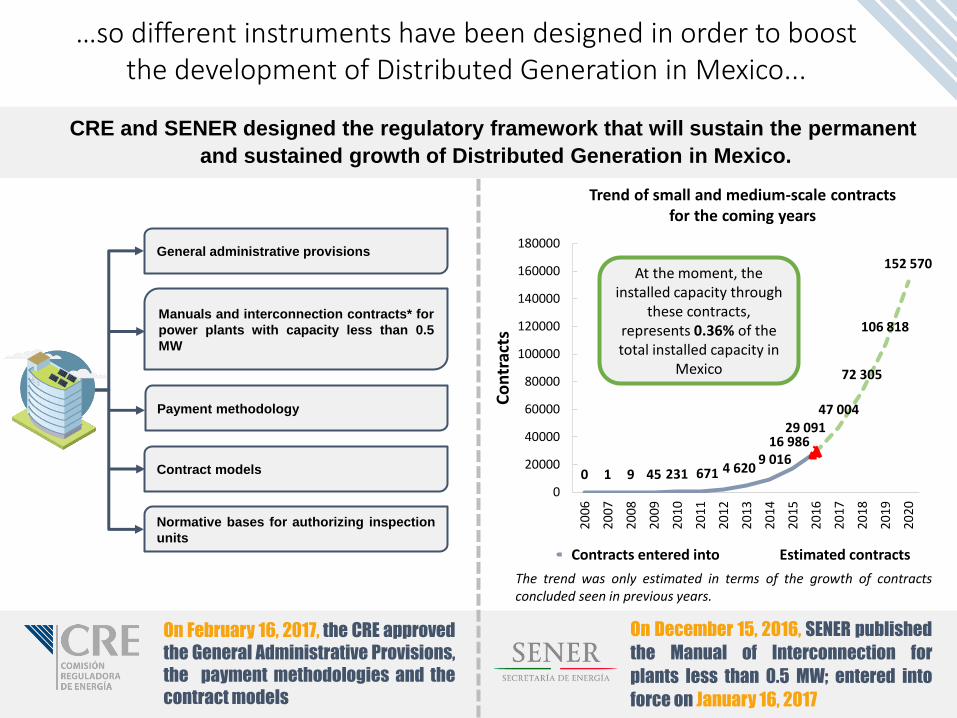
General administrative provisions
Normative bases for authorizing inspection
units
Manuals and interconnection contracts* for
power plants with capacity less than 0.5
MW
Payment methodology
Contract models 0 1 9 45 231 671 4 620 9 016
16 986 29 091
47 004
72 305
106 818
152 570
0
20000
40000
60000
80000
100000
120000
140000
160000
180000
200
6
200
7
200
8
200
9
201
0
201
1
201
2
201
3
201
4
201
5
201
6
201
7
201
8
201
9
202
0
Co
ntr
acts
Celebrated contracts Estimated contracts
…so different instruments have been designed in order to boost the development of Distributed Generation in Mexico...
CRE and SENER designed the regulatory framework that will sustain the permanent
and sustained growth of Distributed Generation in Mexico.
Trend of small and medium-scale contracts for the coming years
On February 16, 2017, the CRE approved
the General Administrative Provisions,
the payment methodologies and the
contract models
On December 15, 2016, SENER published
the Manual of Interconnection for
plants less than 0.5 MW; entered into
force on January 16, 2017
The trend was only estimated in terms of the growth of contracts concluded seen in previous years.
Contracts entered into Estimated contracts
At the moment, the installed capacity through
these contracts, represents 0.36% of the total installed capacity in
Mexico
Stage 1:
Upgrading
of the grid
Stage 2:
Integration
Stage 3: DG Markets
Low adoption
level
Moderate level
of penetration
High level of
penetration
Neccesity of implementing regulatory
Instruments and modernizing the grid
Optimized integration of GD;
management systems
Transactional market
Time
Pe
ne
tra
tio
n le
ve
l
5 %
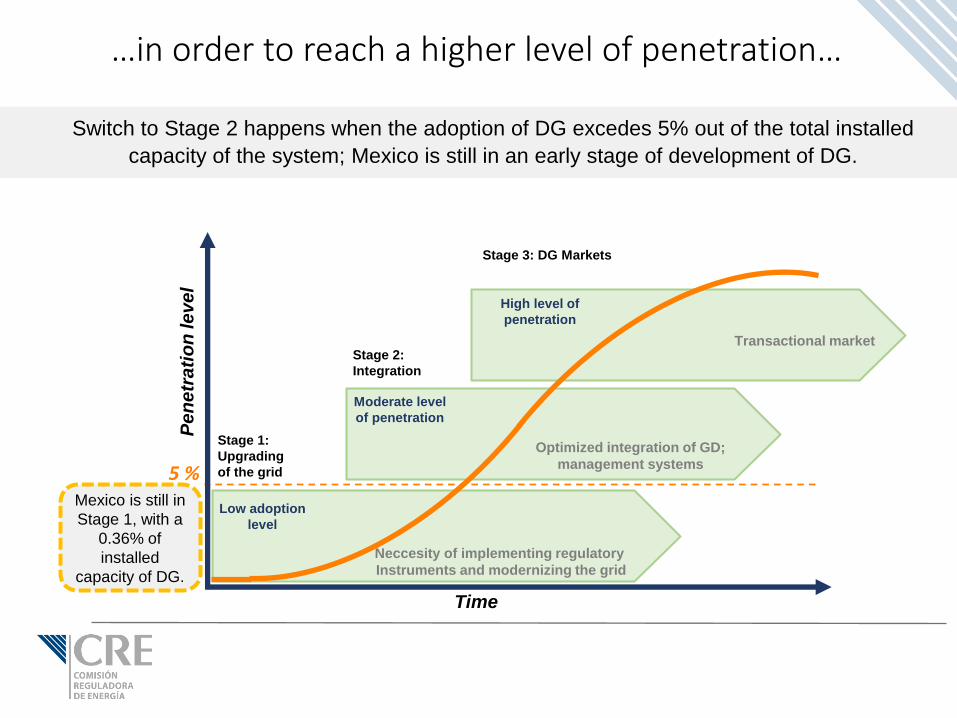
…in order to reach a higher level of penetration…
Mexico is still in
Stage 1, with a
0.36% of
installed
capacity of DG.
Switch to Stage 2 happens when the adoption of DG excedes 5% out of the total installed
capacity of the system; Mexico is still in an early stage of development of DG.

…by establishing more and better payment schemes, among other instruments.
Bi-directional meter
Excess energy
accumulates in favor of
the generator
Missing energy is
compensated with
accumulated energy
Exchange
In case of exhausting the
credit in favor is charged at
the applicable rate
Alternatively to Net Metering, the user can choose between the following schemes:
Net Metering
Energy delivered to the General Distribution Network
Energy delivered by the Basic Supplier
Net Billing
Energy delivered to the General Distribution Network
Total sale of electric energy
SSB
RGD
SSB
RGD
SSB
RGD


5.3 millions per year
(84.6% of the requested)
First Long term
aucion
$14.6 USD per CEL
Weighted price (aprox.) Second Long term
auction
9.3 millions per year
(87.3% of the requested)
$14.3 USD per CEL
Weighted price (aprox.)
Legacy Power Plants that generate electricity from Clean Energies
operating before August 11, 2014, as long as they have carried out a project
to increase their production of Clean Energy.
Clean Power Plants that have capacity that has been excluded from a
Legacy Interconnection contract in order to be included in an
Interconnection Contract in the terms of the Law.
Clean Power Plants operating after August 11th, 2014.
Who has the right to receive CEL?
...which generate incentives to all participants of the electric industry.
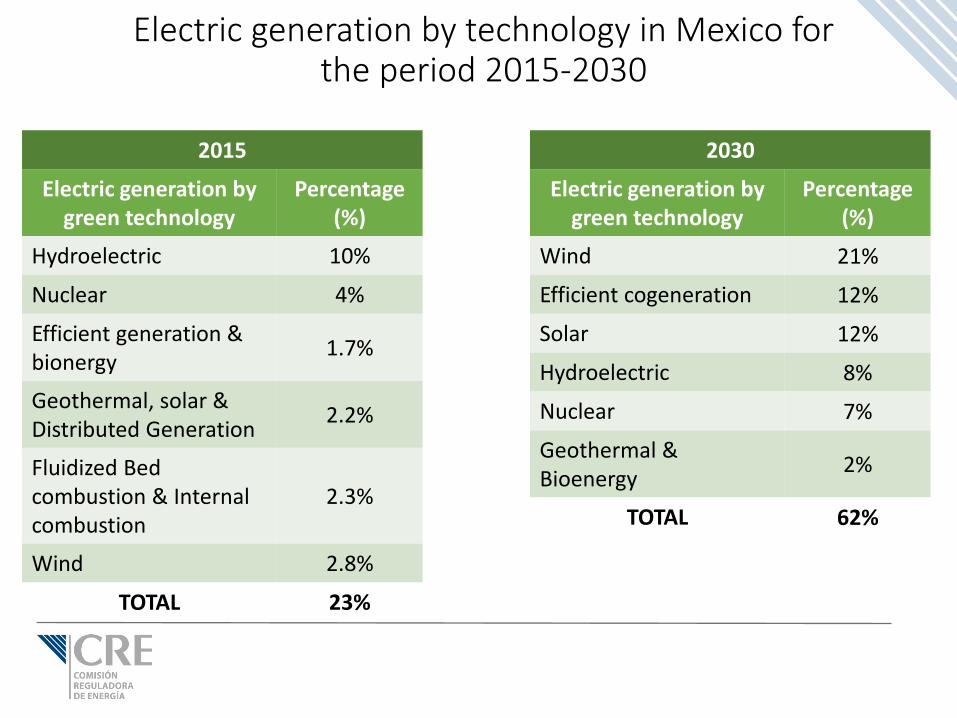
2015
Electric generation by green technology
Percentage (%)
Hydroelectric 10%
Nuclear 4%
Efficient generation & bionergy
1.7%
Geothermal, solar & Distributed Generation
2.2%
Fluidized Bed combustion & Internal combustion
2.3%
Wind 2.8%
TOTAL 23%
Electric generation by technology in Mexico for the period 2015-2030
2030
Electric generation by green technology
Percentage (%)
Wind 21%
Efficient cogeneration 12%
Solar 12%
Hydroelectric 8%
Nuclear 7%
Geothermal & Bioenergy
2%
TOTAL 62%

…which will generate better conditions to develop this activity, than those prevailing prior to the Reform.
Consideration
GD 2.0 GD 1.0
Small scale< 1 kV
Residential up to 10 kW
Commercial up to 30 kW
Medium scale< 69 kV
General in mid-voltage
< 500 kW
Small scale from 1 kV
Up to 50 kW
Medium scale from 34.5 kV
< 500 kW
Storage is allowed
Interconnection
Simplified contracts
Interconnection
Compensation
Net Metering
Excess energy is accumulated for the
following billing periods
Accumulation for 12 months
No possibility of selling excess energy
after 12 months.
Generation
capacity
Contracts
Interconnection
Net Metering Excess energy is accumulated for the following
billing periods; after 12 months, excess energy is
sold at the average LMP
Net Billing
Total sale
Typical model
Typical models which simplify interconnecion
and allow several commercial activities for
different users profiles
Obligation for the distribuitor to allow
interconnection.