high-level development tools - eecs instructional support
TRANSCRIPT
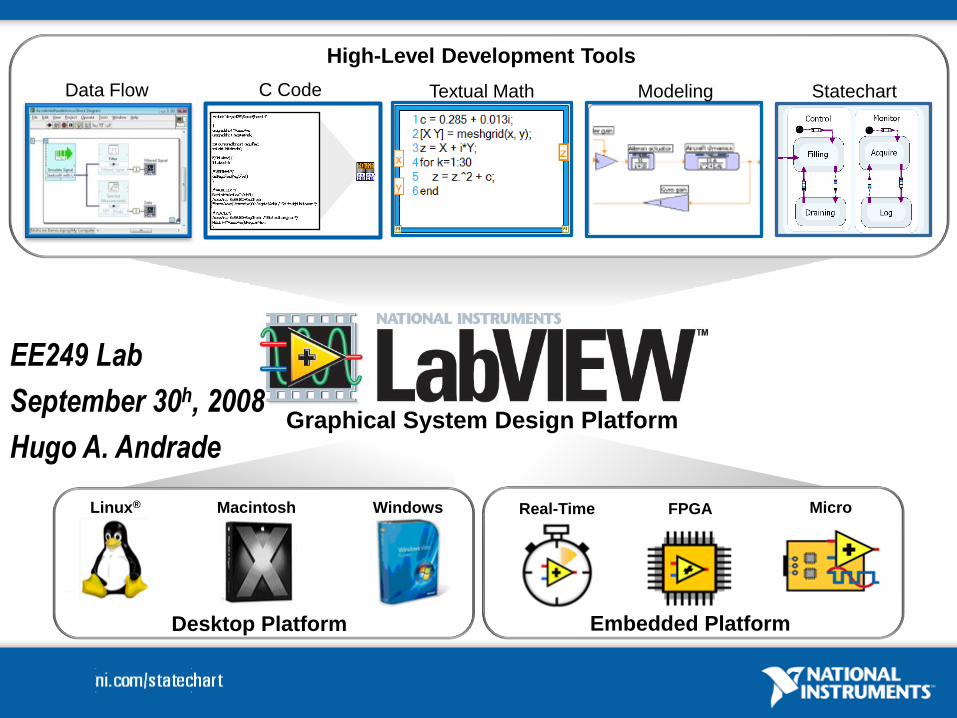
High-Level Development Tools
Data Flow C Code Textual Math Modeling Statechart
Graphical System Design Platform
MacintoshLinux® Windows Real-Time FPGA Micro
Desktop Platform Embedded Platform
EE249 Lab
September 30h, 2008
Hugo A. Andrade

•Hardware and
Driver Software
Virtual Instrumentation
•Application
Software
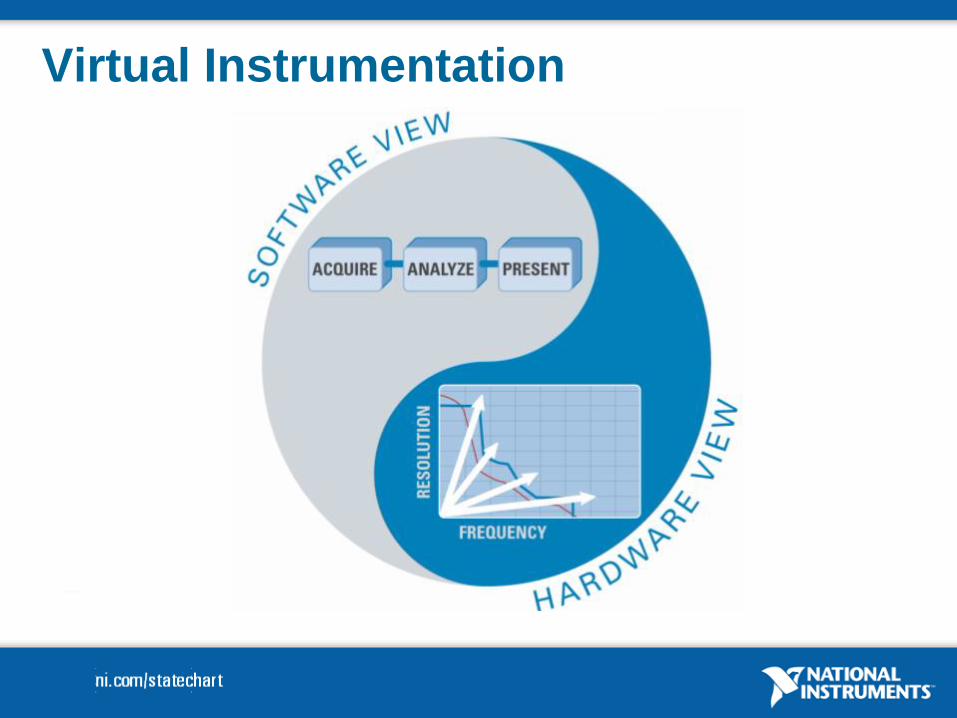
Virtual Instrumentation

Graphical Programming
Configuration
Textual Math
Modeling & Simulation
Statecharts
Graphical System Design Platform

Graphical System Design Platform
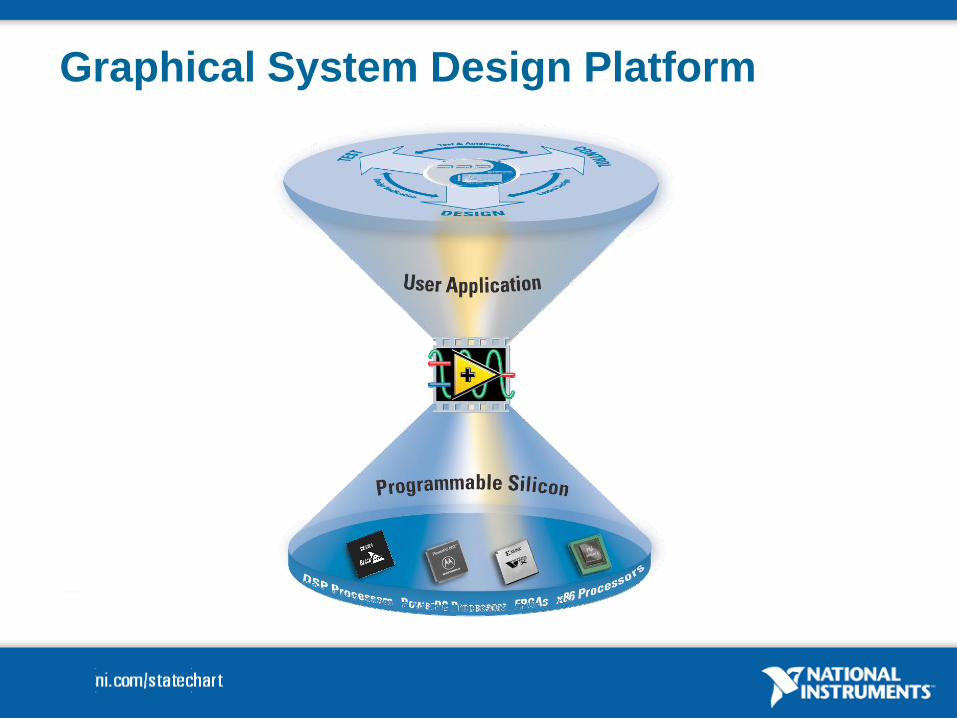
Graphical System Design Platform

Graphical System Design Platform
Graphical Programming
Configuration
Textual Math
Modeling & Simulation
Statecharts

The G (LabVIEW) Language Model
• Homogenous dataflow language Structured case (switch, select) and loops
• “Structured dataflow”
• Run-time scheduling Explicit task level parallelism Implicit parallelism heuristically identified
• Synthesizable language To machine code on x86 and PPC processors To VHDL for FPGAs To C for embedded processors
• Turing complete

Evolution of LabVIEW Backend
Technologies
•VHDL
•OEM
Synthesis
PAR
•FPGA
•Intermediate Code •Compiler •Hardware Target
•None
•(Machine Code)
•LabVIEW
•Real-Time
•Wintel
•PowerPC
•None
•(Object Library)
•LabVIEW
•DSP•DSP
•C •Any•Any 32-bit
•MPU

What is LabVIEW FPGA
Reconfigurable I/O (RIO) Hardware
• LabVIEW FPGA Module

Enforcing Dataflow in FPGA

Developing Applications with the
NI LabVIEW Statechart Module

High-Level Development Tools
Data Flow C Code Textual Math Modeling Statechart
Graphical System Design Platform
MacintoshLinux® Windows Real-Time FPGA Micro
Desktop Platform Embedded Platform
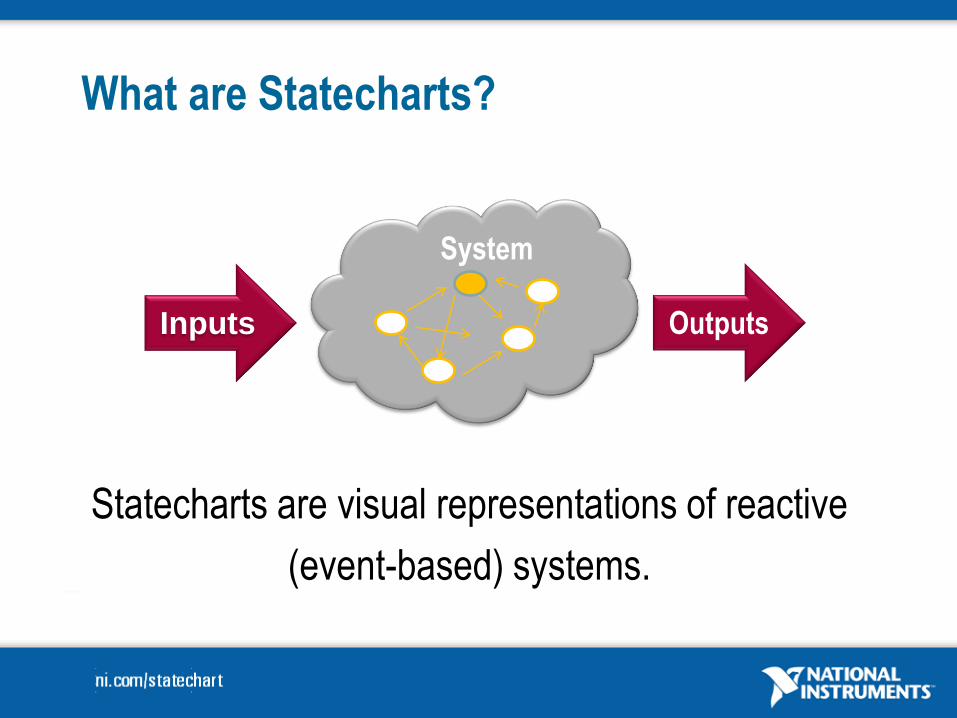
What are Statecharts?
Statecharts are visual representations of reactive
(event-based) systems.
System
Inputs Outputs

Differences between Statecharts and FSMs
Both contain the same basic concepts:
States
Transitions
Statechart adds additional concepts: Hierarchy
Concurrency
Event-based paradigm
Pseudostates & Connectors
Button Press
H
Based on the UML statechart diagram specification
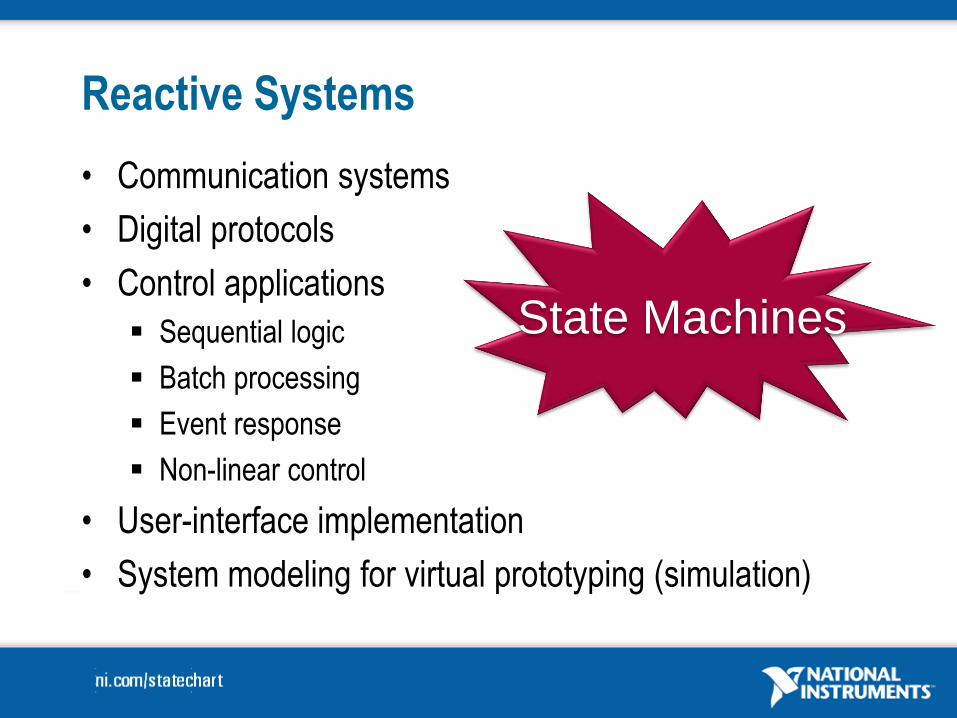
Reactive Systems
• Communication systems
• Digital protocols
• Control applications
Sequential logic
Batch processing
Event response
Non-linear control
• User-interface implementation
• System modeling for virtual prototyping (simulation)
State Machines
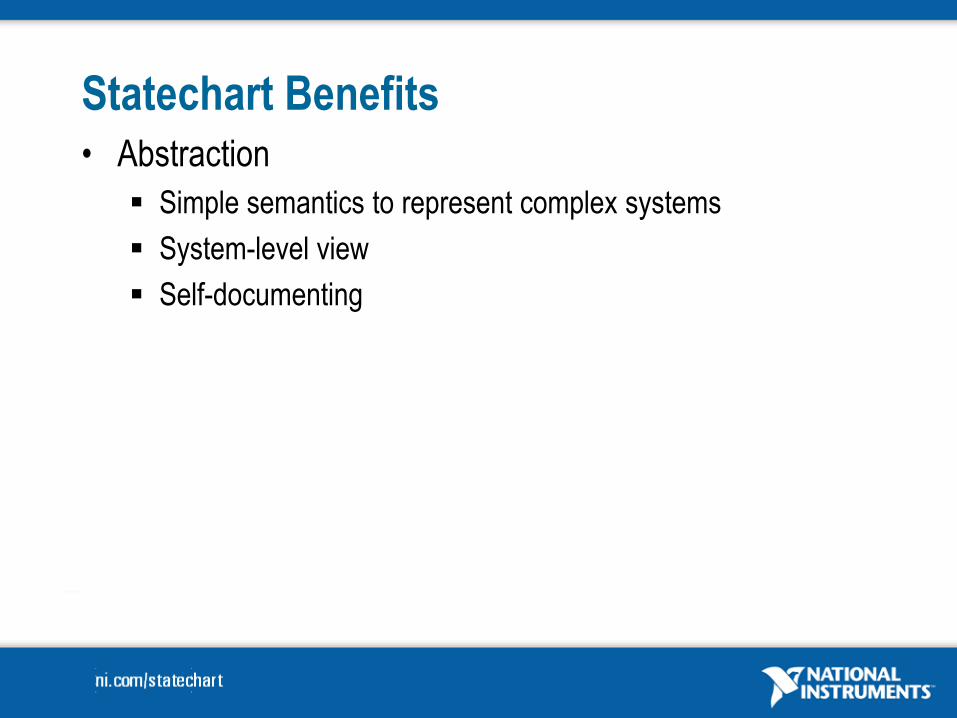
Statechart Benefits
• Abstraction
Simple semantics to represent complex systems
System-level view
Self-documenting
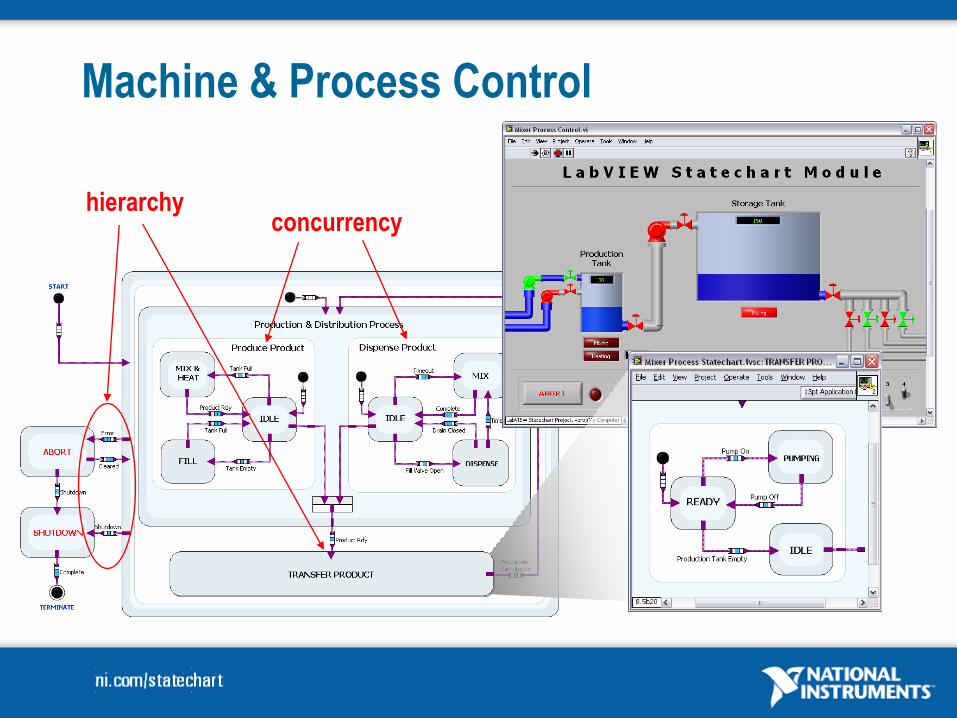
Machine & Process Control
concurrencyhierarchy

FPGA Logic
hierarchy

User Interfaceshistory

• Abstraction
Simple semantics to represent complex systems
System-level view
Self-documenting
• Scalability
Easily extend applications
Open software platform
• Automatic Code Generation
LabVIEW Embedded Technology
Statechart Benefits
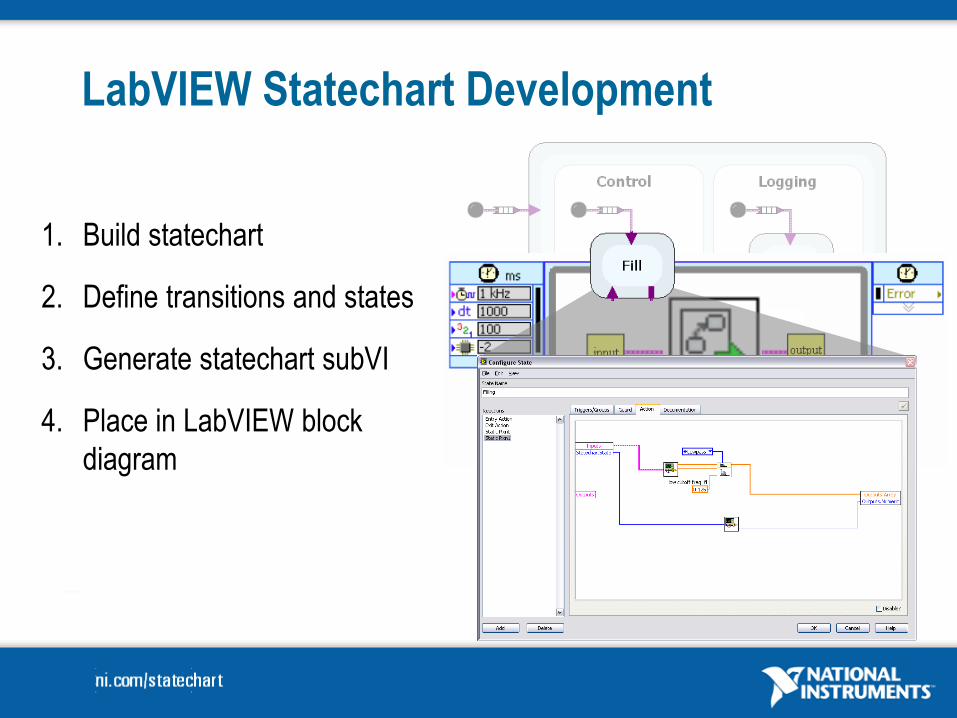
1. Build statechart
2. Define transitions and states
3. Generate statechart subVI
4. Place in LabVIEW block
diagram
LabVIEW Statechart Development

Example – Ceiling Fan
• Triggers
Power switch
Fan toggle
Light toggle
• Outputs
Light
Fan speed
Power No Power
Fan Light Fan Light
Highon
offmedium
lowoff
off
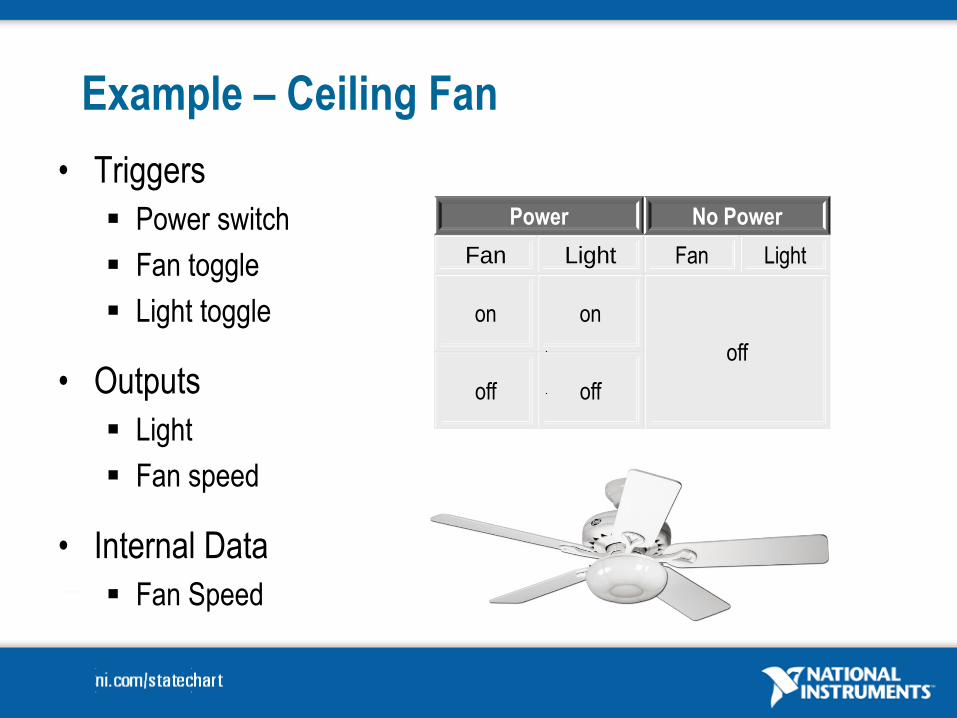
Example – Ceiling Fan
• Triggers
Power switch
Fan toggle
Light toggle
• Outputs
Light
Fan speed
• Internal Data
Fan Speed
Power No Power
Fan Light Fan Light
on on
off
off off

1. Build Statechart
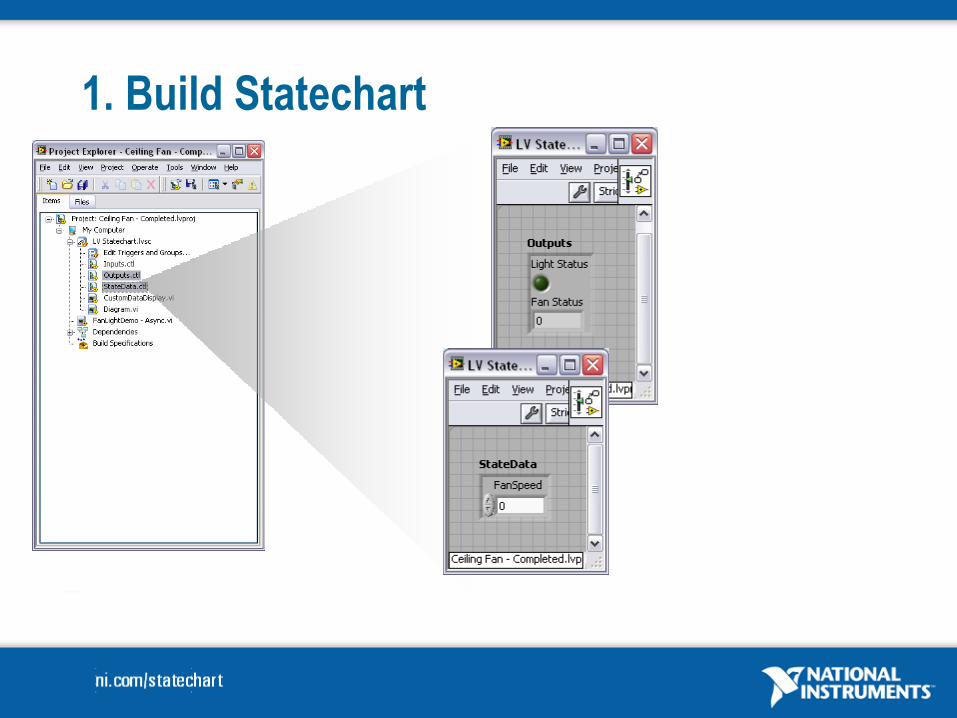
1. Build Statechart
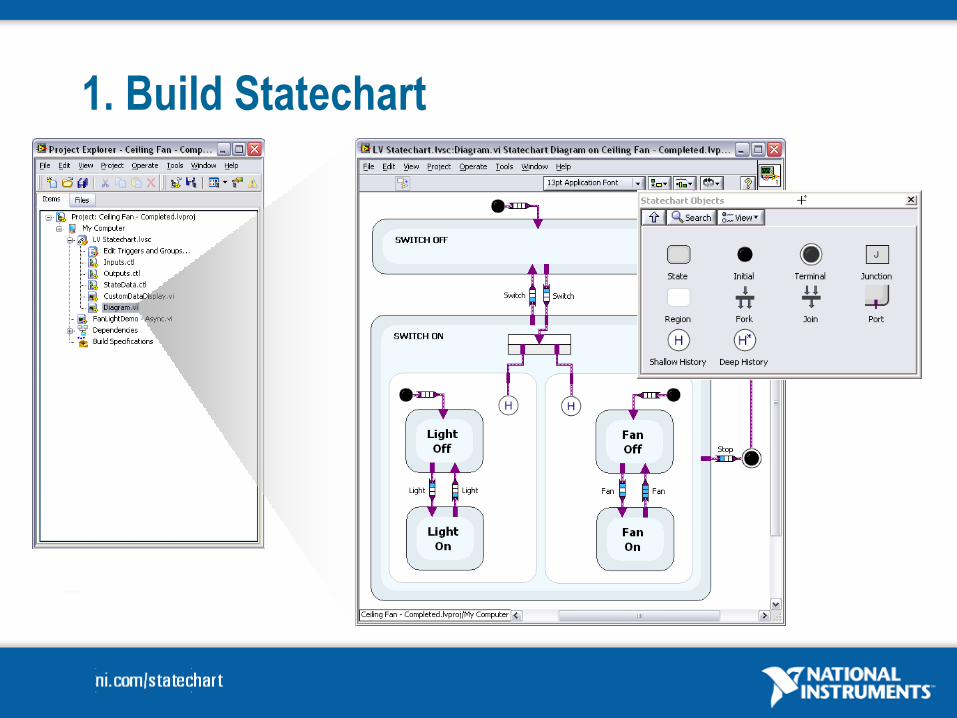
1. Build Statechart

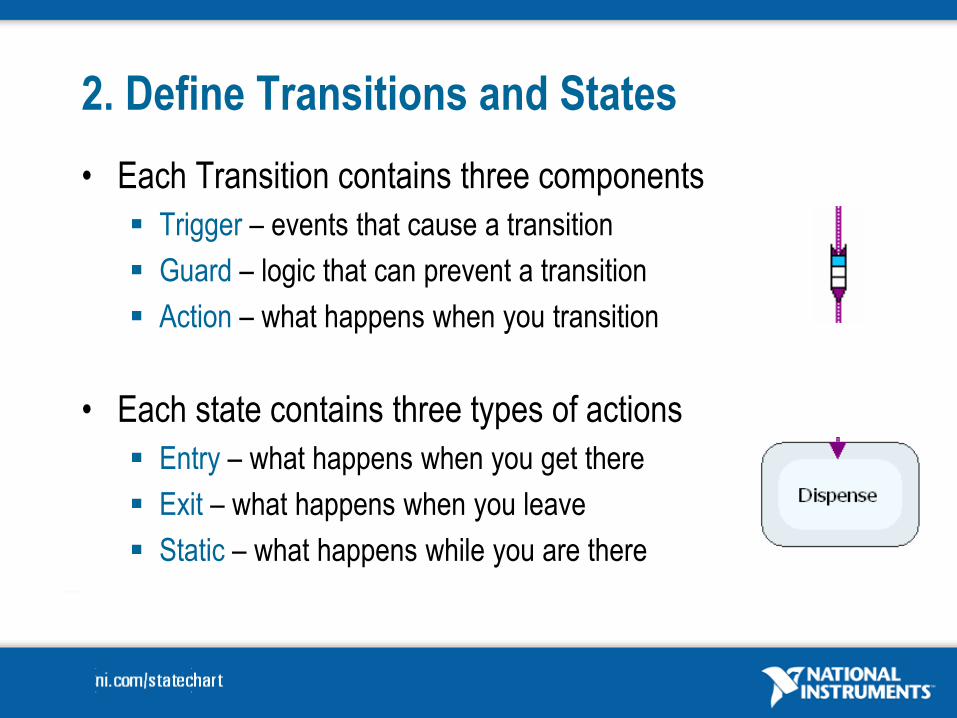
2. Define Transitions and States
• Each Transition contains three components
Trigger – events that cause a transition
Guard – logic that can prevent a transition
Action – what happens when you transition
Curr State – DOOR CLOSED
Trigger – doorbell ring
Guard – adult home?
Action – open door
New State – DOOR OPEN
If the doorbell rings
and an adult is home,
answer the door.
2. Define Transitions and States
• Each Transition contains three components
Trigger – events that cause a transition
Guard – logic that can prevent a transition
Action – what happens when you transition
• Each state contains three types of actions
Entry – what happens when you get there
Exit – what happens when you leave
Static – what happens while you are there

2. Define Transitions and StatesTrigger-Guard-Action
Triggers

2. Define Transitions and StatesStatic Reaction Trigger-Guard-Action
Inputs State Data Outputs
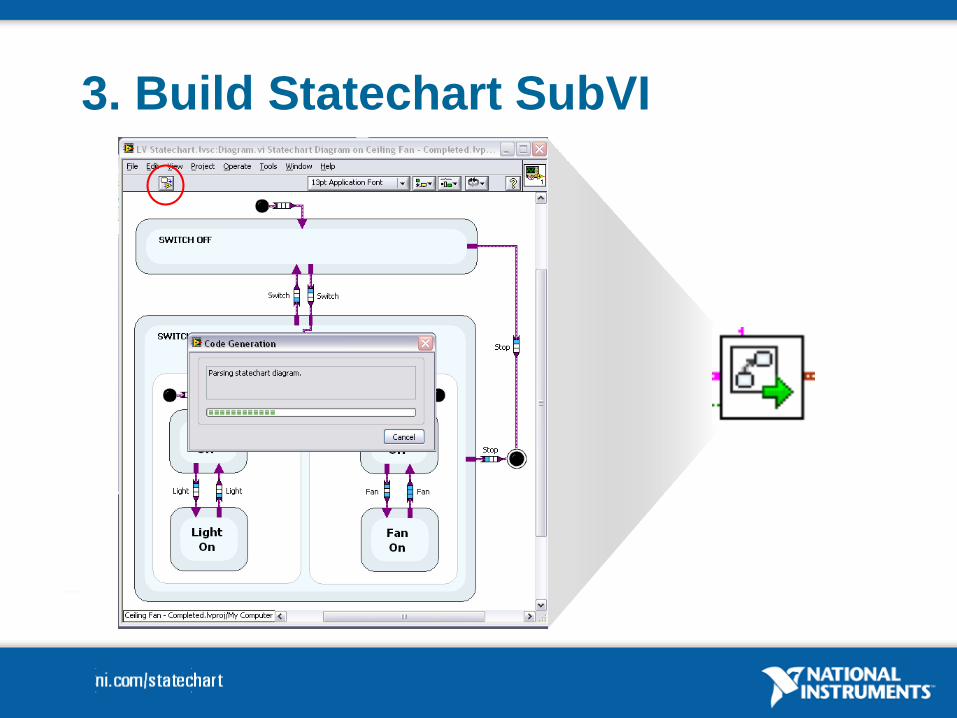
3. Build Statechart SubVI

4. Place in LabVIEW Block Diagram
Asynchronous Usage User interface
Interruption handling
Modeling event driven systems

4. Place in LabVIEW Block Diagram
Synchronous Usage Embedded applications
Communication protocols
Control implementations

Statechart Execution
• Evaluate the trigger/guard logic for the
transitions leaving the current state(s)
• On first valid transition:
Execute the exit action(s) for the current state(s)
Execute the transition action
Execute the entry action(s) for all state(s) being
transitioned to
• If no transitions are valid:
Evaluate the trigger/guard logic for all static
reactions configured for the current state
Execute the action code for all valid reactions

Statechart Execution

DEMO

What to do next?
• Visit ni.com/statechart
Demo videos
Statecharts 101 whitepaper
Statecharts with LabVIEW FPGA whitepaper
Try the LabVIEW Statechart Module online
• Demonstration from local Field Engineer