high-growth smes and employment - oecd.org · the oecd working party on smes has carried out this...
TRANSCRIPT

High-Growth SMEs and Employment
ORGANISATION FOR ECONOMIC CO-OPERATION AND DEVELOPMENT

ORGANISATION FOR ECONOMIC CO-OPERATION AND DEVELOPMENT
Pursuant to Article I of the Convention signed in Paris on 14th December 1960, and which came into force on 30th September 1961, the Organisation for Economic Co-operation and Development (OECD) shall promote policies designed:
- to achieve the highest sustainable economic growth and employment and a rising standard of living in Member countries, while maintaining financial stability, and thus to contribute to the development of the world economy;
- to contribute to sound economic expansion in Member as well as non-member countries in the process of economic development; and
- to contribute to the expansion of world trade on a multilateral, non-discriminatory basis in accordance with international obligations.
The original Member countries of the OECD are Austria, Belgium, Canada, Denmark, France, Germany, Greece, Iceland, Ireland, Italy, Luxembourg, the Netherlands, Norway, Portugal, Spain, Sweden, Switzerland, Turkey, the United Kingdom and the United States. The following countries became Members subsequently through accession at the dates indicated hereafter: Japan (28th April 1964), Finland (28th January 1969), Australia (7th June 1971), New Zealand (29th May 1973), Mexico (18th May 1994), the Czech Republic (21st December 1995), Hungary (7th May 1996), Poland (22nd November 1996), Korea (12th December 1996) and the Slovak Republic (14th December 2000). The Commission of the European Communities takes part in the work of the OECD (Article 13 of the OECD Convention).
Publié en français sous le titre
Les PME à forte croissance et l’emploi © OECD 2002 Permission to reproduce a portion of this work for non-commercial purposes or classroom use should be obtained through the Centre français d’exploitation du droit de copie (CFC), 20, rue des Grands-Augustins, 75006 Paris, France, tel. (33-1) 44 07 47 70, fax (33-1) 46 34 67 19, for every country except the United States. In the United States permission should be obtained through the Copyright Clearance Center, Customer Service, (508) 750-8400, 222 Rosewood Drive, Danvers, MA 01923 USA, or CCC Online: www.copyright.com. All other applications for permission to reproduce or translate all or part of this book should be made to OECD Publications, 2, rue André-Pascal, 75775 Paris Cedex 16, France.

3
FOREWORD
The OECD Working Party on SMEs has carried out this research project on the role of high-growth SMEs and employment. The study looks at the relationship between firm growth and job creation and the characteristics of high-growth firms and at the conditions, including government policies, which may be conducive to the development and success of these firms.
This work is based on in-depth research on France carried out by Professor Philippe Mustar (Centre de Sociologie de l’Innovation, École Nationale Supérieure des Mines de Paris) and on other case studies and was largely sponsored by the French authorities. Other countries participated in various degrees: Germany, Italy, Japan, the Netherlands, Spain, Sweden and the United States, as well as the Province of Quebec in Canada. The nature and scope of the studies vary, largely owing to differences in the sources and types of support given to the studies. The case studies on France, the Netherlands, Spain were supported by national authorities; the studies on Italy, Sweden and the Province of Quebec were provided by universities and research institutions. In its later stages, Greece joined the project and exploited data based on the manufacturing census.
The project had two phases:
• Phase I involved the analysis of firm-level data, with a view to identifying high-growth firms, establishing their role in job creation and describing their differentiating characteristics.
• Phase II sought to determine the factors that affect firm growth and their contribution to job creation, based on surveys of high-growth firms. It also reviewed government action to enhance the potential contribution of high-growth firms to job creation and growth.
The publication is divided into two main parts: a synthesis report and the French case study, the most detailed and in-depth study carried out as part of the project, which is presented in an annex. The publication has been prepared by the OECD Secretariat in co-operation with Professor Mustar. It is published on the responsibility of the Secretary-General of the OECD.


5
TABLE OF CONTENTS
FOREWORD.................................................................................................................................1
INTRODUCTION .........................................................................................................................7
Chapter 1. HIGH-GROWTH FIRMS AND THEIR CONTRIBUTION TO EMPLOYMENT ...........................................................................................................................9
Introduction................................................................................................................................9 Firm size, job creation and job destruction ..............................................................................10 High-growth SMEs and entrepreneurship................................................................................15 The contribution of high-growth firms to job creation ............................................................16 Profile of high-growth firms ....................................................................................................19 Main findings ...........................................................................................................................28
ANNEX TABLES .......................................................................................................................30
METHODOLOGICAL ANNEX.................................................................................................37
Participants...............................................................................................................................37 Statistical sources.....................................................................................................................38 Method of analysis ...................................................................................................................42
Chapter 2. CHARACTERISTICS OF HIGH-GROWTH SMES...............................................47
Introduction..............................................................................................................................47 Innovation ................................................................................................................................48 Market/technology linkages .....................................................................................................48 Organisation and management.................................................................................................49 Teamwork ................................................................................................................................50 Networking...............................................................................................................................51
Chapter 3 POLICY IMPLICATIONS AND RECOMMENDATIONS ...................................53
Training assistance...................................................................................................................55 Innovation assistance ...............................................................................................................55 Financing assistance.................................................................................................................56

6
ANNEX: HIGH-GROWTH MANUFACTURING FIRMS IN FRANCE ...............................59
PRINCIPAL CONCLUSIONS....................................................................................................61
Growing businesses of all sizes................................................................................................61 A few high-growth businesses are responsible for over half the total increase in the workforce .................................................................................................................................62 High-growth businesses in all sectors and in all parts of the country ......................................62 Different types of growth trajectories ......................................................................................63 Financing strong growth ..........................................................................................................66 Ten features that accompany strong growth ............................................................................68
INTRODUCTION .......................................................................................................................73
From new high-growth enterprises to permanent high-growth businesses..............................75 Issues involved and basic assumptions ....................................................................................75 International comparison..........................................................................................................76 The French case study..............................................................................................................76
1. THE DYNAMICS OF HIGH-GROWTH SMES IN FRANCE A STUDY OF THE MANUFACTURING INDUSTRY, 1985-94...............................................................78
Introduction: objectives, period of observation and databases used ........................................78 Permanent businesses and growing businesses........................................................................79 Comparison of three business populations...............................................................................83 High-growth businesses ...........................................................................................................87
2. TRAJECTORIES OF HIGH-GROWTH BUSINESSES ........................................................92
The “average” firm and its typical trajectory...........................................................................92 The trajectories of high-growth firms ......................................................................................93 Conclusions..............................................................................................................................97
3. A TYPOLOGY OF HIGH-GROWTH FIRMS.......................................................................99
Method .....................................................................................................................................99 Eight types of growth.............................................................................................................101 Main characteristics of each group ........................................................................................102 Conclusions............................................................................................................................106
4. THE POSTAL SURVEY AND ITS FINDINGS ..................................................................108
Objectives and drafting of the questionnaire and postal survey.............................................108 Analysis of the findings of the postal survey .........................................................................111
ANNEX A STATISTICAL METHODS USED TO ESTABLISH THE EIGHT GROUPS ..135
Determination of the quantiles ...............................................................................................135 Data coding ............................................................................................................................135
REFERENCES ..........................................................................................................................138
Boxes
Box 1. Allocation of firms to size classes: two views .........................................................13 Box 2. Measures of growth ....................................................................................................16

7
INTRODUCTION
High-growth firms, as measured by employment expansion rates, account for a significant share of jobs created and are key players in economic growth. Among such firms, small firms exhibit higher net job creation rates than large ones, as they also do in the general population of firms. In the first phase of this project, 8-10% of the population of growing firms were characterised as high-growth. They include older firms in traditional sectors as well as younger, technology-based ones. Eight case studies (France, Germany, Greece, Italy, Netherlands, Spain and Sweden and Canada’s Province of Quebec1) used firm-level data sets to identify high-growth firms and their differentiating characteristics.
Although the underlying data and some of the methodologies differ, the study revealed a number of common characteristics. High-growth firms account for a disproportionate share of gross job gains, with job creation rates of small firms exceeding those of large ones. However, these flows of gross job gains co-exist with large flows of gross job losses, especially in small firms. In absolute terms, larger firms are also significant job creators, although it is not always clear whether this reflects mergers and acquisitions or internal growth. High-growth firms are found in all industries and in all regions, and tend to be concentrated in certain sectors, although these differ in the countries studied. They are more R&D-intensive than less rapidly growing firms or average firms and all demonstrate a certain level of innovativeness. They also tend to be younger. Finally, they have a higher representation among firms that are partly or wholly owned by others and appear to be more often involved in alliances.
Phase I suggests that to promote high-growth firms and job creation, government policy may usefully be directed towards ensuring appropriate framework conditions, with a focus on the creation of efficient markets and the removal of obstacles to the creation, expansion, development and exit of firms. Policies with a bearing on firm expansion at the early stages of the enterprise life cycle should be reviewed with respect to administrative measures affecting start-up, financial and fiscal measures affecting venture capital supply and stock options, intellectual property regimes governing ownership of intangible assets, the flexibility of labour market policies and the aspects of education and training policies that affect the pool of skilled workers.
Phase II of the project, based on in-depth studies of France, the Netherlands and Canada’s Province of Quebec, focuses on the defining features of high-growth small and medium-sized enterprises (SMEs) in the manufacturing sector. While there is no single blueprint for growth, here again high-growth firms share certain characteristics. First, and most importantly, growth is closely related to a company’s ability to innovate; this involves continual changes to products, processes and organisational and managerial practices. Second, high-growth firms are strongly market-oriented, forge links between their technology and markets and adapt their products to respond to consumer trends and client demands. Third, they have a decentralised, participatory and readily adaptive organisation. Fourth, they encourage teamwork among all staff through regular communication, shared decision making, skills training and profit-sharing mechanisms. Fifth, they are well integrated into a
1. According to Statistics Canada, Quebec constitutes about 23% of the Canadian population, has about
27% of Canada’s small and medium-sized enterprises and produces about 21% of Canada’s GDP.

8
network of alliances and partnerships with other firms, service providers and public and private institutions.
Difficulties confronting high-growth SMEs include obtaining financing, expanding markets, calculating the risks of alliances, finding the right partners and consultants, hiring and training competent staff. Governments can help overcome such barriers to growth by simplifying policies and programmes to reduce red tape, by giving more responsibility to local authorities through co-ordination of all levels of responsibility and by evaluating policies and programmes on a regular basis. Because high-growth firms are found among SMEs in all sectors, policies should address microenterprises and SMEs in a range of industries and regions; they should not focus solely on small high-technology firms. The government schemes that are most beneficial to high-growth firms offer assistance in staff training and recruitment, innovation and financing. Fiscal incentives and frameworks for small firm networking and clustering are often more useful than direct support.
Research on high-growth SMEs combining quantitative analysis with case studies could usefully be carried out in other countries. The present study clearly shows that there is no one best way to achieve growth, but further study might allow for developing a typology of high-growth firms. Work on growth trajectory patterns could show how the phases of growth evolve. It would also be valuable to extend the research beyond the manufacturing sector and beyond established enterprises to start-ups. Better understanding of the relations between large industrial groups and SMEs, with respect to the externalisation of functions from the former to the latter would also be of value. Moreover, high-growth SMEs form skills networks that serve not only large multinational corporations but also more traditional SMEs in an increasingly competitive globalised economy.
The publication has two main parts: a synthesis report and the French case study. The first presents the findings of an analysis based on international comparisons and has three chapters. The first is an in-depth study of the nature of high-growth firms and their contribution to employment. The second draws on the first in order to define some of the main characteristics of high-growth firms. The third draws some implications and recommendations in terms of government policy. The Annex is the in-depth case study on high-growth manufacturing firms in France.

9
Chapter 1
HIGH-GROWTH FIRMS AND THEIR CONTRIBUTION TO EMPLOYMENT
Introduction
Structural unemployment and weak employment growth have been salient characteristics of labour market trends in many OECD countries. Explanations of this situation include macroeconomic conditions, the functioning of labour and product markets and the effects of technological change and globalisation. All of these have been investigated in recent years, among others by the OECD (1994a; 1997a). One general conclusion emerging from such studies is that unemployment often reflects an economy’s incapacity to adapt to change. The degree to which an economy is adaptable depends on the nature of its institutions, its structural policies, its regulations and laws and its social and cultural values.
While government has an influence on the incentives and framework conditions that bear on an economy’s capacity to adapt, the implementation of change rests with private actors. Entrepreneurs, defined here as those individuals who are willing and able to take risks, be innovative and exploit business opportunities in a market environment, are among the most important agents of change. Hence, entrepreneurship is an idiosyncratic process, in which uncertainty and access to information play a significant role, as differences in firm performance found in most empirical studies readily confirm.
Differences among firms also loom large in terms of employment. In this respect, where micro-level data are used in studies of countries, industries or time periods, they have often revealed the co-existence of job creations and losses and, more generally, a picture of significant variance in the growth of firms and their creation of jobs, even when they operate in the same, narrowly defined market.2 In addition, studies have shown that a small group of firms is typically responsible for a large share of jobs created. These rapidly expanding firms, with their supposed or actual potential to generate jobs, have attracted the attention of policy makers eager to reduce unemployment.
The main objective is to analyse the sets of the fastest-growing firms as identified in each of the case studies. In addition, new evidence on the relation between firm growth and firm size complements the evidence in the literature. The following section undertakes a general analysis of firm size and firm growth. Next, the focus is on fast-growing firms, with a discussion of how to identify them, their contribution to employment gains and their differentiating characteristics. Conclusions and tentative policy implications follow.
2. For example, Caballero et al. (1997), in a study of employment dynamics, conclude that “by far the
dominant source of microeconomic employment changes is idiosyncratic shocks, and these play a key role in mapping aggregate shocks into actual employment responses.” Further, “The results [...] lend support to the view that microeconomic heterogeneity is important not only for microeconomic issues but also for macroeconomics.”

10
Firm size, job creation and job destruction
Background
Since statistical tools and data sets that make it possible to trace the growth and employment history of individual firms have become available, various studies have investigated micro-level aspects of job creation and destruction. Firm size has attracted much attention among policy makers, and many countries have developed policies for SMEs and so use “size” as an important differentiating characteristic. One reason for doing so has been to counterbalance actual or perceived biases against small firms that may arise from certain regulations or fiscal or labour market policies. Another has been their role in job creation. Ever since the work of David Birch (1981), who pointed out that, in the United States, small businesses had been a major source of job creation, the robustness of these results with respect to their validity across countries and sectors and over time has been debated. Earlier OECD work (OECD, 1994b; 1997b) provided an overview of various studies and the present publication offers additional evidence on the question.
Several distinctions must be made. First, flows of gross job creations and gross job losses must be distinguished from net job creation. Although net job creation (the difference between job gains and job losses) is a frequent focus, information on gross flows can be of interest to policy makers: simultaneous job creation and job destruction is evidence of “churning” in labour markets. Churning is a part of the competitive process and entrepreneurship, and its extent and development can be of interest. A look at gross flows also brings out the differences among firms, even in the same industry or of the same size and age. Observation of this diversity, in turn, sheds doubt on the value of policy formulations based mainly on the “average” or “typical” firm.
Second, and turning to the issue of net job creation, a measure is needed that reflects the relative importance of small and large firms in the job creation process. The most common measure is net job creation rates for different firm characteristics, in particular different size classes. Net job creation rates are percentage ratios that relate net job gains to the total number of employed. However, a large rate does not necessarily imply a large absolute contribution to the overall number of net jobs created, as absolute contributions are the product of net job creation rates and the share that a category occupies in total employment. Thus, a size category that accounts for a small share of initial employment but has a high net job creation rate may still have a small impact on overall job creation, whereas a size category that stands for a large share of employment may contribute significantly to overall net job creation, even if its net job creation rate is low.
Aggregate flows of job gains and losses
With these observations in mind, some results from the six case studies can be examined. Table 1 presents some basic information about the samples of firms investigated in the seven case studies. The samples vary in several respects, including sectoral coverage, time period and size of the sample relative to the overall population of firms (see the Methodological Annex at the end of this chapter for details). As a consequence, cross-country comparisons should be made with caution. However, there are some common salient features, most of which confirm earlier work:
• At aggregate level, but also (as will be documented later) at sectoral level or for individual size classes, gross flows of job creation co-exist with flows of job losses. This is a clear indication of considerable heterogeneity and an expression of market dynamics.

11
• Net employment gains or losses are significantly smaller than gross flows of job creation and destruction or job turnover, the combined measure of job gains and losses: across the case studies, job turnover rates are about 5% a year whereas net job creation rates average about -1%. These figures are much smaller than those of other studies, such as the OECD survey (1996b) which shows job turnover rates of the order of 20-30% a year, depending on the case study. Much of the difference is due to the size class coverage of the samples in Table 1, as they cover firms of 20 employees or more and do not include the much more volatile size classes of very small and micro firms. Furthermore, the samples cover only permanent firms, while an important part of gross flows of job gains and job losses stems from openings and closures of firms (OECD, 1994b; 1996b).
Table 1. Job flows based on data sets for the eight cases studies1 Permanent firms with at least 20 employees
France Province of Quebec
Greece Italy Netherlands
Spain Sweden Germany
Period under review
1985-94 1990-96 1988-92 1990-95 1989-94 1990-94 1987-96 1993-95
No. of permanent firms
10 691 2 977 2 305 29 690 23 416 1 174 8 173 788
No. of employees at beginning of period
2 413 238 322 921 245 772 2 598 414 2 403 746 291 545 958 072 6 520 000
No. of employees at end of period
2 118 070 310 505 231 666 2 516 014 2 441 098 246 283 995 037 6 010 000
Total job gains 257 411 43 371 36 248 408 674 311 349 51 006 266 515 360 000
Total job losses
552 579 55 787 40 354 491 074 273 996 96 268 229 550 870 000
Net job creations/losses
- 295 168 - 12 416 - 14 106 - 82 400 37 354 - 45 262 36 965 - 510 000
Annualised gross job creation rate
1.26% 2.28% 2.73% 3.19% 2.57% 4.65% 3.04% 2.82%
Annualised rate of gross job losses
2.69% 2.93% 4.20% 3.83% 2.27% 8.78% 2.62% 6.81%
Annualised rate of job turnover
3.95% 5.20% 6.93% 7.01% 4.84% 13.44% 5.66% 9.62%
Annualised net job creation rate
- 1.44% - 0.65% - 1.47% - 0.64% 0.31% - 4.13% 0.42% - 3.99%
1.For a description of the data sets and sources, see the Methodological Annex at the end of this chapter. Source: OECD, based on case studies.
Job gains and job losses by firm size
As Tables 1 and 2 show, significant flows of gross job gains and gross job losses co-exist within size classes (see Box 1). This implies that it is not an entire size cohort that creates or loses jobs but rather a subset of firms in that size cohort and that job turnover rates are comparatively high even within size classes and other sub-categories of firms. This can be viewed as a manifestation of market dynamics, of entrepreneurship and of an ongoing search for business opportunities. This observation

12
will be helpful in interpreting the role played by the set of rapidly expanding firms in generating employment and in growth.
Also, the rates both of gross job gains and gross job losses tend to diminish with increasing firm size. In other words, there is more turbulence or job turnover in smaller size classes. The difference in turbulence is attenuated, however, by the fact that the samples only include permanent firms with a minimum of 20 employees. Inclusion of entries and smaller size classes typically results in much larger measures of gross flows of job gains and losses.
Further, net job creation rates tend to decline with firm size. Thus, smaller size classes are likely to exhibit higher net job gains than larger firms. The combined effect of a comparatively high net job creation rate and a large share in total employment shows up in significant contributions by smaller size classes to total job gains and relatively smaller contributions to total job losses. This is in line with much of the relevant literature. However, it should be noted that:
• The definition of size classes can alter the picture of falling net job creation rates as one moves from smaller to larger size classes. The problem can be avoided by applying regression techniques to bring out a single statistical relationship between firm growth and firm size. However, a recent German study (Harhoff et al., 1998) using this approach found that the negative relation between size and growth persisted. Similarly, studies by Evans (1987) and by Dunne et al. (1989) find that larger firms (plants) have lower growth rates.
• The relationship between firm size and net job creation is not always linear. For example, the smallest and largest size classes in the French sample have shed jobs; net job creation rates were highest in the 500-1999 cohort. Conversely, Harhoff et al. (1998) found that net job creation rates in Germany were highest for the smallest and the largest firm sizes, resulting in a U-shaped curve.
• A negative relationship between job creation and firm size may reflect other firm characteristics that are partly or entirely correlated with size and whose effects the present computations pick up. One candidate for such a variable is age, because nearly all young firms are small and most larger firms are old. Analysis of German data shows, for example, that average rates of net job creation3 decline both with firm size and with firm age. To shed light on this issue, age and size have to be examined jointly as determinants of firm growth. Studies proceeding along these lines usually find that both size and age have significant and independent negative effects on firm growth.4
3. Mean growth rates of employment of individual firms are different from net job creation rates as
earlier defined. While the former are unweighted averages of growth rates across units, the latter correspond to weighted averages of growth rates across units.
4. This is typically done with regression analysis. Examples include Evans (1987), Davidsson et al. (1995), Davis et al. (1996) and Harhoff et al. (1998).
13
Box 1. Allocation of firms to size classes: two views
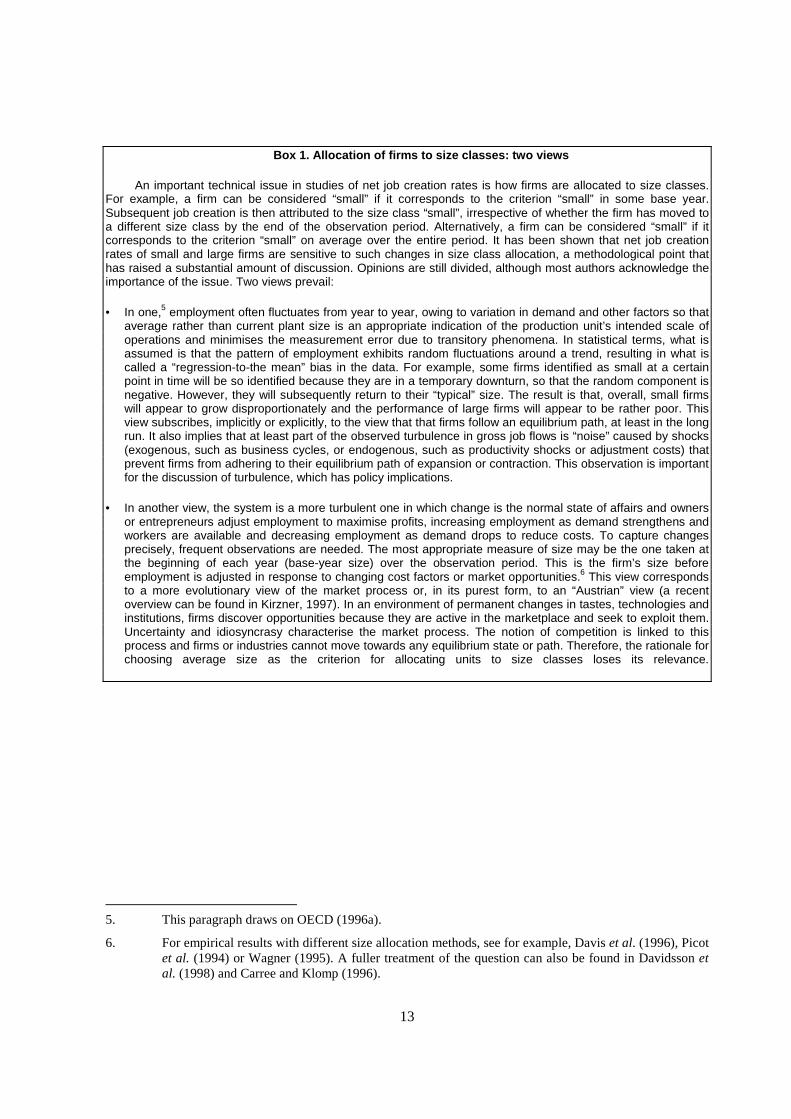
An important technical issue in studies of net job creation rates is how firms are allocated to size classes. For example, a firm can be considered “small” if it corresponds to the criterion “small” in some base year. Subsequent job creation is then attributed to the size class “small”, irrespective of whether the firm has moved to a different size class by the end of the observation period. Alternatively, a firm can be considered “small” if it corresponds to the criterion “small” on average over the entire period. It has been shown that net job creation rates of small and large firms are sensitive to such changes in size class allocation, a methodological point that has raised a substantial amount of discussion. Opinions are still divided, although most authors acknowledge the importance of the issue. Two views prevail:
• In one,5 employment often fluctuates from year to year, owing to variation in demand and other factors so that average rather than current plant size is an appropriate indication of the production unit’s intended scale of operations and minimises the measurement error due to transitory phenomena. In statistical terms, what is assumed is that the pattern of employment exhibits random fluctuations around a trend, resulting in what is called a “regression-to-the mean” bias in the data. For example, some firms identified as small at a certain point in time will be so identified because they are in a temporary downturn, so that the random component is negative. However, they will subsequently return to their “typical” size. The result is that, overall, small firms will appear to grow disproportionately and the performance of large firms will appear to be rather poor. This view subscribes, implicitly or explicitly, to the view that that firms follow an equilibrium path, at least in the long run. It also implies that at least part of the observed turbulence in gross job flows is “noise” caused by shocks (exogenous, such as business cycles, or endogenous, such as productivity shocks or adjustment costs) that prevent firms from adhering to their equilibrium path of expansion or contraction. This observation is important for the discussion of turbulence, which has policy implications.
• In another view, the system is a more turbulent one in which change is the normal state of affairs and owners or entrepreneurs adjust employment to maximise profits, increasing employment as demand strengthens and workers are available and decreasing employment as demand drops to reduce costs. To capture changes precisely, frequent observations are needed. The most appropriate measure of size may be the one taken at the beginning of each year (base-year size) over the observation period. This is the firm’s size before employment is adjusted in response to changing cost factors or market opportunities.6 This view corresponds to a more evolutionary view of the market process or, in its purest form, to an “Austrian” view (a recent overview can be found in Kirzner, 1997). In an environment of permanent changes in tastes, technologies and institutions, firms discover opportunities because they are active in the marketplace and seek to exploit them. Uncertainty and idiosyncrasy characterise the market process. The notion of competition is linked to this process and firms or industries cannot move towards any equilibrium state or path. Therefore, the rationale for choosing average size as the criterion for allocating units to size classes loses its relevance.
5. This paragraph draws on OECD (1996a).
6. For empirical results with different size allocation methods, see for example, Davis et al. (1996), Picot et al. (1994) or Wagner (1995). A fuller treatment of the question can also be found in Davidsson et al. (1998) and Carree and Klomp (1996).

14
Table 2. Job flows by firm size
Percentages
France (1985-94) Employment
size class Annualised rate
of gross job gains
Annualised rate of gross job losses
Annualised rate of net job gains/losses
Annualised rate of job turnover
Contribution to gross job gains
Contribution to gross job
losses
20-49 3.3 3.9 - 0.6 7.1 20.2 11.0 50-99 2.1 1.6 0.5 3.7 21.4 7.6
100-249 2.1 1.6 0.5 3.7 21.4 7.6 250-499 2.0 1.6 0.4 3.6 17.9 6.6
500-1 999 1.1 0.3 0.8 1.4 17.7 2.3 2 000 + 0.2 4.3 - 4.1 4.5 6.1 65.1
100.0 100.0
Greece (1988-92) Employment
size class Annualised rate
of gross job gains
Annualised rate of gross job losses
Annualised rate of net job gains/losses
Annualised rate of job turnover
Contribution to gross job gains
Contribution to gross job
losses
20-49 5.03 1.69 3.3 6.7 15.6 7.8 50-99 3.29 1.96 1.3 5.2 15.7 14.0
100-249 2.78 2.02 0.8 4.8 23.1 23.5 250-499 2.12 2.01 0.1 4.1 17.9 17.8 500-999 1.35 2.19 -0.8 3.5 13.1 18.5 1 000 + 0.25 2.14 -1.9 2.4 14.5 18.4
100.0 100.0
Italy (1990-95) Employment
size class Annualised rate
of gross job gains
Annualised rate of gross job losses
Annualised rate of net job gains/losses
Annualised rate of job turnover
Contribution to gross job gains
Contribution to gross job
losses
20-49 3.9 2.7 1.2 6.5 27.7 15.9 50-99 4.3 2.8 1.5 7.1 21.0 11.5
100-199 3.2 3.1 0.1 6.4 14.5 11.8 200-499 3.2 3.7 - 0.5 6.8 15.5 15.0 500-999 2.8 4.7 - 1.9 7.5 7.5 10.6 1 000 + 1.9 5.9 - 4.0 7.9 13.9 35.2
100.0 100.0
Netherlands (1989-94) Employment
size class Annualised rate
of gross job gains
Annualised rate of gross job losses
Annualised rate of net job gains/losses
Annualised rate of job turnover
Contribution to gross job gains
Contribution to gross job
losses
20-49 3.3 2.0 1.3 5.3 15.9 11.0 50-99 3.3 1.9 1.4 5.2 13.4 8.6
100-199 2.8 2.4 0.3 5.2 10.5 10.5 200-499 2.7 2.3 0.4 5.0 12.7 12.3
500 + 2.2 2.4 - 0.1 4.6 47.5 57.5
100.0 100.0 Province of Quebec (1990-96)
Employment size class
Annualised rate of gross job
gains
Annualised rate of gross job losses
Annualised rate of net job gains/losses
Annualised rate of job turnover
Contribution to gross job gains
Contribution to gross job
losses
20-49 4.1 2.0 2.1 6.1 25.9 9.7 50-99 3.3 2.3 1.0 5.6 19.7 10.8
100-199 2.4 2.8 - 0.3 5.2 23.1 20.2 200-499 1.7 3.0 - 1.3 4.7 18.1 25.2 500 + 1.1 3.8 - 2.7 4.9 13.2 34.0
100.0 100.0 1. For France, gross job losses and net job gains/losses also reflect employment changes between size classes. Source: OECD, based on case studies.

15
High-growth SMEs and entrepreneurship
Entrepreneurship is central to the functioning of market economies (OECD, 1998a). Entrepreneurs not only seek out and identify potentially profitable opportunities, they also assume risks in order to realise their objectives. While not all succeed, a country with substantial entrepreneurial activity is likely to generate new services and products constantly to replace older ones. The process clearly concerns all economic activity and is not confined to high-technology activities or particular business functions. Moreover, entrepreneurship can characterise the actions of companies, both new and well established, both small and large. Given the breadth of the concept, no precise measurement of entrepreneurship is available. However, in empirical applications, new or young firms and innovation are two recurring features in the characterisation of entrepreneurship.
New and young firms
Entrepreneurship is frequently associated with business start-ups and business creation. These are important manifestations of entrepreneurial activity. As empirical studies have shown, entrants are nearly always small. Audretsch (1995), for example, views entrepreneurship in terms of the extent to which an industry is composed of new and young firms, thus making age the central parameter in defining entrepreneurial activity. The question then is how age relates to rapidly expanding firms and job creation. Identification of the set of fast growers and assessment of their contribution to overall employment growth provide a useful link to business start-ups and lead directly to an examination of young firms with exceptional growth. Even if the direct, short-term employment effects of such “gazelles” are small, they attract much policy interest because they tend to produce spillover effects, as in the case of fast-growing technology-based small businesses.7 Policy implications relate to the gestation, start-up and expansion phases in the life cycle of firms.
By its very nature, a systematic investigation of young, fast-growing firms requires data on firm entry and the growth patterns of very small units.8 Consequently, data sets covering permanent firms and/or firms of minimum size are badly suited to capturing the influence and differentiating characteristics of new and young firms. Much of the dynamics arising from new entries and from including very small size classes would go unnoticed. With some exceptions (Germany, Sweden), national studies and data sets were limited in just this way and their use to investigate gazelles would be limited. Thus, the focus of the present study is on innovation, the analysis of which depends much less on data on firm entry.
Innovation
For present purposes, innovation is understood to cover technical advances in products and processes and the development of new products, but also organisational or marketing innovations. According to the definition of entrepreneurship adopted here, well-established and large firms are important entrepreneurs. It appears that, above a certain size threshold, R&D rises more or less proportionally with size (Symeonidis, 1996). Even if one takes account of the fact that R&D is a measure of input rather than innovation output and if one uses more output-oriented measures, the proportional relationship with size tends to hold. However, several surveys of the relevant literature
7. A fuller discussion of the role of new technology-based firms and related policies can be found in
OECD (1998b), Chapter 7.
8. For a survey of studies on entry, see Geroski (1995).

16
(e.g. Symeonidis, 1996; Cohen, 1995; Cohen and Levin, 1989) have reinforced the consensus that, on average, size offers no apparent advantage in the innovation process. This is not to say that size does not matter for specific activities: when innovative activity involves large fixed costs (e.g. in pharmaceuticals), large firms have an advantage; when flexibility and the ability to exploit niches are important, SMEs are likely to emerge as innovators. Thus, while size does play a role for different types of innovation, the relationship varies, and it is difficult to know a priori whether entrepreneurial activity is negatively or positively related to firm size.
In practical terms, then, the challenge is to choose an indicator that identifies rapidly expanding firms in a way that is consistent with the above observations on the relationship between innovation and firm size. Therefore, a combined measure of absolute and relative growth was adopted (see Box 2) in order to allow for cases where market opportunities or new projects are of a certain size, so that only larger firms can carry them out. Successful innovation will then not necessarily translate into large percentage growth rates but will be recognised if absolute expansion is important.
Box 2. Measures of growth
One way to explain firm growth is to stress the role of markets as pools of new opportunities (e.g. Sutton, 1997) and to treat innovation as the capacity to seize them. As it is difficult to establish a priori whether entrepreneurial activity is negatively or positively related to firm size, a growth measure that is meant to reflect the effects of successful innovation should not a priori favour a particular firm size.
Consider the proportional (percentage) rate of change as a measure of growth. If it is an appropriate measure of the effects of innovation, it should be independent of firm size. It is easy to argue that, in a set of growing firms, small units are much more likely to exhibit high percentage rates of growth than large ones. Thus, using proportional growth rates to identify high-growth units would imply a bias towards small firms.
By the same token, it can be argued that absolute growth, measured in changes in the number of employees, leads to a bias towards large firms. For the present project then, a combined measure of absolute and relative growth was chosen, following the report on France (see Annex 1) and earlier work by Birch (1981).
This growth indicator is defined as
0
1
01)(
t
ttt x
xxxm −= where
1tx and
0tx denote employment size at the end
and the beginning of the sample period. It can be demonstrated that this measure, while still dependent on firm size, always gives rise to a smaller bias towards any size class than either the relative or the absolute measure of growth.1
1. High-growth firms are then identified as those units with the largest value of m (see the Methodological Annex for details). Even when an unbiased measure is used so that large firms have the same a priori or conditional probability of rapid growth as small ones, the overall (unconditional) probability of including a large firm in the sample of high-growth firms is much smaller than the probability of including a small one, simply because there are so many more small firms in the economy.
The contribution of high-growth firms to job creation
For each case study, a set of rapidly expanding units was identified by ranking firms on the basis of the above indicator of expansion and by choosing the top 10%. This allowed for assessing their role in job creation and for studying some of their differentiating characteristics. A first impression of their role is given in Figures 1 and 2. Figure 1 shows the share of fast growers in the total number of firms, a percentage dictated by the definition of the set of high-growth firms. The share corresponds for example to the top 10% of all firms in the Spanish sample or to the top 5% in the Dutch case. The share in base year employment (second bar) occupied by these firms exceeds the share in the number of firms for all of the cases studies except Spain and Greece. This signals that the average (employment) size of fast growers exceeds that of the entire sample.

17
The Netherlands stands out with a particularly large difference. The average firm size in the sample is around 100 employees in the base year, that of all growing firms is around 70 employees and that of fast-growing units is 480 employees. This is a consequence of the choice of the growth index, which is designed to capture expansion of both small and larger firms, but which produces a very large share of fast growers among the large firms. While this can be held against the construction of the index, it also reveals an interesting feature of the Dutch case: however defined, fast growers are either relatively large firms or quite small ones but not middle-sized units of between 50 and 100 employees.
Figure 1. High-growth firms as a share of permanent firms Percentage
0
5
10
15
20
25
30
35
France Province of Quebec Greece Italy Netherlands Spain Sweden
Share in number of firms Employment share at beginning of period Employment share at end of period
Source: OECD, based on case studies.
Figure 2. High-growth firms as a share of growing firms Percentage
0
10
20
30
40
50
60
70
France Province of Quebec Greece Italy Netherlands Spain
Share in number of firms Employment share at beginning of period Employment share at end of period
Source: OECD, based on case studies.

18
Figure 2 gives similar results for the set of all growing firms. A marked qualitative difference is observable for Spain: about one-third of all growing firms are qualified as rapidly expanding and, contrary to Figure 1, the average size of fast growers exceeds that of all growing firms. The large share of rapidly expanding firms in the set of all growing firms reflects the fact that only about one-third of all firms are actually expanding. This contrasts with other countries, where firm populations are more or less equally divided among growing and shrinking units. One explanation is simply Spain’s macroeconomic situation over the period 1990-94: at the level of the whole economy, employment fell at a rate approaching 2% a year. It is quite plausible that this resulted in shrinking the number of expanding firms. In confirmation, Figure 3 suggests a positive correlation between macroeconomic employment growth and the share of expanding firms in the samples.
Figure 3. Macroeconomic employment growth and shares of expanding firms
0
10
20
30
40
50
60
70
-2.0 -1.5 -1.0 -0.5 0.0 0.5 1.0 1.5 2.0
Econom y-wide change in em ployment over sample periodAverage annual percentage changes
Sha
re o
f gro
win
g fir
ms
in to
tal
num
ber
of fi
rms
Per
cent
ages
Spain(90-94)
Ita ly (90-95)
France(85-94)
Province ofQuebec1
(90-96)
Netherlands
(89-94)
1. This figure plots the share of growing firms in the Province of Quebec against changes in employment across Canada as a whole. This implicitly assumes that the Province of Quebec is representative of Canada as a whole, in terms of the role of growing firms in the economy. Source: OECD Economic Outlook 64 and case studies.
What is the contribution of rapidly expanding firms to employment growth? Figure 4 plots the average share of high-growth firms in total employment against their share of gross job gains. It is immediately apparent that rapidly expanding firms account for a much smaller share of employment than of job creation. In other words, high-growth firms exhibit a much stronger propensity to generate employment than average firms. Situations vary greatly, however: in France, Italy and the Netherlands and Greece, between 50% and 60% of employment gains can be associated with high-growth firms, but the percentage is significantly smaller in the Province of Quebec and significantly higher in Spain. Possible explanations include:
• For Spain, the cyclical effect mentioned above, which comes along with a reduction of the share of expanding firms in the total firm population and pushes a large share of expanding firms into the top 10%. Consequently, a very large share of gross employment gains is attributed to high-growth firms.
• For Canada’s Province of Quebec, the selection of high-growth firms is based on the top 5% of all growing firms, while other sets are based on the top quintile of all permanent firms (Italy, Netherlands, Spain, Sweden) or on the top 10% of all growing firms (France). Either way, compared to the other case studies, there is a downward bias in the share of high growers.

19
Figure 4. The contribution of high-growth firms to job gains Percentage
0
10
20
30
40
50
60
70
80
90
France Province of Quebec Italy Netherlands Spain
Average employment share
Share in gross job gains
Source: OECD, based on case studies.
Profile of high-growth firms
Having established that a large part of job gains are concentrated in rapidly expanding firms, it is of immediate interest to determine the differentiating characteristics of such firms.
Size
First is the size of their contribution to employment gains. Figure 5 illustrates the average contribution to employment growth. It shows that both small and large firms provide important contributions to overall employment gains, except for the Netherlands, where by far the largest contribution comes from large firms. However, the allocation of Dutch firms to size classes is based on the firm’s size at the end of the period, whereas all other studies use the firm’s size at the beginning of the period. Second, the role played by large firms in the employment growth of high-growth firms is more important than their role in the job gains of growing firms. This emerges clearly from Figure 6, which shows the share of SMEs in employment growth both for the set of growing firms and for that of fast-growing ones.
In summary, it appears that large firms play a more important role as employment creators among high-growth firms than among growing firms. This is of course directly related to the specific notion of high growth and the associated growth index, which is designed to pick up innovative efforts across the economy. However, the small firms that are part of the so-defined set of fast growers are exceptional performers in terms of their propensity to generate jobs. In the case of Greece, the first size class (20-49 employees) is the only class with a positive change in employment.

20
Figure 5. Employment growth in growing and high-growth firms: Contributions by different size classes1
0 1 2 3 4 5 6 7 8 9 10 11 12
High-growth
Growing
High-growth
Growing
High-growth
Growing
High-growth
Growing
[20-49] [50-99] [100-199] or [100-249], depending on country [200-499] or [250-499] depending on country >500
France
Netherlands
Italy
Province ofQuebec
Average annual growth rate of employment (%)
1. Contributions of size classes are calculated as the logarithmic average annual growth rate of employment multiplied by the average weight of each size class in employment between the end and the beginning of the period. Source: OECD based on case studies.
Figure 6. Share of SMEs1 in employment growth of growing and high-growth firms Percentage
0
10
20
30
40
50
60
70
80
Netherlands Italy Province ofQuebec
France
High-growth firmsGrowing firms
1. SMEs include firms between 20 and 249 or 199 employees. Source: OECD, based on case studies.

21
Age
Age is also an important differentiating characteristic of firms. There is a consensus in the empirical literature about the link between age, size and (proportional) growth: for any given size, the proportional growth rate of firms tends to decline with age. At the same time, older firms have a greater probability of survival than younger ones. Such patterns are consistent, for example, with models of firm selection (see in particular, Jovanovic, 1982) as market entrants take time to learn about their relative efficiency. Because the selection process is more intense during the earlier life cycle of firms, young firms demonstrate greater volatility of growth patterns than older ones. Young firms that are efficient during the initial selection process survive to maturity and settle down to relatively stable employment levels (Davis et al., 1996).
Where the case studies isolated age effects, the relation between growth and age was largely confirmed and also holds for the combined index of relative and absolute growth:
• The study on the Province of Quebec tested whether the age of firms had an impact on their probability of being a growing firm. There is a significant and negative relationship that is all the more telling in that the study simultaneously controlled for other effects such as size, industry or regional affiliation. It also emerges that the link between age and growth becomes stronger as firm size diminishes. Thus, a firm of 250 employees of a certain age has a greater chance of growing than a larger firm of the same age.
• Similar conclusions emerge from the Spanish case study (see Figure 7). The age group 0-5 years has the largest share of growing firms, indicating that the probability of growing declines over the life cycle of firms.
• The Dutch study finds that high-growth companies are more likely to be young than low-growth companies. In the study, which covers the period 1989-94, one-quarter of the high-growth companies were formed after 1980, while low-growth companies were more likely to pre-date 1950 (Ministry of Economic Affairs, 1999).
Figure 7. Share of growing and fast-growing firms in Spain by age group, 1990-94 Percentage
0
10
20
30
40
50
0-5 6-10 11-20 21-30 >30 TotalAge
Share of growing firms Share of fast-growing firms
Source: OECD, based on case study.

22
The link between growth and age appears to be robust, but the correlation between rapid growth and age is less so. The Spanish study (Figure 7) indicates that the probability of being a high-growth firm does not decline as firm age rises. However, the Dutch study shows that young firms account for a larger share of fast-growing firms than they do of the set of all firms, thus indicating a negative relation between the fast-growing group and age. The German study also indicates that the share of fast-growing firms falls as age increases, although results differ somewhat between the two data sets used (Figure 8), and a regression analysis, which controls for several factors simultaneously, does not detect a clear link between the probability of being a high-growth firm and age. The Swedish study includes entrants over the observation period, and they account for two-thirds of all high-growth firms, a much larger share than their average one. Sweden’s high-growth firms are thus dominated by (young) entrants, a population that is not captured by the studies restricted to the set of permanent firms.
Figure 8. Share of fast-growing firms in Germany, by age group, 1989-95 Percentage
Dataset 1 (MUP)
0
3
6
9
12
15
18
0-5 6-10 11-30 31-300 > 300 Total
Age
Dataset 2 (MIP)
0
3
6
9
12
15
18
0-5 6-10 11-50 > 50 TotalAge
Source: OECD, based on case study.
The Swedish study offers another interesting aspect related to the distinction between “organic” and “total” firm growth. Organic growth corresponds to internal growth, and total growth to both internal and external growth. Total growth includes mergers and acquisitions, a phenomenon that occurs almost exclusively among firms of a certain age. In a discussion of firm growth and job creation, the distinction becomes important. If two firms of a certain age merge, and if the measure of firm growth includes external growth, there will be a statistical occurrence of a high-growth firm. However, no new employment may be generated. Thus, from an employment perspective, only an analysis of internal growth is useful, but only the Swedish study allows for this. It offers several important points:
• First, only about one-third of all employment gains by high-growth firms are due to internal growth: two-thirds of employment gains are in high-growth firms that grew fast as a result of mergers and acquisitions.
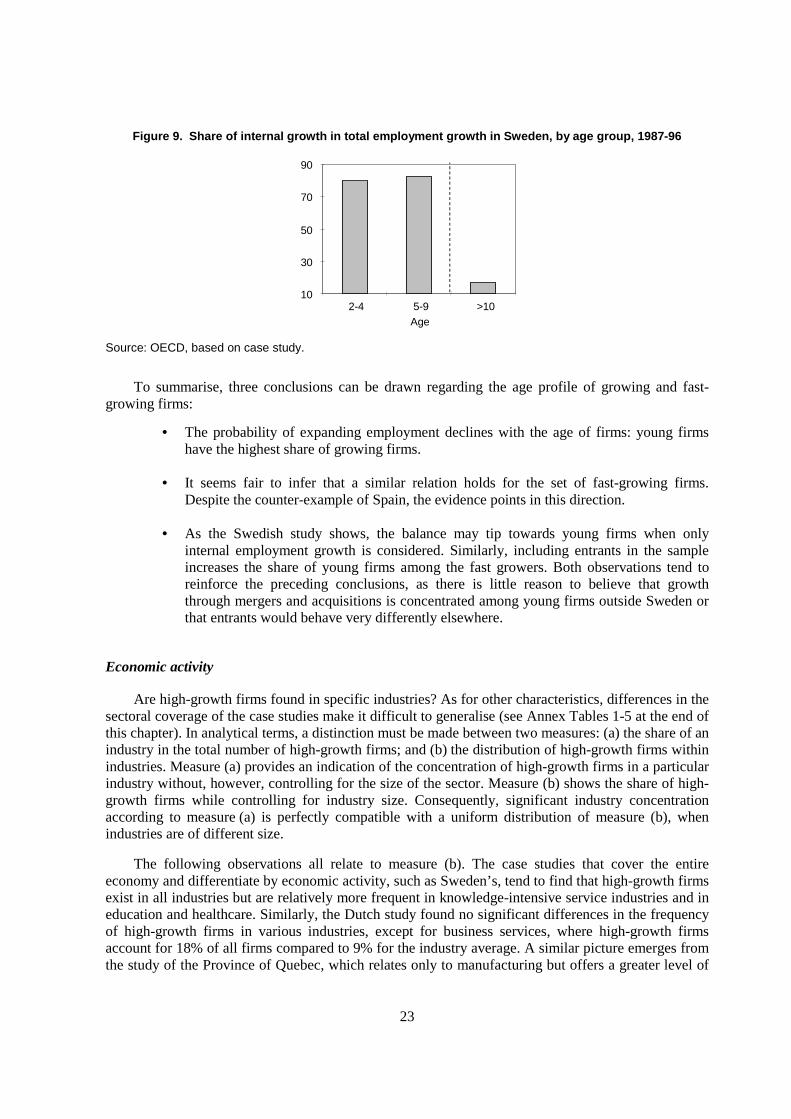
• Second, when employment gains are restricted to internal growth, nearly all of the contribution to employment gains comes from firms less than ten years old (Figure 9). As the age profile of fast growers and their contribution to employment gains change, so does the size profile. The 20% share of high-growth SMEs in total (internal and external) employment growth about doubles if only internal growth is considered.
23
Figure 9. Share of internal growth in total employment growth in Sweden, by age group, 1987-96
10
30
50
70
90
2-4 5-9 >10Age
Source: OECD, based on case study.
To summarise, three conclusions can be drawn regarding the age profile of growing and fast-growing firms:
• The probability of expanding employment declines with the age of firms: young firms have the highest share of growing firms.
• It seems fair to infer that a similar relation holds for the set of fast-growing firms. Despite the counter-example of Spain, the evidence points in this direction.
• As the Swedish study shows, the balance may tip towards young firms when only internal employment growth is considered. Similarly, including entrants in the sample increases the share of young firms among the fast growers. Both observations tend to reinforce the preceding conclusions, as there is little reason to believe that growth through mergers and acquisitions is concentrated among young firms outside Sweden or that entrants would behave very differently elsewhere.
Economic activity
Are high-growth firms found in specific industries? As for other characteristics, differences in the sectoral coverage of the case studies make it difficult to generalise (see Annex Tables 1-5 at the end of this chapter). In analytical terms, a distinction must be made between two measures: (a) the share of an industry in the total number of high-growth firms; and (b) the distribution of high-growth firms within industries. Measure (a) provides an indication of the concentration of high-growth firms in a particular industry without, however, controlling for the size of the sector. Measure (b) shows the share of high-growth firms while controlling for industry size. Consequently, significant industry concentration according to measure (a) is perfectly compatible with a uniform distribution of measure (b), when industries are of different size.
The following observations all relate to measure (b). The case studies that cover the entire economy and differentiate by economic activity, such as Sweden’s, tend to find that high-growth firms exist in all industries but are relatively more frequent in knowledge-intensive service industries and in education and healthcare. Similarly, the Dutch study found no significant differences in the frequency of high-growth firms in various industries, except for business services, where high-growth firms account for 18% of all firms compared to 9% for the industry average. A similar picture emerges from the study of the Province of Quebec, which relates only to manufacturing but offers a greater level of
24
desegregation. In terms of the share of fast growers in the overall number of firms, industry effects are hardly discernible, except for transport equipment producers and no one industry’s high-growth firms make a disproportionate contribution to employment growth. In France, high-growth firms appear relatively more often in the pharmaceuticals, electronics and rubber industries. The German study finds that the probability of being a high-growth firm is significantly higher in services than in manufacturing. In Spain’s sample of manufacturing industry, high-growth firms are over-represented in the chemicals, electronics and rubber and plastics industries. In Greece, a relatively higher proportion of HGSMEs (over 10%) appears in the industries of food manufacturing, manufacture of textiles and manufacture of footwear, wearing apparel and clothing accessories.
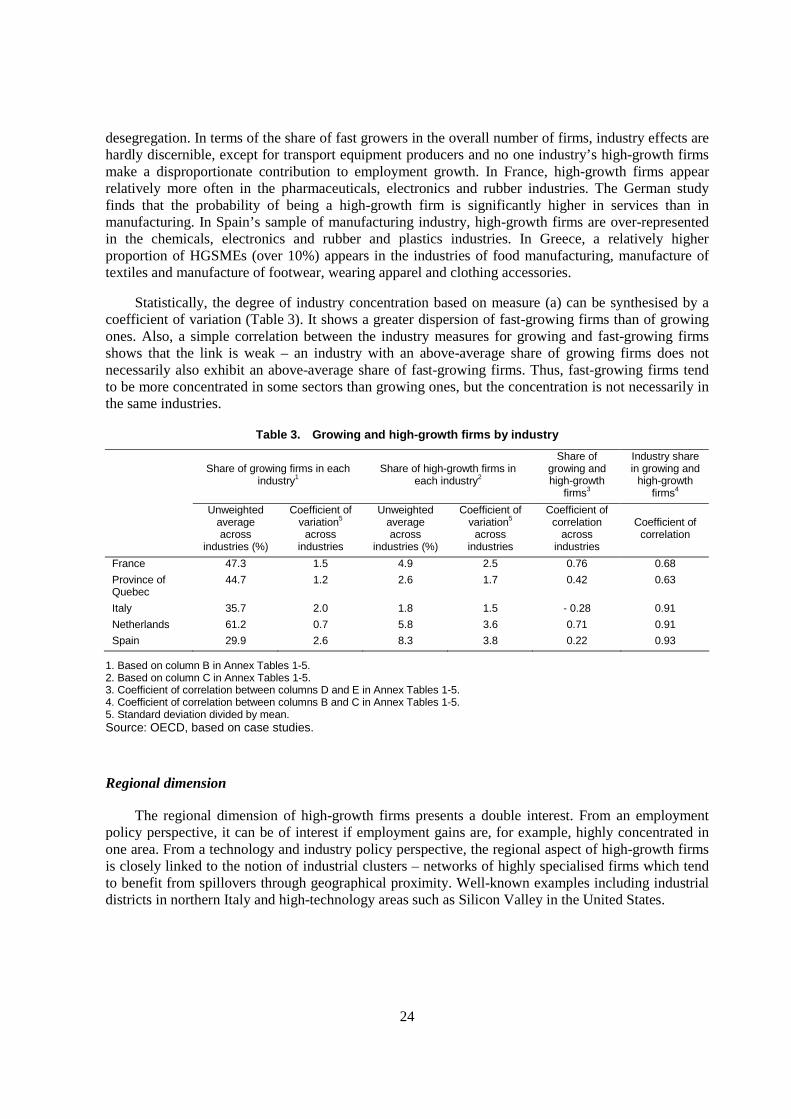
Statistically, the degree of industry concentration based on measure (a) can be synthesised by a coefficient of variation (Table 3). It shows a greater dispersion of fast-growing firms than of growing ones. Also, a simple correlation between the industry measures for growing and fast-growing firms shows that the link is weak – an industry with an above-average share of growing firms does not necessarily also exhibit an above-average share of fast-growing firms. Thus, fast-growing firms tend to be more concentrated in some sectors than growing ones, but the concentration is not necessarily in the same industries.
Table 3. Growing and high-growth firms by industry
Share of growing firms in each industry1
Share of high-growth firms in each industry2
Share of growing and high-growth
firms3
Industry share in growing and
high-growth firms4
Unweighted average across
industries (%)
Coefficient of variation5
across industries
Unweighted average across
industries (%)
Coefficient of variation5
across industries
Coefficient of correlation
across industries
Coefficient of correlation
France 47.3 1.5 4.9 2.5 0.76 0.68
Province of Quebec
44.7 1.2 2.6 1.7 0.42 0.63
Italy 35.7 2.0 1.8 1.5 - 0.28 0.91
Netherlands 61.2 0.7 5.8 3.6 0.71 0.91
Spain 29.9 2.6 8.3 3.8 0.22 0.93
1. Based on column B in Annex Tables 1-5. 2. Based on column C in Annex Tables 1-5. 3. Coefficient of correlation between columns D and E in Annex Tables 1-5. 4. Coefficient of correlation between columns B and C in Annex Tables 1-5. 5. Standard deviation divided by mean. Source: OECD, based on case studies.
Regional dimension
The regional dimension of high-growth firms presents a double interest. From an employment policy perspective, it can be of interest if employment gains are, for example, highly concentrated in one area. From a technology and industry policy perspective, the regional aspect of high-growth firms is closely linked to the notion of industrial clusters – networks of highly specialised firms which tend to benefit from spillovers through geographical proximity. Well-known examples including industrial districts in northern Italy and high-technology areas such as Silicon Valley in the United States.

25
High-growth firms exist throughout national territories, but a small number of regions have a much higher share of fast-growing firms than their share in the overall number of firms would suggest. This is true for Spain, for Germany9 (a premium on urban areas) and for France (one-third of high-growth firms are in the Paris region, which has only one-quarter of all permanent firms in the sample). In other words, the occurrence of high-growth firms is roughly in proportion to the overall occurrence of firms across regions, with one or two exceptions per study. This does not exclude a strong regional concentration of high-growth firms, but such concentration comes along with generally intense economic activity in that region. What the observation suggests, however, is that one is unlikely to find high-growth firms in areas that are otherwise not centres of economic activity.10
Dependence and independence
The distinction between independent firms and those that are partly or wholly owned by others is of interest in the context of job creation. Earlier research, notably in France (Boccara, 1997), found that dependent SMEs were more important than independent firms in creating additional employment. The finding sheds light on the role of network effects and the effects of shared resources between parent firms and their affiliates.
In the Swedish report, dependent firms are somewhat over-represented among the high-growth group, based on a panel of permanent firms (Figure 10). More or less the same picture emerges for the Netherlands and Spain and for Canada’s Province of Quebec. The French study also features a large share of dependent firms in the high-growth group but lacks a comparison with the overall panel. Overall, it would appear that dependent firms play a more than proportional part in the group of high-growth firms. This is a plausible finding:
• Financing has frequently been cited as an important constraint to expansion. Given that dependency rises with equity financing, a strong presence of dependent firms among fast growers is not surprising.
• Access to human capital, another important factor in firm growth and innovation, would appear to be facilitated within groups of dependent firms, if recruitment, training and mobility involve fixed costs or minimum size and/or if groups benefit from the wage premium that is typically observed in large firms.
• Access to information about markets, products and technologies is likely to be easier in groups.
An important qualification applies, nonetheless. As shown in the Swedish study, the difference between dependent and independent firms vanishes when new entrants are included. New firms are mainly independent and are also well represented in the high-growth group. Consequently, the inclusion of young firms raises the share of independent units among the set of fast growers.
9. As in the assessment of industry effects, the inference for Germany is based on results from a (probit)
regression model that simultaneously examines the effects of age, size, industry, etc., on the probability of being a high-growth firm. The results are therefore different from those of the partial analyses on which other case studies are based.
10. A qualification applies: because the country analyses are based on data on firms, the entire activity of a high-growth firm is ascribed to the region where it is registered. This can lead to an inaccurate picture if a firm has multiple establishments located in various parts of the country.

26
In terms of the roles of dependent and independent firms in job creation, the situation is somewhat more differentiated. In Sweden and in the Province of Quebec, dependent firms account for a relatively larger part of job creation in the high-growth segment than in the overall sample. This does not hold for the Netherlands, where independent firms are over-represented among high-growth job creators. The Dutch study also points to another issue, namely that the distinction between dependent and independent firms relies on a formal financial criterion – typically, a firm is considered dependent if at least 51% is owned by another unit. However, according to the Dutch findings, small high-growth firms in particular are very prone to engage in informal alliances.
Figure 10. Share of dependent firms in permanent and high-growth firms Percentage
0
15
30
45
60
75
90
France Provinceof Quebec
Netherlands Spain Sweden
Permanent firms High-growth firms
Source: OECD, based on case studies.
Yet another aspect is brought out by the German report, which investigates the relationship between the liability status of firms and the probability of being part of the high-growth set. As would be expected, the results indicate that corporate status has a significant and positive effect on the likelihood of being a fast grower. This does not answer the question of causality: does corporate status encourage firms to be more entrepreneurial or are fast growers corporate firms because this offers a natural way to finance expansion? In either case, the importance of economic and legal institutions that govern access to and responsibilities of firms under corporate status is clear.
In summary, then, there is a strong presumption that high-growth firms do not operate in isolation. Their integration into networks – whether financial ones or informal alliances – appears to be one of their most salient characteristics.
R&D and innovation
In light of the definition of high-growth firms as innovators given earlier, evidence on the link between R&D and fast growth is of particular interest. As with other differentiating characteristics, coverage of the topic is uneven. Nonetheless, the evidence points in the same direction: high-growth firms are more technology-intensive than the average firm:

27
• The Spanish study compares all firms, growing firms and high-growth firms in terms of their R&D intensity. About half of the overall population of firms undertake R&D, but more than 70% of the high-growth group. Moreover, for given R&D intensities, the high-growth group always has the highest share (Figure 11). Thus, high-growth units are more technology-intensive than firms on average or than growing firms.
• The German data set yields similar results, although the presentation differs. Figure 12 shows that the share of firms qualifying as high-growth rises with R&D intensity.
• The French study reports that 13% of all firms in the sample carry out formal R&D. This contrasts with a figure of 33% – nearly three times as high – for the group of fast growers.
• The Dutch study points in the same direction: high-growth firms focus more frequently than other firms on product and market innovation and devote considerable attention to the positioning of their products and product lines (Ministry of Economic Affairs, 1999).
• The Greek study finds, on the basis of probit estimation results that innovation positively influences the probability of firms to belong to the 10% high growth firms.
Figure 11. R&D intensity by type of firm in Spain Percentage
0
10
20
30
40
50
60
No R&D <1 1-2 2-4 4-6 > 6
R&D expenditures as a percentage of turnover
Sha
re in
the
num
ber
of fi
rms
All firms Growing firms High-growth firms
Source: OECD, based on case study.

28
Figure 12. Share of firms in high-growth group by R&D intensity in Germany Percentage
0
5
10
15
20
25
30
No R&D 1-5 5-10 10-25 > 25
R&D personnel as a percentage of total employees
Sha
re in
the
num
ber
of h
igh-
grow
th fi
rms
Source: OECD, based on case study.
Main findings
The findings may be summarised as follows:
a) Small firms exhibit higher net job creation rates than large firms. At the same time, significant flows of gross job gains co-exist with large flows of gross job losses, especially among small firms. Both observations are in line with many earlier studies.
b) High-growth firms account for a disproportionate share of gross jobs gained. High-growth firms are the front runners according to a measure that combines relative (percentage) and absolute rates of employment expansion.
c) Among high-growth firms, job creation rates of small firms exceed those of large ones.
d) In absolute terms, larger firms are also significant job creators in the high-growth group. Specifically, they play a more important role as employment creators among high-growth firms than among growing firms. On the other hand, the rapid growth of large firms often reflects mergers and acquisitions rather than internal growth. This raises the question of the extent to which genuinely new jobs are created.
e) High-growth firms are found in all industries and in all regions examined. Fast-growing firms tend to be more concentrated in some sectors than growing firms, but the concentration is not necessarily in the same industries.
f) High-growth firms are more R&D-intensive than either growing firms or average permanent firms.
g) Firms that are partly or wholly owned by others tend to be more than proportionally represented among the fast growers. More limited evidence shows that fast-growing units are more often involved in alliances than the average firm.
h) Growing firms tend to be younger than firms on average. There is partial evidence that job gains of new entrants match those of permanent firms.

29
Link to entrepreneurship
These results appear to fit into a conceptual framework centred on entrepreneurship. Because entrepreneurship implies uncertainty and asymmetric distribution of information, it is an idiosyncratic, search-oriented process. Finding a), which reflects the considerable heterogeneity of firms, is consistent with this view. It is argued that two aspects of entrepreneurship can usefully be distinguished: one is firm entry, start-ups, and exit in industries; the other, dealt with here, is innovation. Because it is difficult to establish a general link between innovation and firm size, high-growth firms were chosen on the basis of criteria that do not a priori favour a particular size class. The resulting set of high-growth firms includes both large and small firms (finding d). There is a clear positive link between R&D effort and high-growth (finding f). Because this implies engaging in a search process, this lends additional support to the view that it is reasonable to think of the set of high-growth firms as successful entrepreneurs.
Finding h) on the significance of youth stands out, as it holds for samples of permanent firms of minimum size, thus excluding very small (and very young) firms as well as entrants. Hence, even among permanent firms of a certain maturity, younger firms tend to be relatively more successful in moving onto an expansion path. The age component becomes even more important when entrants are included in the analysis or when employment growth measures are restricted to internal growth, excluding mergers and acquisitions.

30
ANNEX TABLES
Annex Table 1. France: growing and high-growth firms by industry Percentage
Distribution across sectors Distribution within sectors
All firms Growing firms
High-growth firms
Growing firms as a
share of all firms
High-growth firms as a
share of all firms
A B C D E
Textiles and wearing apparel 13.2 10.0 6.2 35.8 2.2
Leather and footwear 2.7 2.0 1.8 33.9 3.1
Wood and wood products 2.9 3.2 1.8 51.8 2.9
Paper and paper products: publishing and printing
11.7 12.3 8.4 49.7 3.4
Coke, refined petroleum products and nuclear fuel
0.3 0.2 0.0 34.5 0.0
Chemicals industry 6.1 7.4 17.2 57.5 13.3
Rubber and plastic products 5.9 7.7 11.6 61.8 9.2
Other non-metallic mineral products 4.5 4.6 3.8 48.8 4.0
Basic metals and fabricated metal products 21.5 21.4 12.6 46.8 2.7
Machinery and equipment 10.4 9.5 7.4 43.1 3.3
Electrical machinery and apparatus 8.5 9.1 15.0 50.7 8.3
Transport equipment 4.1 4.3 7.4 49.9 8.5
Other manufacturing industries 5.7 5.6 5.0 46.2 4.1
Mining and quarrying 2.0 1.7 0.8 41.9 1.9
Electricity, gas and water supply 0.7 0.9 1.0 56.6 6.6
Total 100.0 100.0 100.0 47.1 4.7
Source: OECD, based on case study.

31
Annex Table 2. Province of Quebec: growing and high-growth firms by industry Percentage
Distribution across sectors Distribution within sectors
All firms Growing firms
High-growth firms
Growing firms as
share of all firms
High-growth firms as
share of all firms
A B C D E
Food processing 9.4 9.2 9.2 42.7 2.2
Beverages 1.1 1.1 1.5 43.8 3.1
Tobacco 0.2 0.2 0.0 40.0 0.0
Rubber 0.7 0.9 1.5 52.4 4.8
Plastics 4.7 6.5 4.6 60.0 2.1
Leather 1.5 1.8 1.5 50.0 2.2
Textile processing 1.7 1.8 1.5 46.0 2.0
Textiles 3.2 3.7 6.2 50.0 4.2
Clothing 11.9 9.9 10.8 35.9 2.0
Wood 9.9 10.1 6.2 44.1 1.4
Furniture 4.4 4.4 4.6 43.8 2.3
Paper 4.2 3.6 6.2 36.8 3.2
Printing 5.9 5.2 3.1 37.9 1.1
Metal processing 2.2 2.4 1.5 48.4 1.6
Metal products 13.8 13.0 6.2 40.8 1.0
Machine making 4.5 5.2 4.6 49.6 2.2
Transport equipment 2.5 3.1 12.3 53.3 10.7
Electrical/electronic machinery 4.4 4.4 4.6 43.2 2.3
Mining 4.2 2.9 1.5 29.6 0.8
Petroleum 1.1 0.9 1.5 34.4 3.1
Chemicals 4.0 4.1 4.6 44.5 2.5
Miscellaneous industries 4.4 5.7 6.2 55.3 3.0
Total 100.0 100.0 100.0 43.3 2.2
Source: OECD, based on case study.

32
Annex Table 3. Greece: growing and high-growth firms by industry Percentage
Distribution across sectors Distribution within sectors
All firms Growing firms
High-growth firms
Growing firms as share of all firms
High-growth firms as share of all firms
A B C D E
Food manufacturing industries 15.0 7.24 2.12 47.98 14.08
Beverage industries 3.51 1.82 0.43 51.85 12.34
Tobacco manufactures 1.38 1.08 0.43 72.12 31.25
Manufacture of textiles 12.97 5.07 1.17 39.13 9.03
Footwear and wearing apparel 16.0 0.65 1.30 42.27 8.13
Wood and cork 1.73 0.95 ≤0.21 55.00 ≤12.5
Furniture 2.25 1.30 0.39 57.69 17.30
Manufacture of paper and paper products 2.47 1.30 ≤0.21 52.63 ≤8.77
Printing-Publishing 3.60 1.82 0.34 50.60 9.63
Manufacture of leather 0.95 0.30 ≤0.21 31.81 ≤22.72
Manufacture of rubber and plastic products 4.33 2.12 0.34 49.00 8.00
Manufacture of chemicals and chemical products
7.07 3.68 0.60 52.14 8.58
Manufacture of products of petroleum and coal
0.95 0.47 ≤0.21 50.00 ≤22.72
Manufacture of non metallic mineral products 7.41 3.77 0.43 50.87 5.84
Basic metal industries 1.51 6.50 0.30 42.85 20.00
Manufacture of metal products 5.59 2.42 0.56 43.41 10.07
Machinery and appliances (non electrical) 2.99 1.04 ≤0.21 34.78 ≤7.24
Manufacture of electrical machinery, apparatus, appliances and supplies
3.86 1.69 0.30 43.82 7.86
Manufacture of transport equipment 4.85 2.29 0.26 47.32 5.95
Miscellaneous manufacturing industries 1.38 0.43 ≤0.21 39.25 15.62
Total 100.0 100.0 100.0
Source: OECD, based on case study.

33
Annex Table 4. Italy: growing and high-growth firms by industry
Percentage
Distribution across sectors Distribution within sectors
All firms Growing firms
High-growth firms
Growing firms as
share of all firms
High-growth firms as
share of all firms
A B C D E
Food and beverages 5.8 5.7 4.9 35.3 1.2
Tobacco 0.0 0.0 0.2 15.4 7.7
Textiles 8.5 7.4 5.9 31.2 1.0
Wearing apparel 7.3 5.4 2.0 26.5 0.4
Leather and footwear 5.3 5.1 2.7 34.7 0.7
Wood and wood products 2.4 2.1 0.5 31.8 0.3
Paper 1.7 2.0 1.5 42.4 1.2
Printing 3.4 2.7 2.2 28.1 0.9
Coke, refined petroleum and nuclear 0.3 0.2 0.5 24.4 2.6
Chemicals industry 2.9 3.6 3.9 44.2 1.9
Rubber and plastics 4.2 5.6 5.1 48.6 1.7
Other non-metal, mineral products 5.8 5.0 4.6 31.0 1.1
Basic metals 2.3 2.6 1.2 40.0 0.7
Metal products 12.8 13.7 9.0 38.6 1.0
Machinery and equipment 11.4 12.8 10.5 40.3 1.3
Office machinery and computers 0.3 0.2 0.5 30.1 2.7
Electronic machinery 3.5 3.8 5.9 39.0 2.3
Radio & TV communication equipment 1.3 1.5 2.0 39.5 2.1
Precision instruments 1.4 1.6 2.2 39.1 2.2
Motor vehicles 1.1 1.3 1.2 41.4 1.5
Other transport equipment 0.9 0.7 0.2 25.2 0.4
Furniture 6.5 5.6 1.5 31.0 0.3
Recycling 0.0 0.0 0.0 57.1 0.0
Total manufacturing 89.4 88.5 68.2 35.7 1.1
Computer services 1.9 2.1 4.2 39.2 3.1
R&D services 0.1 0.1 0.2 36.0 4.0
Other business services 8.6 9.3 27.4 39.3 4.5
Total business services 10.6 11.5 31.8 39.3 4.2
Total 100.0 100.0 100.0 36.0 1.4
Source: OECD, based on case study.

34
Annex Table 5. Netherlands: growing and high-growth firms by industry
Percentage
Distribution across sectors Distribution within sectors
All firms Growing firms
High-growth firms
Growing firms as
share of all firms
High-growth firms as share of all firms
A B C D E
Horticulture and fishery 0.8 0.8 1.0 57.0 6.2
Manufacturing 27.7 25.5 25.0 56.0 4.7
Food and beverages industries 3.9 4.4 6.0 68.0 8.0
Chemical industry 2.9 2.8 4.0 59.0 7.2
Metal industry 13.5 11.8 10.0 53.0 3.8
Other manufacturing 7.4 6.4 5.0 53.0 3.5
Public utilities 0.4 0.3 0.0 49.0 0.0
Construction 15.4 14.2 9.0 56.0 3.0
Garages 3.1 3.0 1.0 60.0 1.7
Wholesale trade 16.4 17.8 14.0 66.0 4.4
Retail trade 7.3 8.3 11.0 69.0 7.8
Hotel and catering industries 3.3 2.9 1.0 53.0 1.6
Transport 8.8 9.4 9.0 65.0 5.3
Banking and insurance 2.6 2.8 5.0 65.0 10.1
Real estate agencies 0.5 0.5 0.0 60.0 0.0
Business services 9.2 10.2 18.0 67.0 10.2
Legal services/accountancy 1.0 1.1 1.0 67.0 5.4
Engineering services 3.3 3.5 6.0 65.0 9.4
Software services 1.6 1.8 5.0 70.0 16.8
Advertising 0.7 0.7 0.0 58.0 0.0
Other business services 2.6 3.0 6.0 69.0 11.8
Renting of movables 0.5 0.5 1.0 71.0 11.2
Cleaning services 2.5 2.4 5.0 57.0 10.3
Personal services 1.4 1.3 0.0 56.0 0.0
Total 100.0 100.0 100.0 60.8 5.2
Source: OECD, based on case study.

35
Annex Table 6. Spain: growing and high-growth firms by industry
Percentage
Distribution across sectors Distribution within sectors
All firms Growing firms
High-growth firms
Growing firms as
share of all firms
High-growth firms as share of all firms
A B C D C
Basic metals 2.2 1.4 1.7 19.2 7.7
Non-metal/mineral products 6.7 6.2 8.5 29.1 12.7
Chemical industry 7.3 8.7 11.0 37.2 15.1
Metal products 9.9 10.0 6.8 31.0 6.9
Machinery and mechanical equipment 6.5 5.4 5.9 26.3 9.2
Office and computing equipment 0.2 0.3 0.0 50.0 0.0
Electrical and electronic machinery 9.1 10.8 13.6 37.4 15.0
Motor vehicles 4.6 4.1 8.5 27.8 18.5
Other transportation equipment 2.3 0.8 0.8 11.1 3.7
Food, beverages and tobacco 16.9 21.1 21.2 39.4 12.6
Textiles 4.2 3.3 1.7 24.5 4.1
Leather 0.9 0.8 0.0 27.3 0.0
Footwear, wearing apparel and other 8.5 6.2 2.5 23.0 3.0
Wood and cork 5.6 5.1 3.4 28.8 6.1
Paper, graphic arts and publishing 7.5 7.9 6.8 33.0 9.1
Rubber and plastics 4.9 5.7 6.8 36.2 13.8
Other manufacturing industries 2.6 2.2 0.8 25.8 3.2
Total 100.0 100.0 100.0 31.4 10.1
Source: OECD, based on case study.


37
METHODOLOGICAL ANNEX
Participants
There were eight participants in the project. The reports were prepared by :
France •Philippe Mustar Centre de Sociologie de l’Innovation (CSI) École Nationale Supérieure des Mines de Paris (ENSMP)
Province of Quebec
•Pierre-André Julien Bombardier Chair in Management of Technological Change in SMEs •Martin Morin Researcher Research Institute on SMEs, University of Quebec, Trois-Rivières
Greece •George Zaralis
Deputy Permanent Representative of Greece to the OECD
Italy •Alberto Bramanti •Michele Scarpinato CERTeT, University Luigi Bocconi, Milan
Netherlands •H.J. Heeres
•W.H.I. Verhoeven Small Business Research & Consultancy, EIM
Spain •José L. Calvo •José Lorenzo Department of Economic Analysis, UNED, Madrid
Sweden •Per Davidsson
Jönköping International Business School, Jönköping University •Frederic Delmar Entrepreneurship & Small Business Research Institute (ESBRI)
Germany •Vera Lessat
•Michael Woywode Centre for European Economic Research, Zentrum für Europaïsche Wirtschaftsforschung (ZEW), Mannheim

38
Statistical sources
Nature of sources used in each case study
France
The main source of data was the Annual Survey of the Statistics Service (SESSI) of the Ministry of Industry. The Ministry of Research provided missing information on R&D expenditure, while INSEE supplied missing data on the independence of firms. Data were matched using the firms’ identification number.
Province of Quebec
Two complementary data banks were used. The Scott data bank provided data on firms in 1990, and the Quebec Industrial Research Centre (CRIQ) provided data for firms in 1996. Firms in the first and second data banks were first matched by their telephone number, and then by their name and address. Despite some drawbacks, this seemed the best way to match firms.
The coverage of the two data banks was not the same. Whereas Scott has national coverage, the CRIQ is confined to the Province of Quebec. A number of firms are registered in the former but not in the latter, especially firms of national scope, i.e. bigger ones. Matching by telephone number thus underestimated the survival rate of large and medium-sized firms. Firms were then matched using the Scott register for 1997; this made it possible to find nearly 43% of firms with more than 100 employees still in existence in mid-1996 but which had not been matched in the first round.
The sample gives a very good estimate of the population of firms that survived from 1990 to 1996. However, it was only possible to do the second round of matching for firms with more than 100 employees, so that some firms with 20-99 employees11 were not matched and their survival and growth rates are thus understated.
Italy
The data come from a single source, the Excelsior data bank, which is run jointly by the National Federation of Italian Chambers of Commerce (Unioncamere) and the Ministry of Labour. The Unioncamere keeps a register which lists every new firm and therefore includes all Italian firms.
Netherlands
Only one source was used, the REACH (Review and Analysis of Companies in Holland) database, which is based on Chamber of Commerce registers. In Holland, firms with more than two employees are required to submit annual statements of accounts to the Chambers of Commerce. The data supplied by companies thus made it possible to construct a stratified sample broken down by sector and size. The results of the sample were then extended to the rest of the country using data from the Central Statistical Bureau.
11. The Canadian experts estimated that 10% of firms with fewer than 100 employees could have been
matched (compared with 43% for those with more than 100 employees, the proportion falling with the size of the firm).
39
Spain
The study is based on data from the survey of business strategies commissioned by the Ministry of Industry and Energy. A number of firms were questioned every year between 1990 and 1994. The panel comprised a stratified sample of firms with fewer than 200 employees and all firms with more than 200 employees.
Sweden
The data were provided by Statistic Sweden. They come from three different sources: the tax authorities, the Patents and Company Registration Office (PRV) and mandatory surveys. The registers are complete, in that all firms have to appear, and they are updated every year. A specific data set for the purposes of the study was compiled by combining several registers.
Germany
The study is based on two data sets, the Mannheimer Unternehmenspanel (MUP) and the Mannheimer Innovation Panel (MIP). Note that both only cover West German firms.
The MUP data come from the credit rating agency Creditreform. The data are collected in two ways: first, they are supplied on a voluntary basis by firms wishing to obtain information on the financial situation of other firms and practise a policy of transparency by supplying data rapidly; second, CREDITREFORM itself registers new firms and collects data on them.
The MIP data come from four successive rounds of surveys on innovation conducted between 1992 and 1995. 12 The firms, which had to fill out a questionnaire, were selected using the MUP data. However, as the data provided by these surveys are annual and in keeping with the dynamic approach of the study of high-growth SMEs, the sample of firms taken from the MIP was confined to those that had responded to the survey at least twice.
An important factor is that the MUP and, by extension, the MIP, are samples of firms that cannot be considered representative of the total population of West German firms. The MUP comprises a smaller proportion of small firms (fewer than 250 employees) than large ones. Similarly, in the case of the MIP, the fact that the survey is conducted by means of a questionnaire leads to self-selection and consequent over-representation of innovative firms.
These two sources also have a number of characteristics that make comparison difficult; this obliged the German experts to use them separately. In this sense, Germany is a case apart. The firms in the MUP come from the entire private sector, whereas those in the MIP are only from manufacturing and business services. The dynamics of job creation in services by itself explains the average employment growth rate, which is positive for all firms from the MUP but negative for those from the MIP. Similarly, the average size of firms in the MUP is fewer than 280 employees whereas that of firms in the MIP is well over 1 000.
In sum, the data came from various sources. Table A.1 shows the sources used by each case study. The specific national features of the sources obviously influence the findings. The sources differ with respect to the selection of firms (whole population or samples), the degree to which the case
12. The project was funded by the Ministry of Education, Science, Research and Technology (BMBF).

40
studies are representative, sectoral coverage (manufacturing only or manufacturing plus services), the periods covered. Table A.2 summarises the differences.
Table A.1. Sources used in the case studies
France Province of Quebec Italy Netherlands
Source 1 Annual Business Survey of the Statistics Service (SESSI) of the Ministry of Industry
SCOTT data bank, Register of Quebec Manufacturers, 16th edition, 1990-91
Excelsior database, run jointly by the Unioncamere (Italian Federation of Chambers of Commerce) and the Ministry of Labour
REACH (Review and Analysis of Companies in Holland) data bank
Source 2 R&D Survey Ministry of Research
Data bank of the Quebec Industrial Research Centre (CRIQ), 1996
–
–
Source 3 Liaisons Financières (LIFI) Institut National de Statistiques (INSEE)
–
–
–
Type of data Survey findings Commercial information data banks
Commercial registers Commercial registers
Notes Survey findings were compared by means of the identification number of firms
Data in the two data banks were matched twice.
Data were compared with those of the National Institute of Social Security (NISS)
Findings were related to total population using data of the Central Statistical Bureau
Spain Sweden Germany Greece
Source 1 Business Strategy Survey (ESEE, 1990-94) Ministry of Industry and Energy
Registers of the National Statistical Bureau
Mannheimer Innovation Panel (MIP) Survey on innovation (ZEW&INFAS) for the Ministry of Education, Science, Research and Technology (BMBF)
National Statistical Service of Greece, establishment level, census data (1988-92)
Source 2 –
–
Mannheimer UnternehmensPanel (MUP) databank of a credit rating agency (Creditreform)
Type of data Annual survey findings Census registers Survey findings and business data banks
Census registers
Notes Sample of firms with fewer than 200 employees plus all firms with more than 200 employees
A specific data set for the study was created by combining several registers
Samples are not comparable and are not representative
The unit of analysis relates to establishments. It is generally accepted that the overwhelming majority of Greek manufacturing firms are one-establishment enterprises.
Source : Phase I preliminary reports.

41
Table A.2. Differences among sources and impact on the findings
France Province of Quebec
Italy Netherlands
Selection of firms
Whole population Sample Whole population Sample
Representative Yes Yes Yes Yes
Sectoral cover Manufacturing Manufacturing Manufacturing Manufacturing
Other industries (mining, electricity, gas, water)
– – Other industries (horticulture and fisheries, public services, construction)
– – – Distribution (retail and wholesale, garages, hotels and catering)
– – Services (business services)
Services (transport, banking & insurance, real estate, business services, other services)
Period covered
Date 1985-94 1990-96 1990-95 1989-94
Duration 9 years 6 years 5 years 5 years
Spain Sweden Germany (MUP) Germany (MIP) Greece
Selection of firms
Sample Whole population Sample Sample Whole population
Representative Yes Yes Yes Yes Yes
Sectoral cover Manufacturing Manufacturing Manufacturing Manufacturing Manufacturing
– – Other industries (all industries in the private sector)
– –
– Distribution Distribution – –
– Services (the entire private sector)
Services (the entire private sector)
Services (business services)
–
Period covered
Date 1990-94 1987-96 1992-95 1992-95 1988-92
Duration 4 years 9 years 3 years 3 years 4 years
Source: Phase I preliminary reports.

42
Method of analysis
Selecting firms for the sample
The following presents the methodological guidelines according to which case studies were to be conducted. The firm, rather than an establishment or group, was to be used as a statistical unit. This limited the possibility of monitoring external growth processes (creation, mergers and acquisitions).
Starting with the population of firms available in national data banks, samples of firms were selected (Figure A.1).
Figure A.1. Illustration of the selection procedure
Initial population = permanent firms + new firmsSector = manufacturing + other industries where
applicable
Of which firms ofminimum size > 20
employees
Of which surviving so-calledpermanent firms
Of which firmsexperiencing growth
Of which firmsgrowing at a
very high rate
Of which surviving so-calledpermanent firms
Of which firmsexperiencing growth
Of which firmsgrowing at a
very high rate
The size of the firm was to be defined at the beginning of the period and in terms of the number of employees. The lower limit of the size range was set at 20 employees. All firms below this threshold were therefore excluded from the study. The “permanent” firms were then selected from the resulting sample. These firms were in existence at the beginning of the period and survived throughout the period. Firms created or wound up during the period were therefore excluded. To some extent, such permanence is already in itself a criterion of success.
Start-ups, which may be a source of new jobs, were not taken into account. The methodological approach also disregarded mergers and acquisitions and their impact on employment. National data do not normally allow for drawing a distinction between internal or “organic” growth, arising from genuine expansion, and external growth attributable to mergers and acquisitions.
The permanent firms meeting the minimum size requirements therefore constituted the case study population, which may be broken down into two sub-populations: firms that have stagnated or whose overall number of employees declined between the first and last year studied; and firms that instead have seen an increase in the number of employees over the same period.

43
The national experts then attempted to identify the firms in the group of job-creating firms which experienced the highest rate of growth. This dynamic minority constituted the population of “high-growth” firms.
Choice of a growth indicator
Expansion and contraction of firms is analysed here in terms of jobs created, the difference between the number of salaried employees at the end of the period and the number of salaried employees at the beginning of the period.
To identify high-growth firms, a measurement of growth (called the « Mustar » index; see Annex 1) was applied. This index is the product of the relative and the absolute variation in employment:
Xtn Mustar index = (Xtn – Xto) x –––––– Xt0
where Xt = number of employees at t, and n and 0 stand for the beginning and end of the period, respectively.
The firms were then classified in decreasing order according to their value on the Mustar index. Based on this ranking, high-growth firms were defined as the 10% of firms with the highest Mustar index values.
Implementation problems
Despite these directives, major methodological differences remain, so that the present analysis was faced with problems of harmonisation and consistency. The results obtained in each case study are strongly marked by these differences, summarised in Table A.3.
The size of firms (Table A.4) was to be assessed at the beginning of the period. In the Netherlands, the reference size is that of firms at the end of the period. The Netherlands study therefore includes smaller firms (fewer than 20 employees) which experienced growth in employee numbers and excludes firms with more than 20 employees in which the number of employees fell. In other words, compared with other results, this selection method encourages the appearance of a larger number of dynamic firms in the category of the smallest firms. In Sweden, the size of firms is reassessed every year. In theory, the same firm may therefore appear in as many different size categories as there are statistical years in the period. While admittedly this is the most precise method and provides particularly interesting information on interclass mobility of firms, it also has the disadvantage of producing results that cannot be readily compared with those of other countries.
The lower limit on firm size was set at 20 employees. In Spain, the lower limit is around ten employees; Germany’s MUP and MIP databases list all firms indiscriminately without reference to size. At this level, such differences are not negligible. The behaviour of small firms in terms of management, strategy and therefore employment can vary substantially. However, the case studies do provide a number of results by size class. This breakdown makes it possible to limit some conclusions to firms with more than 20 employees. Not all studies based their growth estimates on the same indicators (Table A.5). Italy and Sweden used the Birch index rather than the Mustar index. Germany estimated growth in employment by means of annual percentage rates.

44
The high-growth threshold is also a differentiating factor in that Italy, the Netherlands, Sweden and the Province of Quebec set it at 5% instead of 10%. The 10% threshold should also have been applied to a reference population consisting solely of growing firms. The Netherlands, Spain and Sweden nonetheless selected high-growth firms from the larger population of permanent firms. The number of firms considered to be growing strongly is therefore multiplied commensurately. However, the results observed in all studies show there to be a fairly even distribution of permanent firms between the sub-population in which employment is growing and that in which it is declining (Table A.6).
The Italian experts set the high-growth threshold at 5%. The reference population is firms in the manufacturing sector with 20-499 employees. This allowed determination of a Birch growth index below which these firms were no longer considered to be growing strongly. This index was then applied to large manufacturing firms with over 500 employees and to firms in the services sector. As a result, it is harder to assess the share accounted for by this set of high-growth firms in the population of the initial study. The Italian results nonetheless show that this high-growth population accounted more or less for 10% of the basic permanent population and, by extension, for 20% of the growth population. In this respect, the situation of Italy is therefore closer to that of Spain.
Table A.3. Divergence between the firm selection criteria used and initial directives
OECD directives France Province of Quebec
Italy Netherlands
Criterion 1: Minimum firm size
Date of observation
Beginning of period
Beginning of period
Beginning of period
Beginning of period
End of period
Lower limit 20 employees 20 employees 20 employees 20 employees 20 employees
Criterion 2
Survival throughout period
Survival throughout
period
Survival throughout
period
Survival throughout
period
Survival throughout
period
OECD directives Spain Sweden Germany (MUP)
Germany (MIP)
Greece
Criterion 1: Minimum firm size
Date of observation
Beginning of period
Beginning of period
End of period Beginning of period
Beginning of period
Beginning of period
Lower limit 20 employees 10 employees 20 employees No limit No limit 20 employees
Criterion 2 Survival
throughout period Survival
throughout period
+ creations >20 empl. in
1996
Survival throughout
period
Survival throughout
period
Survival throughout
period
Source: Preliminary Phase I reports.

45
Table A.4. Comparison of class sizes adopted in the case studies
France Province of
Quebec
Italy Nether-lands
Spain Sweden Germany (MUP)
Germany (MIP)
Greece
First class 20-49 20-49 20-49 20-49 10-21 20-250 0-9 0-24 20-49 Second class
50-99 50-99 50-99 50-99 21-50 250 + 10-24 25-99 50-99
Third class 100-249 100-199 100-199 100-199 51-100 25-49 100-249 100-249
Fourth class 250-499 200-499 200-499 200-499 101-200 50-99 250-499 250-499
Fifth class 500-1999
500 + 500-999 500+ 201-500 100-249 500-1000 500-1000
Sixth class 2000 + 1000 + 501 + 250-500 1000 + 1000 +
Seventh class
500 +
Source: Preliminary Phase I reports.
Table A.5. Points on which growth indices diverge
OECD directives
France Province of Quebec
Italy Nether-lands
Spain Sweden Germany (MUP)
Germany (MIP)
Greece
Type of indicator
Mustar index
Mustar index
Mustar index
Birch index Mustar index
Mustar index
Birch index
Log. AARG1
Log. AARG1
Mustar & Birch
indexes
High growth threshold
10% 10% 5% 5% 5% 10% 5% 10% 10% 10 %
Reference population
Growth firms
Growth firms
Growth firms
Firms in mfg. sector
with 20-499
employees
Permanent firms
Permanent firms
Permanent firms
Growth firms
Growth firms
Permanent firms
1. Logarithmic average annual rate of growth. Source: Preliminary Phase I reports.
Table A.6. Size of study populations and sub-populations by case study
Number of firms
France Province of
Quebec
Italy Nether- lands
Spain Sweden Germany (MUP)
Germany (MIP)
Greece
Permanent population
10 691 2 977 32 653 23 416 1 174 8 173 3 644 788 2 305
Growth population
5 034 1 496 18 256 14 228 369 1 067
High-growth population
5 034 1 496 18 256 14 228 369 221
Source: Preliminary Phase I reports.


47
Chapter 2
CHARACTERISTICS OF HIGH-GROWTH SMES
Introduction
The aim of the second phase of the study was to analyse further the features of high-growth SMEs, to underscore certain characteristics of the high-growth process and to draw lessons for both firms and governments. This section of the report summarises the analytical findings regarding the characteristics of high-growth manufacturing small and medium-sized enterprises (SMEs) contained in three case studies (France, Netherlands and Canada’s Province of Quebec). The studies do not use the same methodology. The Quebec report draws on case studies conducted via questionnaires and interviews with the management of 52 SMEs (46 manufacturers and six business service providers). The Netherlands study is based on a survey by questionnaire comparing groups of high-growth and low-growth firms, which was supplemented by a set of case studies (Ministry of Economic Affairs, 1999). French high-growth enterprises were analysed using a postal survey to which nearly 150 companies out of a population of 1 000 high-growth firms replied (See Annex 1). Despite the different approaches and the different basis of interpretation, an effort is made to draw conclusions common to all three studies.
However, the approach has shortcomings. It tends to give the appearance of a standardised, ideal enterprise which does not in fact exist, or if it does, it is the exception rather than the rule. The “model” firm, which would display all the characteristic features, omits important ones, such as specific company histories and sector characteristics. Furthermore, the characteristics of high-growth SMEs presented here do not come into being fully formed. They are patiently crafted by company management and are the fruit of a process which both triggers growth and is triggered by it. Neither is it possible to compare the three studies of high-growth SMEs. There is a lack of material to document their social and economic features, and the teams responsible for the surveys use dissimilar methods. Another constraining factor is the concentration on manufacturing which ignores the shifting boundary between manufacturing and services.
Finally, the subject of the stages of growth – start-up, survival, development, growth and high growth – is not addressed. While these stages indicate that growth is a process, they also imply that the process is to some extent linear. The study of the “trajectory” of 500 high-growth enterprises in France shows, on the contrary, that the growth process is rarely linear (see Annex 1) and that no single blueprint applies to every company. The survey methodology takes into account firms of different ages at widely varying stages of development. The three studies concur that there is no single model for company development and that each firm is the product of its past. They differ in their competencies, markets, organisation, staffing and management techniques. Nonetheless, despite the variety of enterprise situations, certain broad tendencies can be deduced with regard to high-growth SMEs.

48
Innovation
Product innovation plays a key role in the high-growth process. Empirical studies have underlined the relationship between new product development and business competitiveness. The three case studies all stress the crucial role of innovation in the growth of SMEs. They confirm that innovation expresses itself in new products and that these are a driving force in high-growth firms. Compared with low-growth businesses, high-growth firms put new products on the market more often (Netherlands).
Most high-growth businesses respond to their customers’ needs in novel and precise ways. All three studies indicate that in such firms, product innovation is intimately linked with process innovation. The development of new products and the improvement of existing ones require innovation in the production system, including incremental innovations touching upon the product, production methods and customer approach (Province of Quebec). Product innovation, like process innovation, goes hand in hand with organisational change and innovative marketing techniques (France). Innovation cannot therefore be reduced to the technical development of new products. It affects organisation as much as technology and is present throughout the value chain (Province of Quebec). Innovation in high-growth enterprises is therefore a pervasive activity affecting all aspects of operations (France).
As a result, growth is closely bound up with a company’s ability to innovate. The durability of growth is related to a company’s skill at creating an upward spiral of innovation. Continual innovation induces steady or regular product, production or organisational inventiveness (France), and all three often proceed together, thus explaining the frequent changes of organisation encountered in high-growth firms (France).
Many players from outside a company are part of the innovation process. High-growth enterprises maintain especially close relations with their clients and innovate to respond to their specific requirements. Clients, far from playing a passive role, take an active part in the innovation process (Province of Quebec; France). Other stakeholders (distributors, suppliers, a company’s parent group) are also closely involved in the process. A firm’s ability to innovate owes much to its skill in establishing partnerships with a broad range of actors.
High-growth enterprises are more heavily committed than others to R&D (Netherlands, France), yet few have conventional R&D facilities. Those that lack a formal R&D department perform research in ways that depend more on networking. If they are subsidiaries, they may provide research assets and findings (France). Another approach is to engage in partnerships with government research or academic institutions. In general, such public/private relationships are more developed in high-growth companies than in others (Province of Quebec). They may take the form of staff training pacts or R&D agreements in support of innovation (Province of Quebec). Many high-growth undertakings call upon the services of scientific advisors (Province of Quebec).
Market/technology linkages
High-growth businesses are strongly market-oriented (Province of Quebec). They cultivate a strategy of differentiation which depends on close client relations, including frequent and personalised contacts, especially with other firms. The strategy may go as far as customising production for clients or adjusting it to some extent for each client (Province of Quebec). The markets for high-growth firms are not necessarily high-growth markets, but they require a proactive strategy on the part of the firm (France). They may try to enter market niches where there is little competition, but other growing

49
enterprises may be faced with rapidly rising numbers of competitors on their markets (Netherlands). Growth, in the large majority of cases, is achieved in the same sector of activity (France).
There is no one best way to innovate for the market. A company must adopt a particular innovation strategy depending on its sector, competitive position, skill base and background. A firm may opt for a cost-leadership strategy (Netherlands). The commonest strategy seems to be innovation to improve product quality and customer satisfaction rather than to lower costs. Product differentiation strategies aim at distinguishing a company’s products from those of its competitors (Province of Quebec). An innovation strategy may be used to expand existing markets or conquer new ones (France). These complementary goals are pursued concurrently to broaden the range of products sold to the existing clientele and to reach new clients and markets (France). In comparison with low-growth companies, high-growth firms experience larger increases in both the number and range of customers (Netherlands).
High-growth firms and exports are often linked, as the case studies carried out in the first phase of the project make clear (see Part I). Most of these companies’ products have a world-wide market. Growth and international outreach are often linked (Province of Quebec). However, there appears to be no difference between a high-growth firm’s tendency to export and that of a low-growth company (Netherlands). This means that the relationship between exporting and company growth is not linear, and it cannot be claimed that exporting promotes growth (France). Exporting is not the endpoint of the high-growth process, it seems rather to be a pre-condition or departure point. For growth, a healthy domestic market is as important as exports (France). While export readiness is important, so is the way in which a company exports. Most small or large high-growth firms rely on a foreign sales office for their export activities (France; Netherlands). This reflects a need to stay close to customers, even those located in a distant market.
Organisation and management
The organisation and management of the firm as a whole and its innovation processes are as important as the available human or financial resources (France). A firm which sets aside few resources for R&D and innovation can be more successful than another with a large R&D budget if it employs the proper organisational and managerial approaches. Just as important as the resources available are the ways in which policy directions are defined, resources committed and the structures for using them organised (France).
High-growth enterprises are usually characterised by a decentralised and participatory organisation. The company director deputises many tasks and concentrates efforts on seeking out opportunities or gauging the factors that threaten growth (Province of Quebec). The great majority of high-growth enterprises experience several changes in organisation during their growth process (France). The abandonment of a purely functional structure seems to be a prerequisite for achieving and sustaining growth. Most high-growth companies have a hybrid structure which blends functional and product management (Netherlands). Important decisions and strategy choices are reached by general agreement after discussion.
High-growth companies rely heavily on new technologies for managing production (Netherlands; Province of Quebec), and nearly all avail themselves of the latest available techniques. They present themselves more often as technology leaders or early adopters than others; this is true despite obstacles such as procurement costs and lack of trained staff (Netherlands). Although high-growth firms more often run into the problems associated with employing new technologies, they also seem better able to cope than other firms (Netherlands).

50
Organisational coherence is a major concern of heads of companies. It requires fairly intensive planning of company activities (Province of Quebec). When mapping their market position or checking whether the strategy adopted is best, companies make frequent use of market studies, customer satisfaction polls, strategy planning and regular benchmarking of suppliers and the firm’s organisation (Netherlands; Province of Quebec). High-growth companies make greater use of formal tools and management strategy indicators than low-growth firms (Netherlands). Most have an Internet site, and an overwhelming majority use e-mail for internal and external communication (France; Province of Quebec). High-growth firms tend to set up a technology watch to keep track of their competitors (France; Province of Quebec).
In sum, it is important, regardless of the strategy chosen, that both organisational and management tools be in line with that strategy. As the three studies show, the array of managerial and organisational instruments used by high-growth firms is striking. They are no longer the privileged attributes of large corporations. The key factor in a firm’s competitiveness is better organisation of the innovation process and other functions, more than innovation itself.
Teamwork
High-growth firms involve and motivate their employees in various ways, such as sharing in decision making, internal communication, continuing training, profit-sharing or stock options. They give a central role to the entire staff, both executives and ordinary workers. Their organisation is described as “participatory and learning” (Province of Quebec). Through active human resource management, great attention is paid to team quality and motivation. All three studies stress the close attention paid by high-growth companies to staff training and to wage policy. This attentiveness is noted in most studies of growth businesses.
The high-growth company is run by a united management team with extensive basic training in various areas. The main tasks of company management are to:
• Ensure coherence by means of flexible planning and stimulate organisation by a shared philosophy of action (Province of Quebec).
• Seek fresh business opportunities while promoting innovation, so as achieve greater differentiation and satisfy specific segments of the market (Province of Quebec).
Everyday chores are widely delegated. According to one company director, “I only exceptionally have to attend to everyday matters, but every day I have to attend to exceptional matters.” (France)
Half the time a business’s creator is the managing director (Netherlands) and his or her talent and ambition are key ingredients in success. The company’s dependence on its originator contains risks, however (hand-over problems, refusal to relinquish control, etc.) (Netherlands). Staff communication is an important concern of management and may entail periodic meetings or less formal contacts (Province of Quebec).
Human resource management begins with the quality and educational level of employees. A (commercial and technical) knowledge-intensive production process demands well-trained workers. In general, high-growth firms have better qualified management teams (Netherlands). The managing director is often more academically qualified than the ordinary run of SME directors (Province of Quebec). The top executives of high-growth companies tend to be recruited from outside. This is a

51
sign of the open attitude of high-growth firms (France). The top and middle management staff is often large, with a varied educational background.
High-growth enterprises do their best to upgrade regularly the abilities of their production teams. The continuing training of managers, executives and staff as a whole is of key importance to the firm’s success. These enterprises devote a higher than average amount of resources to the ongoing training of their top staff (Netherlands; Province of Quebec). They also devote more resources than low-growth firms to the training of executives and employees. In terms of time, the least skilled members of the staff benefit from the most training (Netherlands). Continuing training therefore covers the entire workforce (Province of Quebec).
The importance accorded to training may be explained by the difficulty of finding competent technical staff (Province of Quebec). The larger the size of the high-growth firm, the greater the proportion invested in training (Netherlands). Permanent training is not only a matter of hours or budgets. It has also a qualitative side in the sorts of competencies it bestows. Training of directors mainly involves motivation coaching, communication and delegation of authority (Netherlands).
Another teamwork feature of high-growth businesses is that they enable all their staff to benefit from the fruits of growth (France). Incentive schemes, such as profit-sharing or stock options, are part of their human resource management in all three. They are not restricted to top executives but are extended to most management staff and sometimes to all of a company’s workforce (Netherlands). High-growth companies use such incentives much more than low-growth ones. In very different sectors, these packages play a vital part in motivating the company’s personnel (France) and make it easier to hire skilled workers. The lack of skilled personnel is often considered a hindrance to a firm’s growth (Province of Quebec).
Networking
For high-growth firms, alliances and partnerships play a vital role (France; Province of Quebec). Alliances may be formal or informal and are formed with a wide variety of actors. They seem to be more frequent and more varied in high-growth than in low-growth businesses (Netherlands). The organisation of high-growth enterprises is outwardly directed, and almost all company directors state that high growth requires partnerships (France). Four “circles” of partnerships may be distinguished (France):
• High-growth concerns have developed partnerships first and foremost with customers.
• Where a company is a subsidiary of a group, the other units of the group constitute a second major partner.
• Next come distributors, suppliers and sub-contractors.
• They are followed by service providers, competitors and public or private research institutions.
Customers play a key role in partnerships. Most high-growth companies market their products or services directly to clients (France; Province of Quebec). For many companies, the arrival of an important new customer or a request from a customer for a new product is a decisive factor in growth (Province of Quebec). The firm’s market orientation and differentiation strategy are founded on these close customer relations and the frequent detailed contacts that they entail (Province of Quebec). The

52
company’s sales force plays a particularly vital role as mediator between the company’s design activity and the users of its products (France).
After customers, the units of the corporate group are important partners. Most permanent companies in the manufacturing sector need to have the support of a large group in order to grow (France). The group contributes to growth through financial backing, dissemination of good practices and provision of technical expertise or research (France).
The most prominent high-growth enterprises make better than average use of their suppliers’ know-how (Netherlands). Companies co-operate not so much to spread risks and share costs as to open up new markets and develop new products, services or processes (France). The professional or industrial organisations in which high-growth businesses are active are another important constituent of these networks (Province of Quebec).
Recourse to the local environment for supplementing in-firm resources results in the strong presence of private and public advisors. They help by solving various problems or nurturing new projects (Province of Quebec). Businesses call mainly upon organisation experts (more than marketing or technology-innovation consultants) (France). In addition, if all the many forms of research co-operation are considered, one high-growth enterprise out of three has established partnerships in the area of research (France). A final class of actors plays an active role in these networks, namely government. Many firms have benefited from government aid for R&D, training and exporting (France; Province of Quebec). Firms are good at analysing and using the array of public aid measures at their disposal, including financing (France). The French case study also shows that government plays an essential role in financing high-growth SMEs, but it acts more as a back-up than as a causal factor in growth.

53
Chapter 3
POLICY IMPLICATIONS AND RECOMMENDATIONS
There is no simple explanation of fast growth or its absence. Generally, the present study has again provided evidence of considerable heterogeneity (high-growth firms or others), and this makes any kind of policy linked to “common characteristics” hard to formulate and implement.
Firms do not encounter only one type of difficulty any more than they follow a single growth path. Depending on the path chosen, as well as on the business’s background and the milieu in which it develops, they may encounter specific problems or barriers. Each of the characteristics described above has its negative side. Innovation, for example, is a core element in the growth process, but it is expensive and risky. A failure can endanger the company’s financial equilibrium. Exporting, raising money, calculating the risks posed by alliances, finding the right partners and consultants, hiring competent staff, delegating authority, installing a decentralised organisation and sometimes removing or replacing a company director are all difficulties that an SME must face. All choices are strategic; there is no such thing as a trivial choice. One difficulty that is unique to high-growth SMEs is the need to cope with periods of slower growth. Growth is seldom a linear process. Spells of lesser growth can be caused, among other things, by workforce problems, managerial difficulties, the economic situation or financial obstacles. Handling slow-growth periods is a major challenge for company directors.
In most countries, the objective of government is to increase the number of growing and high-growth enterprises (the latter often dubbed “gazelles”) by helping to overcome such obstacles. The case studies suggest certain guidelines for public pro-growth policies which focus on a small number of broad trends that must, however, be adapted to different national contexts. Here, the French and Province of Quebec case studies are the main focus, since the Netherlands study does not deal directly with these issues. National or regional policies might draw on these guidelines in accordance with the characteristics of each country. What is important is to act in areas where there are shortcomings in the country’s SME policy profile.
General approaches
Governments do not have better knowledge than the individual entrepreneur of markets, technologies and projects. It is not government’s job to interfere in business strategy. One of its vital roles, however, is to act on growth-promoting factors and remove certain hindrances. Business growth is tied to such macroeconomic factors as labour and capital market efficiency, the presence of a stock market where businesses can find funding, a tax system that does not penalise business development and conditions for protecting intellectual property and innovation that do not exclude SMEs. Establishing a growth-friendly climate means inducing firms to innovate and invest, spurring business creation and simplifying business/administration relations. A company’s competitiveness depends not only on its internal resources and know-how but also on its environment.

54
Therefore, government policies should take account of the following needs:
• Simplification. Governments should make considerable efforts to reduce red tape. Services catering for business should be improved and made more accessible, while procedures for the economic support of business development should be streamlined.
• Regionalisation. Innovation and high growth are often a matter of local implantation. Policies for promoting interfirm partnerships, or partnerships between firms and institutions of higher learning and/or research institutes are needed at local and regional level. Government departments and agencies responsible for handling business support should work as close to the ground as possible by regionalising their actions.
• Co-ordination. Co-ordination of government policies and programmes at all levels should be a prime objective. Among these are sub-national regions or, where European countries are concerned, the European Commission with its R&D framework programme and the structural funds for aiding development in disadvantaged regions (about half of Europe’s regions). In European countries, the sharing of roles among national, regional and European levels should address the business environment for SMEs (taxes, laws, etc.), the creation of SMEs (e.g. through priority programmes) and networking within and among regions. However, sharing of responsibilities towards SMEs at regional, national and European levels remains an unresolved issue.
• Evaluation. Both policy makers and citizens demand the evaluation of public support programmes and measures. Such evaluation must go beyond the seal of approval; it needs to become an essential strategy application tool. The effects of pro-SME programmes and measures should not be confined to their direct or indirect economic impact. Structural changes (such as the collective development of expertise by a variety of actors) often lie at the programme’s core and need to be assessed. Public authorities should not only ensure the quality and credibility of evaluations but also gear evaluation procedures to the pace of public action. This is necessary if evaluation findings are to have any effect. The general introduction of strategic evaluation should be a national policy priority.
Target group
The study shows that high-growth enterprises are to be found among SMEs of every size. This has major implications for government policy. If the purpose is to encourage job creation, OECD governments must not neglect medium-sized firms. The current policy emphasis is on small, high-growth, high-technology firms. However, government action should not focus on size but should strike a balance among micro, small and medium-sized enterprises. In addition, even in “declining” sectors, some firms are vigorous and continue to create jobs. Another finding of particular interest to regional policy is that even depressed regions generate high-growth SMEs. Growth tends to occur throughout a country, not only in the Silicon Valleys or Italian-style industrial districts. Also, growth policies would do well to consider subsidiaries of larger, corporate groups. In sum, public policies should avoid adopting too elitist a definition of growth SMEs, but should accept that growth is common to a wide range of businesses.

55
Training assistance
No variable in the growth process is more important than workforce training. Improvement in the competencies, knowledge and know-how of the entire staff is a key issue. Basic education is the first area in which government can act. Intellectual investment – schooling and higher education – must be given priority. In the long run, this is undeniably the best way to renew abilities and skills. Education is not limited to school and university; it also applies in working life. Continuing training or lifelong learning for employees enables firms to become what the Province of Quebec study calls “learning organisations”, capable of teaching people quickly how to adjust to change. High-growth firms set great store on employee training.
Areas in which government can act in this respect are:
• Tax incentives for supporting continuing training in SMEs and so induce businesses to invest in staff training.
• Programmes and measures that encourage the supply of such training by the private or the public sector.
• Increasing ties between businesses and higher education institutions, more and more of which offer courses tailored to wage earners or continuing training curricula.
• Helping to establish high-growth employer networks for the exchange of information and experience.
• Introducing courses in entrepreneurship and knowledge of the innovation process into university education.
Government staff recruitment aid programmes (covering high-level technicians, researchers, etc.) can be of crucial importance in helping SMEs to acquire the necessary technological strength. Measures in favour of employee profit-sharing can also be an effective tool for keeping top-grade managerial and other staff. While incentive measures for investing in high-growth companies exist, there are few for enabling growth profit-sharing. Stock options are only one of a number of possible measures. Novel measures for facilitating and fostering the distribution of growth proceeds among shareholders and employees remain to be invented.
Innovation assistance
The ability to innovate is a primary characteristic of high-growth firms. Innovation incentives and subsidies figure among the range of measures intended to support high-growth enterprises. In certain countries (France), existing measures of this kind work reasonably well and are widely used by SME directors, who are skilful at choosing among and exploiting the range of public support schemes available. While further measures on behalf of research and innovation may not be necessary, it can be important to make them available to more SMEs and to expand the definition of the R&D eligible for support, in particular as regards design work and innovation in services. Elsewhere, such measures could be developed so as to further encourage SMEs to innovate, build in-firm R&D capacity, forge links with public research, call in consultants, etc.

56
Enlarging the definition of R&D to cover design and services and making these measures available to larger numbers of SMEs would be useful. Public support measures should therefore encourage not only product innovation, innovation in processing, invention, planning, methods, design and services activities in SMEs but also the use of consultants and new technologies. Measures for stepping up technology watch and use of the Internet by SMEs are also necessary. The market for innovations is increasingly global, and measures for promoting the export capacity of non-exporting firms are important. Because high-growth firms also need to be in direct touch with their customers, over half have set up sales offices abroad for this purpose. Government support in discovering foreign markets and obtaining information on creating such branches could boost this trend.
Governments can encourage networking and clustering to stimulate innovation by SMEs. Many studies stress the collective nature of the innovation process, which associates such varied players as small firms, customers, large corporations, public agencies, private consultants, teaching and research institutions and transfer centres. High-growth businesses form partnerships to a large extent, but not exclusively, with actors from their nearby environment. It can be worthwhile, in the case of regions with few high-growth enterprises, to ask whether the environment is conducive to risk-taking and the formation of partnerships. If so, the establishment of more networks of innovation-inclined businesses may be necessary. In certain regions, local stakeholders have furthered the constitution of “clusters” of companies that group firms with complementary strengths.
Technology programmes like those of the European Commission or certain national or regional programmes, which do not support isolated protagonists as such but aid composite networks (SMEs, large groups, technical centres, university laboratories, etc.), are of help in establishing the partnerships so vital to growth. This type of action could be worth developing, at the local level especially, by encouraging SMEs which do not yet do so to collaborate with other SMEs, large corporations and research centres. SMEs from so-called “traditional” sectors should also be encouraged to take part in such programmes. Three sorts of partnership within these networks should be promoted:
• Expert consultations. Consultation is important particularly as regards non-technological matters. Means of obtaining access to outside expertise, not only for technology, but also for marketing, organisation and exports, should be encouraged. Governments could take steps to improve the quality and variety of outside consultants and build a market for professional advice, consultancy and counselling firms.
• Technology transfer. Technology intermediation, through resource or transfer centres, should be more widely directed towards SMEs. On a broader level, measures that encourage mixed public/private partnerships or structures would be useful.
• Research partnerships. Links between firms and higher education institutions and research centres should be facilitated and multiplied. It should be made easier for SMEs to enter into contact with networks of experts and the technological knowledge available in universities. In the same spirit, the consultancy work of researchers and academics vis-à-vis small firms should be fostered.
Financing assistance
Governments can take steps to increase private sector financing for small high-growth firms. High growth entails costs which many SMEs cannot afford unaided. A company’s aptitude for high growth is largely dependent on the financial system’s ability to meet the challenge of funding growth.

57
Economic globalisation strongly affects the production systems and markets of SMEs but has little impact on their financing machinery. International capital markets are eager to invest in high-growth technology start-ups but show little interest in more traditional SMEs. Their financing thus remains a national, or even a regional, matter. Countries’ financial systems vary widely in their ability to address this problem.
Self-generated funding plays a vital role but it is not enough. The high-growth SME must appeal to outside funding to pursue or consolidate its development. In some countries, this function is exercised by large industrial or financial groups; the large corporation acquires the SME. Another possibility is the funding of growth by the financial system. Three approaches have been successfully used by several countries:
• Fiscal incentives for individual investors to participate in the financing of the SMEs. Various schemes exist, ranging from direct investment to the creation of specialised funds.
• Incentives for maintaining or fostering venture or development capital companies.
• Establishment of secondary stock markets specialising in the funding of high-growth firms.
Venture capitalists act not only as suppliers of funds but also as a network of experts and analysts able to advise businesses at different stages of growth. An efficient financial system requires both quality players and strong relations among them. How can public funds leverage private funds? At regional level, financing and innovation networks can unite parties from the banking, financial and public institutions. By combining public and private resources, they provide leverage and a guarantee which may enable SMEs to gain access to more extensive funding.


59
ANNEX
HIGH-GROWTH MANUFACTURING FIRMS IN FRANCE
by
Philippe Mustar* Professor, Centre de sociologie de l’innovation École Nationale Supérieure des Mines de Paris
* I would especially like to thank Marie-Florence Estimé of the OECD for her unfailing support and confidence throughout this work. The study received help and support from many people to whom I should like to express my warmest thanks. At the French Ministry of Industry, Mr. Jean-Luc Vo Van Qui (DARPMI) and Mr. Jean-Paul François (SESSI) were instrumental not only with regard to the funding of the work but also in providing access to the data from the annual business survey. In the course of the study, the members of the OECD Working Party on SMEs and the members of the expert group furnished advice and made useful comments. The design of the report and its conclusions owed much to many valuable discussions with my colleague Philippe Larédo (CSI, École des Mines). Most of the statistical work in Chapter 2 was done with the help of Pierre-Marie Debreuille, a student at ENSAE. Sincere thanks go to the 150 heads of high-growth firms who took the time to reply to a very long questionnaire. The postal survey on which Chapter 4 is based was conducted with the help of Philippe Crance and Martine Lecoeur of the firm GMV. The data analysis underlying the typologies provided in Chapter 3 was carried out by Jean-Pierre Bordet, who died suddenly in the summer of 1999 in the middle of this work. May this paper serve as a tribute to his professional skills and his outstanding personal qualities.


61
PRINCIPAL CONCLUSIONS
The first part of the report on high-growth businesses in the French manufacturing sector is a quantitative analysis of Ministry of Industry data (databases with information on some 23 000 businesses with over 20 employees) to determine their growth trajectories. The second part, based on a detailed postal survey of 150 high-growth businesses, seeks to determine the characteristics of high-growth businesses and identify factors in their patterns of growth. This summary looks at a number of topics which may be appropriate areas for a review of public authorities’ action plans.
Growing businesses of all sizes
Of the 23 000 firms with over 20 employees in the manufacturing sector in 1994, nearly 10 700 were already in the database in 1985 and remained present throughout the period. The others closed, were moved to another database or fell below the threshold of 20 employees over the study period. The “permanent” firms were successful in that they remained in business for a considerable time.
The permanent manufacturing firms lost jobs during the study period, dropping from a total workforce of 2.4 million employees in 1985 to 2.1 million in 1994, a loss of nearly 300 000. Investigation of changes in individual businesses shows that the losses were entirely attributable to about 100 major firms with over 2 000 employees. Overall, the remaining 10 600 businesses, with between 20 and 2 000 employees in 1985, neither gained nor lost staff. However, half shed jobs (5 400 firms lost nearly 250 000 jobs) and the rest created jobs (5 000 firms gained nearly 250 000 employees). The latter businesses are here termed growing businesses.
Growing businesses were found in all workforce categories, with an approximately equal distribution among the five workforce categories. Over the period, the total workforce in growing businesses with between 20 and 49 employees increased by some 50 000 employees, as did those in the categories of 50-99 employees, of 100-249 employees, of 250-499 employees and of 500-1 999 employees.
This finding clearly shows that governments cannot afford to ignore medium-sized businesses. For a long time industrial policies concentrated on national front runners, and the focus today is on small businesses. However, public policy should probably maintain a balance between very small, small and medium-sized businesses, as small, medium and large businesses complement rather than compete with each other. The study’s findings indicate that conventional cut-offs at 250 or 500 employees have relatively little meaning.
The question of how responsibilities should be divided among regional, national and European authorities remains unanswered. In practice, firms appear to be separated as follows:
• Very small and small businesses whether existing or start-ups gain most from proximity effects and policies adapted to the regional level.

62
• Large SMEs and bigger businesses (between 1 000 and 2 000 employees) that require more substantial assistance can obtain it from national agencies or administrations (which often operate at regional level).
• High-technology SMEs that have emerged from their incubation period turn to global markets and seek international partnerships. A European level appear to be favourable for establishing such network effects.
A few high-growth businesses are responsible for over half the total increase in the workforce
To separate the firms experiencing the highest growth (in terms of workforce) from other growing businesses, the first step is to choose a growth indicator. A number of choices are available. Growth may be measured by volume, i.e. by the difference in numbers of jobs between 1994 and 1985. Relative growth may be measured by determining a multiplier coefficient, for example a business with 50 employees in 1965 and 100 in 1994 will have multiplied its workforce by two. Finally, a combined indicator associating volume and percentage growth may be used. David Birch in the United States has used such an indicator in his work.
This study has adopted a combined indicator (adapted from the Birch index and termed the “Mustar growth index” by the group of researchers participating in the OECD project) because of its relevance to the French case study (see page 43).
The 5 000 growing businesses were listed in decreasing order of their growth indices. The population of high-growth businesses is thus composed of the “top ten”, that is the 500 businesses heading the list. These 500 businesses were quite evenly distributed among the five workforce brackets. For France, this index provides a good indication of the respective share of all workforce categories in job creation.
In all, three populations of businesses were involved at this stage of the study: a group of businesses that shed jobs during the period, another that created jobs and a third that grew strongly.
As noted above, the 5 000 growing businesses increased their workforce by over 250 000. The high-growth businesses, which made up 10% (the top 500) of the population of growing businesses, accounted for 57% of the increase, or more than 138 000 employees. A few businesses therefore accounted for a large share of the increase in jobs.
High-growth businesses in all sectors and in all parts of the country
Growing businesses occurred in all sectors. It is worth noting that the breakdown by sector of the total population and the population of growing business was more or less the same.
High-growth businesses were also found in all sectors, although their distribution was more uneven. The sectors with the most high-growth businesses included not only the chemicals industry and the manufacture of electrical and electronic equipment but also more unexpected sectors such as metals and metalworking.
There was no correlation between growth and very high growth. For example, 9% of businesses in the electric and electronic equipment manufacturing sector experienced growth and 15%

63
experienced high growth. Conversely, in the textile and clothing sector, 10% of businesses were growing and 6% were growing strongly.
Sectoral concentration was significant, with 60% of growing businesses concentrated in four out of 15 sectors. In addition, nearly 60% of high-growth businesses were concentrated in four sectors. Apart from metals and metalworking, the sectors involved were not the same.
The breakdown between growing and high-growth businesses varied quite widely in any given sector. For example, the two subsectors “Pharmaceuticals” and “Soaps, perfumes and care products” made up 48% of businesses in the chemicals sector and accounted for almost 80% of high-growth firms in that sector. Sectoral concentration was reinforced by intra-sectoral concentration.
Analysis of the geographical distribution of permanent businesses, growing businesses and high-growth businesses showed the distribution of growing businesses to be no different from that of the total population. There is therefore no particular concentration of growth businesses.
High-growth businesses were found throughout metropolitan France. However, they were highly concentrated geographically. Two-thirds were located in six regions (one-third in the Ile-de-France region alone). The remaining third were distributed among the other 16 regions.
A first conclusion for public policy is that even “declining” sectors have businesses that display considerable enterprise and are creating jobs. A second conclusion, useful for instance for regional policy, is that high-growth SMEs appear in declining regions. Growth is found throughout the country, i.e. not necessarily in Silicon Valleys or Italian-type industrial districts.
Different types of growth trajectories
Changing workforce patterns in each business were examined for each year from 1985 to 1994 in order to map out the business’s growth trajectory. The first results highlighted the wide variety of these trajectories. The responses to the follow-up questionnaire confirmed this.
In half of the high-growth businesses, the final year of the period was not the year in which their workforce was largest. In other words, at the end of the period the workforce of one out of two firms was lower than its peak workforce for the period. In a third of cases, the workforce size in the first year was not the lowest for the period, i.e. in a third of the businesses, the number of their employees fell at some time below the figure for the initial year and rose thereafter.
These initial findings show that most growing and high-growth manufacturing firms experienced considerable fluctuation in their workforces. For the vast majority, growth did not take place at a steady pace throughout the period. Businesses may experience irregular patterns of growth (with peaks and troughs, slow-downs and spurts of speed) and still continue to grow.
The myth of continuous growth
The principal finding from our study is that continuous growth over a ten-year period is exceptional (even among high-growth businesses). Growth is not a continuous phenomenon. Only 3.8% of the 5 000 growing businesses grew continuously: only 190 firms out of the 5 000 enjoyed ten years of continuous growth. For the population of 500 high-growth businesses, the percentage doubled

64
to 7.4% (37 businesses out of 500). The postal survey confirmed that continuous growth is relatively rare.
During the ten-year study period, few businesses experienced steady growth over a period of seven years or more and only one-fifth of high-growth businesses experienced steady growth over seven, eight or nine years. For almost half, the period of steady growth did not exceed six years. In a third of the cases, firms followed an irregular trajectory with only two or three years of steady growth.
Thus, the overwhelming majority of businesses experiencing strong growth did not grow continuously. The model of a firm with a yearly increase in its workforce has been taken as the norm in many studies, in many press listings and in many policy statements, but it is the exception.
Growth based solely on mergers or acquisitions is virtually non-existent
The model of a business that merges with another and then fails to grow further was also very rare in the study population, since only 0.4% of businesses (two firms) experienced a single year of growth over the whole period. This does not mean that no mergers or acquisitions occurred. There were a great many, but they were generally preceded or followed by other growth phases.
Three-quarters of high-growth businesses experienced at least six years of growth, but not six continuous years of growth
High-growth businesses that experienced no more than three years of growth were also few in number. They represented only 4.2% of the population (25 cases). More than half (54%) of high-growth businesses experienced a total of at least seven, not necessarily successive, years of growth. Over three-quarters of businesses had a total of at least six, again not necessarily successive, years of growth.
In sum, the “average business” in the study population experienced six years of growth and three years of decline during the period under review. Four-fifths of high-growth businesses experienced growth spread over more than one period. In over 80% of cases, high-growth businesses experienced at least two growth phases. Continuous growth is rare, but growth due to merger or acquisition alone is equally uncommon. The reality is far from the pure models of steady internal growth or of external growth by merger or acquisition. Most firms show hybrid patterns of behaviour with a mixture of phases of workforce growth and decline. Many businesses experienced a combination of internal and external growth.
Mergers and acquisitions play an important role in nearly half the cases
A typology of business trajectories was drawn up (the trajectory is the curve tracing changes in employee numbers). This exercise revealed three categories of trajectory for high-growth firms.
Trajectories in the first category were on the whole fairly regular but displayed growth phases punctuated by years of workforce decline (46% of the 500 businesses fell into this category). Firms in this category essentially had a pattern of internal growth. Few indications of a merger or acquisition were found. The question is then how these firms were able to absorb 30 or even 50 new employees a year and what organisational or training issues were involved. Another issue is the limitation on the growth of an already large SME.

65
Firms in the second category generally experienced three years of growth followed by a phase of stagnation or decline (22% of the 500 businesses). Over half experienced 50% of their total growth during a single year. Much growth was due to mergers or acquisitions. Two subgroups may be distinguished: in one the businesses had, at the start of the period, 100 employees on average; in the second, they had an average of 300 employees. A question here of both theoretical and practical interest is the relation between internal and external growth.
Firms in the third category experienced slow or very slow growth until the early 1990s followed by a strong spurt of growth, generally associated with a merger or acquisition (32% of businesses). In this group businesses with fewer than 100 employees were over-represented. Questions of interest here are the effects of this kind of merger and why a small business absorbs a larger one.
In most cases, mergers or acquisitions were followed or preceded by growth phases. In other words, either the firm’s growth allowed it to merge with or acquire another business or the merger initiated a growth trajectory.
Consideration of the questionnaires, which applied to a population different from that of the 500, notably because the proportion of small businesses it contained was higher, showed further that three out of ten businesses combined internal with external growth (i.e. growth by merger or acquisition). The occurrence of mergers raises the question of how many growing businesses are independent firms.
High-growth businesses: are they independent firms or do they belong to groups?
By means of the INSEE “Financial Link” file, it was ascertained that three-quarters of the 500 high-growth businesses were part of a group during the final year of the study period. This finding tarnishes the myth that associates success solely with the independent entrepreneur.
From the standpoint of job growth, the role of the two populations of businesses (subsidiaries of groups and independents) differs markedly. No more than a sixth of the increase in jobs due to the 500 high-growth firms was attributable to those that remained independent at the end of the period. Businesses belonging to groups created five jobs out of six.
These findings show the limitations of studies on high-growth businesses which start by excluding subsidiaries of groups from their field of investigation. If the present study had followed this practice, 86% of the jobs created during the study period would not have been taken into account. They also raise the question of the role of groups in growth. Some answers emerged from the postal survey and are discussed below. Moreover, from the public policy standpoint, subsidiaries of groups are often blocked from some forms of public support. This calls for further discussion.
Some practical, theoretical and methodological lessons
Studies of high-growth firms frequently confine their attention to exceptional cases, i.e. firms with steady growth over the period considered, firms that were not subsidiaries of large groups at the beginning or end of the period, firms that grew entirely by their own means (to the exclusion of mergers or acquisitions), firms whose managers hold at least some of its capital, and so forth.

66
Such studies (which only take into account firms with annual growth of 20% over five years, for example) focus on one very special kind of business. Hence, they give a fairly benign picture of reality, one without conflict, where sales and workforces increase annually and the trajectory of a high-growth business resembles a long, placid river. Such studies ignore much of the reality of growth, which often takes place through a succession of violent changes (new manager, restructuring, etc.).
This is embarrassing from the theoretical standpoint. How can any theory of business growth be built on the basis of marginal cases? There is also a practical aspect: how can public policies be effective if they are based on skewed facts? This does not means that no lessons can be drawn from such exceptional success stories. However, such lessons are only useful in special circumstances that do not apply to the vast majority of businesses.
Such studies pose a problem for heads of businesses. If the picture of growth they give is taken on board, management for growth becomes management for continuity. However, since continuity is rare, such views are likely to be irrelevant or even counterproductive for businesses in the real world.
To conclude, the study of the trajectories of high-growth businesses have shown that although strong growth is a process, there is no “one best way” to strong growth but several different ways. This shows not only that it is impossible, as many studies have done, to take the rate of growth for a given year (for example 20% of annual growth over five years) as the criterion for growth but also that the phenomenon needs to be studied over a long period to understand what forms growth trajectories take.
As a result, it seems important that public policies should not focus on too elitist a definition of a high-growth SME. They should take account of the fact that growth follows different patterns.
Financing strong growth
Growth is a process, but a costly one. Before considering ways of meeting these costs, it is worth noting that two-thirds of the managers of high-growth businesses responding to our questionnaire “totally agreed” or “agreed” with the following views:
• “The biggest problem is not finding finance to start a company, but afterwards.”
• “The French banking system is not geared to financing high-growth businesses.”
• “It is very difficult to finance growth and remain independent.”
The last observation is particularly pertinent since, as noted above, three out of four high-growth businesses were subsidiaries of a group by the end of the study period.
The postal survey made it possible to draw up a list of different ways of financing growth in order of preference.
First, permanent businesses in the manufacturing sector had little recourse to funding associated with high-risk financial markets. New shareholders were mentioned in less than a sixth of cases, while venture capital and financial markets were cited in one case in 20.
The most usual source of finance came from within the firm, with growth being financed by corporate profits. Corporate profits are cited by almost all businesses as a means of financing growth, although this did not exclude other sources.

67
Three other sources of finance, external to the business, were frequently mentioned: borrowing, government subsidies and capital supplied by the group to which the business might belong.
Borrowing was mentioned by one out of two businesses. Next, more surprisingly, came government subsidies and grants, which were cited by a third of firms. In fact, government intervention played an important role in financing growth, and the means by which this took place will be considered below. A third of businesses belonging to a group received capital to finance growth from that group.
For a majority of permanent businesses in the manufacturing sector, entry into a large group is a mandatory point of passage in the growth process.
For businesses that were subsidiaries of groups, the questionnaire asked: “Did the group you belong to help you to grow?” For almost six out of ten businesses belonging to a group, the group helped to ensure growth. In half of the cases, this was done through a contribution to a current account or by increasing capital. Next, in less than half of the cases, groups helped by disseminating good practices and providing technical know-how. In a little under a quarter of the cases they contributed by providing staff and research resources.
Public authorities played a crucial role in financing the growth process. Businesses were able not only to identify but also to make use of the various forms of public support. The study showed in particular that public authorities played a key part in the financing of high-growth SMEs (in addition to finance provided by corporate profits or by borrowing). High-growth businesses have greatly appreciated the various kinds of assistance provided for innovation such as:
• Repayable advances and help with recruitment from ANVAR (national research association) and support from DRIRE (Ministry of Industry).
• Subsidies from local communities (regional councils, general councils, municipalities, etc.).
• Export support from COFACE (export credit guarantor) or the European Commission’s technology programmes.
• Research tax credits.
Most businesses find such assistance crucial, but it should be considered as an accompaniment to growth rather than a trigger. Generally, heads of businesses do not find obtaining public aid difficult. However, many complain of a lack of continuity. Consideration needs to be given to continuity and consistency.
In conclusion, the government system for assisting innovation in France appears to work reasonably well, and the firms surveyed not only know how to identify the range of government support on offer but also how to make use of it.

68
Ten features that accompany strong growth
The postal survey made it possible to bring out certain characteristics of high-growth firms.
Exporting is a precursor of strong growth
The postal survey showed that over three-quarters of high-growth businesses were exporters. The analysis of the database also makes it clear that at the end of the period covered, nine out of ten high-growth enterprises were exporters. Both of the surveys show a strong relation between exporting and high growth.
Both also show that the share of enterprises that already exported at the beginning of the period was also significant: growth cannot be said to be export-driven. Exporting is not the end of the strong growth process but appears instead to be its starting point, acting as a sort of precursor. Exporting – and access to different markets, distribution paths and clientele – precedes rather than follows strong growth; it accompanies rather than drives it, even if enterprises behave differently with respect to exporting, according to their size at the outset. The smaller the enterprise, the more the share of its turnover from exports increases. The largest enterprises have the largest share both at the beginning and at the end of the period, but it is in these enterprises that growth in the share of exports is weakest.
To grow, a strong national market is as important as exports. It is necessary to recognise that exports account on average for a third of turnover. Strong national markets are, in most cases, essential to high growth.
Government policies to encourage the export capacity of non-exporting firms are important. The implementation of measures that encourage exports by non-exporting SMEs is a means of developing the number of high-growth enterprises.
Such businesses also need to be close to their customers and in direct contact with them. To this end, almost half have established marketing subsidiaries abroad. Government support for establishment of such subsidiaries could strengthen this trend.
Strong growth does not go hand in hand with diversification
In most cases, growth takes place in the same sector; it is rarely the result of diversification. While there are examples of businesses that have entered sectors sometimes far removed from their traditional markets and then grown strongly, they remain in the minority. Only a quarter of businesses reported having diversified out of their sector of activity, as compared to three-quarters reporting growth in the same sector, in which, however, they were innovative.
Product innovation drives strong growth
Businesses that experienced strong growth had deliberately adopted a strategy of innovation and had overcome technical uncertainties (they have developed new products) and business uncertainties (they succeeded in conquering new markets and expanding their geographical market area).

69
The study confirms the key role played by product innovation; nearly eight out of ten businesses associate growth with the development of new products and services or broadening the range of their products and services. While three-quarters of growing businesses remained in their original sector, they broadened their geographical area of action and their product range. They also developed new products and services.
Measures to support innovation are among those intended to support high-growth businesses. The postal survey seems to show that many such measures exist and have been reasonably well exploited by heads of businesses.
Innovation in high-growth firms relies on (not necessarily conventional) R&D
The quantitative survey showed that the number of businesses conducting R&D was much higher in the population of high-growth businesses (33% of the 500 firms) than in the total permanent population (13% of the 10 700 firms). There is therefore a strong correlation between conducting R&D and strong growth. However, two-thirds of high-growth businesses have no organised R&D in the sense defined by the OECD’s Frascati Manual. The postal survey showed that many businesses carried out R&D that did not always fall within its relatively narrow definition of R&D. For subsidiaries, the group to which they belonged contribute competencies and research results. It is worth noting that this R&D often received public support.
High-growth businesses are much more deeply engaged in research, either directly or indirectly, than others. The postal survey shows that nearly six out of ten high-growth businesses reported organised research activities. On average, nearly 5% of the turnover of such businesses was spent on research and over 7% of their employees engaged in R&D. The amount of research conducted was greater than ten years previously for over seven out of ten high-growth businesses.
Businesses that reported no organised research held patents or received research tax credits (the latter because the procedure for granting research tax credits allowed for outside or subcontracted research). When such businesses are taken into account, seven out of ten high-growth businesses engaged in research activities.
R&D has benefited from public support, and 70% of businesses with organised R&D received research tax credits during their period of growth.
Further measures to promote research and innovation appear unnecessary. However, it would be useful to make existing measures more accessible to a larger number of SMEs and to enlarge the definition of R&D used (notably with respect to design and service innovation).
Managing the innovative organisation
Those in charge of high-growth enterprises not only manage innovation, they manage an innovating organisation. Innovation in high-growth businesses is all-embracing. It concerns not only new products but also process innovation, changes in the way a business is organised and new ways of marketing products.
Production systems in high-growth businesses use sophisticated management and production techniques. Over seven out of ten high-growth businesses used computer-assisted production management (CAPM), two-thirds had ISO certification and just-in-time production systems. For
70
almost seven out of ten, changes in the production system helped to ensure growth. When strong growth is due to product innovation, the latter is inseparable from process innovation, which also drives growth.
From the policy standpoint, process innovation by SMEs should be encouraged, especially as process innovation does not necessarily entail a cut in production staff in high-growth businesses. “Production” is one of the two functions showing greatest workforce growth (along with “engineering and design methods”). The changes reported seemed growth-related changes as opposed to defensive improvements in productivity that cut the workforce.
In these high-growth manufacturing businesses, production evidently occupied a large place and design activities were gaining in importance. A long process of change is under way, but seems to have been missed by many analysts. This rapid extension of engineering and design methods played a major role in the businesses studied.
For the heads of businesses questioned, strong growth was more closely linked to process and product innovation than to marketing innovation. The latter is, however, not without importance since it was mentioned by a third of the businesses.
Seven out of ten high-growth businesses underwent organisational changes during the course of their growth. There are no significant differences between independent businesses and subsidiaries.
The interviews conducted with heads of growing businesses reinforced the idea of growth as a phenomenon closely associated with a business’s capacity to innovate. However, they also indicated that the capacity to continue to grow strongly is associated with a capacity to initiate an upward spiral of innovation. This leads to a regular or steady process of product, production or organisational innovation (these generally develop simultaneously). The spiral model contrasts with a view of innovation as a process that leads from one steady state to another steady state. It is the opposite of the “one-off” innovation, and it enables a business to combine technical or marketing skills it has already mastered with new elements. The upward spiral model shows a continuing series of improvements to products (incremental improvements, production of new versions, broadening the product range) and to the production, marketing and, more generally, the organisation of the firm.
Markets for high-growth businesses are not only strong growth markets
Only a third of the markets of high-growth businesses were strong growth markets. Nearly half operated in low-growth markets. A minority of businesses answered “no” to the question early in the questionnaire: “Is growth driven by natural market growth?” Growth was not driven “naturally” by the market, but required a pro-active strategy. In one case out of six, businesses had grown strongly in markets that were either stagnant or in recession.
In almost all high-growth businesses, growth was achieved by winning new customers. Broadening a product range or the services sold to the same customers also helped virtually all businesses. These two approaches seem to have to be used together if growth is to be generated. Broadening a product range for sale to the same customers and winning new customers are two strategies that are complementary rather than competitive.

71
High-growth businesses are tied to a number of principal customers by one or two leading products
How do high-growth businesses market their products? Almost nine out of ten high-growth businesses marketed their products or services directly. This put them in direct contact with their customers, who played a key role, a topic that received a prominent place in questions on partnerships. Concentration of turnover with their principal customers is high. Two-thirds of high-growth businesses depended for between a quarter and all of their turnover on their five leading customers.
In France, the average market share of the leading product of high-growth businesses was over 50%, that of their second product 33%. On average, the two leading products of high-growth businesses accounted for over half of their turnover. A number of high-growth businesses made their living from their two leading products. A large proportion of these businesses were unable to make further progress in their current markets but would have to look elsewhere to diversify or expand their geographical area.
High-growth businesses are open to the outside world and do not hesitate to call on outside expertise
More than two-thirds of high-growth businesses kept a systematic watch on the competition. Three-quarters took steps to ensure customer satisfaction. This is further evidence of the considerable attention paid to customers noted above. To get a better picture of their markets, high-growth businesses used a number of approaches. However, their sales staff played a particularly crucial role as intermediaries between the design side of a business and the users of its products. To evaluate their markets, eight out of ten high-growth businesses made use of reports by sales staff. High-growth firms had mastered many marketing tools.
More than half of the businesses used consultants. Generally, they were more likely to retain the services of consultants in organisational matters (rather than marketing, technical matters or innovation).
The attentiveness of high-growth businesses to the outside world is apparent from the way they recruit their senior staff. In two out of three cases, top-level staff in high-growth businesses had been recruited from outside the firm. The other third were internal promotions.
Two-thirds of high-growth businesses also kept a systematic technology watch. At the time of the questionnaire, the great majority were conversant with new electronic communication technologies, had an Internet site and used electronic mail for communication not only with customers and outside partners but also within the firm.
Measures intended to support recourse to consultants, a technological watch and use of the Internet by SMEs appear to be useful strategies for widely promoting these techniques.
Growth is strongly associated with establishing a wide range of partnerships
The postal survey highlighted the central role of partnerships in the process of achieving high-growth. Almost all the heads of businesses questioned said that strong growth depended on partnerships. In the network of contacts of high-growth businesses, the customer was a major partner (mentioned in eight out of ten cases). Partnerships forged by high-growth businesses are principally with their customers.

72
A second major source of partners is other entities of the group to which the business belongs. Two-thirds of subsidiaries reported having achieved their growth through such partnerships.
In addition, there were two other groups of partners. The first included the distributors, suppliers and subcontractors (mentioned by a quarter and a third, respectively). The second includes service providers and competitors (mentioned by nearly one out of six respondents), industrial technical centres and research enterprises (mentioned by one out of ten) and public-sector laboratories (mentioned by one out of 20).
Businesses establish partnerships not so much to share risks and costs as to open up new markets and to develop new products, services or procedures. When high-growth businesses establish partnerships, it is to minimise the technical uncertainties involved in developing new products or procedures and to open new markets.
Few businesses seem to have established research partnerships. In another part of the questionnaire, businesses were asked if they had taken part in research programmes involving other countries or public-sector laboratories, or whether they were involved in any European projects. Such businesses may be added to those who responded affirmatively to the questions relating to partnerships with research enterprises, industrial technical centres and public-sector laboratories. Overall, when all these possible ways of co-operating for research were taken into account, a third of high-growth enterprises were found to have research partnerships.
Technological programmes, such as the those of the European Commission, or certain national or regional programmes which support not individual players but various kinds of networks instead (SMEs, major groups, technical centres, university laboratories, etc.) can foster the establishment of the partnerships so necessary to growth. This approach is worth promoting, particularly the encouragement of SMEs to collaborate with other SMEs, with major businesses and with research centres.
High-growth businesses attach great importance to staff training and pass on the benefits of growth to all their staff
The share of total wages devoted by high-growth firms to training has increased in almost all cases over the period covered. In more than half, it has even increased strongly. In all, close to 4% of total wages of these firms is devoted to training, a share higher than the average expenditure by French SMEs.
Use of incentive packages was a common practice in high-growth businesses. Nearly eight out of ten high-growth businesses provided incentive packages. Nine out of ten offered incentive packages to all employees. It should be borne in mind that only 10% of French industrial firms make use of incentive packages. Incentive packages may thus be considered a hallmark of high-growth businesses. In very different sectors and taking very different forms, this practice has played a vital part in mobilising the energies of the whole of a firm’s workforce.
Policy measures that facilitate or encourage this practice will have an impact on the growth potential of businesses. Although there are measures for promoting investment in high-growth businesses, few encourage sharing the fruits of growth.

73


75
INTRODUCTION
The problem of mass unemployment in most European countries has led both politicians and research workers to give greater attention to SMEs. Many studies covering different countries have shown that SMEs are important job creators. Such studies have found that in all countries job creation and job contraction go hand in hand. It is frequently observed that in the same economic sector or in the same market some firms shed jobs while others gain them and that some of the latter exhibit very substantial workforce growth. Such high-growth businesses are now the focus of policy-makers’ attention (this is particularly true in relation to some aspects of France’s recent Innovation Act).
From new high-growth enterprises to permanent high-growth businesses
Although most observers agree that SMEs play an important part in job creation, there is considerable dispute about which businesses contribute most to the creation of new jobs. For some, such as Storey (1994) or Birch et al. (1993), a small group of very high-growth SMEs are the source of most new jobs. Others maintain that job creation is chiefly the result of the establishment and gradual growth of a very large number of small start-up businesses (Davidsson, 1995). This is the basis of the debate opposing advocates of the “gazelles” and of the “mice”.
This debate, however, is not the subject of this case study. Without in any way wishing to underestimate the importance of the debate, the focus here is on existing or older SMEs (called “permanent” SMEs), in particular those whose workforces have exhibited strong growth. Little attention has been paid to such businesses. David Birch, for example, considered three groups of businesses, to which he gave the names of animals: elephants (large businesses quoted on the stock market), mice (small slow-growing start-up firms) and gazelles (small fast-growing start-up firms). No specific attention was paid to medium-sized or longstanding businesses.
The present study is based on the following three points: i) new high-growth businesses exist alongside a group of high-growth permanent businesses; ii) the latter have heretofore received little attention, and little is known about the type of growth they exhibit; and iii) detailed consideration of this group of firms could be useful both from the theoretical standpoint (leading to a better theory of high-growth firms) and from the practical standpoint (leading to the adoption of policies supporting such businesses and an increase in their number). In terms of government policy, it is suggested that new high-growth businesses do not compete with older ones with fast-growing workforces but complement them.
Issues involved and basic assumptions
The purpose of the study was to gain a better understanding of the phenomenon of high growth in permanent SMEs in France’s manufacturing sector, high-growth SMEs being defined as those with the fastest-growing workforces.

76
Current studies on high-growth businesses highlight a number of characteristics, namely that they are chiefly small independent businesses, exhibit steady growth over a number of years, are more likely to be in the advanced technology or the services sector, etc. The aim of this study was to compare these findings, all based on small samples, with the overall situation in France by looking at job creation and contraction at the level of the individual firm. The employment history of all manufacturing firms with over 20 employees was scrutinised with the help of the database compiled by SESSI (Statistical Service of the Ministry of Industry).
It was decided at the outset not to start off with a preconceived definition but to observe the population available so that the definition of a high-growth firm would be the outcome of empirical work, not a starting point.
International comparison
This report concerns France. The methods used served as a model for nine further case studies in countries where the same questions were relevant: Germany, Greece, Italy, Japan, the Netherlands, Spain, Sweden and the United States and Canada’s Province of Quebec. The French case study was financed by the French Ministry of Industry, and when the other studies were set in motion, national experts were made responsible for finding the additional funding needed to carry out the surveys. The case studies on Germany, Japan and the United States could not be fully carried out because, despite OECD support, the American, German and Japanese experts were unable to find additional funding in their countries. Six detailed national studies were therefore carried out. However, they differed in kind and in their fields of investigation (see the Methodological Annex to Chapter 1). The scenario for the French study, which was also used in the other studies, had two phases:
• Phase I, in which data on firms were examined in order to identify high-growth firms, establish their role in job creation and determine the features that distinguished them from firms not exhibiting high growth. This work was carried out on the basis of data provided by SESSI.
• Phase II, in which the factors promoting growth in a firm and its contribution to job creation were determined. Phase II was based on a detailed study of high-growth firms. It was also intended to determine what government action might facilitate high growth and job creation in firms. Only four of the nine participant in Phase I were able to carry out Phase II. For France, phase II was based on a detailed postal survey of high-growth firms (the two populations were not exactly the same, mainly with regard to time frames).
The French case study
In this report, four chapters deal with four different, albeit complementary, methodological approaches. Sections 1-3 cover Phase I of the project and Section 4 presents the findings of Phase II.
Section 1 explores the dynamics of high-growth businesses from the macroeconomic standpoint and looks at their contribution to employment in the manufacturing sector, their size category, the regions and sectors in which they operate. whether they are independent firms or subsidiaries of a group, their relationship to R&D, exports, etc. Section 2 looks at the progress of high-growth firms year by year, to learn whether growth is continuous or discontinuous and determine the number of years or phases of continuous growth they exhibit. Section 3 constructs a typology of growth trajectories for the businesses under study to see whether it is possible to define a single best way of achieving high growth or several key types of growth.

77
Section 4 is not based on the Ministry of Industry’s database but on a postal survey of more than 140 high-growth businesses. The survey provided some answers to questions about the nature of the growth process, network dynamics and the role of partnerships in the growth process, the organisation, management and human resources of high-growth firms, and the role of public authorities in the growth process.

78
1. THE DYNAMICS OF HIGH-GROWTH SMES IN FRANCE A STUDY OF THE MANUFACTURING INDUSTRY, 1985-94
Introduction: objectives, period of observation and databases used
This chapter reports the findings of the study of high-growth SMEs in the French manufacturing industry made on the basis of data provided by SESSI (Statistics Service of the Ministry of Industry). In 1994, there were nearly 23 000 businesses with over 20 employees in this sector. The firms of interest within this population were those already in existence in 1985, i.e. those that were continuously present (“permanent”) during the period 1985-94. Businesses that started, closed or whose workforces fell to fewer than 20 employees during the period were therefore excluded. 13
Observation period
This study seeks to understand the dynamics of high-growth businesses. Because growth is by definition time-related, a ten-year period of observation was chosen. While many related studies confine themselves to a shorter time scale (generally five or six years), a shorter period had two drawbacks:
• It carries a risk of seeing the growth pattern of the study population affected by a brief upturn or downturn in the business cycle, which would weight the data too heavily. The period 1985-94 has the merit of including two cycles of growth and recession.
• A shorter period would also suggest that growth happens over a short period. This would remove phenomena occurring gradually over a longer time period or in successive steps.
Data used
The main source of data was the database compiled by SESSI from its annual survey of businesses (EAE). Two other databases supplemented these data. A database of the Ministry of Research gave the findings of a survey of R&D in businesses. An INSEE database containing the findings of the financial liaison survey (LIFI) shows whether firms are independent or belong to a group.
The SESSI database covers three major sectors:
• Manufacturing industry [coded D in the French nomenclature of economic activity (NAF), in NACE and in CITI]. Nearly all the businesses in the population studied (97%)
13. More exactly, the exclusion reflected the coverage of firms in the Ministry of Industry’s database
(firms are surveyed from the time their workforce reached 20 employees).
79
belonged to this sector, which is broken down here into 13 subsectors identified by a two-letter code (DB to DN).14
• Mining industry (code C) (2% of businesses).
• Electricity, water and gas supply (code E) (1% of businesses).
Manufacturing industry is under the responsibility of the French Ministry of Industry and businesses in this sector are surveyed regularly. The present study used the quantitative data produced by these surveys.15 The population studied comprised all businesses in these three sectors with over 20 employees in 1985 and still in existence in 1994. The survey therefore covers the entire population of permanent manufacturing firms with at least 20 employees during the period 1985-94.
Permanent businesses and growing businesses
Examination of the cylinder of permanent businesses
One in two businesses were permanent throughout the study period. Of the 23 000 firms with over 20 employees in the manufacturing sector in 1994, 10 691 were already in existence in 1985.16 Over half of the business included in the database in 1985 continued operations throughout the period. This subset of 10 691 businesses that were in operation throughout the period 1985-94 (which statisticians call a cylinder and which SESSI statisticians made available) is studied more closely.
It may be taken as a first premise that these 10 691 businesses were successful, as they stood the test of time. One-half of businesses with over 20 employees in 1985 were no longer in the database in 1994. This implies either that they had failed, merged with another business or fallen below the threshold of 20 employees during the period concerned.
The 10 691 businesses that lasted throughout the period shed jobs (10% of their total workforce). They had a total workforce of 2 413 283 employees in 1985 but only 2 118 070 in 1994. They therefore shed nearly 300 000 employees during the period.
In order to understand the changes taking place in the population of permanent businesses, large and very large business were not excluded from the initial population. Table 1 breaks down the total population into six workforce brackets.
14. The data in subsector DA, relating to agriculture and the food industry, are the responsibility of the
Ministry of Agriculture and not accessible.
15. The following sectors were therefore excluded from this study: construction industry (class F under NAF, NACE and CITI); trade, motor vehicle repairs and domestic articles (class G); hotels and restaurants (class H); transport and communications (class I); financial activities (class J); property, rentals and business services (class K); public administration (class L); education (class M); health and social welfare (class N); community, social and personal services (class O); and domestic services (class O). These were sectors for which detailed quantitative data were unavailable.
16. Existence here signifies “existence in the database”; firms enter the database when their workforce reaches 20 employees and leave it when it falls below 20.

80
Table 1. Number of businesses and employees by workforce bracket in the 1985 and 1994 populations
Workforce bracket
No. of firms base 1985 Employees in 1985 No. of firms
base 1994 Employees in 1994 Change in no. of employees
20 à 49 5 172 179 707 5 099 170 825 -8 882
50 à 99 2 349 168 824 2 408 170 914 2 090
100 à 249 1 807 282 974 1 905 296 144 13 170
250 à 499 720 250 822 754 260 311 9 489
500 à 1999 501 443 409 524 476 125 32 716
2000 et + 142 1 087 502 101 743 751 -343 751
Total 10 691 2 413 238 10 691 2 118 070 -295 168
In 1985, 5 172 businesses in the population employed between 20 and 49 persons. In 1994, there
were 73 fewer in this category. Some businesses moved into higher brackets during the period, while others that started in higher brackets saw their workforce diminish and joined the 20-49 employee bracket. At the other end, 142 businesses had over 2 000 employees in 1985. Only 101 remained in this category in 1994. There was a substantial contraction in the workforce in this category: almost 350 0000 jobs were shed.
Large businesses with over 2000 employees shed jobs
These changes were examined at the level of individual business. When the trajectory of the 142 businesses with over 2 000 employees in 1985 is examined (using their identification number), the workforces of 119 (or 84%) had contracted in 1994 (by 313 822 employees), while those of only 23 (or 16%) expanded (by 15 734). Taken together, this group shed a total of 282 354 jobs during the period 1985-94. In other words, the loss of almost 300 000 jobs from the population of permanent businesses was attributable to businesses with over 2 000 employees.
On the other hand, businesses that in 1985 had between 20 and 2 000 employees neither gained nor lost employees. However, it will be seen that these businesses underwent a major shift that saw half of them shed jobs while the other half gained them.
Growing businesses
The population of permanent businesses was broken down into two subpopulations: one in which the number of employees expanded and one in which it contracted. Three questions need to be asked about this population: how many saw their workforces grow and by how much? how many saw their workforces decline and by how much? how many kept the same number of employees? Table 2 presents the answers to these three questions.
Table 2. Classification of permanent businesses in terms of workforce change
Workforce No. of firms. Employees in 1985 Employees in 1994 Change
Upwards 5 034 593 557 850 968 257 411
No change 261 12 979 12 979 0
Downwards 5 396 1 806 702 1 254 123 -552 579
Total 10 691 2 413 238 2 118 070 -295 168

81
Almost half of the businesses increased their workforces by at least one employee and almost half lost at least one employee over the period. The 5 034 businesses that expanded increased their total workforce by 257 411 jobs, but this was not enough to compensate for the loss of over 550 000 jobs by the businesses that saw their workforces contract. Once again we see the shedding of 295 168 employees that was attributed above to businesses with over 2 000 employees.
Workforce size classes of growing businesses
Apart from the group of businesses with over 2 000 employees, the approximately 250 000 jobs created by growing businesses during the period 1985-94 were to almost the same extent (17% and 20%) due to five size classes of firm. In other words, the 151 businesses with between 500 and 1 999 employees in 1985 experienced a total increase in their workforces equivalent to that of the 2 810 businesses that had between 20 and 49 employees in 1985. Growing firms were found in all size classes (Table 3). Within the subpopulation of businesses with an expanding workforce (growing businesses) an effort was made to identify those experiencing the highest growth.
Table 3. Growing businesses broken down by size class
Size No. of firms Workforce in 1985 Workforce in 1994 Change
20-49 2 810 56% 91 497 15% 143 568 17% 52 071 20%
50-99 1 003 20% 71 166 12% 113 915 13% 42 749 17%
100-249 773 15% 119 747 20% 174 927 21% 55 180 21%
250-499 274 5.5% 95 630 16% 141 725 17% 46 095 18%
500-1999 151 3% 127 503 21% 173 085 20% 45 582 18%
2000 + 23 0.5% 88 014 15% 103 748 12% 15 734 6%
Total 5 034 100% 593 557 100% 850 968 100% 257 411 100%
High-growth businesses: choosing an indicator
How are high-growth businesses (in terms of workforce) to be identified among the growing businesses and what is high growth? The first task is to find a growth indicator for such businesses:
• Growth may be measured by volume. A volume indicator is obtained by subtracting from the workforce of each business in 1994 its workforce in 1985 (an absolute value indicator such as this allows for separating expanding businesses from contracting businesses).
• Growth may be measured in relative terms by working out a multiplier coefficient. A business with 100 employees in 1994 and 50 in 1985 had thus multiplied the number of its employees by two. A proportion indicator may thus be calculated by dividing the 1994 workforce in each business by its 1985 workforce.
• These two indicators may be combined to bring together volume and percentage growth. David Birch in the United States has used such an indicator. The French study combined the volume and the proportionate increases in the number of employees (product of the two preceding indicators). It is even possible, as did those carrying out a similar survey in the Netherlands, to give these indicators different weights to ensure over-representation or under-representation of certain categories of businesses in the study population (like handicapping in horse racing to even up the odds).

82
These different approaches were tested and the study population of 5 034 growth businesses was classified accordingly (in fact, the tests involved 5 011 firms, as the 23 with more than 1 999 employees were eliminated from the study). Then, in each case, the 500 businesses that had performed best were picked out. Depending on the indicator chosen, the composition of the group of 500 high-growth businesses varied widely (Table 4).
Table 4. Distribution of workforce size classes for 500 high-growth firms, three indicators
Size class Volume Proportion Combined
20-49 10% 59% 21%
50-99 16% 22% 20%
100-249 28% 13% 23%
250-499 24% 4% 20%
500-1999 21% 2% 16%
100% 100% 100%
With the volume indicator, i.e. on the basis of the number of jobs, three-quarters of high-growth
businesses belonged to categories with over 100 employees. With the proportion indicator, 80% of high-growth businesses belonged to categories with fewer than 100 employees. With the simple combined indicator used, the five workforce categories were relatively equivalent; however, the large workforce categories were over-represented compared to their presence in the initial population.
In the case of France, this relative over-representation is relevant for at least two reasons:
• First, it allows for the fact that in each size class the workforce increased by essentially the same number of jobs, so that each class appears worth studying. Indeed, as Table 3 shows, each of the first five size classes had an increase of around 50 000. Among growing businesses, these five classes were responsible for 21%, 18%, 23%, 19% and 19%, respectively, of the total increase in employment. Use of the combined indicator maintained a balance between the five classes. Failure to keep enough businesses in the classes with over 100 employees would weed out two-thirds of the increase in jobs over the period and would seriously weaken the usefulness of any policy recommendations based on the study.
• Second, it ensures a sufficiently large number of businesses in each size class to permit a study of behaviour and allow for the relevant statistical tests. With ten businesses in the 500-1 999 class, statistical analysis would not be possible, but with 70 the findings would be more valuable.
No tools are neutral and they imply policy choices. It would be illusory to believe in a universal indicator for classifying businesses. Any such indicator could only be of value in relation to certain features of the population it is used to examine. In sum, and because of its relevance to France, the following combined indicator, termed by the members of the group the “Mustar growth index” was used for their national studies:
Xtn Growth index = Xtn – Xto) x –––––– Xto
where Xt = the number of employees at time t and n and 0 = the years of the start and end of the period.

83
This index was calculated for each growing firm and the firms were then classified in descending order of their “Mustar growth index”. The population of high-growth businesses was then constituted by taking “the top ten”, namely the 500 businesses at the head of the list.
At this stage of the research, there were three populations: a group of businesses that were permanent over the period, a second group of businesses with growth in number of employees and a third group with high growth in number of employees. The next section compares the three populations with respect to a breakdown by sector, by geographical location, by workforce size and by contribution to job creation.
Comparison of three business populations
Breakdown by sector
To what sectors did the businesses belong? Were there similarities or differences in the breakdown by sector of the populations of permanent businesses (10 691 businesses), growing businesses (5 034 firms) and high-growth businesses (500 firms)? (The 500 high-growth businesses are the first 500 of the 5 034 businesses listed in descending order according to the index defined above.)
Three conclusions may be drawn from the breakdown by sector of the firms under study.
• Growing businesses and high-growth businesses appear in all sectors (apart from the very small coke, petroleum refining and nuclear industries). This provides a first pointer for government policy: even in “declining” sectors, firms may show significant dynamism. A point of note is that the breakdown by sector of the total population and of the population of growing firms is approximately the same (Table 5). High-growth firms also appear in all sectors but are not as evenly distributed. The sectors with the most high-growth businesses are not only expected ones, such as the chemical industry (in first place with 17% of the 500) or electrical and electronic equipment (in second place with 15% of the 500) but more surprising ones such as metals and metalworking (in third place with 13%).
• Very strong growth is not correlated with growth. For instance, the chemicals industry, which represents 6% of the total population, accounts for 7% of growing businesses but for 17% of high-growth businesses. The electrical and electronic equipment sector accounts for 6% of the total population, 9% of growing businesses, but 15% of the high-growth group. Conversely, the textile and clothing sector has 6.2% of the high-growth population but 13% of the total population. The same is true of metals and metalworking (21% of the total population and of growing businesses but only 13% of high-growth businesses).
• Concentration by sector is significant: 60% of growing businesses are concentrated in four out of the 15 sectors. Almost 60% of high-growth businesses are also concentrated in four sectors. However, apart from metal and metalworking, these are not the same sectors (again, no correlation).
Does concentration also occur within sectors? To test this, a closer look was taken at the chemicals industry. Table 6 gives the seven subsectors that make up the chemical industry and shows that the distribution of growing and high-growth businesses is very varied. The pharmaceuticals

84
industry, for instance, accounts for 27% of permanent businesses, 32% of growing businesses and as much as 52% of high-growth businesses. On the other hand, although other chemicals accounts for 15% of the total population and of growing businesses, it makes up only 3% of the high-growth businesses. In all, two out of the seven subsectors account for nearly 60% of high-growth businesses in this sector: pharmaceuticals and soaps, perfumes and care products. Concentration of businesses in some sectors is joined by concentration within sectors.
Table 5. Breakdown by sector of the three populations
All firms Growing firms High-growth firms
Sector No. % No. % No. %
Metals and metalworking 2 296 21 1 075 21 63 13
Textiles and clothing 1 409 13 505 10 31 6
Paper and paperboard; publishing and printing 1 247 12 620 12 42 8
Machinery and equipment 1 114 10 480 10 37 7
Electrical and electronic equipment 905 8 459 9 75 15
Chemical industry 649 6 373 7 86 17
Rubber and plastics products 629 6 389 8 58 12
Other manufacturing industries 611 6 282 6 25 5
Other non-metallic mineral products 480 4 234 5 19 4
Transport equipment 437 4 218 4 37 7
Wood and wood products 307 3 159 3 9 2
Leather and footwear 292 3 99 2 9 2
Mining and quarrying 210 2 88 2 4 1
Electricity, water and gas supply 76 1 43 1 5 1
Coke, petroleum refining and nuclear industries 29 0 10 0 0 0
Total 10 691 100 5 034 100 500 100
Note: “Metals and metalworking” makes up 21% of permanent firms, 21% of growing firms and 13% of high-growth firms, i.e. 2 296, 1 075 and 63 firms, respectively.
Table 6. Breakdown of the chemical industry into seven subsectors
All firms Growing firms High-growth firms
Sector No. % No. % No. %
24.1. Basic chemical 133 20 64 17 7 8
24.2. Agrochemical products 16 2 7 2 4 5
24.3. Paints and varnishes 92 14 49 13 5 6
24.4. Pharmaceutical industry 176 27 120 32 45 52
24.5. Soaps, perfumes and care products 135 21 77 21 22 26
24.6. Other chemical products 95 15 56 15 3 3
24.7. Artificial or synthetic fibres 2 0 0 0 0 0
Total chemicals industry 649 100 373 100 86 100
Breakdown by geographical location of the three populations
Table 7 shows the regions in which the businesses under study are located. The 10 691 businesses are distributed throughout the country. The breakdown gives the following information:
• The breakdown of growth businesses is not different from that of the total population; growth has no particular geographical location.

85
• The geographical breakdown of high-growth businesses shows a proliferation of growth in Ile-de-France, which has 24% of the total population but 32% of the high-growth businesses. In two regions, Rhône-Alpes and Nord-Pas-de-Calais, the share of high-growth businesses (13% and 3%, respectively) is smaller than that of businesses in the total population (15% and 7%, respectively).

86
• Although high-growth businesses occur throughout (continental) France, their geographical distribution is nevertheless strongly concentrated. Two-thirds (64%) of high-growth businesses are located in six regions. The remaining third is distributed among the other 16 regions. At the top of the list is Ile-de-France (32% of high-growth businesses) followed by Rhône-Alpes (13%).
These calculations were based on firms’ head offices in 1994. This study was concerned with the individual firm (rather than the establishment or the head of the group in the case of subsidiaries) for both theoretical and practical reasons: the head office is the firm’s decision-making centre and the data available came from surveys carried out at the level of the individual business. Phase II looks at whether strong growth is accompanied by an increasing number of establishments (geographical locations) or by expanding the workforce of an existing establishment or establishments.
Table 7. Breakdown by region of the total population, the population of growing businesses and the population of high-growth businesses
Percentage
All firms Growing firms 500 high-growth firms
Alsace 4 4 5
Aquitaine 3 3 2
Auvergne 2 2 1
Basse-Normandie 2 2 3
Bourgogne 3 3 3
Bretagne 3 3 3
Centre 5 5 5
Champagne-Ardennes 3 3 2
Corse 0 0 0
Franche Comté 3 3 3
Haute-Normandie 3 3 4
Ile-de-France 24 22 32
Languedoc-Roussillon 1 1 0
Limousin 1 1 1
Lorraine 3 3 3
Midi Pyrénées 3 3 3
Nord-Pas-de-Calais 7 7 3
Pays de la Loire 6 7 5
Picardie 4 4 3
Poitou-Charentes 2 3 3
Provence Alpes Côte d’Azur 3 2 2
Rhône-Alpes 15 16 13
Total 100% 100% 100%
Distribution by workforce bracket in the three populations
Do the 500 high-growth businesses accurately reflect the initial population or are they concentrated in a particular workforce size bracket? The index used shows that there are high-growth firms in all workforce size brackets (Table 8).

87
Table 8. Breakdown of the three populations by workforce category
Workforce size in 1985 All firms Growing firms High-growth firms
No. % No. % No. %
20-49 5 172 48 2 810 56 106 21
50-99 2 349 22 1 003 20 102 20
100-249 1 807 17 773 15 115 23
250-499 720 7 274 5 99 20
500-1 999 501 5 151 3 78 16
2 000 + 142 1 23 0,5 -* -*
Total 10 691 100 5 034 100 500 5
* Firms with more than 2 000 employees in 1985 are not included in the population of high-growth firms.
In the 2 000+ bracket, one out of six businesses (23 out of 142) was growing during the period, and in the 500-1 999 bracket nearly one in three (151 out of 501) were growing. This implies that growth (like high growth) is not confined to businesses with fewer than 500 employees. This shows that if the aim is to encourage job creation, public authorities cannot ignore medium-sized businesses. Industrial policies were long focused on national leaders, whereas today the accent is on small businesses. However, public policy must also be aware of the part played by medium-sized businesses. Small, medium-sized and large businesses complement rather than compete with one another.
It is somewhat surprising that the 20-49, 50-99, 100-249, 250-499 and 500-1 999 brackets were responsible that is for nearly 50 000 jobs each. Thus, it was decided to retain businesses in the 500-1 999 bracket in the study of growing and high-growth populations, since they made as great a contribution to workforce growth as the other size brackets.
The 500 businesses chosen on the basis of the high-growth index also have similar shares in each of the five brackets. For France, this index is thus representative of the respective contribution of the workforce size brackets to overall job creation. The disparity between the breakdown of the overall and growing populations and that of the high-growth population is not surprising since the last of these was determined on the basis of an index that weighted the increase in jobs by the increase in volume.
The distribution of the increase in jobs throughout the five workforce brackets raises a number of questions. Can any government policy cope with all 5 000 growing businesses, or should it focus on the few hundreds of high-growth businesses? Can policy ignore the fact that nearly one-fifth of the rise in numbers of jobs was due to a relatively small number of businesses with between 500 and 2 000 employees?
High-growth businesses
This section focuses on high-growth businesses. It considers their contribution to workforce expansion, breakdown of turnover, propensity to export, involvement in R&D and independent firms and those belonging to a group.
Contribution of high-growth businesses to employment
The 5 034 growing businesses increased their workforces by 257 411 employees. High-growth firms, which comprise 10% of the population of growing businesses (the top 500) are responsible for 54% of this increase, or 138 334 jobs. Their share rises to 57% when the 23 businesses with over

88
2 000 employees that added 15 734 employees are excluded since businesses in this category were not included among the 500. The calculation is as follows: 138 334/(257 411 – 15 734) x 100 = 57.2%.
The smaller the workforce size category to which a high-growth businesses belonged in 1985, the greater the proportionate increase in its workforce by 1994. A business with 20-49 employees had an average of 37 employees in 1985 and 163 in 1994, an increase of a factor of 4.4. A business with 500-1 999 employees had on average 876 employees in 1985 and 1 387 in 1994, an increase of a factor of 1.6. Table 9 shows a clear break at 100 employees. Businesses with fewer than 100 employees more or less quadrupled their workforces over the period, while those with over 100 employees more or less doubled their workforces. The break at 100 employees is also found in other studies, such as those on SMEs and patents. From the methodological point of view, the threshold of 100 employees could be a relevant yardstick, other things being equal, for policy recommendations, particularly if the study confirmed the similarity of behaviour of businesses with 20-49 and 50-99 employees.
Table 9. Average number of employees in the top 500, 1985 and 1994, and rates of change
No. of firms Workforce 1985 Workforce 1994 Change
Size classes 85 Total Average/firm Total Average/firm Base 100
20-49 106 3 879 37 17 233 163 441
50-99 102 7 270 71 27 153 266 375
100-249 115 18 509 161 47 663 414 257
250-499 99 35 679 360 71 772 725 201
500-1999 78 68 327 876 108 177 1 387 158
Total or average 500 133 664 267 271 998 544 203
Turnover for high-growth businesses
The average turnover for businesses in the top 500 was FRF 192.6 million in 1985 and FRF 561.3 million in 1994. Over the period, average corporate turnover was multiplied by 2.91 in current francs and the average workforce per business doubled (Table 10). The smaller the size class of the business in 1985, the greater its change in turnover. Businesses with 20-49 employees saw their average turnover was multiplied by 4.88, while those with 250-499 employees was multiplied by only 2.93. Generally speaking, other things being equal, changes in turnover are in line with changes in the workforce. Using turnover as an indicator would not have given populations of businesses differing greatly from those produced by using numbers of employees.
Table 10. Turnover trends in high-growth firms from the beginning to the end of the review period
Size No. of firms Avg. turnover per firm, 1985
Avg. turnover per firm, 1994
Change in turnover
Change in workforce*
20-49 106 27.849 135 810 488 441
50-99 102 48.668 234 500 482 375
100-249 115 96.244 377 195 392 257
250-499 99 283.118 829 945 293 201
500-1999 78 632.200 1 523 747 241 158
All classes 500 192.649 561 373 291 203
* 1994, base 100 in 1985.

89
High-growth and exporting businesses
High-growth businesses were already exporting at the start of the review period. Inspection of individual firms shows that 403 out of the 500 firms exported in 1985 and 450 in 1994. Exporting is not therefore the end point of the process of high growth but seems instead to be a staring point, or a sort of pre-condition. Moreover, these businesses increased their exports over the period (Table 11). In terms of volume, the increase in turnover due to exports is large and follows the growth of the firm but represents a relatively small share of turnover.
Table 11. Change in volume of exports by workforce size class Millions of FRF
1985 Export turnover 1985 Export turnover 1994 Change by 94 Size classes
No. of firms Average/firm Average/firm Base 100 in 1985
20-49 106 3 574 23 816 666
50-99 102 8 579 58 686 684
100-249 115 20 397 101 429 497
250-499 99 63 315 227 226 359
500-1999 78 172 498 449 562 261
All classes 500 46 645 154 253 331
In volume terms, the share of turnover resulting from exports is significant: firms with 20-
49 employees multiplied their exports sales by 6.6 (with average turnover from exports rising from FRF 3.5 million to FRF 23.8 million (Table 12). The increase in exports is stronger for firms that were small at the start of the period.
In 1985, the top 500 already got a large share of turnover from exports (on average 24%). Over the period, the share of exports in turnover in high-growth businesses rose only by 13%. However, businesses with fewer than 500 employees increased their share of exports by 23% in the case of the largest and by 38% in the case of the smallest. Apart from businesses with 20-49 employees, growing businesses got between a third and a quarter of their turnover from outside markets.
Table 12. Share of turnover due to exports by workforce category, 1985 and 1994
1985 1985 1994 Change in 1994 Size classes
No. of firms Turnover from exports Turnover from exports Base 100 in 1985
20-49 106 13% 18% 138
50-99 102 18% 25% 139
100-249 115 21% 27% 129
250-499 99 22% 27% 123
500-1999 78 27% 30% 111
All classes 500 24% 27% 113
High-growth businesses and research and development
On the basis of their identification number, the data available from SESSI on the 10 691 permanent businesses were cross-sorted with businesses engaged in R&D (data obtained from the annual survey of businesses employing at least one full-time research worker conducted by the Ministry of Research).
In 1992, the year for which this information was available, 1 364 out of the 10 691 businesses had an R&D budget, and they were evenly distributed among the populations of expanding and contracting businesses. This does not fit well with the stereotype that associates R&D with growth of a business.

90
A second finding is that the number of businesses conducting R&D is much higher among the population of high-growth businesses (33%) than in the total population (13%) (Table 13). There is therefore strong correlation between conducting R&D and experiencing high growth.
Table 13. Percentage of businesses by population conducting R&D
% with R&D % without R&D Total %
Total population (10 691) 13 87 100
Growing firms (5 034) 12 88 100
High-growth firms (500) 33 67 100
A third finding related to high-growth businesses. Two-thirds of high-growth businesses do not conduct R&D. Of the 500, only 167 reported conducting R&D. It may be, however, that many conduct R&D in a ways that do not meet the rigorous definitions of the Frascati Manual (the relevant surveys are based on these definitions, the limitations of which are recognised). This raises the question of the relation between R&D and high growth in the traditional industrial sectors studied here. Phase II looks in more detail at the relation between growth in businesses in the industrial sector and R&D (in the Frascati sense, but also using a broader definition).
High-growth businesses: are they independent or members of a group?
The database on longstanding business was cross-sorted with the LIFI (Financial Links) database of INSEE. Each of the 500 high-growth businesses was categorised either as an independent firm or as a member of a group (no distinction was made as to whether the group was French or foreign).
For each business and for the year 1994 it was possible to determine the percentage of capital held by one or more groups, the name of the principal holding group and the share of the capital held by the principal holding group. When the data were processed, it resulted that groups held capital in 376 of the 500 high-growth businesses. In 363 out of the 376, groups held over 50% of the capital. Businesses in which over 50% is held by one or more group are assigned to “groups” and the rest to “independents”.
The first notable finding is that three-quarters of high-growth businesses belong to a group. This does not square with the view that success goes hand in hand with the independent entrepreneur. Second, only 14% of job growth over the period was attributable to independent businesses; businesses belonging to groups were responsible for five out of six jobs created (Table 14).
Table 14. Distribution of high-growth businesses between “groups” and “independents”
Firms No. % Jobs created Average size in 1994
Groups 363 73 86% 646 employees
Independents 137 27 14% 273 employees
Total 500 100 138 334
These findings show the limits of studies of high-growth businesses which start by ruling out subsidiaries. If this study had done the same, 86% of the jobs created during the review period would have been left out of the equation. This raises the question of the role of groups in growth. The postal survey discussed in Section 4 provides some answers.

91
The examination of permanent, growing and high-growth businesses in this section was based on their workforce size in the start year (1985) and the end year (1994). It does not address changes in the intervening years. Section 2 looks at changes in the workforce of high-growth businesses in successive years.

92
2. TRAJECTORIES OF HIGH-GROWTH BUSINESSES
Section 1 took as its frame of reference two years, 1985 and 1994, and focused on comparing workforce numbers in these two years. This section look at the growth trajectory of high-growth firms throughout the period. In order to observe the patterns of change, a longitudinal analysis of the workforce in each business was carried out for each year of the period 1985-94.
The findings presented here also attempt to answer several questions. Is growth continuous or cyclical? How many years of continuous expansion or periods of expansion did these firms experience? How many years of growth and contraction (continuous or otherwise) did they experience, in all, during the period under study?
First, the “average firm” of the population of high-growth firms and a typical growth trajectory are described. Next, the same procedure is used for each of the five size classes in the high-growth population. Then, actual growth trajectories of high-growth firms are examined. Did their workforces expand steadily, or did they experience alternate periods of expansion and contraction? Are there typical patterns? What percentage of firms fits one pattern rather than the other? Finally, the fallacy of some of the conventional wisdom on high-growth firms is brought out. Many studies appear to provide analysts and policy makers with cases and models that bear no relation to reality.
The “average” firm and its typical trajectory
What is the profile of the trajectory of the “average” high-growth firm? The average is obtained by adding the workforce totals of the 500 high-growth firms in each year from 1985 to 1994 and dividing the totals for each year by 500. The average firm in this population had 267 employees in 1985 and 544 in 1994. It doubled its workforce over the period. Figure 1 gives its trajectory in terms of variations in its workforce.
Figure 1. Trajectory of the “average” firm from 1985 to 1984 Average annual workforce of the 500 high-growth firms
250
350
450
550
650
750
850
1985 1986 1987 1988 1989 1990 1991 1992 1993 1994

93
This is the trajectory that springs to mind whenever a high-growth firm is mentioned. It rises
quite steadily, but is nonetheless sensitive to business cycles (as is the case here for 1992 and 1993). The trajectory remains essentially the same for the different size categories of firms (Table 15).
Table 15. Annual workforce of the average firm for each size class, 1985-94
Size class 1985 1986 1987 1988 1989 1990 1991 1992 1993 1994
20-49 36 50 59 71 83 103 113 131 133 161
50-99 71 83 103 124 143 159 199 232 244 266
100-249 161 190 225 246 271 314 333 353 368 414
250-499 360 397 428 461 519 582 620 678 679 725
500-1999 876 948 995 1 108 1 177 1 261 1 290 1 323 1 298 1 387
The workforce of the average firm with 20-49 employees increased by a factor of 4.5 (from 36 to 161 employees), for 50-99 employees by a factor of 3.8 (from 71 to 266), for 100-249 employees by a factor of 2.6 (from 161 to 414), for 250-499 employees by a factor of 2 (360 to 725), and for 500-1 999 employees by a factor of 1.6 (from 876 to 1 387). This clearly reflects the effect of the index which takes into account both the relative and the absolute increase in the number of employees. The larger the firm at the start of the period, the less steep the growth gradient (growth factor). A firm with 20 employees is more likely to quadruple its workforce than a firm with 500 employees. Also, the larger the size of the firm in the initial year of the period, the more it is prone to business cycles. Firms with 250-499 employees did not expand their workforces between 1992 and 1993. Firms with over 500 employees saw their workforces contract slightly.
Overall, the five categories grew steadily, with firms expanding their workforces from year to year. This profile of the average firm is what research and records on high-growth firms generally show. It is the profile found in press articles, various reports and speeches by policy makers. However, this profile is misleading. The second section of this chapter demonstrates that the picture bears no relation to reality and that real firms bear little resemblance to the average firm.
A lack of the whole picture is a problem chiefly for government policy. If the instruments that policy makers rely on are distorted, they will base their policies on non-existent or atypical cases.
The trajectories of high-growth firms
This section traces the actual trajectories of the 500 high-growth firms and compares this population with its parent population of 5 000 growing firms.
Largest and smallest workforces
When was the workforce of high-growth firms at its largest: in the final year of the observation period or earlier? Likewise, when was the smallest workforce employed: in the initial year or at some other point? The year in which each firm had its largest and smallest workforce was calculated (Tables 16 and 17).

94
Table 16. Distribution of firms by year of largest workforce for the 500 HGF and the 5 000 GF Percentage
1985 1986 1987 1988 1989 1990 1991 1992 1993 1994
500 HGF 0 0.8 0.6 1.0 2.8 8.2 9.2 16.4 10.0 51.0 100.0
5 000 GF* 0 2.5 3.1 4.6 8.7 12.8 13.7 15.0 10.0 29.6 100.0
Note: In 1988, 1% of high-growth firms (HGF) and 4.6% of growing firms (GF) had their largest number of employees, i.e. the largest workforce over the period. * There are 5 034 growing firms, called the 5 000 for the sake of simplicity.
One out of two high-growth firms employed its largest workforce in 1994 (see Table 3). To put it another way, over half of the high-growth firms did not employ their largest workforce in 1994. In other words, at the end of the period one firm in two had seen its workforce contract relative to the largest workforce it had employed during the period.
Table 17. Distribution of firms by year of smallest workforce for the 500 HGF and the 5 000 GF Percentage
1985 1986 1987 1988 1989 1990 1991 1992 1993 1994
500 HGF 64.8 17.00 8.2 3.2 1.0 1.2 1.4 1.4 1.6 0 100.0
5 000 GF* 54.2 14.7 9.9 6.3 4.0 2.8 2.3 2.4 3.5 0 100.0
Note: In 1985, 64.8% of high-growth firms (HGF) and 54.2% of growing firms (GF) employed their smallest workforce. * There are 5 034 growing firms, called the 5 000 for the sake of simplicity.
Fewer than 10% of the high-growth firms employed their smallest workforce after 1987. Two out of three high-growth firms employed their smallest workforce in 1985. Thus, for one-third, the first year of the period was not the year in which they employed their smallest workforce. At some point, the workforce of these firms dropped below that of the first year of the period but later recovered (by definition, the number of employees is higher in 1994 than in 1985). These preliminary findings show that the high-growth category includes firms whose workforces fluctuated sharply and that, in many cases, their expansion was not continuous.
Comparison with growing firms
A similar study of the parent population of 5 000 growing firms bears this out. The minimal definition used (firms whose workforce expanded by at least one unit from 1985 to 1994) confirms that growth was not steady. In fact, two-thirds of the 5 000 growing firms did not employ their largest workforce in 1994.
What differentiates high-growth from growing firms is their dynamism over the last three years of the observation period. More than three-quarters of high-growth firms employed their largest workforce during the last three years but only half of growing firms. Moreover, few high-growth or growing firms employed their smallest workforce during the second half of the period, i.e. between 1990 and 1993.
Overall, this preliminary analysis shows that most growing and high-growth firms in the French manufacturing sector have seen their workforces both expand and contract at some stage over the period.

95
Year of best performance
In order to refine these findings, the year of highest growth for each firm was determined (the year in which it performed best in terms of workforce expansion or the year in which its growth curve was steepest). Table 18 shows that a quarter of firms had their year of highest growth during the first half of the period, half between 1989 and 1992, and the remaining quarter during the two final years. Overall, the years in which firms achieved their highest relative growth were distributed widely over the period.
Table 18. Distribution of firms by year of highest growth for the 500 HGF and the 5 000 GF Percentage
1985 1986 1987 1988 1989 1990 1991 1992 1993 1994
500 HGF 0 6.2 7.6 8.4 11.6 14.6 11.8 12.6 9.2 18.0 100.0
5 000 GF* 0 11.2 10.7 12.1 14.7 13.1 10.2 8.9 6.5 12.8 100.0
Note: in 1994, 18% of high-growth firms achieved their best performance of the period in terms of relative increases in the workforce; the figure was 12.8% for growing firms. * There are 5 034 growing firms, called the 5 000 for the sake of simplicity.
Year of largest workforce compared with year of best performance
When the year in which firms employed their largest workforce is compared with the year of highest growth, a marked structural distortion is observed (Table 19). For instance, 51% of high-growth firms employed their largest workforce in 1994, but only 18% achieved their highest growth in that year. There is thus a marked distortion between the distribution of firms by year of largest workforce and the distribution by year of strongest relative growth. Almost 80% of firms employed their largest workforce in the last three years of the observation period. However, in 40% of cases, these are not the years of highest relative growth. This shows that many firms were picking up momentum, with a period of very high relative growth followed by a period of slower growth.
Table 19. Distribution of high-growth firms by year of largest workforce and year of best performance Percentage
Year 1985 1986 1987 1988 1989 1990 1991 1992 1993 1994
Largest workforce 0 0.8 0.6 1.0 2.8 8.2 9.2 16.4 10.0 51.o 100.0
Highest growth 0 6.2 7.6 8.4 11.6 14.6 11.8 12.6 9.2 18.0 100.0
Structural distortion 0 - 5.4 - 7 - 7.4 - 8.8 - 6.4 - 2.6 + 3.8 + 1.8 + 33.0
Note: In 1994, 51% of high-growth firms employed their largest workforce while 18% achieved their best performance of the period, in terms of workforce expansion, in the same year. The structural distortion (discrepancy between the two distributions) iis 33 percentage points.
The vast majority of firms do not grow at the same rate throughout the period. Firms may experience uneven growth (with highs and lows, downturns, recoveries) and still continue to grow. This confirms that: i) the rate of growth for any given year cannot be used as a growth parameter; and ii) growth has to be studied over time in order to understand growth trajectories.
Years of continuous growth and total number of years of growth
As seen above, the growth trajectory was not steady from 1985 to 1994, since firms often employed their largest workforce prior to the final year of the period. Table 20 shows the number of years of continuous (uninterrupted) growth firms experienced.

96
Table 20. Distribution of firms by number of years of continuous growth for the 500 HGF and the 5 000 GF Percentage
1 2 3 4 5 6 7 8 9
500 HGF 3 12.2 15.2 19.2 16.6 11.4 11 4 7.4 100.0
5 000 GF* 2.5 15.9 21.6 21 16.2 10.2 6.5 2.6 3.8 100.0
* There are 5 034 growing firms, called the 5 000 for the sake of simplicity.
As the table shows, only 7.4% of high-growth firms experienced continuous growth throughout the period (i.e. 37 out of 500 firms). Continuous growth, i.e. expansion of the workforce by at least one unit throughout the period, is extremely rare. Indeed, only 22% of firms had a period of continuous growth of seven years or more. For almost 48%, the period of continuous growth lasted only between four and six years and for almost 30%, the growth trajectory was uneven, with only between one and three years of continuous growth. By comparison, in the population of 5 000 growing firms, only 3.8% experienced continuous growth over nine years (i.e. 190 out of 5 000) and only 13% had continuous growth of seven years or more.
The index used to construct the population of high-growth firms included only 19% (37 firms) of the 190 firms in the population of 5 000 that continuously expanded their workforce over the period. Those not included in the population of high-growth firms are often very small firms whose workforce increased by one or two units per year throughout the entire period, rising, say, from around 20 to around 30 employees.
The overwhelming majority of firms that experienced high growth did not grow continuously. The model of the firm that expands its workforce each year is the exception. Yet it is taken as the rule in many studies, press rankings and policy statements.
Total number of growth years
Another way to observe the growth trajectory of these firms is to add up the total number of years in which each firm’s workforce actually grew. As Table 21 shows, 54% of high-growth firms had at least seven years of (not necessarily continuous) growth during the period (26.2% + 20.4% + 7.4%) and more than three-quarters (54% + 22.2%) totalled at least six years of growth.
Table 21. Distribution of firms by total number of growth years for the 500 HGF and the 5 000 GF Percentage
1 2 3 4 5 6 7 8 9
500 HGF 0.4 1.2 2.6 6.8 12.8 22.2 26.2 20.4 7.4 100.0
5 000 GF* 0.1 0.4 2.1 8.1 21.0 27.9 24.0 13.0 3.8 100.0
* There are 5 034 growing firms, called the 5 000 for the sake of simplicity.
Firms that expand by merging with another but subsequently experience no further growth are rare in this population. Only two firms (1.4%) experienced only one year of growth over the period. This does not mean that there were no mergers or acquisitions. There were many, but they were generally followed by further phases of growth. High-growth firms with only one to three years of growth are also rare: 4.2% (0.4 + 1.2 + 2.6) or one firm in 20 (25 firms in all).
The 5 000 growing firms are different in that fewer had at least seven years of growth (40% vs. 54% of high-growth firms). However, there is less difference between the two populations in terms of firms with few years of growth. Only 11% of growing or high-growth firms had a total of less than

97
five years of growth over the period. The average number of growth years was 6.5 for high-growth firms and 6.3 for the population overall. By and large, the “average firm” experienced six years of growth and three years of contraction.
In conclusion, both continuous growth and growth due solely to mergers or acquisitions are rare. This is a far cry from models of exclusively internal or exclusively external growth (by merger and acquisition). For most firms the pattern is a mix of periods of workforce expansion and contraction. A substantial number of firms have experienced both internal and external growth. The rest of Section describes some of these patterns.
Number of phases of growth
Since growth is not a steady process, it is interesting to see the number of periods of growth experienced by each firm between 1985 and 1994. As Table 22 shows, four out of five high-growth firms had more than one period of growth. For five out of every six of the population of 5 000 growing firms, growth was spread over several periods.
Table 22. Number of periods of growth in the 500 HGF and the 5 000 GF Percentage
1 2 3 4 5
500 HGF 19.4 46.4 26.6 7.6 0.0 100.0
5 000 GF* 14.0 42.3 35.2 8.3 0.2 100.0
* There are 5 034 growing firms, called the 5 000 for the sake of simplicity.
In both populations, the number of firms that experienced only one period of growth is small (one in five and one in seven, respectively). For firms with a single period of growth, some had nine years of continuous growth, but more frequently they had six years of continuous growth followed by three years of contraction or four years of continuous growth preceded by two years of contraction and followed by another three years of contraction. Also, some firms had a very erratic growth trajectory, with a series of expansions and contractions. Overall, high-growth firms had fewer alternating periods than growing firms. However, the difference is of little significance since in both groups nearly three quarters of firms went through two or three periods of growth.
Conclusions
One important result is that few firms increased their workforces every year between 1985 and 1994. This was the case for only 190 of the 5 000 growing companies (3.8%) and 37 of the 500 high-growth firms (7.4%). Thus, continuous growth over a ten-year period is the exception rather than the rule (even for high-growth firms). Similarly, there were only 2 (out of 500) cases of firms with only one year of growth over the entire period following a merger or acquisition. This confirms and corroborates the initial hypotheses of the study, that what constitutes a growing or high-growth firm was not known, that no definition would be assumed and instead the entire population available would be observed over a long period and that the definition of a high-growth firm would be the outcome of empirical work.
This approach is different from that taken in many studies that have addressed this question and begin by defining the parameters for selecting high-growth firms (e.g. they must have increased their workforces by at least 20% a year for five years). They also pre-screen to eliminate firms that are subsidiaries of a group, disregard mergers and acquisitions, etc. By doing so, they confine themselves

98
to a very specific type of firm and paint a picture of quite smooth progress: sales figures and numbers of employees rise every year and the growth trajectory of the high-growth firm appears to be a long, uninterrupted process. Such studies only tell half the story, as they leave out practically all the firms whose high growth has been a series of ups and downs.
This is disturbing from the theoretical point of view: how can we formulate a theory of the growing firm by looking only at atypical cases? It is equally disturbing from a practical point of view: how can policies be effective if the information they are based on is biased towards certain narrow types of actors? This does not to say that nothing can be learned from these rare success stories, but what is learned will apply only to very specific sets of circumstances, which are not those of the vast majority of firms.
Such studies also pose a problem for the managers of firms: if they believe the picture of continuous growth that they portray, managing growth amounts to no more than managing continuity. As this picture is atypical, the lessons will more than likely not be very relevant, if not counterproductive, for firms in the real world.

99
3. A TYPOLOGY OF HIGH-GROWTH FIRMS
This section aims to construct a typology of the growth trajectories of 500 high-growth firms between 1985 and 1994. On the basis of the information in Section 2, it was possible to trace the workforce expansion of each of the 500 high-growth firms, which were then grouped into a number of categories. While these clearly show the diversity of growth trajectories and suggest a number of models, they do not point to any overriding typology, owing to the complexity and variety of the trajectories.
In order to establish a typology of the growth profiles of high-growth firms (the term “growth profile” refers to the curve describing changes in workforce size), it is necessary to analyse data in ways that differ from the methods previously used.
Method
This stage of the study sought to constitute groups within the 500 firms that exhibit similar trajectories (in terms of changes in workforce size). Table 23 gives the workforce sizes of the 500 businesses (numbered from 1 to 500) for each year between 1985 and 1994. The aim was to see the differences in the firms’ behaviour relative to each other and to the overall average growth profile.
Table 23. Changes in the workforce levels of the 500 high-growth businesses
Firm no. 1985 1986 1987 1988 1989 1990 1991 1992 1993 1994
1 38 103 150 184 265 265 163 122 112 123
2 80 82 79 79 79 80 89 104 199 184
3 1 380 1 434 1 419 1 428 1 468 1 510 1 444 1 525 1 574 1 605
4 829 883 970 996 1 128 1 151 1 180 1 280 1 239 1 269
5 405 1 290 1 117 952 849 811 771 711 656 625
... ... ... ... ... ... ... ... ... ... ...
499 54 54 54 88 88 103 119 124 128 138
500 69 75 88 104 136 156 150 160 150 163
Standardisation of the variables
To reveal differences in behaviour more clearly, irrespective of the absolute level of the firms’ workforces, the figures in Table 23 were standardised. Using workforce counts for each firm and for each year, a standardised profile consisting of numbers ranging around a value of 1 was created (Table 24). A value of 1 signifies “in line with the average profile”; a value greater than 1 signifies “higher than the average profile”; and a value less than 1 means “lower than the average profile” (see Box 1). This made it possible to work with the data regardless of the absolute level of the workforce of the firm in question.

100
Table 24. Standardised profiles of the 500 high-growth firms, 1985-94
Firm no. 1985 1986 1987 1988 1989 1990 1991 1992 1993 1994 1 0.38 0.93 1.24 1.37 1.80 1.62 0.94 0.66 0.60 0.61 2 1.16 1.07 0.94 0.85 0.77 0.71 0.74 0.81 1.54 1.31 3 1.43 1.33 1.21 1.09 1.03 0.95 0.86 0.85 0.87 0.82 4 1.16 1.11 1.12 1.03 1.07 0.92 0.83 0.71 0.66 0.57 5 0.76 2.17 1.72 1.32 1.07 0.92 0.83 0.71 0.66 0.57 ... ... ... ... ... ... ... ... ... ... ...
499 0.87 0.78 0.71 1.05 0.96 1.01 1.10 1.07 1.10 1.09 500 0.84 0.82 0.88 0.94 1.12 1.06 1.05 1.05 0.98 0.98
Summary of the method (see Annex A)
The average growth profile is defined as the ratio between each year’s workforce and the cumulative workforce over ten years. For example, over a three-year period and for a given group of firms, the total workforce counts were as follows: 1 000 employees in year 1, 1 200 in year 2 and 1 400 in year 3, for a cumulative workforce for the three years of 3 600. The average profile of the group of firms was therefore 1000/3600, 1200/3600 and 1400/3600 or 0.28, 0.33 and 0.39.
If, within that population and over the three years, a firm’s workforce rose from 150 to 160 to 170 employees, its profile would be150/480, 160/480 and 170/480, or 0.31, 0.33 and 0.35. The firm’s growth was therefore less than that of the average profile for the firms as a whole. A standardised profile was computed and for this firm it declines: 1.11 (or 0.31/0.28), 1.00 (0.33/0.33) and 0.90 (0.35/0.39).
The statistical work then consisted in:
• Establishing quartiles (each variable is divided into five brackets in relation to the average profile: very slow (<), slow (-), medium (=), high (+) and very high (>).
• Ascertaining, for each firm and for each year, the bracket to which it belonged.
• Constructing a matrix cross-tabulating the 50 possible combinations [five brackets (<, -, =, +, >) for each of the ten years] for each of the 50 modalities (a so-called symmetrical co-occurrence matrix or Burt table).
This matrix was used to conduct a correspondence analysis highlighting the structure of the relationships between the rows and columns and providing the best possible graphical representation thereof, followed by an ascending hierarchical classification. This work revealed the existence of eight types, or eight groups, of growth.
Table 25. Changing profile of each of the eight groups of businesses
1985 1986 1987 1988 1989 1990 1991 1992 1993 1994
General 0.9 0.91 0.93 0.93 0.95 0.97 1.01 1.04 1.07 1.13
Group 1 1.22 1.2 1.13 1.05 1.01 0.96 0.94 0.91 0.9 0.93
Group 2 1.02 1.03 1.03 1.03 1.04 1.02 1 0.98 0.94 0.95
Group 3 0.89 0.86 0.91 0.93 0.97 1.01 1.08 1.08 1.05 1.06
Group 4 0.63 0.64 0.64 0.82 1.06 1.21 1.22 1.19 1.07 1.07
Group 5 0.71 0.97 1.25 1.3 1.26 1.13 1.01 0.88 0.8 0.79
Group 6 1.18 1.09 1.06 0.95 0.86 0.77 0.67 0.61 1.1 1.69
Group 7 0.69 0.65 0.62 0.6 0.6 0.77 1.04 1.33 1.47 1.55
Group 3-5 0.97 0.98 0.97 0.92 0.92 0.86 0.88 1.01 1.14 1.24
Creating the eight groups
Work with the data (see Annex A) revealed the existence of eight growth types (i.e. eight groups of firms with similar patterns). The procedures employed first showed seven relatively distinct groups. A relatively large group of firms “hovered” between groups 3 and 5; for this reason, an eighth group (group 3-5) was created. Table 25 gives the profiles of each group. The first row gives the average growth profile of the 500 firms, which goes from 0.9 to 1.13. Average growth is observed to be

101
dependent on the year: the value remained unchanged between 1987 and 1988 (0.93) but rose more steeply between 1993 and 1994 (from 1.07 to 1.13). The following eight rows show the profiles of each group as determined by analysis of the data.
Eight types of growth
This method brings to light relative differences in the behaviour patterns of high-growth businesses. Two curves depict the eight types of growth uncovered by the analysis (Figure 2):
• Curve a) shows the difference in the behaviour of the firms in a given group relative to the average growth profile of all firms (irrespective of the absolute workforce count of the firm in question). The average growth profile of the entire population also appears in each figure. Values surrounding the index 1 are along the y-axis.
• Curve b) shows how the number of employees of the average firm in the same group evolved over time (the average curve is relevant because the population it represents has followed a similar trajectory). The numbers of employees in absolute terms are along the y-axis.
These curves depict the average firm in the population. Over the period under study, the average firm grew in that it rose from a value of 0.90 to 1.13 (curve a) and from 267 to 544 employees (curve b).
Figure 2. Curves a) and b) for the average firm
Curve a) average firm
0
0.2
0.4
0.6
0.8
1
1.2
1985 1986 1987 1988 1989 1990 1991 1992 1993 1994
Curve b) average firm
0
100
200
300
400
500
600
1985 1986 1987 1988 1989 1990 1991 1992 1993 1994
Table 26 breaks down the 500 high-growth firms into the eight groups and Table 27 indicates the average workforce for each group in 1985 and 1994. Figure 3 shows curves a) and b) for each group of firms.
Table 26. Breakdown of the 500 high-growth businesses into the eight groups
Workforce %
Group 1 75 15.2
Group 2 73 14.6
Group 3 82 16.4
Group 4 64 12.8
Group 5 46 9.2
Group 6 30 6.0
Group 7 79 15.8
Group 3-5 50 10.0

102
500 100.0
Table 27. Workforce of the average firm in each group in 1985 and 1994
1985 1994
Group 1 625 904
Group 2 374 653
Group 3 213 466
Group 4 300 585
Group 5 157 387
Group 6 104 345
Group 7 96 473
Group 3-5 174 390
Main characteristics of each group
Some groups showed similar characteristics, which made it possible to combine them into three families: family A, comprising Groups 1, 2 and 3; family B, comprising 4 and 6; and family C, comprising Groups 5, 7 and 3-5. The main characteristics of each of these groups of trajectories are described below.
Family A: Groups 1, 2 and 3 – a relatively even trajectory
This family made up 46% of high-growth businesses. Their growth pattern chiefly displayed internal growth, but phases of growth were interrupted by years in which employee numbers fell. There were few indications of mergers or acquisitions. The firms in this family gained on average over 250 employees during the period and the conditions that allowed them to absorb 30-50 new employees a year would repay investigation. What for example are the organisational or training aspects involved? Is there a limit to the growth of an already large SME?
This first family brings together 231 firms (46% of the population of high-growth firms). Firms belonging to these three types exhibit relatively smooth trajectories over the period, as shown by curves 1b, 2b and 3b in Figure 3.
Groups 1 and 2
These two groups showed steady growth over the period. Growth phases were punctuated by years in which the workforce declined. Over the period, however, the general trend was upward. In absolute terms, growth was equivalent for the two groups, which gained an average of nearly 300 employees over the period. Both groups reflect the effect of the 1992 economic slowdown.
The largest firms were over-represented in these two groups. The total population comprised 78 firms with over 500 employees, two-thirds of which belonged to Groups 1 or 2. There were only five firms with fewer than 100 employees in the 76 firms in Group 1 and ten with fewer than 100 in the 73 in Group 2.
Between these two groups, the growth curves differed because of differing starting points. In 1985, firms in Group 1 were larger than those of Group 2, with Group 1 averaging 625 employees vs. 374 for Group 2. In both groups growth was internal. Indeed, there were very few instances in which a firm achieved more than 50% of its overall growth in a single year.

103
Figure 3. Curves a) and b) of the trajectories of the eight groups
0.50.60.70.80.9
11.11.21.31.41.51.61.71.8
1985 1986 1987 1988 1989 1990 1991 1992 1993 1994
groupe 1
Général
0
100
200
300
400
500
600
700
800
900
1000
1985 1986 1987 1988 1989 1990 1991 1992 1993 1994
groupe 1
0.5
0.6
0.7
0.8
0.9
1
1.1
1.2
1.3
1.4
1.5
1.6
1.7
1.8
1985 1986 1987 1988 1989 1990 1991 1992 1993 1994
groupe 2
Général
0
100
200
300
400
500
600
700
800
900
1000
1985 1986 1987 1988 1989 1990 1991 1992 1993 1994
groupe 2
0.5
0.6
0.7
0.8
0.9
1
1.1
1.2
1.3
1.4
1.5
1.6
1.7
1.8
1985 1986 1987 1988 1989 1990 1991 1992 1993 1994
groupe 3
Général
0
100
200
300
400
500
600
700
800
900
1000
1985 1986 1987 1988 1989 1990 1991 1992 1993 1994
groupe 3
0.5
0.6
0.7
0.8
0.9
1
1.1
1.2
1.3
1.4
1.5
1.6
1.7
1.8
1985 1986 1987 1988 1989 1990 1991 1992 1993 1994
groupe 4
Général
0
100
200
300
400
500
600
700
800
900
1000
1985 1986 1987 1988 1989 1990 1991 1992 1993 1994
groupe 4

104
Figure 3. Curves a) and b) of the trajectories of the eight groups (cont.)
0.5
0.6
0.7
0.8
0.9
1
1.1
1.2
1.3
1.4
1.5
1.6
1.7
1.8
1985 1986 1987 1988 1989 1990 1991 1992 1993 1994
groupe 5
Général
0
100
200
300
400
500
600
700
800
900
1000
1985 1986 1987 1988 1989 1990 1991 1992 1993 1994
groupe 5
0.50.60.70.80.9
11.11.21.31.41.51.61.71.8
1985 1986 1987 1988 1989 1990 1991 1992 1993 1994
groupe 6
Général
0
100
200
300
400
500
600
700
800
900
1000
1985 1986 1987 1988 1989 1990 1991 1992 1993 1994
groupe 6
0.5
0.6
0.7
0.8
0.9
1
1.1
1.2
1.3
1.4
1.5
1.6
1.7
1.8
1985 1986 1987 1988 1989 1990 1991 1992 1993 1994
groupe 7
Général
0
100
200
300
400
500
600
700
800
900
1000
1985 1986 1987 1988 1989 1990 1991 1992 1993 1994
groupe 7
0.5
0.6
0.7
0.8
0.9
1
1.1
1.2
1.3
1.4
1.5
1.6
1.7
1.8
1985 1986 1987 1988 1989 1990 1991 1992 1993 1994
groupe 3-5
Général
0
100
200
300
400
500
600
700
800
900
1000
1985 1986 1987 1988 1989 1990 1991 1992 1993 1994
groupe 3-5

105
Later in the study, the question of internal growth when a firm has a large initial workforce was raised. How can a large SME with between 300 and 600 employees sustain fairly regular growth over a long period of time? Under what conditions can such a firm take on 30-50 additional employees per year? Is there a limit to the relative growth that an already large SME can achieve?
Group 3
Group 3 posted the most regular growth over the period; 80% of the firms started out with between 50 and 500 employees and the remaining 20% were evenly split between firms beginning with fewer than 50 employees and those starting with more than 500. On average, this group’s workforce rose from 213 to 466 employees, more than doubling over the period. If the slope of the curve was steeper, it is because the starting point was lower than for Groups 1 and 2. Here again, growth was largely internal. Instances of growth from mergers or acquisitions were extremely rare in this group. The trajectory of this group was the one nearest the average general trajectory.
Family B: Groups 4 and 6 – strong growth for three years followed by decline
The firms in these groups generally experienced three years of growth followed by a period of slowdown or decline. Over half of the firms achieved more than 50% of their total growth in a single year. Much growth was through mergers or acquisitions. Firms in Group 4 began on average with 100 employees and those in Group 6 with 300. One question here of both theoretical and practical interest is the kind of relationship between internal and external growth.
This second family combines Groups 4 and 6, or 110 firms (22% of the population of high-growth firms). Firms belonging to these two groups experienced three consecutive years of strong growth followed by a slowdown and decline (see Figure 3, curves 4b and 6b).
In Group 6, the firms grew from an average of 104 employees to 346, whereas in Group 4 the average workforce rose from 300 to 585 employees. In Group 6, 69% of the firms began with fewer than 100 employees and 30% with between 100 and 500. In Group 4, firms were bigger from the outset: only 31% of the firms had fewer than 100 employees.
The major difference between these two groups lay in the time lag of their growth curves. Growth started sooner for Group 4 firms than for those in Group 6. In fact Group 4’s growth appears to have begun before the first year of the reference period.
In Groups 4 and 6, most growth took place through mergers or acquisitions. More than half of the firms in these groups achieved more than 50% of their total growth in a single year. These phases, which appear to correspond to mergers or acquisitions, were either preceded or followed by other periods of growth.
The triggering events were not simply mergers and acquisitions. It may be assumed that in some cases it was the successful marketing of a new product or range of products. However, the firms did not seem to have been capable of repeating this process with other innovations and therefore did not sustain their growth.

106
Family C: Groups 5, 7 and 3-5 – stability over most of the period followed by rapid growth towards the end
This type of trajectory concerned 32% of the population of high-growth firms (159 firms). These firms underwent slow or very slow growth up to the early 1990s and then expanded abruptly, generally in association with mergers or acquisitions. In this family, small firms were over-represented, as 80% of firms in Group 7 and 60% of those in Group 5 have fewer than 100 employees. Only one firm of over 500 employees was present in Group 7, while Group 5 had only two. On average, these firms quintupled their workforces; firms in Group 7 had an average workforce of 96 to start with and 473 at the end and those in Group 5 had 157 and 387, respectively. Questions of interest are: What happens after this kind of merger? Why does a small firm absorb a much larger one?
Group 5 comprised firms that achieved virtually all of their growth in a single year, in most cases in one of the last two years of the period. This may be correlated with the weak economy, with firms in difficulty possibly being taken over. A large number of firms in Group 7 also achieved their growth in a single year, but these events tended to occur more in the middle of the period than at the end. These years, corresponding to mergers or acquisitions, were not the only periods of growth for firms in Group 7. In some cases, mergers were followed by one or more years of downsizing, while in others they were followed by further phases of growth.
Group 3-5 occupied an intermediate position between Groups 3 and 5, with firms almost evenly divided between those with fewer than 100 employees and those with more. Firms in this group had an average of 174 employees in 1985 and of 390 in 1994. These firms either went through a period of slow growth until the early1990s and then expanded abruptly, or they experienced two growth phases over the period, separated by years of standstill or downsizing. These breaks took place in the middle of a growth process which the firms appear to have been unable to handle. This group seemed to combine internal growth with mergers.
Conclusions
From the methodological standpoint, it seems worth recalling that the anthropology of science and technology teaches that minor decisions on technique made at the start of a study or research project can be crucial and largely determine the end results. For this study, two methodological questions may arise. First, in developing the typology, what was the role of the index (derived from the Birch index) used to select the population of high-growth firms? Would another index have yielded different trajectories?
The index used combines absolute and relative growth. By definition, the resultant population is one that combines small firms that experienced relatively rapid growth with larger companies that grew relatively more slowly. The question of interest was not so much growth in absolute or relative terms as the trajectories that describe how firms strongly expand their workforce. If only a relative-growth index was used to constitute the population of high-growth firms, that population would have consisted exclusively of small firms, and Groups 1 or 2, which are made up of large companies, would not have been included. Similarly, if only volume growth (in number of employees) had been taken into account, the population would have been made up primarily of large firms and Groups 5 and 7, in which small businesses were over-represented, would not have been included. While the tools used were clearly not neutral, they gave the most play to the variety of situations.
Second, is the average profile of each of the eight groups relevant? (The limits of average profiles were pointed out above.) The average profile proposed for each group is in fact a stereotype. Yet, in

107
relation to the average profile of all 500 firms, it was possible to bring together firms that are similar. Looking one by one at the trajectories of the groups constituted through typological analysis, the trajectories of each of the eight groups show more similarity than diversity.
Section 2 emphasised that very few firms exhibited continuous growth over the entire period. Family A had a roughly continuous pattern of growth – “roughly”, because in almost every case, one, two or three years of workforce decline (continuous or discontinuous) interrupted an expansion which on the whole continued throughout the period.
Likewise, Section 2 demonstrated that growth trajectories linked exclusively to a merger or acquisition were virtually non-existent. Yet such phenomena play an important role in nearly one out of two cases. In Family B, one out of every two firms achieved more than 50% of its total growth in a single year (a strong indication of a merger or acquisition). In Family C (and especially Groups 5 and 7), a majority of the trajectories also feature a merger or acquisition. However, as pointed out repeatedly, these mergers are in most cases either followed or preceded by phases of growth. In other words, either the firm’s growth enables it to merge with or acquire another company, or it is the merger that triggers a growth trajectory.
Overall, this analysis of the trajectories of high-growth firms corroborates the conclusion in Section 2 that there is no “one best way” but a variety of different trajectories which have been described here.

108
4. THE POSTAL SURVEY AND ITS FINDINGS
The first phase of the study on high-growth firms was made up of a number of statistical analyses aimed at ascertaining the size of the firms and determining the types of growth trajectories they follow. It showed, for example, that the 500 high-growth manufacturing firms doubled their workforces and accounted for 57% of the increase in employment generated by the 5 000 growing firms.
The second phase aimed to determine the principal characteristics of these high-growth firms and ascertain the factors responsible for the growth patterns they exhibited. It is mainly based on the postal survey. The basic assumption underlying this investigation is that high growth is a process, but not a unique one and that there are multiple – and contrasting – patterns of high growth. The 500 high-growth firms identified and studied are diverse, and it would be illusory to attempt to find a single recipe for success or find a formula that would make it possible to succeed and to duplicate examples of outstanding success. Yet, despite their extreme diversity and multiple patterns, do high-growth firms share a number of common characteristics? The intent of this section is to seek features common to all these growth patterns.
Objectives and drafting of the questionnaire and postal survey
Issues involved
The findings set out in preceding chapters, analysis of studies carried out on high-growth SMEs in a number of countries, recent scholarship on industrial economics, sociology and the management of innovation, requests from the French Ministry of Industry and the OECD, interviews conducted with heads of SMEs that had experienced high growth — all these elements served to identify the four core themes for this analysis.
Characterisation of the growth process
To understand this process, information is needed on:
• Growth trajectories: Is growth linear or divided into stages? Does it take place in a short period of time or over many years?
• Forms of growth: Is growth achieved through mergers and acquisitions (i.e. through external growth) or through the firm’s internal development?
• The sectoral nature of growth: Does growth take place within the firm’s original sector or must the business look elsewhere for growth opportunities?

109
• The relationship with the market: Is growth based on the same products and services or on new ones?
• The geographical aspects of growth: Is growth achieved at national, European or world level?
Network and partnership dynamics
Certain questions were based on the assumption that growth is linked to the creation of alliances and partnerships between different types of interests:
• What are the dynamics of such networks?
• Growth always has a price. Who pays it?
• What alliances are there in the manufacturing sector?
• Are customers, consumers and users integrated into the growth process?
• What partnerships are there in the area of technology and innovation?
• What links are there with universities and public-sector research bodies?
• What commercial partnerships are there?
Organisation of the firm: management and human resources
The assumption here is that a high-growth SME must continuously recruit and reorganise.
• How does it do this?
• What forms of organisation exist and how do they evolve?
• Which skills and what human resources are required?
• What are the principal forms of management?
• How do business strategies evolve?
The role of government intervention
Earlier surveys for France had shown that the public authorities play a large part in the growth process.
• At what level is action taken (ministries, government agencies, regional authorities, European Commission, etc.)?

110
• In which areas do the public authorities intervene (exports, technology, assistance with recruitment, etc.)?
• How do the authorities intervene (subsidies, repayable advances, loans, advice, etc.)?
To reply to these questions, certain items of information are needed which the databases used could not provide. Therefore, a survey was carried out by means of a postal questionnaire.
Characteristics of the individual entrepreneur: a question deliberately ignored
An abundant literature already exists on the entrepreneur and on his/her characteristics. This important aspect is not been touched on here. Instead, the focus is on the dynamics of growth in high-growth firms rather than on entrepreneurial characteristics for both theoretical and practical reasons. The author’s earlier work has shown that the development of a high-growth firm is the outcome of a collective process. The firm’s growth is driven by teamwork and the complementarities it engenders. From the theoretical standpoint, determining the profile of one member of the team, albeit the team leader, is of no more than limited interest and can even be counterproductive, since it fails to acknowledge the collective aspects of the process. From a practical point of view, determining the characteristics of the team in its entirety would require special techniques and a massive survey that is beyond the framework of this study, which focuses on the firm. The study by P.-A. Julien (Quebec) provides some answers to various questions relating to entrepreneurs and their characteristics.
The postal survey
A questionnaire was compiled on the basis of the four main sets of questions. Drafting the questionnaire was particularly difficult, for two reasons. First, the questionnaire was extremely wide-ranging in that it addressed a variety of different themes. Drawing up a questionnaire on a specific topic (e.g. SMEs and innovation or SMEs and exports) would be a far more straightforward exercise. Second, the aim of the questionnaire was not to obtain a snapshot of the situation at a given moment in time, but to identify the component parts of the dynamic process of growth.
An initial version of the questionnaire was sent to the various national experts taking part in the study.17 Through work sessions and discussions, the questions were simplified and drafted in terms that were less academic and closer to the language used by business managers. Questions asking for respondents’ opinions were added to lighten the tone of the survey. Particular care was taken with the questionnaire’s format and layout. In all, the four major themes were subdivided into ten headings: growth patterns; growth process; partners; organisation; human resources; technology; respondent’s market; marketing; financing growth; and role of the public authorities.
The questionnaire was tested on a small number of firms by arranging for meetings with the heads of high-growth firms and asking them to answer the questionnaire in the presence of the researcher so as to be able to note reactions, hesitations and problems. The testing phase was arduous, but nonetheless essential, in that it demonstrated the limitations of the questionnaire, which requested information relating to a period of around ten years. Most of the managers involved were no longer able to recall exactly the situation ten years earlier and warned that they were not prepared to consult
17. Special thanks to Pierre-André Julien for his highly useful comments on the section dealing with
technology. The questionnaire was reworked with the help of Philippe Crance of GMV, a company specialising in business surveys.

111
their archives simply to fill out the questionnaire. As a result, all of the questions relating to the dynamics of growth were reviewed and simplified by making them more qualitative. A further series of tests was then carried out, which confirmed the appropriateness of these modifications.
The population selected
The original idea was to send the questionnaire to the 500 high-growth firms that had previously been studied. However, as response rates for postal surveys are generally low and as it would be necessary to process a significant number of responses, the questionnaire was addressed to nearly 1 000 high-growth enterprises. Some were taken from the database, but others were identified through regular scanning of the trade and economic press, which often carries special features on successful industrial firms. The population to which the questionnaire was sent was therefore much larger than the 500 high-growth firms analysed in Chapters 1-3 (although these were included). It therefore incorporated a much larger number of enterprises falling into the lowest workforce brackets in the study population, but it also included businesses that did not appear in the database. Care was taken to select comparable firms engaged in industrial activity, exhibiting strong growth and having life span of at least ten years. The data concerns the year 1998, rather than the period 1985-94 used in the earlier chapters.
Analysis of the findings of the postal survey
The questionnaire was sent to the managing director of each of these enterprises. There were fewer than 30 spontaneous responses. A major campaign of telephoned reminders was launched; hundreds of firms were contacted and second copies of the questionnaire were sent. In the end, 143 questionnaires were returned after several months of work. Those who carried out the telephoning and who often spoke with heads of firms, gave reasons for the relatively low response rate (not quite 15%):
• Businesses receive many questionnaires, and many firms stated that they would not respond unless it was compulsory.
• Many firms had experienced high growth between 1985 and 1994 (in some cases during the first part of that period) but no longer considered themselves high-growth firms in 1999, when the postal survey was carried out. These firms stated that they were not relevant to the survey.
As a rule, the managing director returned the questionnaire, but in many cases it had been filled out by a number of different people in the company.
Respondents and the differences between the populations analysed in the two phases
The workforce of the firms analysed through the postal survey averaged 158 at the beginning of the period (generally 1988) and rose to 373 by 1997-98. The average number of employees rose by a factor of 2.4. However, a third of these firms more than tripled their workforce, and a sixth of them more than quintupled it (Table 28).

112
Table 28. Distribution by workforce size of the populations of 500 and 150 firms, beginning of the period Percentage
No. of employees Phase 1: 500 firms (1985) Phase 2: 143 firms (1988)
20-49 21% 33%
50-99 20% 17%
100-249 23% 29%
250-499 20% 14%
500 + 16% 7%
Both populations were relatively well distributed over the various size classes. The 143 firms that responded were proportionately more concentrated in the category of under 50 employees, so that small firms were over-represented compared to the population of 500.
The growth multiplier for the average number of employees was 2 for the 500 high-growth firms (analysed using Ministry of Industry databases). The multiplier for the 143 firms was 2.4.
The responding firms were in the manufacturing sector and spread among various subsectors (given the number of firms, the 143 firms are not broken down into 15 subsectors). They were located throughout France (and again are not split on the basis of the 22 regions involved).
It should be borne in mind that the periods studied were not the same. Phase 1 covered the years 1985-94, while the postal survey, which was carried out in 1998, asked firms to respond with reference to their growth over a ten-year period, i.e. generally the period 1988-97 (or 1998).
At the end of the period, there were proportionately fewer subsidiaries in the Phase 2 than in the Phase 1 population (55% vs. 73%). Phase 2 companies tended to be relatively more independent.
Thus, the populations are fairly similar (and to some extent overlapping). The 143 respondents were not a representative sample of the 500 high-growth firms, but they do make it possible to answer the questions raised. The responses are sufficient to profile the patterns identified in Phase 1.
The purpose of the text boxes
The text boxes in this part give the results of cross-sorting that allowed for distinguishing different types of high-growth firms on the basis of various criteria. For instance, the first of these sets out the variables separating firms that grew in the same sector from those that grew through diversification. The boxes set out a certain correlation (potentially cause or effect of growth) that could help in understanding the phenomena.
Characteristics of growth
Multiplication of the number of employees over the period
The multiplier coefficient for the average number of employees was 2.4 for the 143 high-growth firms and just over 2 for the 500 high-growth firms in phase 1. The two growth rates were thus comparable.

113
A quarter of high-growth businesses increased the number of their employees by 1.5 (Figure 4). For half, the multiplier coefficient was between 1.5 and 3. For the remaining quarter, in which employee numbers more than tripled, performance differed depending on whether the firm was independent or a subsidiary of a group. A third of independent firms tripled their employees over the period, whereas only a sixth of group subsidiaries did so.
Figure 4. Breakdown of firms by workforce multiplier
More than 513%
1.527%
1.5 to 229%
2 to 319%
3 to 512%
Plotting growth
The questionnaire proposed four growth patterns and asked firms to select the one that most resembled theirs (Figure 5). It also offered a blank box for firms that preferred to trace their own graph of workforce expansion. Those that did so were either:
• Reclassified into one of the four other groups (because their graphs were similar to one of the suggested patterns).
• Put into a fifth group which is relatively uniform and comprises some 20 firms exhibiting an initial growth phase followed by a sharp drop and another growth phase.
Type 1, which represents fairly uniform growth over the period, contains 22% of the firms. At the beginning of the period, nearly half of the firms in this category had fewer than 50 employees. On average, they had 145 employees at the beginning of the period and 500 at the end. These companies grew the fastest. Their workforces were multiplied by an average factor of 3.4.
For Type 2, growth occurred over a limited number of years. The number of employees was initially stable, rose for a few years and then stabilised. This group accounts for 15% of the firms. Over half had more than 100 employees at the beginning of the period. On average, they began the period with 180 employees and ended it with 375. Their average workforce was multiplied by a factor of 2.1.
Type 3, exhibiting zigzag or erratic growth, accounts for 33% of the firms. On average, companies in this group began the period with 160 employees and ended it with 290. Their average workforce was multiplied by a factor of 1.8.
Type 4, which shows sharp growth in the first part of the period and slower growth in the latter part, accounts for 17% of the firms. Initially, 70% of these businesses had fewer than 100 employees.

114
On average, companies in this group began the period with 100 employees and ended it with 290. Their average workforce was multiplied by a factor of 2.8.
Type 5, which exhibits a period of growth followed by a decline and then an upswing, accounts for 13% of the firms. On average, companies in this group began the period with 225 employees and ended it with 450. Their average workforce was multiplied by a factor of 2.
The relative rarity of continuous growth, even in firms that performed well, was found here as in Section 2. In this instance, only one business in five was Type 1. It should be noted that respondents were only asked to consider the general form of the trajectory; the database study in Phase 1 was more rigorous and based on actual year-by-year tracking of the number of each firm’s employees. The difference in methods explains why different shares of firms experiencing continuous growth were found for the two populations.
Another point to be noted is the slowing or drop in growth for shown by Types 3, 4 and 5. This appears to reflect the effects of the 1993 economic slowdown. Phase 1 found the same result (Sections 2 and 3). In sum, high-growth firms, like others, are affected by the business cycle.
Figure 5. Five patterns of growth
1
Type 1 (2 2% )
0
0.1
0.2
0.3
0.4
0.5
0.6
0.7
0.8
0.9
1
1
Type 2 (15%)
1
Type 3 (33%) 1
Type4(17%)
1
Type 5 (13%)
Same sector of activity vs. diversification
In the great majority of cases, growth occurred in the same sector of activity. It was rarely the result of diversification. Some high-growth firms applied their expertise and technical skills to sectors that were sometimes quite remote from their traditional markets. This pattern of strong growth does exist but is unusual.

115
Differences between firms that diversified and those that stayed in the same sector of activity (25% vs. 75%)
Half of the firms that diversified experienced external growth (i.e. through mergers of acquisitions). Only a quarter of the businesses that stayed in the same sector of activity experienced extensive growth.
All criteria connected with the extension of markets or products showed a greater positive correlation with the tendency to diversify. More of these companies responded that their growth was based on geographic enlargement of their markets, on broadening of their range of products or services, on new products or services and on entering new markets.
Firms that had diversified were more likely to act in partnership with competitors than those that did not (one out of five vs. one out of ten) but were less likely to have suppliers and distributors as partners (one out of three vs. one out of two).
Where production methods are concerned, firms that diversified had more production sites (an average of four vs. two). Their production systems were more likely to feature CAPM (computer-assisted production management) and ISO certification. Most operated a systematic technology watch. Diversified firms were three times as likely as others to be involved in European projects (although only just under one in three had any such involvement). They were also more likely to possess a patent portfolio (one out of two vs. one out of four). Services accounted for a distinctly larger proportion of turnover.
Cross-sorting did not uncover any notable differences with regard to the firms’ other characteristics. Subsidiaries and independent companies were also split equally between the two groups. Neither size at the beginning of the period nor size at the end of the period strongly differentiated the two groups. Firms that diversified had an average of 140 employees at the beginning of the period and 365 at the end (a multiplier of 2.5). Those that did not undergo a diversification process averaged respectively 165 and 375 employees (a multiplier of 2.3). All things being equal, diversifying the sector of activity did not lead to higher growth.
The growth process
Basis of the growth process
Firms were asked to respond “yes” or “no” to five questions about their markets. “Natural” market growth was a term used by several heads of firms to mean that the market in which they traded was expanding rapidly and had to some extent pulled their businesses along with it. However, it was not a prerequisite for business expansion since it was cited by only four out of ten firms. Seven out of ten businesses indicated that they had had to win new markets and/or enlarge their geographical trading area in order to expand. Nearly eight out of ten businesses attributed their growth to developing new products and services or enlarging their range of products or services. A large majority of growing businesses, as mentioned earlier, remained in their original sectors (three out of four) but enlarged their geographical spheres of action and their product range; they innovated by developing new products and services. Businesses that had achieved strong growth had chosen to innovate and overcame the related uncertainties, both on the technical front (they developed new products) and on the commercial side (they succeeded in winning new markets and in expanding their trading area).
These findings confirm what many other studies had highlighted: the key role of product innovation (see in particular the SESSI surveys on this topic). However, the rest of the questionnaire underscored the fact that innovation is multifaceted. There was more to innovation than new products; it also entailed process innovation and changes in corporate organisation and product distribution (Figure 6).

116
Figure 6. Basis of firms’ growth
40
68
70
75
80
60
32
30
25
20
0% 20% 40% 60% 80% 100%
Natural market growth
New markets
Enlarging geographical trading area
New products/services
Broadening range of products/services
yes no
External (mergers, acquisitions, etc.) vs. internal growth
More detailed scrutiny of the questionnaires showed that over seven out of ten firms experienced internal growth alone. Nearly three out of ten had both internal and external (i.e. by merger or acquisition) growth. For two-thirds of the latter group, external growth accounted for less than 50% of total growth over the period; for the remaining third, more than half of total growth was external.
Major differences between firms whose growth stemmed partially from mergers or acquisitions and those whose growth was exclusively internal (28% vs. 72%)
Firms that achieved some of their growth through mergers, acquisitions, etc., were more likely to have diversified their lines of business than those whose growth was exclusively internal. On the product side, their growth generally tended to involve a broadening of the product range, most frequently by the introduction of new products and services; this commonly involved the opening up of new markets arising in response to new needs. On the market side, these firms generally marketed their products via distributors or commercial subsidiaries. Market shares for their two leading products had increased more sharply than had those of firms whose growth was exclusively internal. The number of their commercial sites had increased to a greater extent, as had their percentage of export sales.
Firms with at least some external growth had significantly more production sites, while the number of such sites had increased much more sharply (five on average vs. two). They were also more likely to enter into partnerships with competitors. Customers, suppliers and sub-contractors played important roles, although to a lesser extent than in the case of firms whose growth was exclusively internal. They were more active in R&D, being more likely to have organised research activities (three-quarters vs. half). More held patents (half vs. a quarter). They were more likely to engage in international co-operation and be involved in European projects, even though that involvement was limited.
Firms belonging to a group were more likely to have received growth financing through contributions to their current accounts if their growth was external than if it was internal. At the beginning of the period, the proportion of subsidiaries was lower among firms whose growth was external. At the end of the period, however, the percentages of subsidiaries and non-subsidiaries were the same in the case of both external and internal growth. The likelihood of external growth would therefore appear greater for firms belonging to a group.
There were no notable differences with regard to other patterns.
At the end of the period, two out of five of the businesses experiencing external growth had more than 500 employees vs. one out of six for firms whose growth was exclusively internal. The average workforce increased from 215 to 635 for the first group and from 138 to 275 for the second. On average, those with external growth grew faster, tripling their workforces while businesses whose growth was exclusively internal doubled them.
Number of and increase in production and commercial sites of high-growth firms
On average, the firms currently had 2.5 production sites. However, a little over 50% had all of their production concentrated at a single site; 20% had two production sites and 30% three or more. In

117
all, the great majority of high-growth firms had only a few production sites: seven out of ten businesses had only one or two.
Nine out of ten high-growth firms had commercial sites in addition to their production facilities. Two-thirds had between one and three commercial sites. Two firms reported a large number of commercial sites; they had very strong growth and were world leaders in their respective markets. Aside from these two, the firms averaged eight commercial sites each.
The number of production sites did not increase for 61% of the high-growth businesses, while for 39% the number increased “slightly” or “substantially” (Table 29). In sum, only a handful of firms had a large number of production sites and only a few had increased that number substantially. For the commercial sites, 46% reported no increase, while 54% increased the number of their sites slightly or substantially. Thus, these firms increased the number of commercial sites considerably more than the number of their production sites: 39% of firms increased their production sites but 54% acquired additional commercial sites.
Table 29. Increase in number of production sites and commercial sites
Substantial increase No increase Slight increase
Production sites 16% 61% 23%
Commercial sites 26% 46% 28%
Two-thirds of firms had no more than three commercial sites. The average was skewed by the 15% of businesses that had over ten sites. The number of commercial sites went up in over half the high-growth businesses, while in the case of a quarter of businesses it went up very substantially.
Share of and change in export turnover
On average, the high-growth firms derived nearly two-thirds of their turnover in France. Exports to other European countries accounted for an average of 25% of their turnover and exports outside Europe for 11%. This average covers some major disparities. Nearly half of the firms did not export at all or exported less than 10% of turnover. In all, more than three out of four firms exported. For just over a quarter, exports accounted for less than 10% of turnover. For just over another quarter, exports accounted for between 10% and 33% of turnover. Just under half the firms derived more than a third of their turnover from exports.
Difference between firms that export and those that do not (75% vs. 25%)
Exporting firms showed stronger correlation with all of the marketing indicators and made more changes to their marketing systems. Their marketing growth was achieved via distributors and to an even greater extent through commercial subsidiaries. Changes in the marketing system were more likely to have contributed to growth and the market shares of their two leading products were more likely to have increased.
The proportion of turnover derived from the five main customers increased more sharply, although this proportion was smaller for firms that exported than for those that did not. Exporters were therefore less dependent on a small number of large customers. Exporting firms exported an average of 40% of their turnover (three-quarters of this within Europe and one quarter outside Europe). Exporting firms were far more likely to achieve growth in partnership with distributors (half vs. a quarter). There were no notable differences with respect to the other types of partnerships (with customers, suppliers, sub-contractors, etc.).
Exporting firms were more likely to have seen a change of managing director (one in three vs. one in six). Their employees were more likely to have incentive packages (four-fifths vs. three-fifths). A greater proportion of firms that exported had formal research activities (two-thirds vs. two-fifths). More of them received research tax credits ( half vs. a quarter). They were twice as likely to hold patents as non-exporters (two out of five held patents vs. only one-fifth of firms that did not export).
Exporting and non-exporting firms had virtually the same average workforce at both the beginning of the period (155 employees) and at the end (370). their workforce multipliers were therefore practically identical (2.3 and 2.4). the exporting firms did not show stronger growth; nearly half of them exported little if at all (less than 10% of turnover).

118
Differences between exporting firms that increased exports substantially
and those that did not (43% vs. 57%)
Half of the firms with a substantial increase in exports derived over 30% of their turnover from exports vs. one-fifth of those with no increase in exports. One-third of the firms with a substantial increase in exports derived over 10% of their turnover from exports (vs. one-tenth of those with no increase in exports).
Their growth tended to be based on enlargement of geographical trading areas and on new markets. They were more likely to have established partnerships with distributors. Growth was achieved more through the marketing of products via these distributors and via commercial subsidiaries.
The share of turnover derived from the five main customers was smaller, so they were less dependent on a handful of large customers. Changes in their production systems had a stronger impact on growth. Those systems were more likely to feature ISO certification. They were more likely to retain consultants in organisational matters (one out of two) and experienced more organisational changes (virtually all vs. one-fifth).
Firms that substantially increased their exports were more likely to engage in organised research activity (three-fourths vs. one-half) and proportionately more of them received research tax credits (two-thirds vs. one-third). They were more likely to take part in research programmes involving international co-operation (one in four), more likely to work together with public-sector laboratories (one in five) and more likely to have European projects in progress (one in five). They were also more likely to operate a systematic technology watch.
At the beginning of the period, there were no differences in the proportion of subsidiaries. At the end, however, two-thirds of the firms with substantially increased exports were subsidiaries vs. only half of the others.
A lesser proportion of their turnover was derived from services: for one-third of the firms that did not experience a substantial increase in exports, services accounted for over 20% of total turnover. This proportion was marginal for those with higher exports.
Firms that reported a substantial rise in exports averaged 200 employees at the beginning of the period (vs. 120 for firms that did not). At the end of the period, they averaged 470 employees (as opposed to 300). The average multipliers for these two populations were virtually identical (2.3 vs. 2.4).
At the end of the period, firms with more than 500 employees accounted for a third of the population of firms with substantially higher exports but for only a sixth of those that did not record a substantial increase in exports.
More than eight out of ten businesses increased their export rates and 43% experienced a strong surge in export turnover. This is the same finding as for the data in Phase 1: at the start of the period, businesses were already exporting; their export turnover, in the great majority of cases, went up very little during the growth period (even though the actual volume of exports increased substantially). The relationship between business growth and exports is therefore not a linear one: it is not possible to say that growth is export-driven, but exports seem to be a precondition of growth.
Partnerships
Surveys of high-technology companies in recent years have highlighted the key role played by partnerships in the establishment and expansion of such businesses. In preliminary talks with heads of high-growth firms when preparing the questionnaire, a number of their opinions were noted and four were included in the questionnaire. Figure 7 shows the breakdown of their responses.

119
Figure 7. Questions on partnerships
13
24
25
28
45
47
42
61
36
25
29
10
5
4
4
1
0% 20% 40% 60% 80% 100%
Independence isbetter for growth
The group'scontribution is
decisive
Growth cannot beachieved alone
Everything dependson the partner you
choose
Totally agree Agree Disagree Strongly disagree
Differences between the characteristics of subsidiaries and non-subsidiaries – or independent firms – (62% vs. 38%)?
Subsidiaries were bigger exporters: 43% exported over a third of their turnover vs. only 25% of independent firms. Export rates rose more sharply for subsidiaries than for non-subsidiaries. Seven out of ten subsidiaries felt that their groups’ contributions were decisive, while seven out of ten non-subsidiaries thought that independence was better for growth. Subsidiaries were just as likely to have partnerships with customers and suppliers as independent firms. This would suggest that when a company is part of a group it utilises both group resources and external resources. Subsidiary companies took part in more research partnerships (with research enterprises, industrial technology centres and public-sector laboratories) than independent firms.
While independents did as much research as subsidiaries, the latter were more likely to get research tax credits than independents (which might suggest that the contribution of group financial services played a role). Group subsidiaries were more likely to use computer-assisted production management (CAPM) and adopt ISO standards than independent firms. Non-subsidiaries performed more services than companies belonging to groups. There were more changes in senior management in group subsidiaries than in independent firms. When the head of a subsidiary was replaced, it tended to be by someone within the group. Incentive packages were slightly less likely to exist in subsidiaries than in independent companies.
To a small extent, independent firms financed growth with venture capital (or via the stock market), but subsidiaries did not. Independents were also more likely to resort to borrowing. Groups were instrumental in financing the growth of their subsidiaries, and financial assistance was the dominant form of group contributions.
With regard to public authorities, a number of differences were noted. Independent firms received more government support (from the Ministry of Industry or Regional Directorates for Industry, and the Environment – DRIREs, tax credits) but were no more likely to participate in programmes. In contrast, subsidiaries received more support from Regional Centres for Innovation and Technology Transfer (CRITTs).
While over half of the companies more than doubled their workforce over the period, only a third of subsidiaries did so. Some 20% of independent firms had a growth multiplier greater than 5 vs. only 6% of subsidiaries.
At the start of the period, the average number of employees was higher for subsidiaries (190 vs. 120), but their workforces grew more slowly, and at the end of the period subsidiaries averaged 365 employees vs. an average of 380 for non-subsidiaries. The average growth multiplier was slightly less than 2 for subsidiaries and 3.2 for independents. Independents experienced greater growth than subsidiaries.
Almost nine out of ten chief executives of high-growth firms felt that “everything depends on the partner you choose. Nearly seven out of ten agreed or agreed totally with the idea that “growth cannot be achieved alone”. Most of those whose firms were subsidiaries thought that “the group’s contribution is decisive”. A large majority of heads of independent firms felt that “independence is better for growth”. It should be kept in mind that the share of subsidiaries rose over the course of the

120
period (from 38% at the beginning to 62% at the end). The latter percentage is comparable to what was found in Phase 1 as at the end of the study period; 73% of high-growth businesses belonged to a group.
Growth is largely a collective process. The partners found in previous studies on high-technology firms were also very likely to be instrumental in the growth of firms in more traditional industries with high-growth rates. Companies were asked whether growth had been achieved in association with each of ten different types of potential partners (Figure 8).
Figure 8. Was growth achieved in partnership with... ?
5
9
10
13
14
31
39
95
91
90
87
86
69
61
58
56
23
42
44
77
0% 10% 20% 30% 40% 50% 60% 70% 80% 90% 100%
Public-sector laboratories
Research enterprises
Industrial technology centres
Competitors
Service providers
Subcontractors
Other groups entities
Suppliers
Distributors
Customers
yes no
The first noteworthy point is the very broad spread of responses: some players were referred to by 5% of firms (i.e. by one in 20) others by 77% (i.e. by nearly four out of five). Some kinds of partners were rarely called on, others were strategic. One partner – the customer – appeared to play a major role. To the question: “Was growth achieved in partnership with customers?”, 77% responded “yes”. The primary partners of high-growth firms were their customers. Another major partnership was with “other group entities”; 39% of businesses answered “yes” to this question. It should be borne in mind, however, that two-thirds of these businesses belonged to a group. Questionnaires from subsidiary companies showed only 63% reporting growth in partnership with other entities of the groups to which they belonged.
In addition to these key partners, there were two other partnership spheres: the first involved distributors (44% of respondents), suppliers (42%) and other group entities (31%); the second involved service providers (14%), competitors (13%), industrial technology centres (10%), research enterprises (9%) and public-sector laboratories (5%).
Firms were also asked to designate their three most important partners. The purpose was to ascertain which of the various partners played a key role in the growth process, since some infrequently cited partners might nonetheless be strategic. The resultant classification confirms the scenario described above: customers were very much in first place, followed by distributors, suppliers and other group entities.

121
The main aims of partnerships
Our surveys of high-growth firms have uncovered five types of objectives for partnerships: development of new products, services or processes, acquisition of new skills, risk sharing, cost sharing and access to new markets. Firms were asked to specify which of these were the two main aims of their own partnerships (Figure 9).
Figure 9. Main aims of partnerships
11
16
22
64
66
89
84
78
36
34
0% 20% 40% 60% 80% 100%
Risk-sharing
Cost-sharing
Learning new skills
Development of new products,services or processes
Access to new markets
yes no
The two items most commonly cited were access to new markets and development of new
products, services or processes (cited respectively by 66% and 64% of respondents). Surprisingly, businesses did not give risk-sharing and cost-sharing as reasons for co-operating. These two aims were cited by only 11% and 16%, respectively. These two aims were cited three times as frequently as acquisition of new skills (22%) and four times as often as risk sharing or cost sharing. If high-growth businesses enter into partnerships it is in fact to overcome technical uncertainties in the development of new products or procedures and to enter new markets.
The use of consultants
The managing director of one high-growth firm mentioned the key role played in his case by the firm of organisational consultants he had worked with. In fact, more than half of firms used consultants. On average, each firm used 1.7 consultants. High-growth firms that turned to consultants generally applied to organisational consultants (cited in seven out of ten cases). Marketing consultants were cited three times out of ten, as were innovation or technology consultants and industrial design consultants. The services of organisational experts were thus most in demand by businesses.

122
Differences between firms that hire consultants and those that do not (52% vs. 48%)
Over the course of their growth periods, firms that used consultants were slightly more likely to undergo organisational change (three out of four vs. two out of three). Changes to marketing systems were cited more frequently as having contributed to growth (one in two vs. one in five). They were more likely to recruit externally, and their employees were more likely to have incentive packages. A higher percentage of such firms believed that growth cannot be achieved alone.
Firms that used consultants were more likely to have organised research activities (two-thirds vs. half). More of them had research tax credits, but not many held patents or were involved in co-operative endeavours. Subsidiaries and independent firms exhibited the same behaviour with respect to hiring consultants.
Consultants (a majority of whom are commissioned in connection with organisational matters) dealt with marketing and exporting. In the final analysis, however, it would seem that few were involved in the areas of research, co-operative ventures or patent protection, even if the commissioning firms had established research capabilities.
Firms that used consultants were slightly larger to begin with (averaging 170 employees vs. 145, and were larger at the end of the period (420 vs. 320). Their growth multiplier was slightly higher (2.5 vs. 2.2), and they derived a greater proportion of turnover from exports.
Research partnerships
Few firms reported having established partnerships in the course of their growth process with: research enterprises (9%), industrial technology centres (10%) or public-sector laboratories (5%).
Firms were also asked whether they had taken part in research partnerships with different countries (17% said “yes”), taken part in research partnerships with public-sector laboratories (15%) or had European projects in progress (13%).
These percentages may be partly cumulative, as the same businesses did not meet all of the criteria (on average, they met two of them). Counting the businesses that met one of the six criteria, this would indicate that 32% engaged to some extent in a research partnership.
Differences between firms that had research partnerships and those stating that partnerships played no role in their growth (32% vs. 68%)?
Firms whose growth was achieved in partnership with research enterprises, industrial technology centres or public-sector laboratories, or that took part in research programmes with other countries or with public-sector laboratories, or that had European projects in progress, can be distinguished from the others in that:
• Their growth was more likely to be based on new markets and the creation of new markets corresponding to new needs.
• They tended to have more production sites and more commercial sites.
• Changes to their marketing systems were more likely to have contributed to growth.
• They were less dependent on their five main customers.
Both groups had the same export rate, although the firms that conducted research were more likely to have increased the ratio of exports to total turnover.
More than the others, they felt that growth depended on the choice of partners (more than nine out of ten respondents).
Their production systems were more likely to feature ISO certification, and a larger share operated a systematic technology watch. They were far more likely to make use of consultants especially in the area of organisation, but also in innovation and technology and in industrial design. They were more prone to organisational changes, and their employees were more likely to have incentive programmes.
Firms that had research partnerships were more likely to have a formal in-house research activity (two-thirds vs. about half). More had benefited from research tax credits (three out of five vs. two out of five). They were more likely to hold patents (four out of ten) and possessed a larger average patent portfolio. The groups to which they belonged contributed systematically to the growth of their subsidiaries involved in research partnerships, in particular by supplying capital and through partnerships with other group entities.
At the beginning of the period, one-third of the firms in both groups were subsidiaries, whereas at the end of the period over half were for both groups. Thus, whether a firm is a subsidiary is not a criterion for differentiation.
Businesses involved in research partnerships started out with a greater average number of employees (nearly 200 vs. 140) and ended with more as well (averaging 500 vs. 314). Their growth was far sharper: their average workforce increased by a factor of 2.5 vs. 2.2 for the others.

123
Organisation and human resources
The great majority of high-growth businesses made organisational changes as they grew. High-growth firms changed products, processes and marketing systems. It is therefore not surprising that seven out of ten high-growth firms made organisational changes. From this standpoint, independent companies did not differ significantly from subsidiaries.
Nearly half the respondents specified what changes had been made. While no statistical value can be given to their descriptions, organisational changes and technical modifications were clearly important factors, followed by changes affecting staff, management and marketing. Less frequently cited were changes to financial structures, refocusing and the introduction of quality programmes.
Nine high-growth firms out of ten had between three and five levels of management. In this respect, high-growth firms are no different from the average French SME.
Over the period, more than 95% of the high-growth firms increased the percentage of the wage base allocated to training, and half increased it sharply. In all, however, scarcely 4% of the wage base of these businesses was earmarked for training; this does not significantly exceed the average for all French companies.
On average, the head of more than three out of ten high-growth firms changed. If only subsidiaries are taken into account, however, the managing director was more likely to have changed, since there the proportion was four out of ten. In two-thirds of cases, therefore, the managing director remained in charge of the business during the growth period.
In subsidiaries, the managing director, but above all senior managers, were more likely to change than in independent businesses, although relatively few managers were seconded from the groups in question. This happened in one-third of the subsidiaries, and the person seconded became head of the subsidiary. Accordingly, one subsidiary in three was headed by a manager seconded from the group.
In terms of recruitment, nearly two-thirds of the staff recruited by high-growth businesses were found on the job market (some of them came from competitors). One in four, however, were young people from training courses or from school. These high-growth companies made little use of professional recruiting firms.
Nearly two-thirds of the senior managers of high-growth firms were recruited externally and just over one-third through internal promotion. The preliminary interview with heads of businesses seemed to indicate that external recruitment complemented rather than replaced internal recruitment. This approach ensures that skills are built up and new blood brought in.
Incentive packages are often needed to attract senior management from other firms. Incentive packages are common in high-growth businesses. Nearly eight out of ten high-growth companies offered their employees incentive packages, and in nine cases out of ten the packages were provided for all employees. As only 10% of industrial SMEs in France have staff incentive programmes, such incentives would seem to be a distinctive feature of high-growth businesses. For many of the heads of firms questioned, in very different sectors, they are essential for motivating all members of the staff.

124
Technology
A large part of the questionnaire is devoted to technology. It looks first at the firm’s research activities and then at its production system.
Six out of ten high-growth firms have organised research activities. High-growth firms are much more committed than other businesses to such activities, either directly or indirectly. On average, nearly 5% of their turnover was earmarked for research and over 7% of their employees were involved in R&D activities. For more than seven high-growth firms out of ten, the research effort was greater than it had been ten years previously, while a quarter of the firms reported no change (Figure 10).
R&D received public support. Two-thirds of high-growth firms had organised R&D and 70% had received research tax credits over the course of their growth phase, while 30% of those conducting organised research received no research tax credits.
Phase 1 showed that a third of the 500 high-growth businesses engaged in R&D. This figure was obtained by cross-sorting the 500 high-growth businesses with the annual survey of R&D in businesses conducted by the Ministry of Research (1992 results), which greatly underestimated the number of businesses conducting research. First, it was based on a narrow definition of research activity (that of the Frascati manual) and second, even with the help of this definition it was unable to identify all businesses engaged in research.
Figure 10. Research effort compared to ten years earlier
Greater3%
Much smaller23%
Smaller48%
The same26%
One-third of companies held patents. The firm with the largest portfolio owned 400. Another had 100. A further ten companies had more than ten patents each. On average (setting aside the firm with 400), companies held six patents. Yet, while one-third of the firms in the population held patents, nearly a quarter reported that they had no organised research activity.
Whether a firm was a subsidiary or an independent company did not seem to be correlated with the likelihood of its engaging in organised research activities or holding patents. However, subsidiaries did tend to receive more research tax credits, as noted previously. It is also worth noting that 5% of the total population received research tax credits without having conducted any organised research activity, inasmuch as research tax credits are allowable for research done externally or sub-contracted.
With regard to research, these various statistical correlations suggest the existence of four groups of enterprises:

125
• 31% had none of the usual characteristics of research (organised research, tax credits, patents).
• 11% had no organised research but had received research tax credits, held patents or both.
• 41% conducted organised research and received tax credits.
• 17% conducted organised research without receiving tax credits.
Differences among these sub-populations
Between those that did not exhibit the attributes of research (31% of firms) and those that did, exports were a major difference. The former exported half as much (less than 20% of their turnover vs. 40% of the latter). The growth of businesses without organised research, tax credits or patents was based less on new products and services than that of firms possessing at least one of those attributes.
Businesses that had organised research (41% + 17%) vs. those that did not (31% + 11%): achieved growth that was more likely to have been based on new markets (three out of four vs. one out of two) or on taking market share from competitors; reported a greater contribution to growth from changes to marketing systems; systematically monitored the competition; had more production sites and more commercial sites; recorded a greater increase in the number of production sites; experienced a sharp increase in export rates; made greater use of consultants in a variety of fields; and were much more likely to have production systems with ISO certification.
Firms that engaged in organised research were more likely to take part in research programmes involving other countries or public-sector laboratories (one in four vs. very few).
Firms that engaged in organised research were larger, at both the beginning and the end of the period. Their growth rate was slightly higher than that of other firms (a multiplier of 2.5 vs. 2.2).
With regard to conducting organised research or not, there was no significant difference between subsidiaries and independent companies.
Technology watch, key technologies and production systems
Two-thirds of the high-growth firms operated systematic technology watches. Over half of the heads of these firms said that they were fully proficient in their key technologies. High-growth businesses used sophisticated management techniques in their production systems: over seven out of ten businesses had instituted computer-assisted production management (CAPM). More than six out of ten had ISO certification and nearly that many had just-in-time production systems (Figure 11).
Figure 11. High-growth firms’ use of technology in their production system
52
58
62
64
72
48
42
38
36
28
0% 20% 40% 60% 80% 100%
Proficiency in key techologies
Just-in-time system
ISO certification
Systematic technology watch
Computer-assisted production management
yes no

126
For nearly seven firms out of ten, changes to the production system had contributed to growth. While product innovation was characteristic of high growth, such innovation was inseparable from process innovation, which also contributed to growth.
In high-growth businesses, process innovation did not appear to entail a reduction in production staff. To the question, “Which two corporate functions had the highest increase in employee numbers?”, most businesses gave production and engineering and design methods. Production was one of the two functions for which the number of employees had grown the most for seven out of ten firms. Engineering and design methods were cited as one of the top two growth functions by nearly five firms out of ten. Commercial functions were cited by more than four out of ten.
Research was cited as one of the two fastest-growing functions by only two out of ten. Administration was cited by only one in ten. In these high-growth manufacturing firms, production and development functions (engineering and design methods, research) clearly played a major role.
At the time of the questionnaire, six high-growth firms out of ten had Internet sites and seven out of ten had e-mail addresses which were used for communicating with external partners (for three-quarters of the firms), customers (six out of ten) or in-house correspondents (over half).
Differences between firms that felt that changes to their production systems had contributed to growth and others (64% vs. 36%)?
The growth of businesses for which process innovation played an important role was more likely to be based on an enlarged range of products and services and on new markets. Such companies also had a greater tendency to export. Innovation was conducive to growth and exports. A greater share of such firms believed that growth could not be achieved alone (three-quarters vs. half). Their growth was achieved to a greater extent in partnership with suppliers, service providers and sub-contractors (although there was no difference with regard to associations with customers or distributors). They were more likely to use consultants, particularly for organisational matters. Their managing directors also changed more often.
Their production systems were more likely to feature a systematic technology watch, just-in-time flows, CAPM and ISO certification and more had become fully proficient in their key technologies. Engineering and design methods and production were the functions that had grown the fastest. This was not the case for research.
The two groups did not differ with respect to organised research or research tax credits, nor were there appreciable differences in the use made of research enterprises, industrial technology centres or public-sector laboratories. Organised research activity did not appear to have a direct impact on the propensity to change the production system.
For firms belonging to a group, the groups were more likely to have contributed to growth if the subsidiaries had made changes than if they had not.
Businesses for which production system changes played a role in growth were larger at the outset (averaging 170 employees vs. 135) and at the end of the period (420 vs. 295). Their average workforce multiplier was slightly higher (at 2.5 vs. 2.2).
The market
How did the markets of high-growth firms develop? The questionnaire, which was based on interviews and surveys with businesses that had experienced high growth, listed the various forms their market growth could take (Figure 12).

127
Figure 12. Market development of high-growth firms
48
65
78
81
89
52
35
22
19
11
0% 20% 40% 60% 80% 100%
Entering new markets (new needs), samecustomers
Georgraphical enlargement, samecustomers
Taking market share from competitors,same customers
Broadening product range for samecustomers
Winning new customers
yes no
For nine out of ten high-growth businesses, growth was achieved by winning new customers. Broadening the range of products or services sold to the same customers and taking market share from competitors were cited by eight firms out of ten. Both approaches were necessary: broadening the range of products or services sold to the same customers and winning new customers were complementary (new customers in eight out of ten cases could be linked to winning market share from competitors).
Geographical enlargement was cited by 65% of the firms. Entering new markets to meet new needs contributed to the growth of nearly half of the companies questioned.
Differences between firms whose growth stemmed in part from entering new markets to meet new needs and those for which this was not a factor (48% vs. 52%)?
All commercial factors showed more positive correlations: their growth was more likely to result from diversification, geographical market expansion, a broadened range of products and services, new products and services, new markets, etc.
On average they possessed a greater number of production sites and commercial sites, and the number of commercial sites had increased sharply.
They tended to be less dependent on their five main customers. The market shares of their two leading products had grown more substantially in the past ten years. They were more likely to monitor the competition systematically.
Their growth had been achieved to a proportionately greater extent with distributors, competitors, suppliers, sub-contractors and, in the case of subsidiaries, other entities in the same group. They had taken part in more research programmes involving international co-operation. They were more likely to have entered into partnerships and they felt to a greater extent than the others that growth could not be achieved alone.
They were more likely to use consultants in a variety of fields, for design work in particular. They were more likely to have undergone organisational changes and to have changed managing directors since 1988.
Their production systems were more likely to feature ISO certification, which facilitated associations with other firms. A greater share had organised research activities and more received research tax credits. They had obtained more patents and were more likely to operate a systematic technology watch.
For these firms, the relationship between product and service was more pronounced and service played a bigger role.
These businesses were less dependent on their five main customers and had strengthened the market shares of their two leading products: they were able to set about winning new markets for new clients. To reach out to these new markets, they entered into more partnerships, were more open and had a greater tendency to seek outside advice.
They had a larger workforce at both the beginning of the period (averaging 185 employees vs. 135) and at the end (478 vs. 280). They grew much more rapidly (with an average multiplier of 2.6 as compared with 2.1).

128
Figure 13. Breakdown of replies on marketing
33
35
44
88
67
65
56
12
0% 20% 40% 60% 80% 100%
Marketing via agents
Marketing via acommercialsubsidiaries
Marketing via distributors
Direct marketing
yes no
Nearly nine out of ten high-growth businesses marketed their products or services themselves and
thus had direct contact with customers(Figure 13). This again shows the importance of customers. High-growth firms integrate their customers into product design. A minority (one-third) of firms marketed their products through distributors or through agents.
This finding squares with the idea that export channels have changed. For a number of heads of high-growth firms, exporting via distributors could succeed in the short term but was not relevant in the long term. Exporting via distributors is apparently being supplanted by direct marketing. High-growth businesses need close proximity to and direct contact with their customers. With that in mind, four out of ten firms have established commercial subsidiaries.
Changes to the marketing system
For a third of the high-growth enterprises, changes to the marketing system had contributed to growth. However, over 60% of the firms, or twice as many, said that changes to the production system had contributed to growth.
For the managing directors, strong growth had more to do with process and product innovation than marketing innovation. The latter was, however, not unimportant since it occurred in 34% of the businesses studied.
Differences between firms that felt that changes to their marketing systems had contributed to growth (34%) and. those that did not (66%)
Such firms’ growth patterns tend to be based more on geographical enlargement, broadened range of products or services, new products and services and new markets. Their growth was more likely to have been achieved in partnership with distributors or sub-contractors. They had more commercial sites and the number of such sites had increased more sharply. They were more likely to avail themselves of all types of marketing (direct marketing, distributors, agents, commercial subsidiaries). Proportionately more systematically monitored the competition. Their percentage of export turnover was higher and had increased at a greater rate.
They tended to have more production sites, but their production systems were little different from those of firms reporting that changes in their marketing systems had not played a major role.
They were more likely to conduct organised research (three-quarters vs. half). Relatively more had received research tax credits (three out of five vs. two out of five). They reported more research collaborations. They tended to make greater use of consultants in a variety of fields (three-quarters vs. less than half). They had experienced proportionately more organisational changes and were more likely to have changed managing directors.
The percentage of subsidiaries was roughly the same in both groups. For the most part, firms belonging to groups felt that the groups had contributed to their growth. On average, they had more employees at the beginning of the period (190 vs. 142) and at the end (480 vs. 315). They tended to grow faster, with an average multiplier of 2.6 vs. 2.2.

129
Only a third of these firms reported that their main markets were growing strongly. Over half operated in markets with modest growth. This echoed the earlier response that their expansion had not been due to “natural market growth”. Growth was not pulled “naturally” by the market; it required a pro-active strategy. One in six high-growth enterprises had achieved strong growth in markets that were either not growing or were in recession.
On average, high-growth enterprises derived 43% of turnover from their five main customers, and two-thirds reported that this proportion had increased over the previous ten years. Sales therefore strongly concentrated on major clients. However, high-growth firms showed great diversity in terms of relations with their five main customers: 41% derived over half their turnover from them, 27% derived between a quarter and a half, and 32% of the firms less than a quarter. Two-thirds of high-growth firms depended for between a quarter and a half of their turnover on their five main customers.
Distinctions to be drawn among three groups of firms
The three groups are: those deriving less than 25% of turnover from their five main customers (32% of firms); those deriving between 25% and 49% of turnover from their five main customers (27%); and those deriving 50% or more of turnover from their five main customers (41%).
The firms least dependent on their five main customers had more production sites and more commercial sites, and the number of their commercial sites had risen more sharply. Their growth was more likely to have stemmed from entering new markets to meet new needs and from marketing products via distributors, agents or commercial subsidiaries. Changes to the marketing system had made a greater contribution to growth. Their investments in marketing, advertising and communication had increased sharply, as had their export rate. Their greatest increase in staffing had been for commercial functions. They were more likely to have grown by winning market share from competitors. All production-related indicators showed stronger correlations. Firms least dependent on their five main customers were more likely to have organised research activities. Their growth was less likely to be achieved in partnership with their customers. Firms that derived less than 25% of turnover from their five main customers were more likely to be independent, both at the beginning and the end of the period. The groups they belonged to played an important role in the growth of subsidiaries.
All three groups averaged roughly 160 employees at the beginning of the period, but at the end the firms least dependent on their five main customers had more (an average of 355 employees vs. about 305 for the other two groups). These firms grew slightly more than the others (with a multiplier of 2.4 vs. 2.3 and 1.9). It should be noted that firms deriving over 50% of turnover from their five main customers achieved the least average growth.
The combined market shares of the three main competitors of high-growth enterprises averaged 50%. This percentage had not increased over the previous ten years for four out of ten businesses, had increased slightly for another four out of ten and had increased substantially for two out of ten.
The average market share in France for the two leading products of high-growth enterprises exceeded 50% and 33%, respectively. These market shares had risen sharply for four companies out of ten. They had increased slightly for a further four out of ten, and not at all for two out of ten. For these last two groups, growth was based not on the first or second product, but rather on a broadened range or on entering new markets to meet new needs.
On average, the top two products of high-growth enterprises accounted for over half of those firms’ turnover in France. Some high-growth firms made their profits from their two leading products. A large share of these companies could not progress further in these markets and had to look elsewhere to diversify or expand geographically.
Marketing
More than two-thirds of the high-growth enterprises systematically monitored the competition. The same percentage conducted a technology watch. Three out of four high-growth firms monitored customer satisfaction, showing once again the important role of customers.

130
On average, 2% of employees worked in marketing. Advertising and promotion claimed nearly 2% of turnover and sales costs more than 6%. These budgets were very similar to the amounts earmarked by the average SME. However, nearly 85% of high-growth enterprises reported increases in the amounts they invested in marketing, communications and advertising.
To keep track of their markets, eight out of ten high-growth enterprises used reports by sales staff, six out of ten used market surveys, three out of ten used product or concept testing, and one in four used follow-up on complaints (Figure 14).
Figure 14. Methods and resources used to track markets
26
29
61
81
74
71
39
19
0% 10% 20% 30% 40% 50% 60% 70% 80% 90% 100%
Complaints
Product or concepttesting
Market surveys
Reports by sales staff
yes no
In all, these businesses used a large number of methods and marketing tools. Product or concept testing was cited in only one out of three cases. This is not surprising, since these companies had many partnerships with customers, making product testing less necessary.
On average, 85% of the turnover of high-growth enterprises was derived from products and 15% from services. While the breakdown showed little tendency to change, the swing was towards services when it did. The service activities were concentrated in a small number of firms: only one company in four had a service activity that accounted for more than 20% of its turnover.
Firms that derive more than 20% of turnover from services (20%) compared to the others (80%)
Their growth was based less on geographical expansion, new markets or new products or services. Their development was more likely to be driven by natural market growth and by diversification. They tended to have fewer commercial sites and were less likely to export. Their main markets were more likely to exhibit high growth (which is consistent with natural market growth).
They were less likely to market their products via distributors, agents or subsidiaries. They made greater use of direct marketing techniques and were more likely to monitor customer satisfaction.
Their two leading products dominated two-thirds of their markets (50% for the other firms). Changes in their marketing systems less frequently contributed to growth.
These firms were less likely to organise a technology watch and were less prone to use CAPM. Fewer had organised research activities and they received fewer research tax credits and held fewer patents.
They tended to make less use of consultants, and their employees were less likely to be given incentive packages (only half of the firms provided them).
These firms began the period with a smaller average workforce (120 vs. 168) but were the same size at the end (nearly 370 employees). Their growth rate was higher (firms that derived a significant percentage of turnover from services had an average multiplier of 3 vs. 2.2 for those that derived little or no turnover from services).
As a rule, they were proportionately more independent, at both the beginning and the end of the period.

131
Financing growth
Figure 15. Financing growth
4
6
9
20
20
33
56
90
96
94
91
80
80
66
44
10
0% 20% 40% 60% 80% 100%
Financial markets
Venture capital
New shareholders
Capital increases by initial shareholders
Capital supplied by group
Government subsidies and support
Borrowing
Corporate profits
yes no
There were three main ways of financing growth (Figure 15). The first came from within the
firm; the remaining two were external. Virtually everywhere, growth was financed from corporate profits, the most commonly cited source of financing, mentioned in nine out of ten cases. Borrowing was second (five out of ten cases). Finally, and more surprisingly, government subsidies and support were mentioned in a third of cases. The role of government intervention in growth financing is described below.
A second group of sources of financing consisted of capital increases by initial shareholders (20%) and capital supplied by the groups to which subsidiaries belonged (20%). When allowance is made for the fact that 38% of the businesses were independent and not in a position to rely on support from a group, one-third of firms belonging to a group received contributions from the group to finance their growth.
Figure 16. Opinions on financing of high-growth firms
21
23
26
51
48
44
25
26
30
3
3
2
0% 20% 40% 60% 80% 100%
The biggest problemis not finding finance
to start up butafterwards
The French bankingsystem is not geared
to financing high-growth enterprises
It is very difficult tofinance growth andremain independent

132
Interviews indicated three recurring views on the financing of high-growth enterprises (Figure 16). Seven out of ten totally agreed or agreed that the biggest problem was not finding finance to start up a company, it was afterwards (72%); the French banking system was not geared to financing high-growth enterprises (71%); and it was very difficult to finance growth and remain independent (70%).
Subsidiaries were asked whether the groups they belonged to had helped finance their growth (Figure 17). Nearly six out of ten responded that they had. Once again, at the end of the period over half of the firms in the high-growth population belonged to a group.
Figure 17. Contribution of the group to growth
35
39
43
45
57
65
65
61
57
55
43
35
0% 20% 40% 60% 80% 100%
Provide research resources
Provide staff
Provide technical know-how
Disseminate good practice
Capital increase
Current account contributions
yes no
The group contributed to growth first by current account contributions and by increasing capital.
These methods were followed by dissemination of good practice and by providing technical know-how. Finally in under one case out of four, it provided staff and research resources.
Role of public authorities
Public authorities played a major role in both R&D and growth financing. The final section of the questionnaire asked high-growth firms to select from a list of government agencies those that had provided support during their growth phase and to indicate the amounts, as well as the nature (subsidy, repayable advance, help with recruitment, equipment loans, advice, provision of premises, etc.), of any financial support. In terms of amounts of support, the figures indicated are rough averages.
Based on how often they were cited by high-growth enterprises, government agencies could be divided into four groups. The first group comprised regional councils, ANVAR (national research association) and the Ministry of Industry (via DRIREs). These provided assistance to half the firms and were considered the most useful by the high-growth enterprises. A second group, constituted by general councils and COFACE (export credit guarantor), was cited by two out of five firms. The third group included the European Commission, municipalities and DATAR (regional development agency) and was mentioned by one in five or six firms. The Ministry of Research (or DRRTs, the regional research and technology directorates) was mentioned by fewer than one firm out of ten. Other institutions were noted by only 1-3% of firms. The businesses also received types of support that are not mentioned here, such as research tax credits.

133
Regional councils gave support to nearly 60% of the firms. On average, they paid over FRF 800 000 to each firm supported (mostly in the form of subsidies). ANVAR assisted more than half of the businesses, paying each firm an average of over FRF 2 million (the bulk in repayable advances, but also in the form of help with recruitment). The Ministry of Industry, via the DRIREs, helped half of the firms, providing each with an average of FRF 900 000 (mainly in subsidies). General councils gave support primarily in the form of subsidies, but in some cases provided premises as well; their contributions averaged nearly FRF 500 000 per firm. COFACE assisted businesses in a variety of ways (repayable advances, market-testing insurance, loans, guarantees and export insurance), for an average of nearly FRF 900 000 per firm. The European Commission mainly provided subsidies. Municipalities were mentioned about equally for subsidies and for providing premises or land). DATAR provided for subsidies and loans.
The list provided in the questionnaire also included institutions which were essentially not mentioned: industrial technology centres, CRITTs, educational institutions, the Ministry of Defence, other ministries, public-sector research bodies, business incubators, industrial reconversion companies, high-technology centres and science parks.
Research tax credits were claimed by one out of every two firms.
In conclusion, firms were asked whether or not they agreed with three statements concerning government support. Virtually all heads of high-growth enterprises agreed that aid is a help, but it cannot trigger growth. While virtually all of the managing directors therefore felt that government support was useful, two-thirds agreed or totally agreed that there is not enough follow-through. Finally, two-thirds of the heads of high-growth enterprises disagreed or strongly disagreed with the idea that it is not worth applying for government support, it’s too complicated.


135
ANNEX A
STATISTICAL METHODS USED TO ESTABLISH THE EIGHT GROUPS
This annex describes the method used to construct the eight groups presented above. The data analysis was carried out by Mr. Jean-Pierre Bordet, but he did not draft the text, which represents the author’s understanding of the method used.
Determination of the quantiles
In order to describe the groups, it is necessary to be able to state, in respect of each variable, “higher, lower ... than the average profile”. We must therefore have values corresponding to “higher”, “lower”, etc. The procedure used consist in dividing each variable (column or year) into brackets. Usage and experience show that a spectrum of five values (or five brackets) is sufficiently detailed for purposes of interpretation.
To constitute these five brackets, we begin with the range of values for the 5 000 intersections in the matrix (500 firms x 10 years). The 5 000 values range from a minimum of 0.02 to a maximum of 4.18. This interval [0.02; 4.180] is split into five brackets of workforce values:
• very low [0.02; 0.795] (<)
• low [0.795; 0.935] (-)
• medium [0.935; 1.035] (=)
• high [1.035; 1.155] (+)
• very high [1,155 ; 4,180] (>).
Data coding
The following stage consists in ascertaining the bracket to which firm i belongs for each year j. To this bracket, which will be { <, -, =, +, >}, the value 1 is assigned, and for the four other brackets 0 is assigned. Thus, a firm with an index of 0.93 belongs to the second bracket (low, or - ), and it is coded: 01000. The following is an example of the type of coding carried out for each firm:
HGF 1985 1986 1987 1988 1989 1990 1991 1992 1993 1994
No. 1 10000 01000 00001 00001 00001 00001 00010 10000 10000 10000
At the end of this stage a matrix with 5 000 intersections is obtained, each indicating a workforce bracket: 00001, 00010, 00100, 01000, 10000.

136
The following phase involves constructing a matrix cross-tabulating 50 combinations (5 brackets {<, -, =, +, >} by ten years). This matrix comprises 50 rows (the ten years, with in each case the five brackets {<, -, =, +, >}); and 50 columns (the same ten years, with in each case the five brackets {<, -, =, +, >}) (see matrix excerpt below). This matrix can be used to read the number of co-occurrences of two combinations over the entire period.
Workforce Total 1985 < 1985 - 1985 = 1985 + 1985 > … 1994 >
Total 500 192 74 56 78 100 … 174
1985 < 192 192 0 0 0 0 … 83
1985 - 74 0 74 0 0 0 … 34
1985 = 56 0 0 56 0 0 … 16
1985 + 78 0 0 0 78 0 … 21
1985 > 100 0 0 0 0 100 … 20
1986 < 173 139 26 3 3 2 … 94
1986 - 77 19 24 18 15 1 … 29
1986 = 79 9 13 14 39 4 … 22
1986 + 82 5 7 11 20 39 … 17
1986 > 89 20 4 10 1 54 … 12
… … … … … … … … …
1994 > 174 83 34 16 21 20 … 174
Example: (1986 =) and (1985 >): four co-occurrences. This means that four firms had both a
value between 0.935 and 1.035 in 1986 (third bracket, or =) and a value between 1.155 and 4.180 in 1985 (fifth bracket, or >).
The first row and the first column give the occurrences of combinations as follows:
• 192 very low firms (<) in 1985.
• 74 low firms (-) in 1985.
• 56 medium firms (=) in 1985.
• 78 high firms (+) in 1985.
• 100 very high firms (>) in 1985.
This matrix is a matrix of symmetrical co-occurrences (or Burt table). It is used for a correspondence analysis that highlights the structure of the relationships between the rows and the columns and yields the best possible graphical representation (the principal axes of inertia in the point cloud) and an ascending hierarchical classification.
Following the analysis of the columns (years) of the matrix its rows (firms) are aggregated. This is possible because of the “simultaneous representation” properties of correspondence analysis (which cannot be done in factorial or principal component analysis). The firms are projected in factorial space (defined by analysing the relationships between the combinations of the years) at the time of aggregation around moving centres. The division of the ascending hierarchical classification tree yields groups of characters (combinations of year variables) for which one calculates the centres of gravity in factorial space. The first iteration in the assignment of firms to the nearest centres therefore assigns firms (rows in the initial matrix) to centres that are located in another space (that of the

137
columns of the initial matrix). It is only with the second iteration that the centres are in fact located in the same space as the firms. This process of aggregation around moving centres is the heart of the typology.
These manipulations initially reveal seven groups which are separated from each other in factorial space as much as possible. This split gives “caricatures” of groups with their characteristic variables. When a fairly large number of individuals “hesitate” between two groups, an additional group is created for them. This is what happened here, since an eighth group was created. This group is intermediate between Groups 3 and 5. In all, this work highlighted the existence of the eight standard growth configurations presented.

138
REFERENCES
Audretsch, D. B. (1995), Innovation and Industry Evolution, MIT Press, Cambridge, Massachusetts.
Baljé, S. H. and P. M. Waasdorp (1999), “Fast Growing Enterprises: Discoverers and Innovators”, in Ministry of Economic Affairs (1999), Entrepreneurship in the Netherlands.
Birch, D., A. Haggerty and W. Parsons (1993), “Who’s Creating Jobs?”, Cognetics Inc.
Birch, D. (1981), “Who creates jobs?”, The Public Interest 65.
Boccara, F. (1997), “Mythes et réalités sur l’emploi et la croissance des PME : le rôle des groupes (1984-1992)”, Document de travail, INSEE.
Caballero, R., E. Engel, and J. Haltiwanger (1997), “Aggregate Employment Dynamics: Building from Microeconomic Evidence”, American Economic Review, March.
Carree, M. and L. Klomp (1996), “Small Business and Job Creation: A Comment”, Small Business Economics 8.
Cohen, W. (1995), “Empirical Studies of Innovative Activity”, in P. Stoneman (ed.), Handbook of the Economics of Innovation and Technological Change.
Cohen, W. M. and R. C. Levin (1989), “Empirical Studies of Innovation and Market Structure”, in Schmalensee, Richard and Robert D. Willig (eds.), Handbook of Industrial Organisation.
Davidsson, P. (1995), “SMEs and Job Creation in Sweden”, paper presented at the OECD High-level Workshop on “SMEs : Employment, Innovation and Growth”, Washington, DC.
Davidsson, P., L. Lindmark and C. Olofsson (1995), “Smallness, Newness and Regional Development”, paper presented at the OECD High-level Workshop on SMEs, Innovation and Employment, Washington, DC.
Davidsson, P., L. Lindmark and C. Olofsson (1998), “The Extent of Overestimation of Small Firm Job Creation – An Empirical Examination of the Regression Bias”, Small Business Economics 11.
Davis, S., J. C. Haltiwanger and S. Schuh (1996), Job Creation and Destruction, MIT Press, Cambridge, Massachusetts.
Dunne, T., M. J. Roberts and L. Samuelson (1989), “Patterns of Firm Entry and Exit in U.S. Manufacturing Industries”, Rand Journal of Economics.
Evans, D. S. (1987), “The Relationship between Firm Growth, Size and Age: Estimates for 100 Manufacturing Industries”, Journal of Industrial Economics.

139
Geroski, P. A. (1995), “What do we know about entry?”, International Journal of Industrial Organization.
Harhoff, D., K. Stahl and M. Woywode (1998), “Legal Form, Growth and Exit of West German Firms – Empirical Results for Manufacturing, Construction, Trade and Service Industries”, The Journal of Industrial Economics.
Jovanovich, B. (1982), “Selection and the evolution of industry”, Econometrica, Vol. 50, No. 3, pp. 649-670.
Kirzner, Israel (1997), “Entrepreneurial Discovery and the Competitive Market Process: An Austrian Approach”, Journal of Economic Literature, Vol. XXXV.
Ministry of Economic Affairs of the Netherlands (1999), High-growth Companies in the Netherlands.
OECD (1994a), The OECD Jobs Study, Paris.
OECD (1994b), OECD Employment Outlook, Paris.
OECD (1996a), Technology, Productivity and Job Creation, Paris.
OECD (1996b), OECD Employment Outlook, Paris.
OECD (1997a), Implementing the OECD Jobs Strategy: Member Countries’ Experience, Paris.
OECD (1997b), Small Business, Job Creation and Growth: Facts, Obstacles and Best Practices, Paris.
OECD (1998a), Fostering Entrepreneurship, Paris.
OECD (1998b), Technology, Productivity and Job Creation: Best Policy Practices, Paris.
Picot, G., J. Baldwin and R. Dupuy (1994), “Have Small Firms Created a Disproportionate Share of New Jobs in Canada? A Reassessment of the Facts”, Paper presented at the Canadian Economics Association Meeting, June, Calgary.
Sessi (1998), L’innovation technologique dans l’industrie – édition 98, Paris.
Sessi (1998), Les compétences pour innover dans l’industrie, Paris.
Storey D. (1994), Understanding the Small Business Sector, Routledge, London.
Sutton, John (1997), “Gibrat’s Legacy”, Journal of Economic Literature, Vol. XXXV.
Symeonidis, George (1996), “Innovation, Firm Size and Market Structure: Schumpeterian Hypothesis and Some New Themes”, in OECD Economic Studies, No. 27.
Wagner (1995), “Talkin’ ‘bout Job Generation: Firm Size and Job Creation in Germany”, University of Lüneburg Working Papers No. 143.