high frequency welded – hfw pipe for offshore and...
TRANSCRIPT

HIGH FREQUENCY WELDED – HFW PIPE
FOR OFFSHORE AND ONSHORE PIPELINE
Presented by :
Iskandar I. Daulay – Method & Technology Manager
Rusma Patriansyah – Process & Product Development Engineer

• This presentation will explain about the quality of the
HFW pipe that BPI produced for both offshore, and
onshore project with detail as follow:
• Offshore Bukit Tua Development Project – Petronas Carigali Ketapang with size 323,9
mm (12.750 inch) OD x 15,9 mm (0.625 inch) WT x 12,00 m (40 ft) length with
grade API Spec. 5L L450MO (X65MO) PSL 2. The design of the pipeline is
INTRODUCTION
grade API Spec. 5L L450MO (X65MO) PSL 2. The design of the pipeline is
according to Customer Specification PTS 31.40.20.38 and API Spec. 5L Annex J
latest edition.
• Onshore Jambi Merang Development Project - JOB Pertamina - Talisman Jambi
Merang with size The size of the pipe is 406,4 mm (16.000 inch) OD x 15,9
mm (0.625 inch) WT x 12,00 mm (40 ft) length with grade API Spec. 5L L360M
(X52M) PSL 2. The design of the pipeline is according to Customer
Specification SP-SP-L-001 and API Spec. 5L latest edition

� Offshore
� Bukit Tua Field located in the Java Sea (in the Madura Island) about 110 km to the
northeast of Gresik, East Java.
� About 118 km pipes on various size (Dia 8.625 inch, 12.750 inch and 16 inch) with
grade API Spec. 5L X65 MO PSL-2 will be installed.
� Onshore
� The Jambi Merang Block is located onshore in the South Sumatra region of
Indonesia. PT PERTAMINA (PERSERO) (“PERTAMINA”) is the operator; TALISMAN
INTRODUCTION
Indonesia. PT PERTAMINA (PERSERO) (“PERTAMINA”) is the operator; TALISMAN
LIMITED (“TALISMAN”) is the assistant operator; and PACIFIC OIL & GAS
(“PACIFIC”) make up the interest holders in the Block. The parties have
established the PERTAMINA TALISMAN Joint Operating Body (herein after
referred to as COMPANY) to conduct petroleum operations under a Production
Sharing Contract (PSC) term.
� Pursuant to the approved Plant of Development (POD), COMPANY intends to
build the additional Sales Gas Pipeline from Sungai Kenawang Central Gas Plant
(SKCGP) to PGN Tie-in Point at an area adjacent to Grissik – Conoco Phillips gas
processing plant, approximately 29 km to the South East with diameter 406,4
mm

� Pipes shall be produced according to project
specification and API Spec. 5L latest edition
whichever is more stringent shall be applied
� For offshore service,
PROJECT REQUIREMENTS
� Pipes shall have excellent offshore weldability supported
by acceptable data
� Pipe ends shall have excellent Diameter and out-out
roundness tolerances for offshore automatic welding
� Pipes shall be suitable for offshore AUT (Automatic
Ultrasonic Testing)

Expansion of
production range.
Product range:
5/8” - 4”.
Pipe specification :
conduit, water
pipes, pipe for
ordinary uses.
PT. Bakrie Pipe
Industries (BPI) was
established, located in
Bekasi - West Java.
Production range :
2 3/8” - 16”.
Pipe specification :
water pipes, pipe for
ordinary uses, pipe for
oil & gas industries
Obtained API
license to
monogrammed
API 5L products
Installed a new
production line
for Dia. 1 ½” up
to 4 ½” and Dia.
8 5/8” up to 24”
with max WT.
12.7 mm
PT. Bakrie Pipe
Industries obtained
API license to
monogrammed
API 5CT products
Improved
production
capabilities with
max WT. 14.3mm
Improved
production
capabilities
with max WT.
15.9mm
BPI MILESTONES
1959 1972 1978 1981 1992 2000
PT. Bakrie &
Brothers established
steel pipe mill,
“Pabrik Pipa Baja
Talang Tirta”,
located in Jakarta.
Product range: 5/8”
– 1 ½”
Pipe Spec : Conduit
Expansion of production
range.
Product range :
5/8” - 6”.
Pipe specification :
conduit, water pipes,
square pipes, pipe for
ordinary uses, pipe for
oil & gas industries.
1984
PT. Bakrie pipe
Industries
1st company in
Indonesia
obtained
ISO 9000
Certificate
2002
Supplied pipes for
West Seno - A
(Indonesia's first
deepwater
development)
20081995 2004
Produced pipes
for sour service
accordance to
NACE MR0175,
TM0177 &
TM0284
1996 2007
Obtained
Statement of
Compliance from
DNV for producing
pipe accordance to
DNV OS F101
Obtained
OHSAS 18001
Certificate
2012
Improved
production
capabilities
with max
WT. 19.4mm

PRODUCTION PROCESS

PRODUCTION PROCESS
� In offshore application of HFW pipe, seam weldreliability and quality assurance are even morecritical than with onshore applications.
� BPI has applied, any techniques contributing to theenhancement of weld quality reliability and quality
WELD QUALITY RELIABILITY & DIMENSION
QUALITY ASSURANCE
enhancement of weld quality reliability and qualityassurance as follows:
- Equipment / Techniques for Enhancement ofWeld Quality Reliability and Assurance
- Equipment / Technique for Dimension QualityAssurance

� Strip quality
Cleanliness of steel is required for securing the quality of
HFW pipe welds and obtaining good ultrasonic flaw
detection test results
� Edge preparation
WELD QUALITY RELIABILITY AND ASSURANCE
� Edge preparation
Good edge preparation is required to ensure quality of HFW
pipe welds and to get better Charphy value on the weld
seam. As per specification, the edges of the strip or plate
should be milled or machined immediately before welding
(rotary shearing is not acceptable). BPI has used edge
machining to ensure weld seam quality

� Heat Input Control
BPI has followed Company specification to maintain welding
heat input coefficient within ±5% from qualified welding
heat input coefficient during MPQT.
The welding parameter such as welding voltage, welding
WELD QUALITY RELIABILITY AND ASSURANCE
The welding parameter such as welding voltage, welding
ampere, welding powers are continuously recorded in chart
recorder for heat input calculation
Heat input control is one of the methods to enhance the
weld quality reliability. More stable welding heat input,
which leads to weld quality reliability, can be obtained
through the use of a heat input control

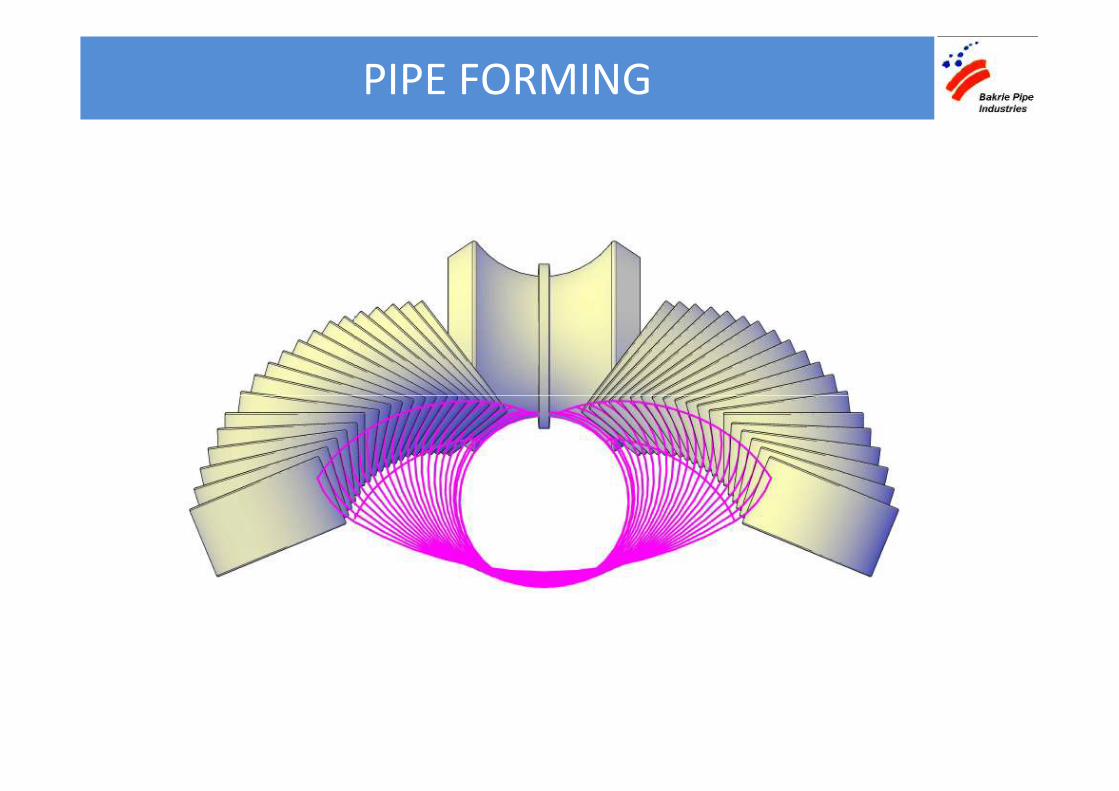
� Forming (Edge bending, linear forming, downhill)
- The formability in pipe making has a great influence to the
quality of HFW pipe welds. Unstable formability will cause
deterioration on toughness of weld.
DIMENSION QUALITY ASSURANCE
- BPI used linear forming and downhill forming prior to the
fin pass forming process. The linear forming can reduce
edge stress because of more natural and less restrained
forming compared to conventional forming
PIPE FORMING

No. Inspection items Result
1 Visual & Dimensional Inspection Good
2 Flattening Test Good
3 Product Chemical Analysis Good
4 Tensile Test Good
5 Charpy V-notch Test Good
6 Hardness test Good
PRODUCTION RESULTS FOR OFFSHORE SERVICE
6 Hardness test Good
7 Macro Examination and Metallographic Test Good
8 Hydrostatic Test Good
9 Ultrasonic Testing (off-line) for Weld and Pipe Ends Good
10 Magnetic Particle Inspection Good
11 Residual Magnetism Inspection Good
12 Final Inspection Good

PRODUCTION RESULTS FOR OFFSHORE SERVICE
Element
Max
Actual
test wt
%
Customer
Requirements
Standard Max
%
Remarks
Carbon C 0.06 0.12 Accepted
Manganese Mn 1.16 1.65 Accepted
Phosphorous P 0.009 0.020 Accepted
Sulfur S 0.004 0.010 Accepted
Chromium Cr 0.14 0.50 Accepted
Niobium Nb 0.06 0.08 Accepted
Aluminium Al 0.050 0.060 Accepted
Copper Cu 0.12 0.50 Accepted
Mechanical Test Actual Test max.
Customer
Requirement
Standard
Tensile test
of the pipe
body and
weld seam
Yield
Strength540 MPa
(450 – 570)
MPa
Tensile
Strength615 MPa
(535 – 760)
MPa
Tensile
Weld620 MPa
(535 – 760)
MPa
Elongation,
min42.5 % 23 %
YS/TS ratio, 0.82 - 0.90 0.90Copper Cu 0.12 0.50 Accepted
Molybdenum Mo 0.0040 0.50 Accepted
Nickel Ni 0.23 0.50 Accepted
Silicon Si 0.25 0.45 Accepted
Titanium Ti 0.0030 0.06 Accepted
Nitrogen N 0.005 0.012 Accepted
Vanadium V 0.07 0.10 Accepted
Boron B 0.0003 0.0005 Accepted
Nb + V + Ti 0.13 0.15 Accepted
Cu + Ni + Cr + Mo 0.51 0.8 Accepted
CE (Pcm) 0.15 0.22 Accepted
Al/N 51.00 Min : 2 Accepted
YS/TS ratio,
max0.82 - 0.90 0.90
Charpy V-
Notch Test
Sample
positionFL FL+2 FL90 FL, FL+2, FL90
Temperatur
e-10°C -10°C -10°C -10°C
Min.
Average232.5 J 295 J 275.6 J 45 J
Min.
Individual300 J 300 J 290 J 38 J
Hardness
Test
245 HV
270 HV

CHEMICAL COMPOSITION FOR OFFSHORE SERVICE
0.120.110.100.090.080.070.060.05
4
3
2
1
0
Fre
qu
en
cy
0.12
Mean 0.056
StDev 0.005477
N 5
Carbon
1.601.521.441.361.281.201.121.04
1.0
0.8
0.6
0.4
0.2
0.0
Fre
qu
en
cy
1.65
Mean 1.12
StDev 0.03536
N 5
Manganese
0.120.110.100.090.080.070.060.05
% Weight
Standar Max : 0.12
1.601.521.441.361.281.201.121.04
% Weight
Standar Max : 1.65
0.0100.0080.0060.0040.002
2.5
2.0
1.5
1.0
0.5
0.0
% Weight
Fre
qu
en
cy
0.01
Mean 0.0032
StDev 0.0008367
N 5
Sulphur
Standar Max : 0.01
0.0200.0180.0160.0140.0120.0100.0080.006
3.0
2.5
2.0
1.5
1.0
0.5
0.0
% Weight
Fre
qu
en
cy
0.02
Mean 0.0072
StDev 0.001095
N 5
Phosphorus
Standar Max : 0.02

CHEMICAL COMPOSITION FOR OFFSHORE SERVICE
0.480.420.360.300.240.180.12
3.0
2.5
2.0
1.5
1.0
0.5
0.0
% Weight
Fre
qu
en
cy
0.5
Mean 0.132
StDev 0.01095
N 5
Chromium
0.0600.0550.0500.0450.0400.0350.030
2.0
1.5
1.0
0.5
0.0
% Weight
Fre
qu
en
cy
0.06
Mean 0.0418
StDev 0.006723
N 5
Aluminium
% Weight
Standar Max : 0.50
0.080.070.060.05
5
4
3
2
1
0
% Weight
Fre
qu
en
cy
0.08
Mean 0.052
StDev 0.004472
N 5
Niobium
Standar Max : 0.08
% Weight
Standar Max : 0.06
0.500.450.400.350.300.250.20
5
4
3
2
1
0
% Weight
Fre
qu
en
cy
0.5
Mean *
StDev *
N 5
Copper
Standar Max : 0.5

CHEMICAL COMPOSITION FOR OFFSHORE SERVICE
0.4550.3900.3250.2600.1950.1300.0650.000
2.0
1.5
1.0
0.5
0.0
% Weight
Fre
qu
en
cy
0.5
Mean 0.0036
StDev 0.001140
N 5
Molybdenum
0.500.450.400.350.300.250.20
2.0
1.5
1.0
0.5
0.0
% Weight
Fre
qu
en
cy
0.5
Mean 0.208
StDev 0.01643
N 5
Nickel
Standar Max : 0.5
0.440.400.360.320.280.240.20
3.0
2.5
2.0
1.5
1.0
0.5
0.0
% Weight
Fre
qu
en
cy
0.45
Mean 0.224
StDev 0.01949
N 5
Silicon
Standar Max : 0.45
Standar Max : 0.50
0.0560.0480.0400.0320.0240.0160.0080.000
4
3
2
1
0
% Weight
Fre
qu
en
cy
0.06
Mean 0.0024
StDev 0.0005477
N 5
Titanium
Standar Max : 0.06

CHEMICAL COMPOSITION FOR OFFSHORE SERVICE
0.1120.0960.0800.0640.0480.0320.0160.000
5
4
3
2
1
0
% Weight
Fre
qu
en
cy
0.12
Mean *
StDev *
N 5
Nitrogen
0.100.090.080.07
5
4
3
2
1
0
% Weight
Fre
qu
en
cy
0.1
Mean *
StDev *
N 5
Vanadium
Standar Max : 0.120
% Weight
Standar Max : 0.10
0.00050.00040.00030.00020.0001-0.0000
4
3
2
1
0
% Weight
Fre
qu
en
cy
0.0005
Mean 0.00014
StDev 0.00008944
N 5
Boron
Standar Max : 0.0005
0.150.140.130.12
4
3
2
1
0
% Weight
Fre
qu
en
cy
0.15
Mean 0.126
StDev 0.005477
N 5
Nb+V+Ti
Standar Max : 0.15

CHEMICAL COMPOSITION FOR OFFSHORE SERVICE
0.800.750.700.650.600.550.50
2.5
2.0
1.5
1.0
0.5
0.0
Fre
qu
en
cy
0.8
Mean 0.502
StDev 0.008367
N 5
Cu+Ni+Cr+Mo
52.545.037.530.022.515.07.5
2.0
1.5
1.0
0.5
0.0
Fre
qu
en
cy
2
Mean 41.8
StDev 6.723
N 5
Al : N
0.800.750.700.650.600.550.50
% Weight
Standar Max : 0.8
52.545.037.530.022.515.07.5
% Weight
Standar Min : 2
0.220.200.180.160.140.12
3.0
2.5
2.0
1.5
1.0
0.5
0.0
% Weight
Fre
qu
en
cy
0.22
Mean 0.142
StDev 0.01095
N 5
CE (Pcm)
Standar Max : 0.22
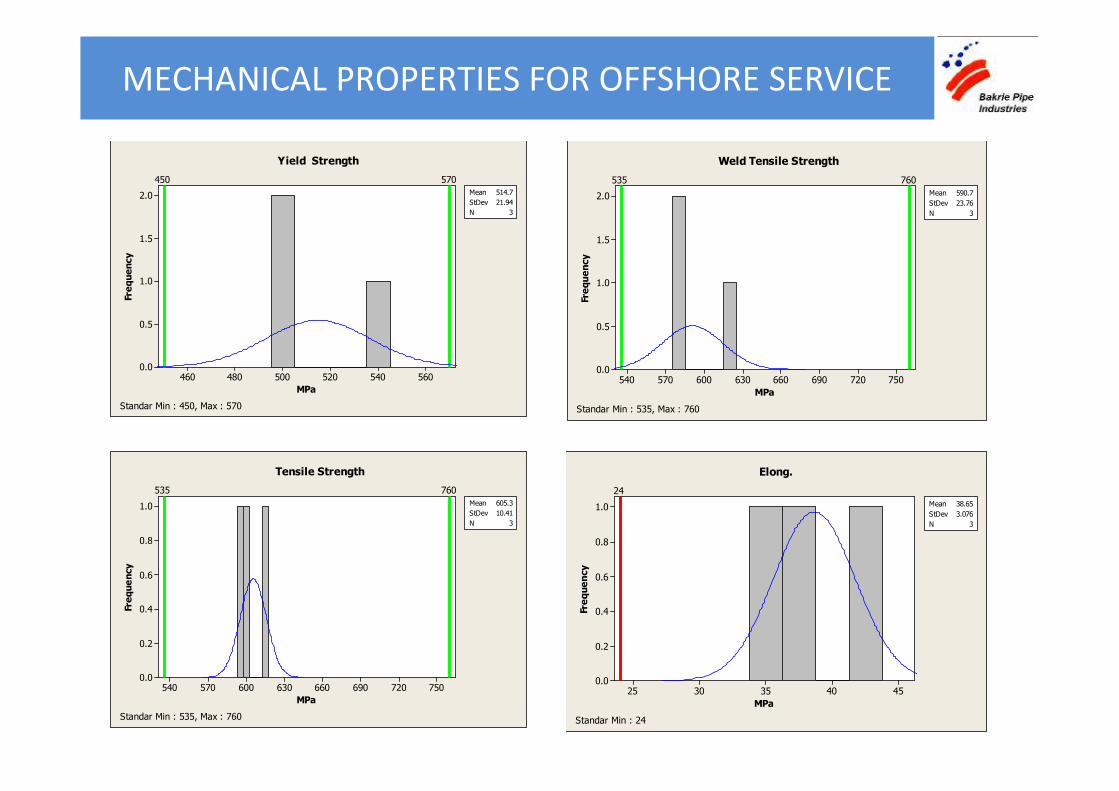
MECHANICAL PROPERTIES FOR OFFSHORE SERVICE
560540520500480460
2.0
1.5
1.0
0.5
0.0
MPa
Fre
qu
en
cy
570450
Mean 514.7
StDev 21.94
N 3
Yield Strength
750720690660630600570540
2.0
1.5
1.0
0.5
0.0
MPa
Fre
qu
en
cy
760535
Mean 590.7
StDev 23.76
N 3
Weld Tensile Strength
Standar Min : 450, Max : 570
MPa
Standar Min : 535, Max : 760
750720690660630600570540
1.0
0.8
0.6
0.4
0.2
0.0
MPa
Fre
qu
en
cy
760535
Mean 605.3
StDev 10.41
N 3
Tensile Strength
Standar Min : 535, Max : 760
4540353025
1.0
0.8
0.6
0.4
0.2
0.0
MPa
Fre
qu
en
cy
24
Mean 38.65
StDev 3.076
N 3
Elong.
Standar Min : 24

MECHANICAL PROPERTIES FOR OFFSHORE SERVICE
0.900.880.860.840.82
1.0
0.8
0.6
0.4
0.2
0.0
MPa
Fre
qu
en
cy
0.9
YS/TS
Standar Max : 0.90
3202802402001601208040
2.0
1.5
1.0
0.5
0.0
Joule
Fre
qu
en
cy
45
Mean 275.6
StDev 23.26
N 3
Impact B
Standar Min : 45Standar Max : 0.90
400300200100
3.0
2.5
2.0
1.5
1.0
0.5
0.0
Joule
Fre
qu
en
cy
45
Mean 232.5
StDev 92.26
N 5
Impact W
Standar Min : 45
Standar Min : 45
30627223820417013610268
1.0
0.8
0.6
0.4
0.2
0.0
Joule
Fre
qu
en
cy
45
Mean 295
StDev 3
N 3
Impact H
Standar Min : 45

MECHANICAL PROPERTIES FOR OFFSHORE SERVICE
3.0
2.5
2.0
1.5
1.0
0.5
0.0
Fre
qu
en
cy
85
Mean *
StDev *
N 3
Shear Area
1.0
0.8
0.6
0.4
0.2
0.0
Fre
qu
en
cy
270
Mean 213.0
StDev 3.371
N 3
Hardness
1000.0
Avg : 85 %
Standar Avg : 85
2702612522432342252162070.0
270 HV.10
Standar Max : 270

Metal Flow
MACRO EXAMINATION FOR OFFSHORE SERVICE
(Mag. 10X)

Fusion line Heat Affected Zone
METALURGICAL EXAMINATION
FOR OFFSHORE SERVICE
Base Metal
(Mag. 200x)
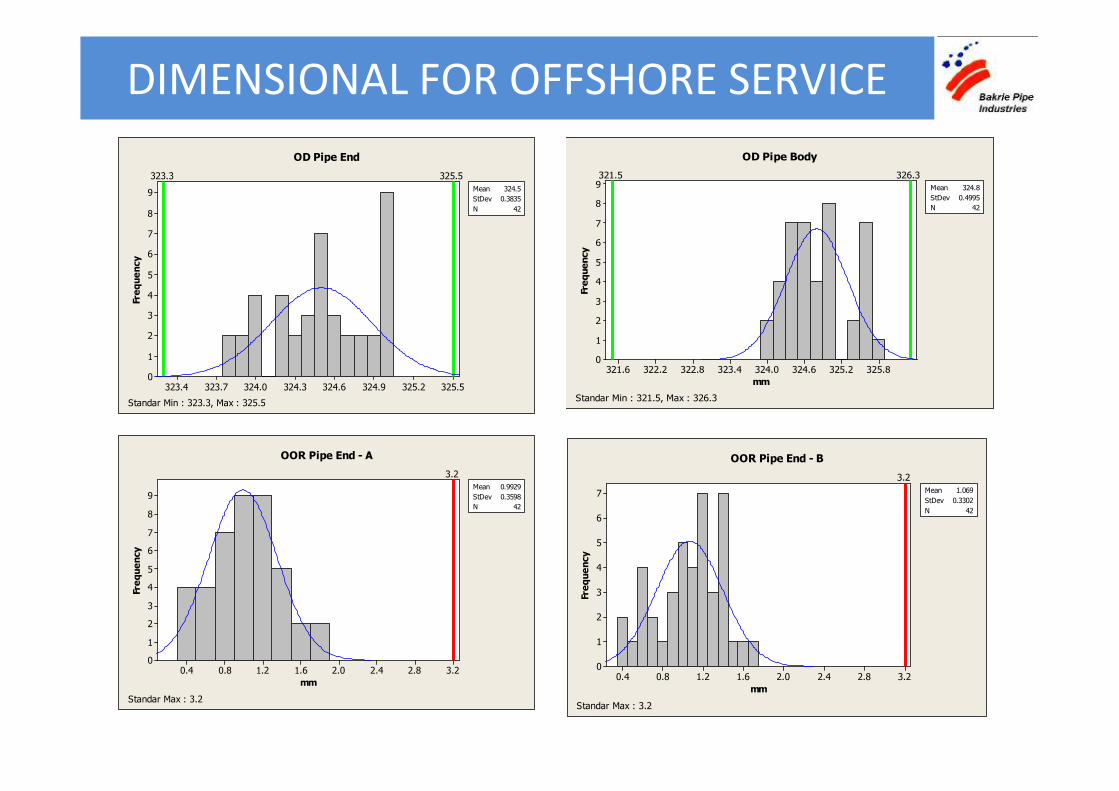
DIMENSIONAL FOR OFFSHORE SERVICE
325.5325.2324.9324.6324.3324.0323.7323.4
9
8
7
6
5
4
3
2
1
0
Fre
qu
en
cy
325.5323.3
Mean 324.5
StDev 0.3835
N 42
OD Pipe End
325.8325.2324.6324.0323.4322.8322.2321.6
9
8
7
6
5
4
3
2
1
0
mm
Fre
que
ncy
326.3321.5
Mean 324.8
StDev 0.4995
N 42
OD Pipe Body
Standar Min : 321.5, Max : 326.3Standar Min : 323.3, Max : 325.5
Standar Min : 321.5, Max : 326.3
3.22.82.42.01.61.20.80.4
9
8
7
6
5
4
3
2
1
0
mm
Fre
qu
en
cy
3.2
Mean 0.9929
StDev 0.3598
N 42
OOR Pipe End - A
Standar Max : 3.2
3.22.82.42.01.61.20.80.4
7
6
5
4
3
2
1
0
mm
Fre
qu
en
cy
3.2
Mean 1.069
StDev 0.3302
N 42
OOR Pipe End - B
Standar Max : 3.2

DIMENSIONAL FOR OFFSHORE SERVICE
12
10
8
6
4
Fre
qu
en
cy
6.5
Mean 0.9415
StDev 0.3331
N 41
OOR Pipe Body
20
15
10
Fre
qu
en
cy
11.7 12.7
Mean 12.17
StDev 0.1846
N 57
Pipe Length
654321
4
2
0
mm
Standar Max : 6.5
12.612.412.212.011.8
5
0
mm
Standar Min : 11.7, Max : 12.7

BPI has experience data for offshore service with the same pipe gradefor Weldability test which was conducted in Serimax by usingautomatic GMAW according to API 1104.
All test result was satisfactory
WELDABILITY TEST

WELDABILITY TEST

PRODUCTION RESULTS FOR ONSHORE SERVICE
No Inspection Items Results
1 Visual & Dimensional Inspection Good
2 Product Chemical Analysis Good
3 Tensile Test Good
4 Flattening Test Good
5 Charpy V-notch Test Good
6 Hardness test Good
7 Macro Examination and Metallographic Test Good7 Macro Examination and Metallographic Test Good
8 Hydrostatic Test Good
9Ultrasonic Testing (off-line) for Weld and Full Body full
lengthGood
10 Magnetic Particle Inspection Good
11 Residual Magnetism Inspection Good
12 Final Inspection Good

PRODUCTION RESULTS FOR ONSHORE SERVICE
Element Actual test
max. wt %
Customer
Requireme
nts
Standard
Max %
Remarks
Ø406.4mm x
15.9mm x
12,000mm
Carbon C 0.04 0.16 Accepted
Manganese Mn 1.21 1.40 Accepted
Phosphorous P 0.018 0.020 Accepted
Sulfur S 0.007 0.010 Accepted
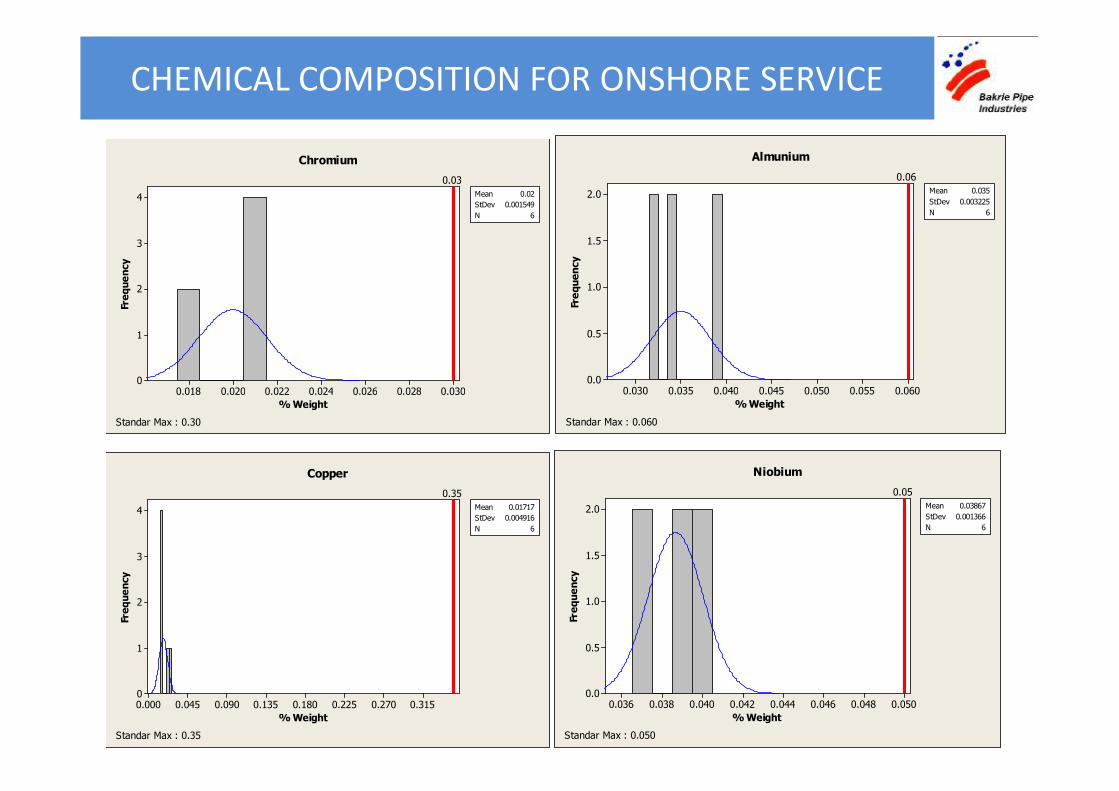
Chromium Cr 0.021 0.30 Accepted
Mechanical Test Actual Test max.
Customer
Requirement
Standard
Tensile test of
the pipe body
and weld
seam
Yield Strength 405 MPa
Min:360
MPa
Max:530MPa
Tensile
Strength520 MPa
Min:460
MPa
Max:760MPa
Tensile Weld 550 MPa
Min:460
MPa
Max:760MPa
Elongation 45.20 % Min: 27%Chromium Cr 0.021 0.30 Accepted
Niobium Nb 0.040 0.050 Accepted
Aluminum Al 0.039 0.060 Accepted
Copper Cu 0.022 0.35 Accepted
Molybdenum Mo 0.007 0.15 Accepted
Nickel Ni 0.007 0.30 Accepted
Silicon Si 0.28 0.35 Accepted
Titanium Ti 0.004 0.04 Accepted
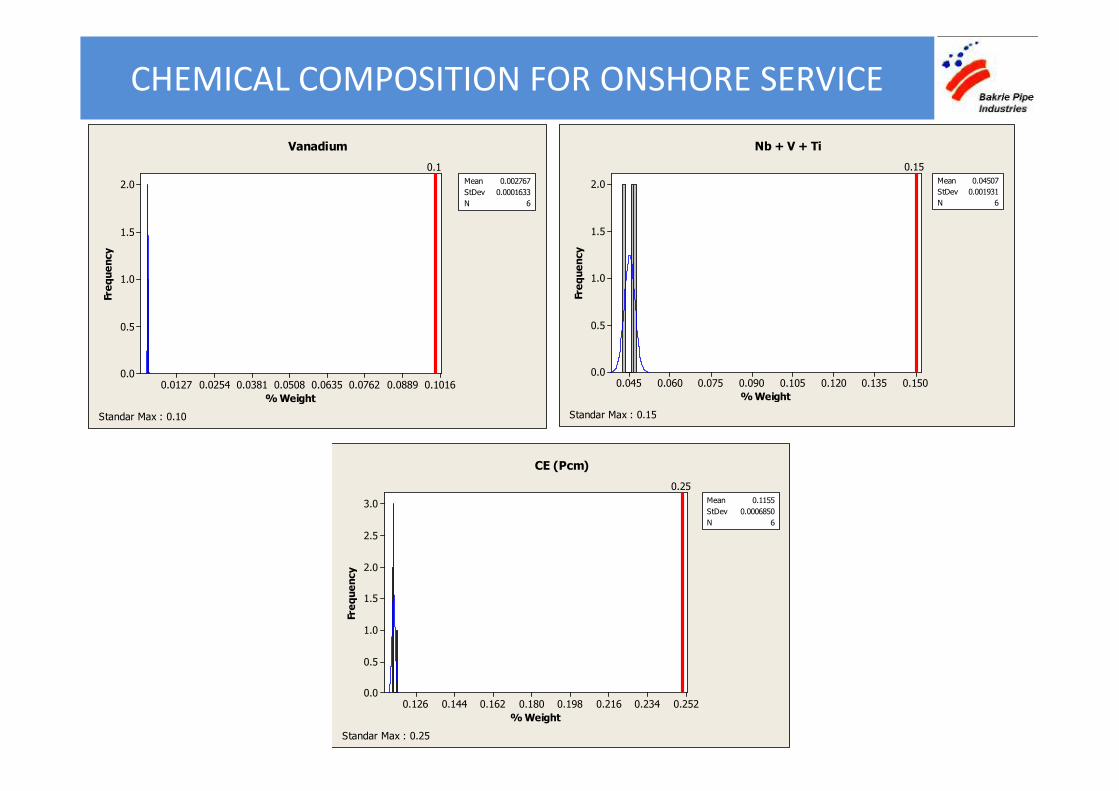
Vanadium V 0.003 0.10 Accepted
Nb + V + Ti 0.050 0.15 Accepted
CE (Pcm) 0.12 0.25 Accepted
Elongation 45.20 % Min: 27%
YS/TS ratio 0.81 Max: 0.93
Charpy V-
Notch Test
Sample
positionFL0 FL+2 BM FL0,FL+2,BM
Temperature 0°C 0°C 0°C -0°C
Average 238.7 J 275.8 J 297.6 J Min: 27 J
Individual 300 J 300 J 300 J Min: 21 J
Hardness Test
210 HV
Max: 248 HV
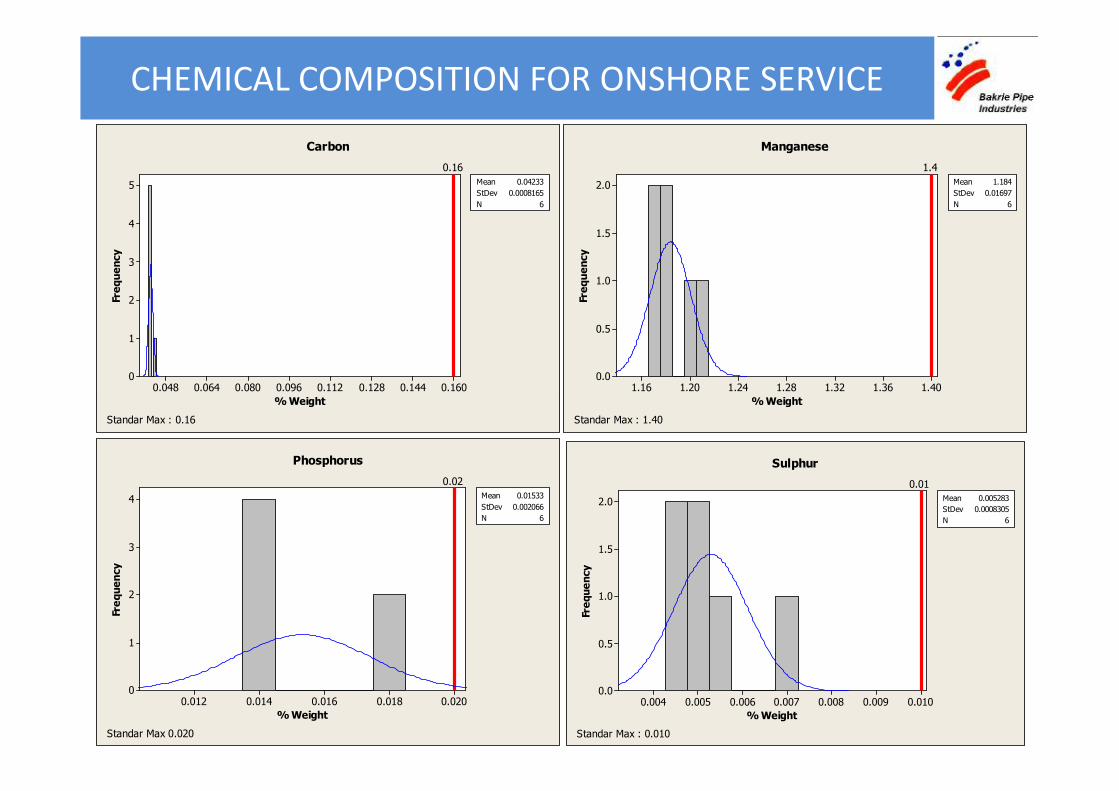
CHEMICAL COMPOSITION FOR ONSHORE SERVICE
0.1600.1440.1280.1120.0960.0800.0640.048
5
4
3
2
1
0
% Weight
Fre
qu
en
cy
0.16
Mean 0.04233
StDev 0.0008165
N 6
Carbon
1.401.361.321.281.241.201.16
2.0
1.5
1.0
0.5
0.0
% Weight
Fre
qu
en
cy
1.4
Mean 1.184
StDev 0.01697
N 6
Manganese
% Weight
Standar Max : 0.16
0.0200.0180.0160.0140.012
4
3
2
1
0
% Weight
Fre
qu
en
cy
0.02
Mean 0.01533
StDev 0.002066
N 6
Phosphorus
Standar Max 0.020
% Weight
Standar Max : 1.40
0.0100.0090.0080.0070.0060.0050.004
2.0
1.5
1.0
0.5
0.0
% Weight
Fre
qu
en
cy
0.01
Mean 0.005283
StDev 0.0008305
N 6
Sulphur
Standar Max : 0.010
CHEMICAL COMPOSITION FOR ONSHORE SERVICE
0.0300.0280.0260.0240.0220.0200.018
4
3
2
1
0
Fre
qu
en
cy
0.03
Mean 0.02
StDev 0.001549
N 6
Chromium
0.0600.0550.0500.0450.0400.0350.030
2.0
1.5
1.0
0.5
0.0
Fre
qu
en
cy
0.06
Mean 0.035
StDev 0.003225
N 6
Almunium
0.0300.0280.0260.0240.0220.0200.018
% Weight
Standar Max : 0.30
0.0500.0480.0460.0440.0420.0400.0380.036
2.0
1.5
1.0
0.5
0.0
% Weight
Fre
qu
en
cy
0.05
Mean 0.03867
StDev 0.001366
N 6
Niobium
Standar Max : 0.050
0.0600.0550.0500.0450.0400.0350.030
% Weight
Standar Max : 0.060
0.3150.2700.2250.1800.1350.0900.0450.000
4
3
2
1
0
% Weight
Fre
qu
en
cy
0.35
Mean 0.01717
StDev 0.004916
N 6
Copper
Standar Max : 0.35

CHEMICAL COMPOSITION FOR ONSHORE SERVICE
0.1040.0910.0780.0650.0520.0390.0260.013
3.0
2.5
2.0
1.5
1.0
0.5
0.0
% Weight
Fre
qu
en
cy
0.15
Mean 0.00615
StDev 0.0001225
N 6
Molybdenum
0.26880.23040.19200.15360.11520.07680.0384-0.0000
2.0
1.5
1.0
0.5
0.0
% Weight
Fre
qu
en
cy
0.3
Mean 0.006283
StDev 0.0006145
N 6
Nickel
% Weight
Standar Max : 0.15
% Weight
Standar Max : 0.30
0.340.320.300.280.260.24
2.0
1.5
1.0
0.5
0.0
% Weight
Fre
qu
en
cy
0.35
Mean 0.262
StDev 0.01647
N 6
Silicon
Standar Max : 0.35
0.0400.0350.0300.0250.0200.0150.0100.005
3.0
2.5
2.0
1.5
1.0
0.5
0.0
% Weight
Fre
qu
en
cy
0.04
Mean 0.003633
StDev 0.0007257
N 6
Titanium
Standar Max : 0.04
CHEMICAL COMPOSITION FOR ONSHORE SERVICE
0.10160.08890.07620.06350.05080.03810.02540.0127
2.0
1.5
1.0
0.5
0.0
% Weight
Fre
qu
en
cy
0.1
Mean 0.002767
StDev 0.0001633
N 6
Vanadium
0.1500.1350.1200.1050.0900.0750.0600.045
2.0
1.5
1.0
0.5
0.0
% Weight
Fre
qu
en
cy
0.15
Mean 0.04507
StDev 0.001931
N 6
Nb + V + Ti
% Weight
Standar Max : 0.10
% Weight
Standar Max : 0.15
0.2520.2340.2160.1980.1800.1620.1440.126
3.0
2.5
2.0
1.5
1.0
0.5
0.0
% Weight
Fre
qu
en
cy
0.25
Mean 0.1155
StDev 0.0006850
N 6
CE (Pcm)
Standar Max : 0.25

MECHANICAL PROPERTIES FOR ONSHORE SERVICE
525500475450425400375
1.0
0.8
0.6
0.4
0.2
0.0
MPa
Fre
qu
en
cy
360 530
Mean 399.7
StDev 7.506
N 3
Yield Strength
Standar Min : 360, Max : 530
760720680640600560520480
1.0
0.8
0.6
0.4
0.2
0.0
MPa
Fre
qu
en
cy
460 760
Mean 549.3
StDev 3.512
N 3
Weld Tensile Strength
Standar Min : 360, Max : 530
760720680640600560520480
1.0
0.8
0.6
0.4
0.2
0.0
MPa
Fre
qu
en
cy
460 760
Mean 508.3
StDev 8.505
N 3
Tensile Strength
Standar Min : 460, Max : 760
MPa
Standar Min : 460, Max : 760
44.842.039.236.433.630.828.0
1.0
0.8
0.6
0.4
0.2
0.0
MPa
Fre
qu
en
cy
27
Mean 44.75
StDev 0.6920
N 3
Elong ( % )
Standar Min : 27

MECHANICAL PROPERTIES FOR ONSHORE SERVICE
0.930.900.870.840.810.780.75
1.0
0.8
0.6
0.4
0.2
0.0
MPa
Fre
qu
en
cy
0.93
Mean 0.7863
StDev 0.01752
N 3
YS/TS
Standar Max : 0.93
292.6
279.3
266.0
252.7
239.
4
226.1
212.8
199.5
2.0
1.5
1.0
0.5
0.0
Joule
Fre
qu
en
cy
27
Mean 297.6
StDev 0.1934
N 3
Impact B
Standar Min : 27Standar Max : 0.93
36030024018012060
1.0
0.8
0.6
0.4
0.2
0.0
Joule
Fre
qu
en
cy
27
Mean 238.7
StDev 51.89
N 3
Impact W
Standar Min : 27
Standar Min : 27
3202802402001601208040
2.0
1.5
1.0
0.5
0.0
Joule
Fre
qu
en
cy
27
Mean 275.8
StDev 17.02
N 3
Impact H
Standar Min : 27

MECHANICAL PROPERTIES FOR ONSHORE SERVICE
1.0
0.8
0.6
0.4Fre
qu
en
cy
248
Mean 202
StDev 8.888
N 3
Hardness
240230220210200190180
0.2
0.0
248 HV.10
Standar Max : 248

Metal Flow
MACRO EXAMINATION FOR ONSHORE SERVICE
(Mag. 10X)

Fusion line Heat Affected Zone
METALURGICAL EXAMINATION FOR ONSHORE SERVICE
Base Metal
(Mag. 200x)

DIMENSIONAL FOR ONSHORE SERVICE
408.0407.4406.8406.2405.6405.0
25
20
15
10
5
0
mm
Fre
qu
en
cy
408404.8
Mean 406.4
StDev 0.3658
N 43
OD Pipe End
408.8408.0407.2406.4405.6404.8404.0
25
20
15
10
5
0
mm
Fre
qu
en
cy
409.4403.4
Mean 407.3
StDev 0.2919
N 43
OD Pipe Body
mm
Standar Min : 404.8, Max : 408.0
5.64.84.03.22.41.60.8
14
12
10
8
6
4
2
0
mm
Fre
qu
en
cy
6.1
Mean 1.260
StDev 0.3339
N 43
OOR Pipe End - A
Standar Max : 6.1
mm
Standar Min : 403.4, Max : 409.4
5.64.84.03.22.41.60.8-0.0
20
15
10
5
0
mm
Fre
qu
en
cy
6.1
Mean 0.7698
StDev 0.3328
N 43
OOR Pipe End - B
Standar Max : 6.1

DIMENSIONAL FOR ONSHORE SERVICE
12
10
8
6
eq
ue
nc
y
8.1
Mean 1.337
StDev 0.3697
N 43
OOR Pipe Body
25
20
15
eq
ue
nc
y
11.5 12.7
Mean 12.16
StDev 0.1712
N 43
Pipe Length
87654321
4
2
0
mm
Fre
Standar Max : 8.1
12.612.412.212.011.811.6
10
5
0
mm
Fre
Standar Min : 11.5, Max : 12.7

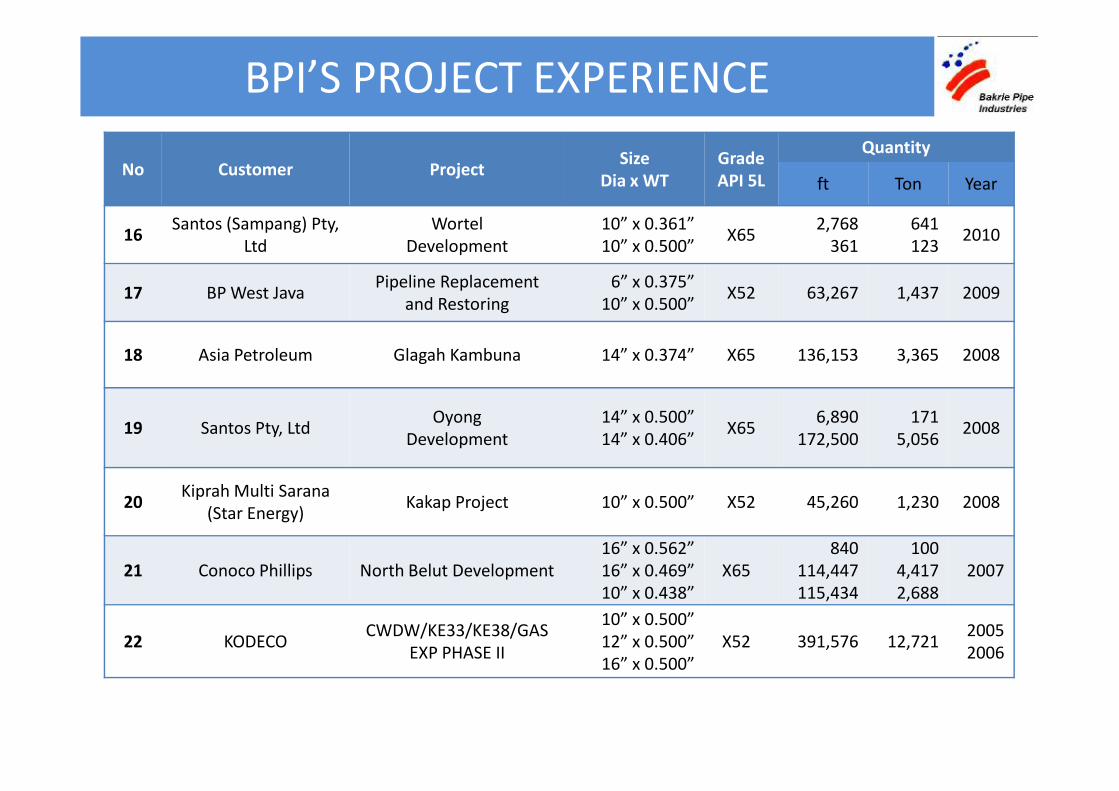
BPI’S PROJECT EXPERIENCE
No Customer ProjectSize
Dia x WT
Grade
API 5L
Quantity
ft Ton Year
1PERTAMINA HULU
ENERGY ONWJLTP Replacement Program 16” x 0.500” X52MO 47480 1800 2014
2 PERTAMINA EPRerouting Gas Pipeline
L-Parigi - Cilamaya
14” x 0.500“
20” x 0.500“X52MO
13189
3307
432
1562013
3 PERTAMINA GAS ARUN - BELAWAN 24” x 0.500” X52M 725903.0 41388.15 2013
4REKAYASA INDUSTRI QQ
PERTAMINA EP
Pembangunan Fasilitas
Produksi Gas Donggi
16” x 0.344”
16” x 0.406”X52M
95144.07
26246.64
2485.5
804.872013
5
CPM QQ JOB
PERTAMINA-TALISMAN
JAMBI MERANG
Jambi Merang
Development
16” x 0.562”
16” x 0.625”X52M
85038.8
1345.14
3576.9
62.72013
6 PTMI QQ PC MURIAHKepodang Gas
Development10.750” x 0.344” X65MO 11648 201 2013
7 SANTOSPeluang Field
Development10.750” x 0.500” X65MO 58179 1446 2013
8 KPM QQ PHE WMO Procurement of 16” 16” x 0.500” X52MO 72178 2994 2012
9 PHE WMOKE-38B, KE-39 & KE-54
Field Development
16” x 0.500”
10.750” x 0.500”
X52MO
X42MO
56712
7218
2391
2162012

BPI’S PROJECT EXPERIENCE
No Customer ProjectSize
Dia x WT
Grade
API 5L
Quantity
ft Ton Year
10
SWIBER QQ
CONOCOPHILLIPS
INDONESIA
South Belut Project14“ x 0.438“
8.625“ x 0.312“X65MO
63186
15134
2177
19442012
12.750“ x 0.375“
12.750“ x 0.406“
336739.8
40826.65
7582.94
992.16
11PETRONAS PC
KETAPANG LTD
Bukit Tua
Development
12.750“ x 0.406“
12.750“ x 0.625“
16“ x 0.375“
8“ x 0.438"
X65
40826.65
1761.15
4921.245
4963.24
992.16
64.75
139.96
86.35
2012
12 PGN CP 712.750"x 0.500"
16"x 0.500"
BM
X46
39894.9
204395.7
1185
76822012
13PEARL OIL (SEBUKU)
LTD
Ruby Field
Development14” x 0.438” X65 492,125 14,145 2012
14 CONOCO PHILLIPSBawal Subsea
Development14” x 0.563” X60 12,497 5,594 2011
15PERTAMINA HULU
ENERGY ONWJ
APN E/F New Field
Development
10” x 0.500”
24” x 0.563”
24” x 0.500”
X52
54
156
5,923
62
139
4,088
2011
No Customer ProjectSize
Dia x WT
Grade
API 5L
Quantity
ft Ton Year
16Santos (Sampang) Pty,
Ltd
Wortel
Development
10” x 0.361”
10” x 0.500”X65
2,768
361
641
1232010
17 BP West JavaPipeline Replacement
and Restoring
6” x 0.375”
10” x 0.500”X52 63,267 1,437 2009
18 Asia Petroleum Glagah Kambuna 14” x 0.374” X65 136,153 3,365 2008
BPI’S PROJECT EXPERIENCE
19 Santos Pty, LtdOyong
Development
14” x 0.500”
14” x 0.406”X65
6,890
172,500
171
5,0562008
20Kiprah Multi Sarana
(Star Energy)Kakap Project 10” x 0.500” X52 45,260 1,230 2008
21 Conoco Phillips North Belut Development
16” x 0.562”
16” x 0.469”
10” x 0.438”
X65
840
114,447
115,434
100
4,417
2,688
2007
22 KODECOCWDW/KE33/KE38/GAS
EXP PHASE II
10” x 0.500”
12” x 0.500”
16” x 0.500”
X52 391,576 12,7212005
2006

No Customer ProjectSize
Dia x WT
Grade
API 5L
Quantity
ft Ton Year
23Oikos
(UNOCAL)SAPI 12” x 0.500” X52 35,090 1,072 2004
24 BP West Java LtdAPN Development
Project
24” x 0.500”
24” x 0.562”
10” x 0.500”
X52
259,120
1,435
1,435
14,775
92
36
2004
BPI’S PROJECT EXPERIENCE
Project10” x 0.500” 1,435 36
25Clough Offshore
(UNOCAL)
West Seno Field
Development
12” x 0.500”
12” x 0.500”
12” x 0.375”
X65
X52
X52
25,880
234,240
12,440
767
6,960
280
2002
26J.RAY MC-DERMOTT
(BP West Java Ltd)GPG1 12” x 0.500” X52 72,000 2,140 2002
27 BP West Java LtdONWJ Pipeline
Replacement16” x 0.500” X52 44,000 1,650 2001
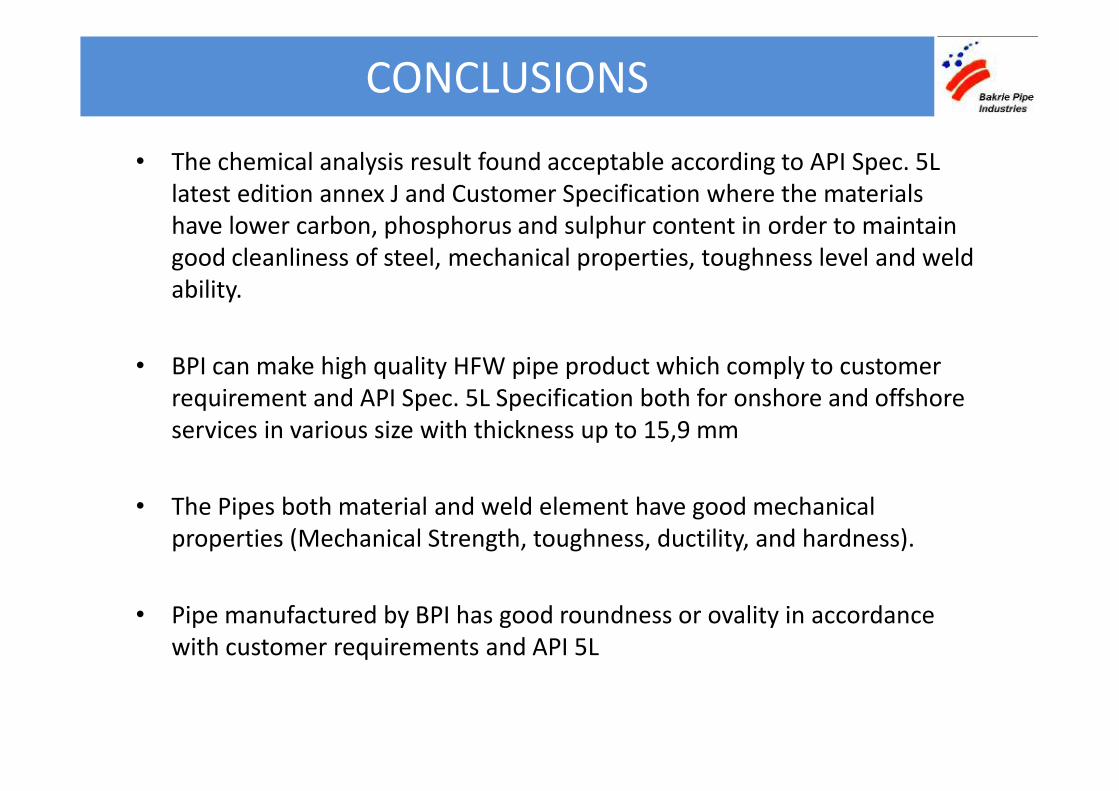
• The chemical analysis result found acceptable according to API Spec. 5L
latest edition annex J and Customer Specification where the materials
have lower carbon, phosphorus and sulphur content in order to maintain
good cleanliness of steel, mechanical properties, toughness level and weld
ability.
• BPI can make high quality HFW pipe product which comply to customer
requirement and API Spec. 5L Specification both for onshore and offshore
CONCLUSIONS
requirement and API Spec. 5L Specification both for onshore and offshore
services in various size with thickness up to 15,9 mm
• The Pipes both material and weld element have good mechanical
properties (Mechanical Strength, toughness, ductility, and hardness).
• Pipe manufactured by BPI has good roundness or ovality in accordance
with customer requirements and API 5L

• For Bukit Tua Development Project, one of pipe size that BPI produced is 323,9 mm x 15,9 mm x 12000 mm
• For Jambi Merang Development Project, one of size that BPI produced is Ø 406,4 mm x 15,9 mm x 12,000 mm and Ø 406,4 mm x 14,3 mm x 12000 mm
• BPI maintains its commitment by ensuring that the product is
CONCLUSIONS
• BPI maintains its commitment by ensuring that the product is delivered on schedule
• Pipes for Bukit Tua Development Project and Jambi MerangDevelopment Project were inspected and tested at PT. Bakrie Pipe Industries and found acceptable according to API Spec. 5L and Customer Specification.
TERIMA KASIH
MATUR NUWUN
THANK YOU
ARIGATOUARIGATOU
KAMSAHAMNIDA
GRACIAS
DANKE
MERCI