high-energy neutrino...
TRANSCRIPT

DOI 10.1393/ncr/i2010-10050-5
RIVISTA DEL NUOVO CIMENTO Vol. 32, N. 12 2009
High-energy neutrino astronomy
P. Sapienza and G. Riccobene
Laboratori Nazionali del Sud, Istituto Nazionale di Fisica NucleareVia S. Sofia 62, I-95123, Catania, Italy
(ricevuto il 2 Novembre 2009)
Summary. — The field of astroparticle physics entered in a flourishing periodthanks to the operation of several experiments that lead to the discovery and evenidentification of about hundred cosmic TeV gamma-ray sources and measurementof the Ultra-High-Energy Cosmic-Ray flux. At least few tens of the identified TeVgamma sources in the Galaxy are expected to be also high-energy neutrinos sources.Many other extragalactic sources, not seen in TeV gamma-rays, may also be high-energy neutrino emitters. Neutrinos, light and uncharged, are very promising probesfor high-energy astrophysics since they can reach the Earth from cosmic distancesand from astrophysical environments obscure to high-energy gammas and nuclei.Theoretical estimates indicate that a detection area of the order of a few km2 isrequired for the measurement of HE cosmic ν fluxes. The underwater/ice opti-cal Cerenkov technique is widely considered the most promising experimental ap-proach to build high-energy neutrino detectors in the TeV-PeV energy range. Af-ter the first generation of underwater/ice neutrino telescopes (Baikal, AMANDAand ANTARES), the quest for the construction of km2 size detectors have alreadystarted. At the South Pole the construction of the IceCube neutrino telescope isin an advanced stage, while the ANTARES, NEMO and NESTOR collaborationstogether with several other European Institutions take part to KM3NeT aiming atthe installation of a km3-scale neutrino telescope in the Mediterranean Sea. Alsolimits for UHE neutrino detection were strongly improved in the last few years, es-pecially with the recent results of ANITA and Auger. IceRay, a very large detectorbased on the radio-acoustic technique at the South Pole, has been proposed. IntenseR&D activities are also ongoing on thermo-acoustic techniques that could providea viable solution for UHE detection underwater. This paper reviews the status andperspectives of high-energy neutrino astronomy from an experimental point of view.
PACS 95.85.Ry – Neutrino, muon, pion, and other elementary particles; cosmicrays.PACS 98.70.Sa – Cosmic rays (including sources, origin, acceleration, and interac-tions).PACS 13.85.Tp – Cosmic-ray interactions.PACS 29.40.Ka – Cherenkov detectors.
c© Societa Italiana di Fisica 591
592 P. SAPIENZA and G. RICCOBENE
592 1. Introduction594 2. The cosmic-rays spectrum600 3. Cosmic gammas and neutrinos at E ≥TeV602 4. Candidate Galactic high-energy neutrino sources602 4
.1. Galactic Supernova Remnants
605 4.2. Galactic X-Ray Binaries and Microquasars
606 4.3. The Galactic Centre
607 5. Candidate Extragalactic high-energy neutrino sources608 5
.1. Active Galactic Nuclei
611 5.2. Gamma-Ray Burst
613 5.3. Starburst galaxies
613 5.4. Cosmogenic neutrinos
614 6. High-energy neutrino detection615 7. Underwater/ice Cerenkov technique620 7
.1. Sources of background
622 8. Status of neutrino telescope projects622 8
.1. Baikal
623 8.2. AMANDA
624 8.3. IceCube
627 8.4. NESTOR
629 8.5. ANTARES
630 8.6. NEMO
634 8.7. KM3NeT: towards a km3-scale detector in the Mediterranean Sea
636 9. Ultra-High-Energy neutrino detection636 9
.1. Askaryan radiation detection technique
637 9.1.1. Ice-based experiments
639 9.2. Moon radio Cerenkov observations
639 9.3. The thermo-acoustic technique
643 9.4. Neutrino extensive air shower detection
644 10. Conclusions
1. – Introduction
The understanding of the violent side of the Universe is a major challenge in astropar-ticle physics. Indeed observations of the diffuse photon flux at the Earth indicate thatthe energy content in X- and γ-rays, produced by violent phenomena, is comparable tothat associated low-energy phenomena. However the comprehension of the High-Energy(HE) Universe is very limited.
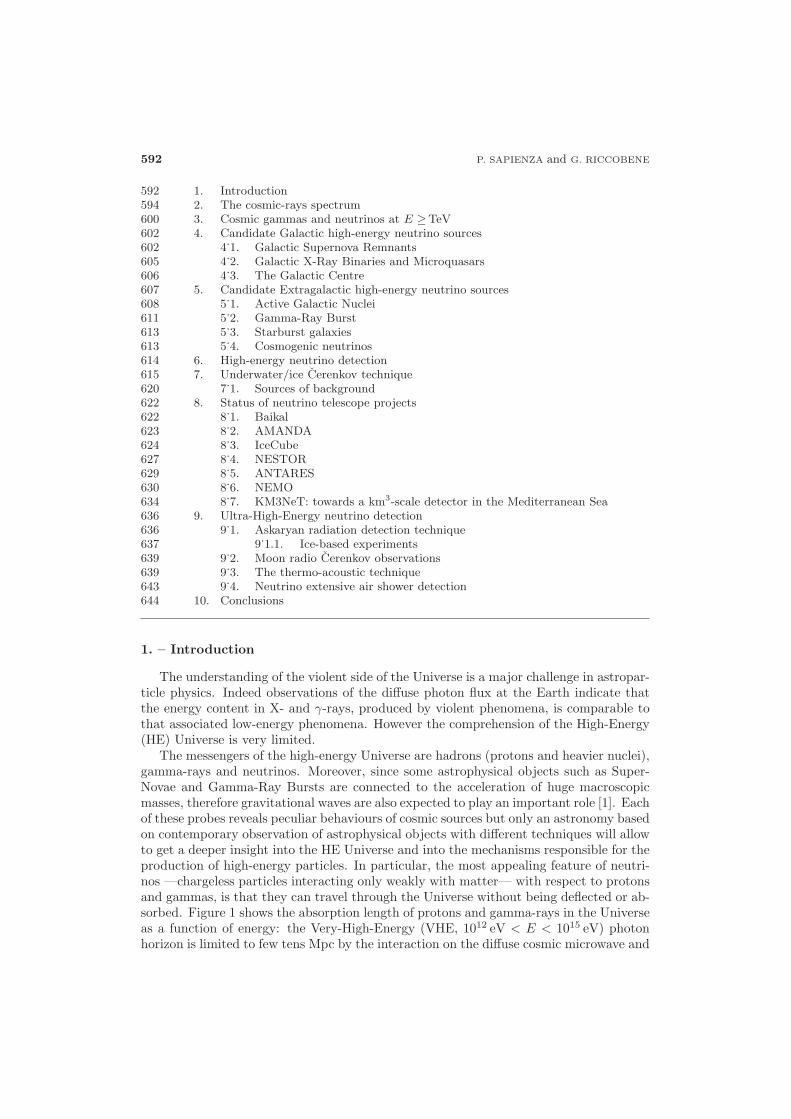
The messengers of the high-energy Universe are hadrons (protons and heavier nuclei),gamma-rays and neutrinos. Moreover, since some astrophysical objects such as Super-Novae and Gamma-Ray Bursts are connected to the acceleration of huge macroscopicmasses, therefore gravitational waves are also expected to play an important role [1]. Eachof these probes reveals peculiar behaviours of cosmic sources but only an astronomy basedon contemporary observation of astrophysical objects with different techniques will allowto get a deeper insight into the HE Universe and into the mechanisms responsible for theproduction of high-energy particles. In particular, the most appealing feature of neutri-nos —chargeless particles interacting only weakly with matter— with respect to protonsand gammas, is that they can travel through the Universe without being deflected or ab-sorbed. Figure 1 shows the absorption length of protons and gamma-rays in the Universeas a function of energy: the Very-High-Energy (VHE, 1012 eV < E < 1015 eV) photonhorizon is limited to few tens Mpc by the interaction on the diffuse cosmic microwave and
HIGH-ENERGY NEUTRINO ASTRONOMY 593
Fig. 1. – Absorption length of protons and gammas in the Universe as a function of particle en-ergy. The gray shaded areas indicate the region not accessible to proton and gamma astronomy.
infrared background; ultra-high-energy protons are absorbed within 100 Mpc by their in-teraction with the Cosmic Microwave Background Radiation (CMBR), named, after thescientists Greisen, Zatsepin and Kuzmin, GZK effect [2, 3].
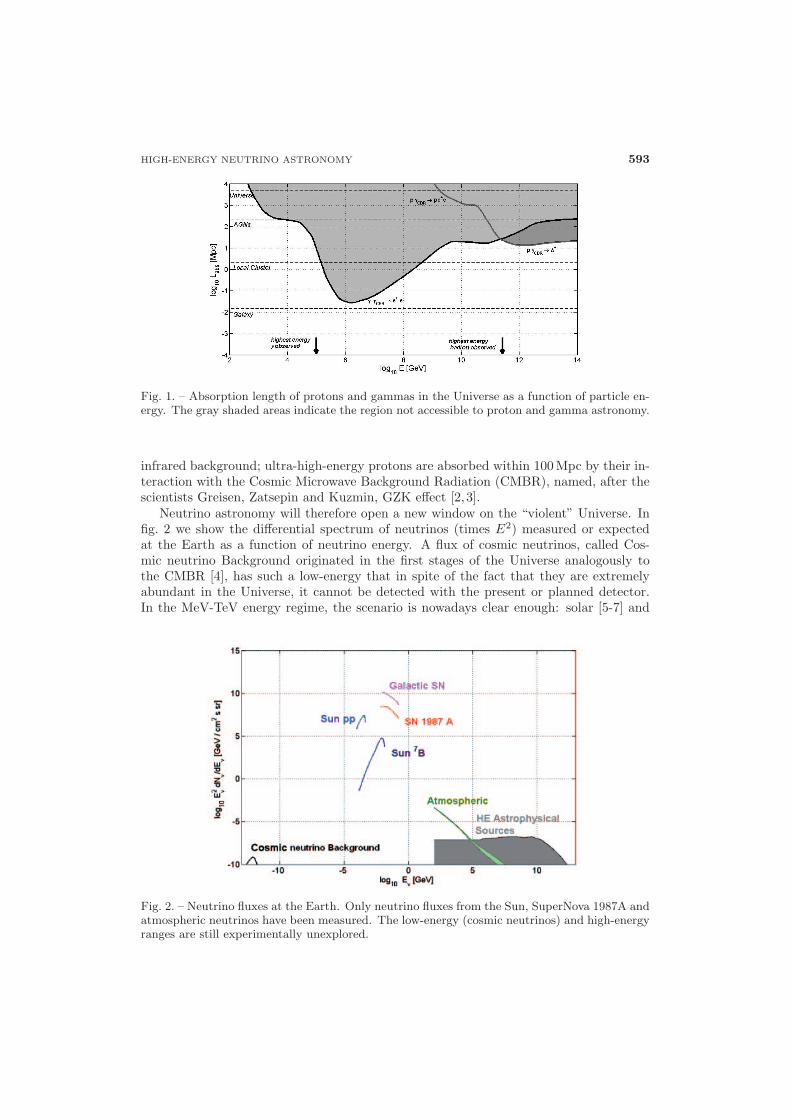
Neutrino astronomy will therefore open a new window on the “violent” Universe. Infig. 2 we show the differential spectrum of neutrinos (times E2) measured or expectedat the Earth as a function of neutrino energy. A flux of cosmic neutrinos, called Cos-mic neutrino Background originated in the first stages of the Universe analogously tothe CMBR [4], has such a low-energy that in spite of the fact that they are extremelyabundant in the Universe, it cannot be detected with the present or planned detector.In the MeV-TeV energy regime, the scenario is nowadays clear enough: solar [5-7] and
Fig. 2. – Neutrino fluxes at the Earth. Only neutrino fluxes from the Sun, SuperNova 1987A andatmospheric neutrinos have been measured. The low-energy (cosmic neutrinos) and high-energyranges are still experimentally unexplored.
594 P. SAPIENZA and G. RICCOBENE
atmospheric neutrino fluxes [8] are determined with good accuracy, uncertainty remainson SuperNova (SN) neutrinos, for which our knowledge relies only on about 20 νe eventsobserved in coincidence with the SN1987A explosion [9-11]. The detection of HE neutri-nos (Eν > 1 TeV) should allow to extend our knowledge to the far high-energy Universeand to probe the dense core of the most powerful cosmic accelerators. The price to pay isthat neutrinos are extremely difficult to detect and therefore the opening of high neutrinoastronomy requires huge detectors.
Theoretical expectations on high-energy neutrino fluxes vary a lot according to dif-ferent models, a large part of the uncertainties being due to the incomplete knowledgeof the astrophysical objects, therefore more robust estimates are obtained extrapolatingavailable experimental data.
In particular, estimates of the diffuse neutrino fluxes and of the so-called BZ(Berezinky-Zatsepin) neutrino flux at Ultra High Energies (UHE, E > 1015 eV) andExtremely High Energies (EHE, E > 1018 eV) —produced as a consequence of theGZK effect— can be obtained on the basis of the measured Cosmic Rays (CR) [12].On the other hand, in the hypothesis of hadronic processes and sources transparent tohigh-energy gamma-rays, neutrino fluxes from specific point-like sources can be derivedfrom the observed gamma TeV emission. Both kinds of observations indicate that massesof target media of the order of few GTon are needed, and up to hundreds of GTon for EHEneutrinos (Eν > 1018 eV). The use of natural media as ν target is therefore mandatoryto build such detectors with affordable budget.
In this review we trace the history, status and perspectives of high-energy neutrinoastronomy with emphasis on the experimental point of view. Moreover, we also sum-marize the main experimental evidence concerning CR and VHE gamma-rays that arerelevant for high-energy neutrino detection as well as the current understanding aboutthe most promising of the candidate high-energy neutrino sources.
2. – The cosmic-rays spectrum
Cosmic-rays (CR), whose first studies date back to the beginning of XX century [13,14]are still a puzzling subject for physicists. Up to date measurements show that CR fluxextends over 10 orders of magnitude in energy, up to 3 · 1020 eV, and over 28 orders ofmagnitude in flux, down to few particles per 100 km2 per century. The measured compo-sition of the bulk of CR is hadron dominated, with about 87% protons, 9% alpha-particlesand the rest shared among heavier nuclei, photons and electrons [15].
The low energy region of CR spectrum (ECR < GeV) is well explained by solar activ-ity; above a few GeV the CR energy spectrum follows a power law with spectral indexα � 2.7 as show in fig. 3 [16]. For clarity sake in fig. 3 we also show the CR spectrum mul-tiplied by E2.7, that reveals the presence of different trends with increasing energy. AtE < 1014.5 eV the CR spectral index is α � 2.7, between E � 1014.5 eV and E � 1017.5 eVthe spectral index becomes softer (α � 3), above E = 1018.5 the spectral index changesagain to α � 2.7. The two breaks in the energy spectrum are usually referred as kneeand ankle, respectively. Above E � 1019 eV, the CR flux measured at the Earth is aslow as 1 particle/(km2 year), and above 1020 eV the CR spectrum is suppressed.
In spite of the fact that CR spectrum has been measured with great accuracy up to1020 eV, a conclusive evidence of connection with sources is still missing. The arrivaldirection at the Earth of cosmic rays, mostly composed by protons and nuclei is, in fact,randomized by the Galactic (B � 3 μG) and intergalactic (B � nG) magnetic fields.The gyro-radius of a nucleus having charge Z and Energy E18 (that is expressed in units

HIGH-ENERGY NEUTRINO ASTRONOMY 595
Fig. 3. – Left: The measured cosmic-ray spectrum as a function of energy [15]. Right: The CRspectrum multiplied by E2.7; two main changes of the spectral index occur at E � 1014.5 eV(knee) and at E � 1014.5 eV (ankle), see text [16].
of 1018 eV) is
(1) Rgyro(E) = E/Z × BGalaxy � 400 · E18/Z[pc].
For a E � 1018 eV proton, Rgyro is comparable with the thickness of the Galactic-diskHalo (� 200 pc) and much smaller than the Galactic-disk radius (� 15 kpc). This impliesthat pinpointing of CR sources is possible only with protons having Ep > 1019 eV.
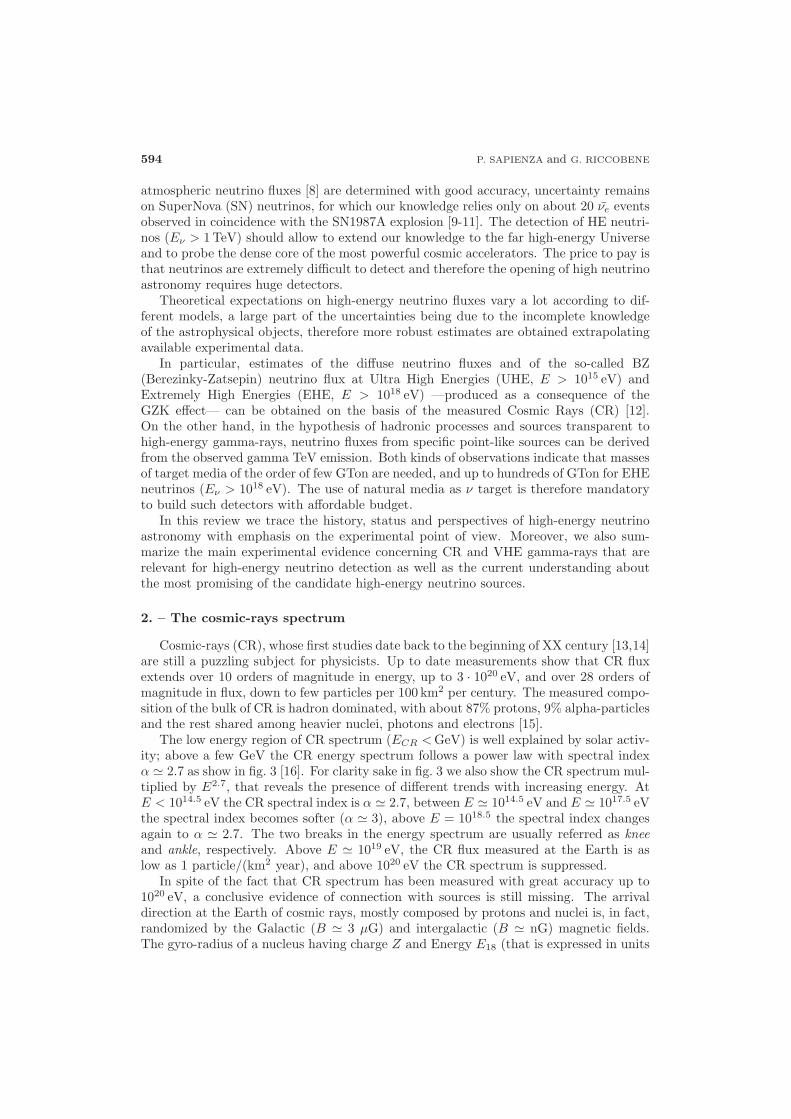
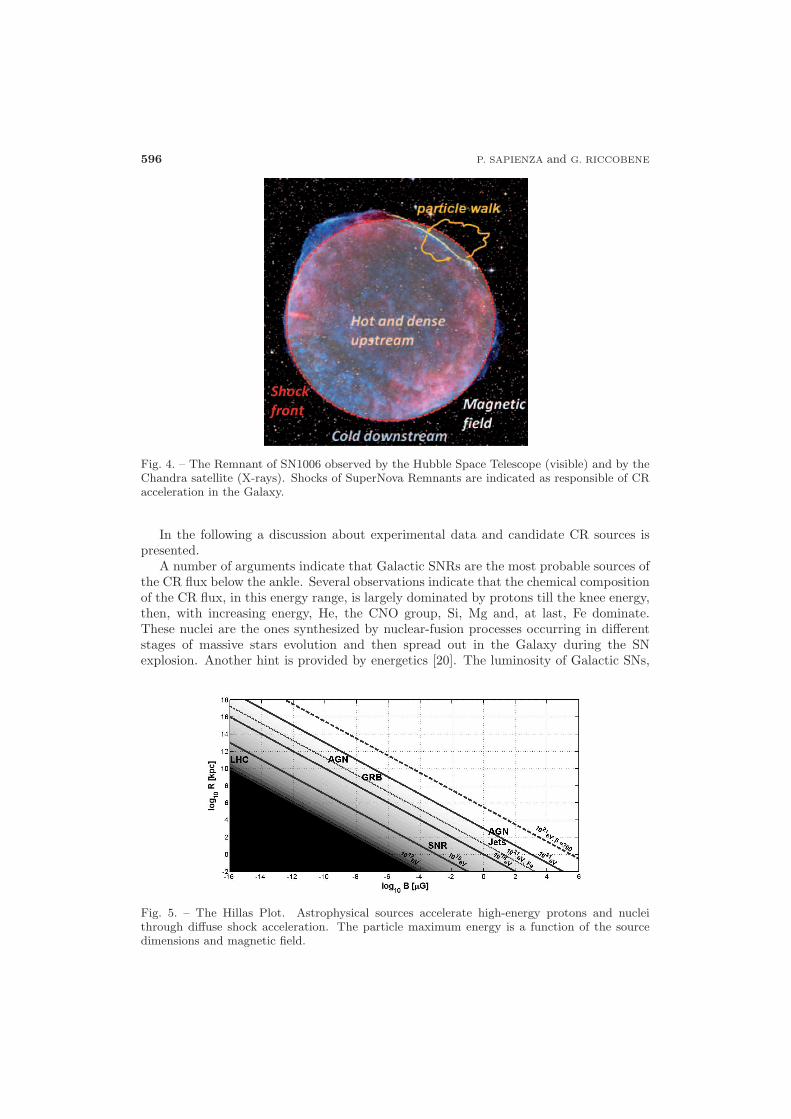
The bulk of CR spectrum is understood in terms of particles accelerated in astro-physical sources through the Fermi acceleration mechanism [17]. This mechanism (whosetheoretical description was revised in a more effective version by Bell [18]) takes place insources where a plasma of charged particles (e+e− or/and p+e−) is contained by strongmagnetic fields and is driven by strong shock waves. Charged particles gain energy,statistically, crossing the shock front from the downstream to the upstream region andviceversa, as shown in fig. 4. The expected spectrum of Fermi accelerated particles fol-lows an E−(2–2.2) power law and the maximum energy that a particle can reach is afunction of the confinement time within the shock. Since confinement is a function of theobject dimensions and strength of the magnetic field, Hillas [19] provided an useful ruleof thumb to estimate the maximum energy that a charged particle can reach in a shock:
(2) Emax ≈ βshock Z BμG Rkpc[eV],
where Z is the particle charge in units of e, βshock × c is the shock wave velocity, B andR are the source magnetic field and the source linear extension, respectively.
Several astrophysical environments were identified as possible candidates where theFermi acceleration mechanism can take place. Among all, SuperNova Remnants (SNR),Active Galactic Nuclei (AGN) and Gamma-Ray Burst (GRB) seem to play a major role.Figure 5 groups classes of astrophysical objects as a function of magnetic field B and sizeR. Only sources for which the product B × R is above the displayed lines (see eq. (2))can accelerate protons up to the corresponding energy.
596 P. SAPIENZA and G. RICCOBENE
Fig. 4. – The Remnant of SN1006 observed by the Hubble Space Telescope (visible) and by theChandra satellite (X-rays). Shocks of SuperNova Remnants are indicated as responsible of CRacceleration in the Galaxy.
In the following a discussion about experimental data and candidate CR sources ispresented.
A number of arguments indicate that Galactic SNRs are the most probable sources ofthe CR flux below the ankle. Several observations indicate that the chemical compositionof the CR flux, in this energy range, is largely dominated by protons till the knee energy,then, with increasing energy, He, the CNO group, Si, Mg and, at last, Fe dominate.These nuclei are the ones synthesized by nuclear-fusion processes occurring in differentstages of massive stars evolution and then spread out in the Galaxy during the SNexplosion. Another hint is provided by energetics [20]. The luminosity of Galactic SNs,
Fig. 5. – The Hillas Plot. Astrophysical sources accelerate high-energy protons and nucleithrough diffuse shock acceleration. The particle maximum energy is a function of the sourcedimensions and magnetic field.

HIGH-ENERGY NEUTRINO ASTRONOMY 597
604020
0
0 50 100 150 200 250 300 350R.A. (deg)
605040302010
0Dec
linat
ion
(deg
)
350 300 250 200 150 100 50 0Right Ascension (deg)
TIBET
MILAGRO
ARGO
IceCube
0°20° 40°0° 20°40°
Fig. 6. – Anisotropy in the Cosmic Ray arrival direction is now observed by (from top tobottom) Tibet, MILAGRO, ARGO and IceCube (muons). The color scale refers for the Tibetexperiment (2001–2005) to CR flux relative intensity (violet −3 · 10−3, red +2 · 10−3), for theother experiments color refers to statistical significance in units of standard deviations: TibetMILAGRO (7 years, blue: 5σ, red: 15σ), ARGO (424 days; blue: 7.6σ, red: 11.4σ), Icecube (22strings, 1 year; blue: −5σ, red: +5σ).
assuming an average energy release of 1051 erg per SN and an explosion rate of 1/30years, is LSN � 1042 erg/s. On the other hand, the integral power of observed CR,in the energy range between 1 GeV and 1016 eV, is PCR � 1040 erg/s. This value isconsistent with a fraction of few percent of LSN , in good agreement with the estimatedconversion efficiency of the Bell-Fermi model for SNR shocks. In this scenario protonsare accelerated to very high energies in SNR and their energy spectrum follows the Bell-Fermi � E−(2–2.1) distribution, times a factor τ(E) ∝ E−0.6 due to confinement time inthe Galaxy, in agreement with the observed α � 2.7 spectral index [21].
Nevertheless the question whether only SNRs shocks are responsible for a “local”acceleration of CR, or the statistical acceleration process takes place in a distributedway in the whole Galaxy or in active region such as superbubbles is still open [22].
As expected (eq. (1)), in this energy region, the sky-map of CR is isotropic due torandomization of charged particle arrival direction in the Galactic magnetic field. How-ever, recently, the MILAGRO experiment observed two with a fractional excess of about6 × 10−4 and 4 × 10⁻⁴, respectively, from the directions corresponding to δ = −20◦,70◦ < RA < 80◦ (named region A) and 30◦ < δ < 40◦, 130◦ < RA < 150◦ (named re-gion B) [23]. The Tibet [24] and ARGO [25] experiments also observed these anisotropyand more recently even the IceCube neutrino telescope [26] showed anisotropy of cosmic-muon arrival direction in the corresponding Southern Hemisphere regions (see fig. 6),
598 P. SAPIENZA and G. RICCOBENE
however a clear explanation of these observations is still missing. MILAGRO also ob-served a “hot spot” of E > 10 TeV gamma rays, in the direction of the Cygnus region,that could be explained by the presence of active cosmic ray sources accelerating hadronswhich interact with the local dense interstellar medium and produce gamma-rays throughpion decay [27].
Above the knee energy the total CR flux decreases and the composition increases inmetallicity as expected in the scenario of SNR acceleration: protons are not confined anymore in the Galaxy, and only nuclei with higher Z remains trapped in the Galaxy.
At E > 1018.5 eV (the ankle region) the CR spectrum features change again. Abovethis energy the CR flux similar to the pre-knee region: the spectral index is close to 2.7and the flux measured by AGASA [28] and HIRES [29, 30] experiments appears to beproton-dominated, though experimental data from the Pierre Auger Observatory (PAO,hereafter Auger) detector seem to favor a mixed composition [31]. Since the knownGalactic sources (SNR, Microquasars, Pulsar Wind Nebulae) cannot accelerate particlesto extremely high energies, as shown in eq. (2), the detection of cosmic protons withenergies up to E > 1019 eV suggests the presence of extragalactic accelerators. Accordingto eq. (2) there are only few classes of cosmic objects capable to accelerate protonsat E > EeV (1018 eV), among these Gamma-Ray Bursters (GRB) [32] and powerfulActive Galactic Nuclei (AGN) [33] are the most favorable candidates. These sources are,respectively, the most luminous bursting (LGRB � 1053 erg/s) and the most luminoussteady (LAGN � 1046 erg/s) objects in the Universe ever observed. Protons having E ≥1019.5 eV, likely accelerated in AGNs and GRBs, are considered good astrophysical probesbeing only slightly bent by cosmic magnetic fields. Experimental results concerning apossible correlation between UHE proton arrival directions and AGNs are, however,controversial.
Results published by the Auger collaboration in 2007 [34] indicated a correlationbetween the Veron Cetty Veron (VCV) AGN catalog [35] and the arrival direction dis-tribution of events with E ≥ 56 EeV, with φ = 3.1◦ and redshift zAGN
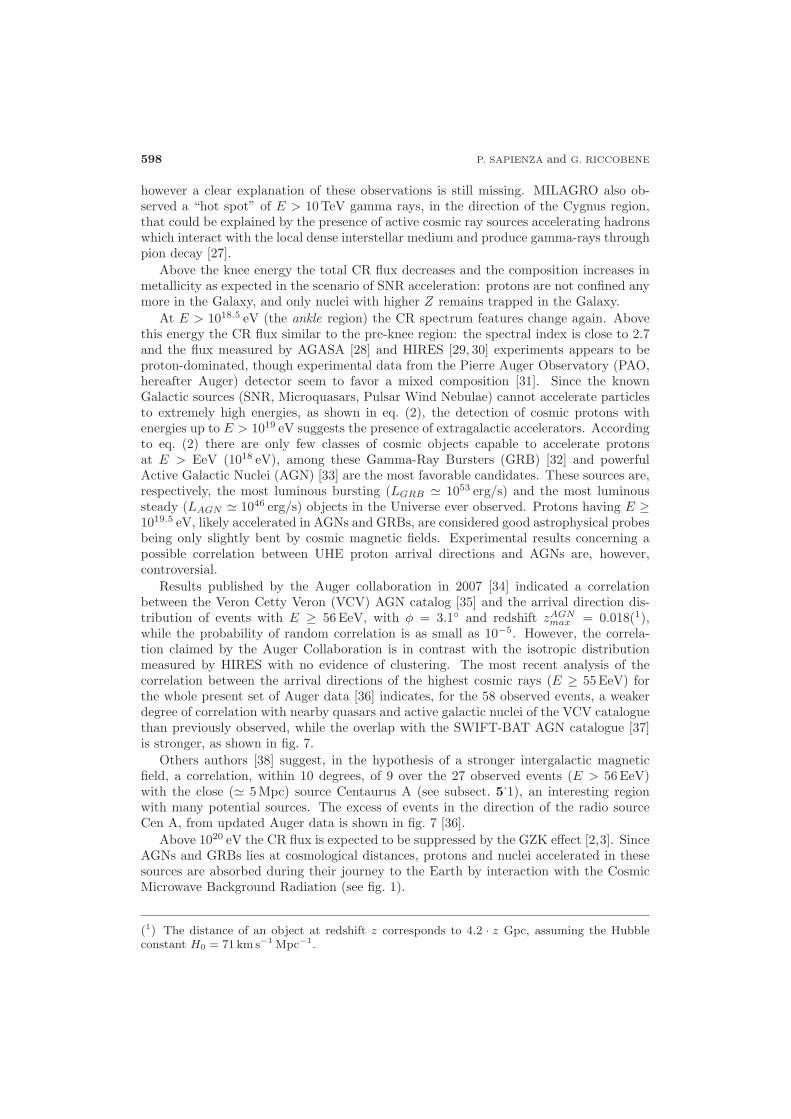
max = 0.018(1),while the probability of random correlation is as small as 10−5. However, the correla-tion claimed by the Auger Collaboration is in contrast with the isotropic distributionmeasured by HIRES with no evidence of clustering. The most recent analysis of thecorrelation between the arrival directions of the highest cosmic rays (E ≥ 55 EeV) forthe whole present set of Auger data [36] indicates, for the 58 observed events, a weakerdegree of correlation with nearby quasars and active galactic nuclei of the VCV cataloguethan previously observed, while the overlap with the SWIFT-BAT AGN catalogue [37]is stronger, as shown in fig. 7.
Others authors [38] suggest, in the hypothesis of a stronger intergalactic magneticfield, a correlation, within 10 degrees, of 9 over the 27 observed events (E > 56 EeV)with the close (� 5 Mpc) source Centaurus A (see subsect. 5.1), an interesting regionwith many potential sources. The excess of events in the direction of the radio sourceCen A, from updated Auger data is shown in fig. 7 [36].
Above 1020 eV the CR flux is expected to be suppressed by the GZK effect [2,3]. SinceAGNs and GRBs lies at cosmological distances, protons and nuclei accelerated in thesesources are absorbed during their journey to the Earth by interaction with the CosmicMicrowave Background Radiation (see fig. 1).
(1) The distance of an object at redshift z corresponds to 4.2 · z Gpc, assuming the Hubbleconstant H0 = 71 km s−1 Mpc−1.
HIGH-ENERGY NEUTRINO ASTRONOMY 599
Fig. 7. – Left: The sky map, in Galactic Coordinates, of Auger events up to March 2009. Theblack dots represent the 58 events with E > 5.5 ·1019 eV. Brownish areas represent the distribu-tion of AGN observed by the SWIFT-BAT satellite [37]. Right: Cumulative number of Augerevents with E > 56EeV as a funtion of distance from Cen A. The average isotropic expectationis also shown (white dotted line) together with 68% confidence level interval (blue area).
Since the cross-section of the proton photo-pion production p + γ → N + π is σpγ
is � 100 μbarn and the average CMBR density is nCMBR � 400 photons cm−3, theabsorption length of EHE protons in the Universe is roughly
(3) Lp,CMBR � (σpγ · nCMBR)−1 < 50Mpc,
well shorter than the distance between cosmological sources and the Earth.The observation of a suppression in the ultra-high-energy region of the CR energy
spectrum is confirmed both by HIRES [39] and Auger [40], while in AGASA data [28],now under revision, the suppression was not observed. However, the most recent analysisof the Auger data, including all the events collected up to March 2009, the interpretationof the Ultra —or Extremely— High Energy Cosmic Ray (UHECR, EHECR) spectrumin terms of GZK effect cannot be firmly established.
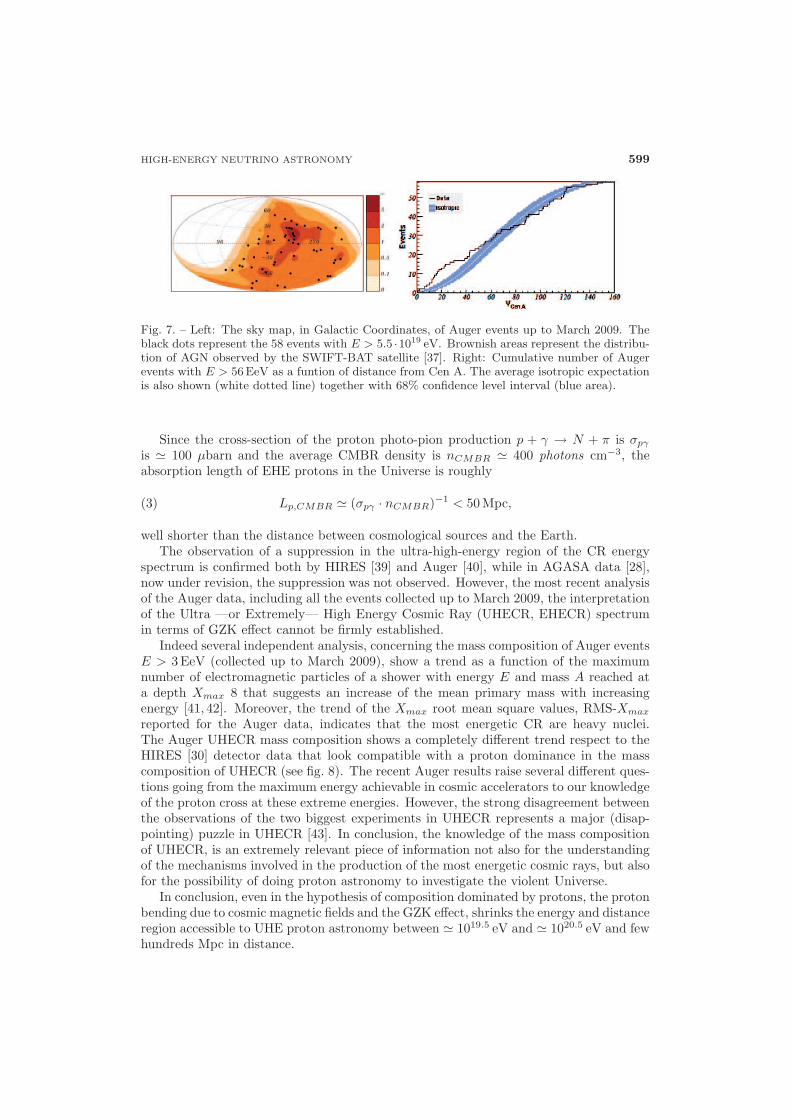
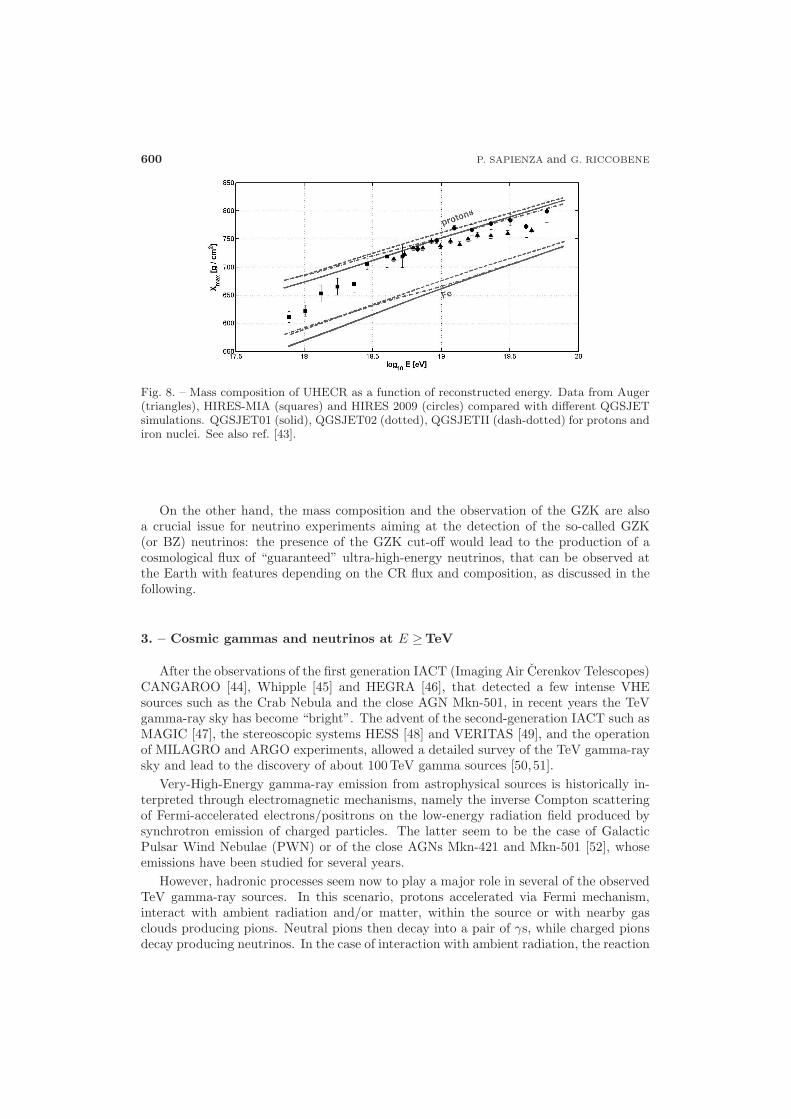
Indeed several independent analysis, concerning the mass composition of Auger eventsE > 3 EeV (collected up to March 2009), show a trend as a function of the maximumnumber of electromagnetic particles of a shower with energy E and mass A reached ata depth Xmax 8 that suggests an increase of the mean primary mass with increasingenergy [41, 42]. Moreover, the trend of the Xmax root mean square values, RMS-Xmax
reported for the Auger data, indicates that the most energetic CR are heavy nuclei.The Auger UHECR mass composition shows a completely different trend respect to theHIRES [30] detector data that look compatible with a proton dominance in the masscomposition of UHECR (see fig. 8). The recent Auger results raise several different ques-tions going from the maximum energy achievable in cosmic accelerators to our knowledgeof the proton cross at these extreme energies. However, the strong disagreement betweenthe observations of the two biggest experiments in UHECR represents a major (disap-pointing) puzzle in UHECR [43]. In conclusion, the knowledge of the mass compositionof UHECR, is an extremely relevant piece of information not also for the understandingof the mechanisms involved in the production of the most energetic cosmic rays, but alsofor the possibility of doing proton astronomy to investigate the violent Universe.
In conclusion, even in the hypothesis of composition dominated by protons, the protonbending due to cosmic magnetic fields and the GZK effect, shrinks the energy and distanceregion accessible to UHE proton astronomy between � 1019.5 eV and � 1020.5 eV and fewhundreds Mpc in distance.
600 P. SAPIENZA and G. RICCOBENE
Fig. 8. – Mass composition of UHECR as a function of reconstructed energy. Data from Auger(triangles), HIRES-MIA (squares) and HIRES 2009 (circles) compared with different QGSJETsimulations. QGSJET01 (solid), QGSJET02 (dotted), QGSJETII (dash-dotted) for protons andiron nuclei. See also ref. [43].
On the other hand, the mass composition and the observation of the GZK are alsoa crucial issue for neutrino experiments aiming at the detection of the so-called GZK(or BZ) neutrinos: the presence of the GZK cut-off would lead to the production of acosmological flux of “guaranteed” ultra-high-energy neutrinos, that can be observed atthe Earth with features depending on the CR flux and composition, as discussed in thefollowing.
3. – Cosmic gammas and neutrinos at E ≥TeV
After the observations of the first generation IACT (Imaging Air Cerenkov Telescopes)CANGAROO [44], Whipple [45] and HEGRA [46], that detected a few intense VHEsources such as the Crab Nebula and the close AGN Mkn-501, in recent years the TeVgamma-ray sky has become “bright”. The advent of the second-generation IACT such asMAGIC [47], the stereoscopic systems HESS [48] and VERITAS [49], and the operationof MILAGRO and ARGO experiments, allowed a detailed survey of the TeV gamma-raysky and lead to the discovery of about 100 TeV gamma sources [50,51].
Very-High-Energy gamma-ray emission from astrophysical sources is historically in-terpreted through electromagnetic mechanisms, namely the inverse Compton scatteringof Fermi-accelerated electrons/positrons on the low-energy radiation field produced bysynchrotron emission of charged particles. The latter seem to be the case of GalacticPulsar Wind Nebulae (PWN) or of the close AGNs Mkn-421 and Mkn-501 [52], whoseemissions have been studied for several years.
However, hadronic processes seem now to play a major role in several of the observedTeV gamma-ray sources. In this scenario, protons accelerated via Fermi mechanism,interact with ambient radiation and/or matter, within the source or with nearby gasclouds producing pions. Neutral pions then decay into a pair of γs, while charged pionsdecay producing neutrinos. In the case of interaction with ambient radiation, the reaction

HIGH-ENERGY NEUTRINO ASTRONOMY 601
Fig. 9. – Left: Contour map of gamma-rays counts from SNR RXJ1713.7-394 detected by HESS(threshold Eγ = 800 GeV), the solid lines indicates the X-ray surface brightness as seen by ASCAand ROSAT in the 1–3 keV range. Centre: Average spectral index of photons as a function ofenergy. Right: The HESS observation suggests a scenario in which CRs are accelerated inSNR and subsequently interact in the superposition region between SNR shells and a close-byMolecular Cloud [48].
chain is the following:
(4)
π0 → γ + γ�
p + γ → N+ π
�
π± → νμ + μ�
μ → e + νμ + νe.
Roughly speaking the threshold of the pγ → Nπ reaction is Ep � 300 MeV in thecenter-of-mass reference frame, assuming the main contribution due to the Δ+ resonantchannel, and the pion carries about 20% of the proton energy.
The expected “hadronic” gamma flux (produced in the π0 → γγ channel) thereforefollows a E−2 power law, as the primary Fermi proton flux, within the energy regionconstrained, at low energy by the Δ+-resonance threshold and, at high energy, by Ep
max
achievable in the cosmic accelerator. Similarly a muon neutrino flux is produced, with aspectrum E−2
ν and average energy Eν � 5%Ep. If the muon cooling time in the source islarger than the muon decay time, high-energy electron neutrinos are also produced witha production ratio of 2:1 (see eq. (4)). Taking into account neutrino flavor oscillationsduring the source-Earth journey, equipartition between the three leptonic flavors Nνμ
:Nνe
: Nντ= 1 : 1 : 1 is expected at the Earth.
The observation by the HESS telescope of TeV gamma rays emitted by the ROSATand ASCA X-Ray source RXJ1713.7-3946 [48], indicated, for the first time, featuressuggesting the presence of proton Fermi acceleration. In fig. 9 the gamma-spectrum ofthe source, measured by HESS is reported. The measured spectral index α � 2.1 andthe morphology of the source favorably indicate a scenario of Fermi-accelerated protonsinteracting on a dense molecular cloud in the NW region close to the source.
For this source another interesting piece of information could be provided by theFERMI satellite [53] data that will observe gamma-rays in the energy region between 1and a few tens of GeV. As shown in fig. 9, the forthcoming observations will probe aregion where hadronic and leptonic emission are expected to produce different gamma
602 P. SAPIENZA and G. RICCOBENE
spectra putting perspectives to discriminate between these two mechanisms on a firmground and consolidating the neutrino flux expectations.
Another class of promising hadronic sources is formed by the TeV gamma sources thathave no counterpart in other wavelengths, for this reason, called “Dark Accelerators”.The number of these sources is, to date, about 20 [54]. However, also for these sources,purely electromagnetic processes cannot be definitively ruled out [55] and only the de-tection of high-energy neutrinos will provide the ultimate “smoking gun” to demonstratethe occurrence of hadron acceleration processes.
Moreover the horizon of Eγ ≥ 10 TeV gamma-rays is about 100 Mpc, this limits VHEgamma telescopes to the observation of the Galaxy and of the close Universe (see fig. 1).The observation of astrophysical neutrinos will, therefore, open a window on the farhigh-energy Universe, where AGN and GRB emissions are expected to play a major role.
As discussed above, the scenario in which astrophysical sources are the accelera-tors of the observed hadronic cosmic rays, is nowadays strongly supported by severalTeV gamma-ray observations. In the following we will describe the astrophysical envi-ronments proposed as sites for cosmic-ray acceleration, VHE gamma-rays and neutrinoproduction. The sources presented in the following are candidates for HE neutrino pro-duction and, some of them, are expected to produce ν fluxes high enough to be detectedby a km3-scale detector. For clarity’s sake we will deal with Galactic and Extragalacticsources separately.
The first one are less luminous and less powerful, but thanks to their proximity toEarth, they could generate neutrino fluxes that can be observed as point-like sources.Moreover, in the hypothesis of hadronic emissions, the detected TeV gamma fluxes,provide a rather reliable estimate of the high-energy neutrino fluxes.
Extragalactic sources are expected to produce neutrino fluxes extending up to UltraHigh Energies, that will emerge above the atmospheric diffuse flux. The most luminousones are also candidate for point-like observation.
4. – Candidate Galactic high-energy neutrino sources
The operation of HESS [56], MAGIC [57] and the other γ TeV telescopes disclosed thevery-high-energy gamma-ray sky, revealing a large number of TeV sources. Due both togamma-ray absorption in the Universe and closeness to the Earth, a large part of thesesources are harbored in the Milky Way [58] (see fig. 10).
Galactic TeV gamma-ray sources are mainly associated with SNR and X-Ray Binariesand with their jetty subclasses: Pulsar Wind Nebulae (PWN), that were found to be thedominant species γ TeV emitters in our Galaxy, and microquasars [50]. In particularSNR and microquasars show peculiar TeV gamma emission that suggests interaction ofaccelerated protons on dense media or local radiation field, that could also produce TeVneutrino fluxes [59].
4.1. Galactic Supernova Remnants . – The gas of SNRs is a large reservoir of kineticenergy where diffusive shock waves is supposed to accelerate protons and electrons.
Electron acceleration up to tens of TeV is demonstrated by the observation of X-raysand gamma-rays from SNR associated to Pulsar Wind Nebulae [60]. The CRAB Nebula,Kookaburra, G21.5-0.9, MSH15-5 2 and HESS J1825-137 [61] are only few, known exam-ples. In these sources the rotational energy of the spinning-down neutron star (pulsar),that emerges from the SN explosion, is converted into a pulsar wind: a relativistic plasmaof electrons and positrons. The pulsar wind terminates in a shock when it encounters

HIGH-ENERGY NEUTRINO ASTRONOMY 603
Fig. 10. – Distribution of TeV gamma-rays in the Galactic-plane region observed by HESS,Galactic-plane survey 2008 [58].
the ambient medium, e.g. the SN ejecta. Within this magnetised environment, e+ ande− emit both synchrotron X-rays and TeV energy gamma-rays, by up-scattering (inverseCompton scattering) on ambient photons, e.g. microwave background [62].
On the other hand, a direct evidence of efficient proton acceleration is still missing.A breakthrough discovery was the detection of narrow and bright X-ray filaments insome SNR shells, associated to very high energy electrons entering an intense magneticfield environment (up to few mG) [63]. Such large magnetic fields are suggested to bethe result of charged particle streaming from upstream to downstream in shocked SNRejecta (or in the interstellar medium, during the Sedov phase of the shock). In thisconditions electrons are quickly cooled down due to synchrotron emission — thus theVHE gamma flux from inverse Compton is strongly suppressed — while protons areefficiently accelerated to energies > 1 PeV. The expected proton flux follows a power lawspectrum with α = 2.0–2.2 and a cutoff energy Ec � 1014–1018 eV, which depends onthe age of the SNR [64]. Another interesting piece of information was recently providedby Helder et al. [65], who determined that, in SNR RCW86, a high cosmic-ray pressuremust be considered to explain the X-ray emission from the NE part rims of the source.
The interaction of Fermi protons with matter target of the SNR shells leads to theproduction of pions and therefore to VHE gamma and neutrinos as previously discussed.
The detection of gamma rays up to Eγ � 100 TeV from SNR RXJ1713.7-3946 [48]and other similar sources, such as Vela Jr (RXJ0852.0-4622) [66], showing power lawgamma-ray spectra with α � 2–2.2 provides therefore a strong indication of SNRs as CRsources.
Going deeper in details, present data suggest that the SNR gas environment is typ-ically transparent to CR, being the matter density n of SNR shells too small for effi-cient proton-proton interaction (n � 1 particle/cm3). The production of pion-inducedgamma-rays is therefore inefficient. On the other hand, the presence of massive Molecular

604 P. SAPIENZA and G. RICCOBENE
Clouds (MMC > 102M�) close to the SNR provides a much denser target for interactionof the Fermi-accelerated protons, being the matter density in these environments � 100particles/cm3. Molecular Clouds can be kept by the SNR wind during its expansion, asin the case of RX J1713.7-3946, or “illuminated” by the CR stream accelerated within anearby SNR [67]. This latter, seem to be the case of the so called “Dark Accelerators”or “Unidentified Sources” detected by TeV gamma-ray telescopes without, or with veryfaint, counterpart in other photon wavelengths.
Several observations of TeV gamma-rays sources are now associated to galactic SNRexpanding close to Molecular Clouds, identified looking at their H2, CO or OH maseremissions. Typical cases are SNR W28, W51C [54,68], CTB37A and CTB37B [69]. It isnot yet possible, however, to exclude that, at least part of, the observed TeV gamma radi-ation is produced by electromagnetic processes. The ultimate proof that SNRs effectivelyaccelerate CR will be obtained by the observation of high-energy neutrinos.
Using a phenomenological approach Vissani, Villante and Costantini [70, 71] deter-mined the CR flux accelerated by SNR, required to produce the observed TeV gamma-rayflux in the hadronic scenario. In this approach the interactions of cosmic-ray protonswith a hydrogen ambient cloud result in the production of mesons which subsequentlydecay producing gamma-rays (from the decay of π0 and η) and neutrinos (from the decayof charged π and K). Since, both gamma-ray and neutrino fluxes depend linearly on theflux of the primary cosmic-rays, there is a linear relation between photon and neutrinofluxes and one only need to know the relative number of pions, kaons and η’s producedby cosmic-ray interactions on the target cloud at any given energy. Taking also intoaccount the effect of neutrino oscillations from the production site to the Earth the au-thors calculated an upper bound for the muon neutrino and anti-neutrino flux reachingthe Earth from the SNR RXJ1713.7-3946, shown in fig. 11.
Fig. 11. – TeV neutrino (νμ + νμ) fluxes expected from RXJ1713.7-3946 calculated by Vissaniet al. (solid line) [71] and Amato et al. [72] (light gray dash-dotted line). The HESS data, fromcombined 2003, 2004 and 2005 source observations (black squares), are shown for comparisontogether with the hadronic-origin TeV gamma-ray flux calculated by Amato et al. (dark graydash-dotted line) [72] and Berezkho et al. (dotted line) [73, 74] is also shown. The solid linesdelimiting the shaded area represent the expected atmospheric neutrino background for a 0.5◦
bin and 1◦ neutrino search bin respectively.
HIGH-ENERGY NEUTRINO ASTRONOMY 605
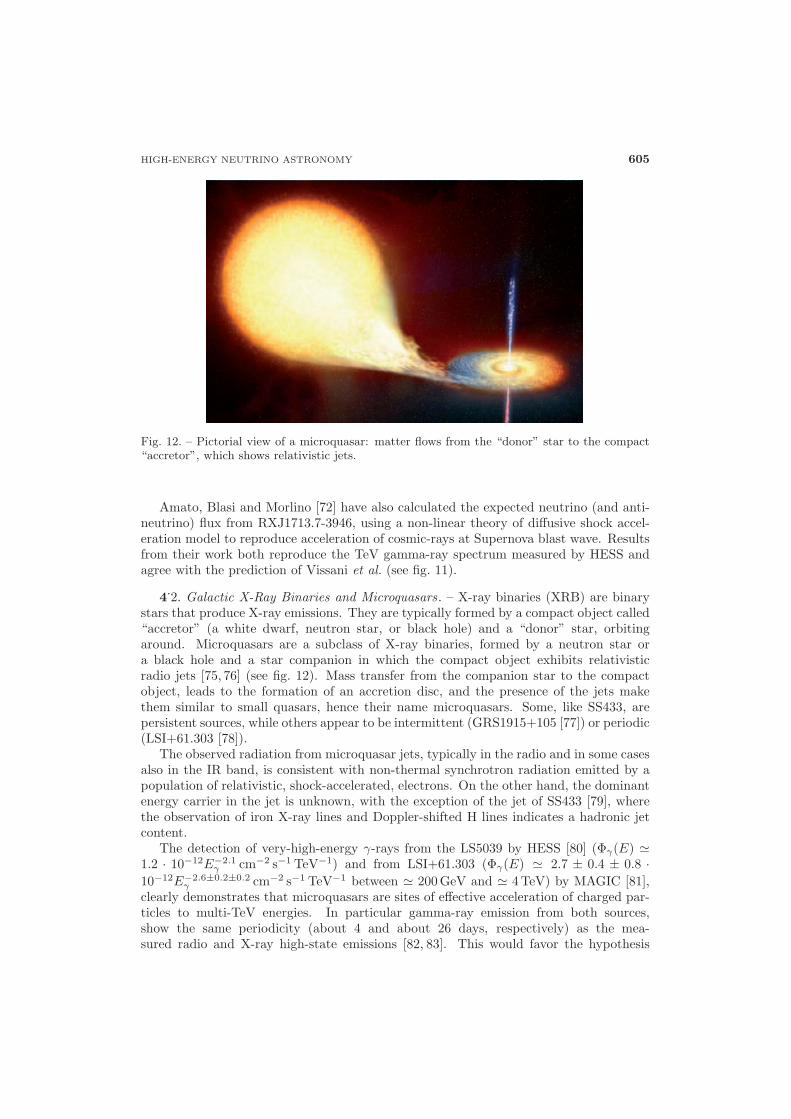
Fig. 12. – Pictorial view of a microquasar: matter flows from the “donor” star to the compact“accretor”, which shows relativistic jets.
Amato, Blasi and Morlino [72] have also calculated the expected neutrino (and anti-neutrino) flux from RXJ1713.7-3946, using a non-linear theory of diffusive shock accel-eration model to reproduce acceleration of cosmic-rays at Supernova blast wave. Resultsfrom their work both reproduce the TeV gamma-ray spectrum measured by HESS andagree with the prediction of Vissani et al. (see fig. 11).
4.2. Galactic X-Ray Binaries and Microquasars. – X-ray binaries (XRB) are binarystars that produce X-ray emissions. They are typically formed by a compact object called“accretor” (a white dwarf, neutron star, or black hole) and a “donor” star, orbitingaround. Microquasars are a subclass of X-ray binaries, formed by a neutron star ora black hole and a star companion in which the compact object exhibits relativisticradio jets [75, 76] (see fig. 12). Mass transfer from the companion star to the compactobject, leads to the formation of an accretion disc, and the presence of the jets makethem similar to small quasars, hence their name microquasars. Some, like SS433, arepersistent sources, while others appear to be intermittent (GRS1915+105 [77]) or periodic(LSI+61.303 [78]).
The observed radiation from microquasar jets, typically in the radio and in some casesalso in the IR band, is consistent with non-thermal synchrotron radiation emitted by apopulation of relativistic, shock-accelerated, electrons. On the other hand, the dominantenergy carrier in the jet is unknown, with the exception of the jet of SS433 [79], wherethe observation of iron X-ray lines and Doppler-shifted H lines indicates a hadronic jetcontent.
The detection of very-high-energy γ-rays from the LS5039 by HESS [80] (Φγ(E) �1.2 · 10−12E−2.1
γ cm−2 s−1 TeV−1) and from LSI+61.303 (Φγ(E) � 2.7 ± 0.4 ± 0.8 ·10−12E−2.6±0.2±0.2
γ cm−2 s−1 TeV−1 between � 200 GeV and � 4 TeV) by MAGIC [81],clearly demonstrates that microquasars are sites of effective acceleration of charged par-ticles to multi-TeV energies. In particular gamma-ray emission from both sources,show the same periodicity (about 4 and about 26 days, respectively) as the mea-sured radio and X-ray high-state emissions [82, 83]. This would favor the hypothesis
606 P. SAPIENZA and G. RICCOBENE
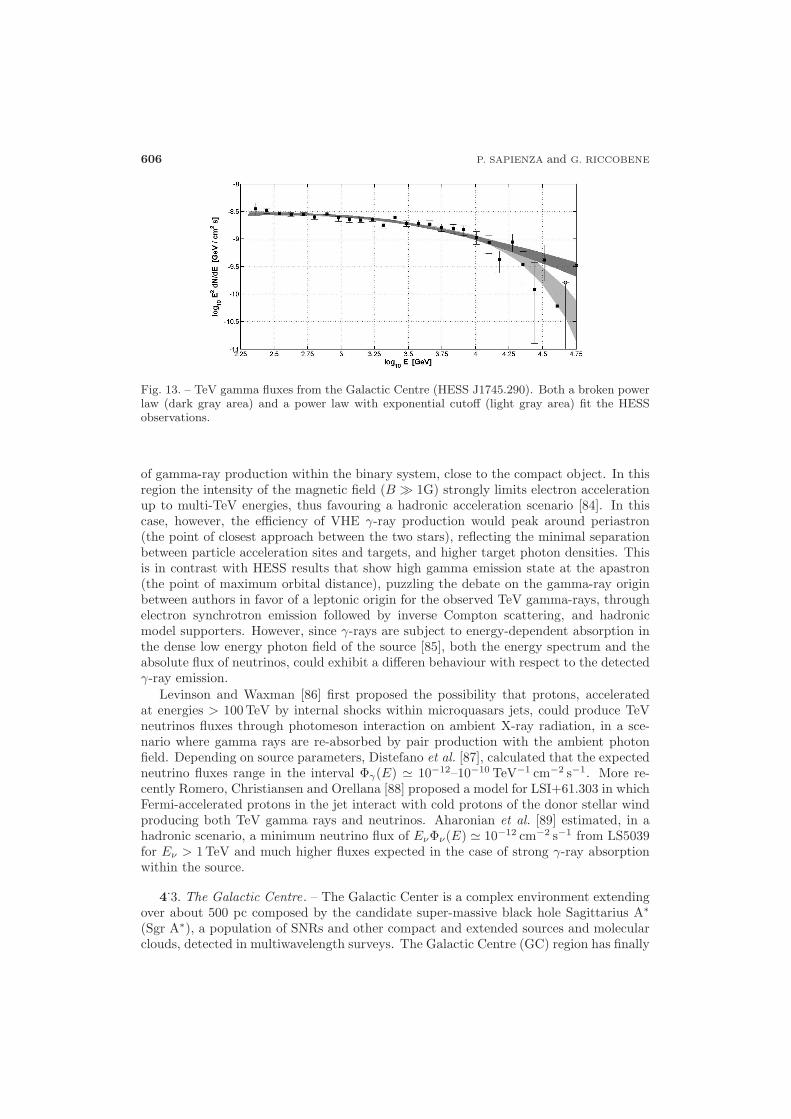
Fig. 13. – TeV gamma fluxes from the Galactic Centre (HESS J1745.290). Both a broken powerlaw (dark gray area) and a power law with exponential cutoff (light gray area) fit the HESSobservations.
of gamma-ray production within the binary system, close to the compact object. In thisregion the intensity of the magnetic field (B � 1G) strongly limits electron accelerationup to multi-TeV energies, thus favouring a hadronic acceleration scenario [84]. In thiscase, however, the efficiency of VHE γ-ray production would peak around periastron(the point of closest approach between the two stars), reflecting the minimal separationbetween particle acceleration sites and targets, and higher target photon densities. Thisis in contrast with HESS results that show high gamma emission state at the apastron(the point of maximum orbital distance), puzzling the debate on the gamma-ray originbetween authors in favor of a leptonic origin for the observed TeV gamma-rays, throughelectron synchrotron emission followed by inverse Compton scattering, and hadronicmodel supporters. However, since γ-rays are subject to energy-dependent absorption inthe dense low energy photon field of the source [85], both the energy spectrum and theabsolute flux of neutrinos, could exhibit a differen behaviour with respect to the detectedγ-ray emission.
Levinson and Waxman [86] first proposed the possibility that protons, acceleratedat energies > 100 TeV by internal shocks within microquasars jets, could produce TeVneutrinos fluxes through photomeson interaction on ambient X-ray radiation, in a sce-nario where gamma rays are re-absorbed by pair production with the ambient photonfield. Depending on source parameters, Distefano et al. [87], calculated that the expectedneutrino fluxes range in the interval Φγ(E) � 10−12–10−10 TeV−1 cm−2 s−1. More re-cently Romero, Christiansen and Orellana [88] proposed a model for LSI+61.303 in whichFermi-accelerated protons in the jet interact with cold protons of the donor stellar windproducing both TeV gamma rays and neutrinos. Aharonian et al. [89] estimated, in ahadronic scenario, a minimum neutrino flux of EνΦν(E) � 10−12 cm−2 s−1 from LS5039for Eν > 1 TeV and much higher fluxes expected in the case of strong γ-ray absorptionwithin the source.
4.3. The Galactic Centre. – The Galactic Center is a complex environment extendingover about 500 pc composed by the candidate super-massive black hole Sagittarius A∗
(Sgr A∗), a population of SNRs and other compact and extended sources and molecularclouds, detected in multiwavelength surveys. The Galactic Centre (GC) region has finally
HIGH-ENERGY NEUTRINO ASTRONOMY 607
been identified also as an intense source of TeV gamma-rays by HESS [90], Whipple [91],CANGAROO [92] and MAGIC [93]. In particular, the recent results of HESS observa-tions of the Galactic Centre region, shown in fig. 13, are compatible with both a powerlaw spectrum with an exponential cut-off and a with broken power law spectrum [94].The power law spectrum with an exponential cut-off is characterized by a photon indexα = 2.10 ± 0.04stat ± 0.10syst and a cut-off energy at Ec = 15.7 ± 3.4stat ± 2.5syst TeV.The broken power law spectrum exhibits spectral indices of α1 = 2.02±0.08stat±0.10syst
and α2 = 2.63±0.14stat ±0.10syst with a break energy at Ec = 2.57±0.19stat ±0.44syst.Investigation of possible Quasi Periodic Oscillation activity at periods claimed to bedetected in X-rays does not show any periodicity in the HESS signal [95].
Different mechanisms have been suggested to explain the broadband spectrum of theGalactic Centre [96]. Possible associations of the gamma-ray source with the Sgr A Eastsupernova remnant [97] and with the newly detected PWN G359.95-0.04 [98] have beenwidely discussed in the literature. However, with the reduced systematic pointing errorobtained using HESS data up to 2006 [95], Sgr A East is now ruled out to be associatedwith the VHE emission of HESS J1745.290. The interpretation of the GC TeV signalas annihilation products of dark matter (DM) particles has been discussed in Aharonianet al. [99]. The authors find that not more than 10% of the measured gamma flux atE > TeV can be attributed to DM annihilations.
Another possibility is that the supermassive black hole Sgr A∗ located at the centerof the Milky Way is responsible for the VHE emission of the detected HESS J1745.290source. Stochastic acceleration of electrons and protons may take place in the turbulentmagnetic field in the vicinity of Sgr A∗ [100,101]. These models are able to reproduce theradio, IR and X-ray flaring [102,103]. In addition, they assume that charged particles areaccreted onto the black hole, and predicts that a significant fraction of the protons do es-cape the neighborhood of Sgr A∗ without undergoing a pp collision. Protons presumablydiffuse to much larger distances where they can interact with other molecular materialproducing π0-mesons, possibly accounting for the observed Galactic ridge emission. Thiswould result in a neutrino flux of the same order of magnitude of the observed gamma flux.
5. – Candidate Extragalactic high-energy neutrino sources
One of the most interesting features of the CR energy spectrum (fig. 3), is the observa-tion of UHECR above the ankle, that calls for the presence of very powerful extragalacticcosmic accelerators. In this section we will summarize the most relevant astrophysicalobservations concerning Extragalactic sources with special emphasis on Active GalacticNuclei and Gamma-Ray Burst. We will also present the current status of expectationsfor the related high-energy neutrino fluxes and expectations for the GZK neutrino fluxes.
Unlike Galactic γ-ray sources, for which the VHE gamma detection —in the hy-pothesis of hadronic emission mechanisms— provides a rather good estimate of boththe expected neutrino flux and its spectral index, the situation is more complex in thecase of extragalactic sources. Indeed, the interaction with the Extragalactic BackgroundLight (EBL), that consists of the sum of the starlight emitted by by galaxies through thewhole history of the Universe [104], makes VHE γ spectra measured at the Earth muchsteeper than γ spectra at the source. Moreover, although evidences about the amount ofEBL are not conclusive [105] the absorption effect does not allow the exploration of thenon-thermal Universe via VHE gamma-rays at distances larger than about 100 Mpc, asalready shown in fig. 1.
608 P. SAPIENZA and G. RICCOBENE
Neutrino flux estimates from extragalactic sources are therefore very uncertain andrely mostly on theoretical models (for a recent review see [106]).
Starting from the hypothesis that AGNs and GRBs are the dominant sources of CRobserved in the energy range 1019 eV–1021 eV, and that the observed particles are protons,Waxman and Bahcall [107] set a upper bound (the so-called Waxman & Bachall limit)for the high-energy neutrino diffuse flux, that can be detected at the Earth. Their limit,obtained assuming that the energy density injection rate of CR, in the mentioned energyregion, is � 1044.5 erg Mpc−3year−1 and that the AGN and GRB proton spectrum atthe source follows a E−2 power law, is
(5) E2νΦν � c
4π
fπ
4E2
p
(dNp
dEpdt
)tHubble � 10−7.5[GeV cm−2 s−1 sr−1].
Equation (5) set a “reference” value for the expected neutrino fluxes and set thedimensions of high-energy neutrino telescopes to a km3-scale, as we will discuss in nextsections. However this limit is, as mentioned, strongly related to the composition of themeasured CR above 1019, that, as discussed in sect. 2, appears very uncertain on thebasis of the Auger data analysis of the data set 2004-2009.
Astrophysical objects that do not contribute to CR spectrum at Ultra High Energiesare not constrained by the WB limit. Among these, galactic sources such as SuperNovaRemnants and microquasars and “optically thick” sources (for which the optical depth isτpγ ≡ Rsource · (σpγnγ) � 1) nucleons interact while neutrinos can escape giving rise toa neutrino flux not constrained by eq. (5). This limit does not apply also to a differentkind of processes, known as top-down, which foresee the production of high energy CR,gammas and neutrinos by the decay or annihilation of particles with mass MX > 1021 eV,relics of the primordial Universe such as: Topological Defects or GUT-scale mass WIMPS(Weakly Interactive Massive Particles)(2).
A more detailed discussion on the most promising Extragalactic neutrino candidatesources is presented in the following.
5.1. Active Galactic Nuclei . – Active Galactic Nuclei (AGN), the most luminouspersistent objects observed in the sky, are galaxies whose electromagnetic radiation hasluminosity of the order of 1046 erg/s.
The standard scenario for AGNs assumes the presence of a very massive central blackhole (106–108M� ) swallowing huge quantities of surrounding matter from an accretiondisk and two relativistic jets where particles are accelerated up to the highest energy.
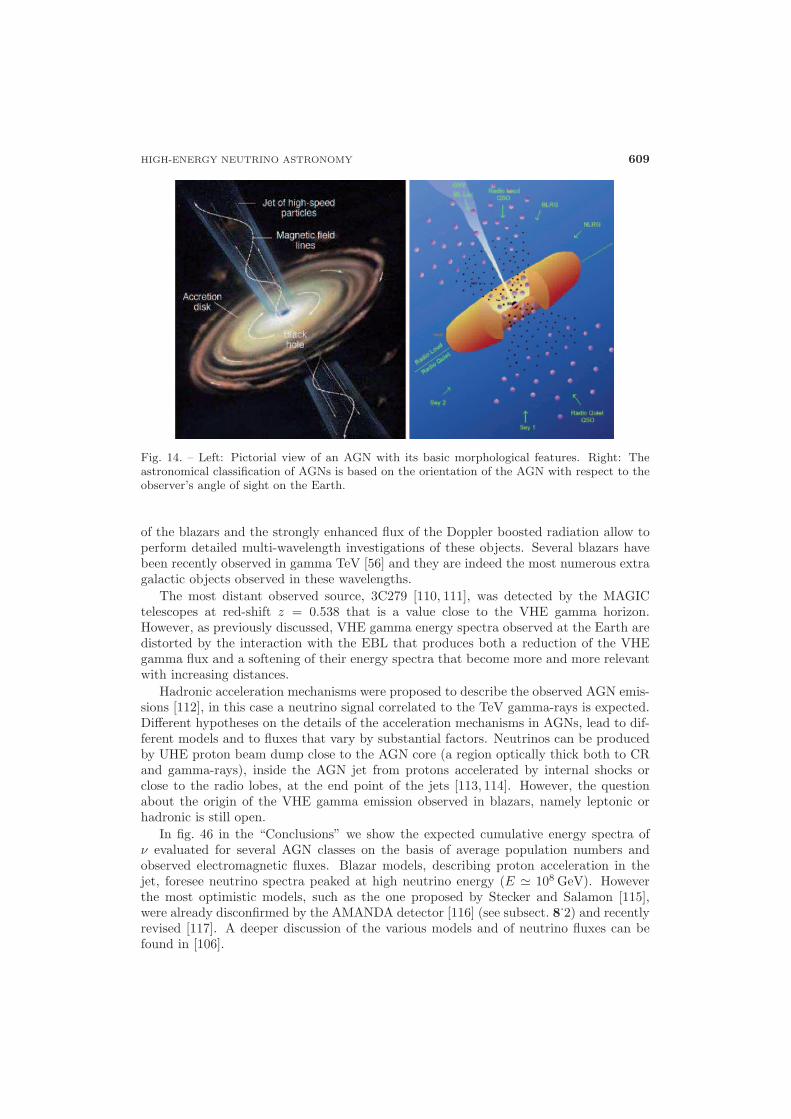
The commonly used classification scheme for AGNs is based on the anisotropy oftheir emission with respect to the observer: depending on the observation angle AGNsare classified as quasars, Seyfert galaxies, BL Lacs, and blazars, as shown in fig. 14, [109].Different features of the detected photon spectrum lead to more detailed classification.Although most of AGNs are radio-quiet, a particular ensemble of AGNs are Radio galax-ies where the radio emission, due to the synchrotron process, far exceed the luminosityat other wavelengths. Both radio-loud and radio-quiet AGNs are strong X-ray emittersand are considered as possible sources of UHECR and high-energy neutrinos. A partic-ularly interesting group of objects is the class of blazars showing relativistic jets almostaligned with respect to the line of sight of the observer. Indeed, the peculiar orientation
(2) For a clear review see [108].
HIGH-ENERGY NEUTRINO ASTRONOMY 609
Fig. 14. – Left: Pictorial view of an AGN with its basic morphological features. Right: Theastronomical classification of AGNs is based on the orientation of the AGN with respect to theobserver’s angle of sight on the Earth.
of the blazars and the strongly enhanced flux of the Doppler boosted radiation allow toperform detailed multi-wavelength investigations of these objects. Several blazars havebeen recently observed in gamma TeV [56] and they are indeed the most numerous extragalactic objects observed in these wavelengths.
The most distant observed source, 3C279 [110, 111], was detected by the MAGICtelescopes at red-shift z = 0.538 that is a value close to the VHE gamma horizon.However, as previously discussed, VHE gamma energy spectra observed at the Earth aredistorted by the interaction with the EBL that produces both a reduction of the VHEgamma flux and a softening of their energy spectra that become more and more relevantwith increasing distances.
Hadronic acceleration mechanisms were proposed to describe the observed AGN emis-sions [112], in this case a neutrino signal correlated to the TeV gamma-rays is expected.Different hypotheses on the details of the acceleration mechanisms in AGNs, lead to dif-ferent models and to fluxes that vary by substantial factors. Neutrinos can be producedby UHE proton beam dump close to the AGN core (a region optically thick both to CRand gamma-rays), inside the AGN jet from protons accelerated by internal shocks orclose to the radio lobes, at the end point of the jets [113, 114]. However, the questionabout the origin of the VHE gamma emission observed in blazars, namely leptonic orhadronic is still open.
In fig. 46 in the “Conclusions” we show the expected cumulative energy spectra ofν evaluated for several AGN classes on the basis of average population numbers andobserved electromagnetic fluxes. Blazar models, describing proton acceleration in thejet, foresee neutrino spectra peaked at high neutrino energy (E � 108 GeV). Howeverthe most optimistic models, such as the one proposed by Stecker and Salamon [115],were already disconfirmed by the AMANDA detector [116] (see subsect. 8.2) and recentlyrevised [117]. A deeper discussion of the various models and of neutrino fluxes can befound in [106].
610 P. SAPIENZA and G. RICCOBENE
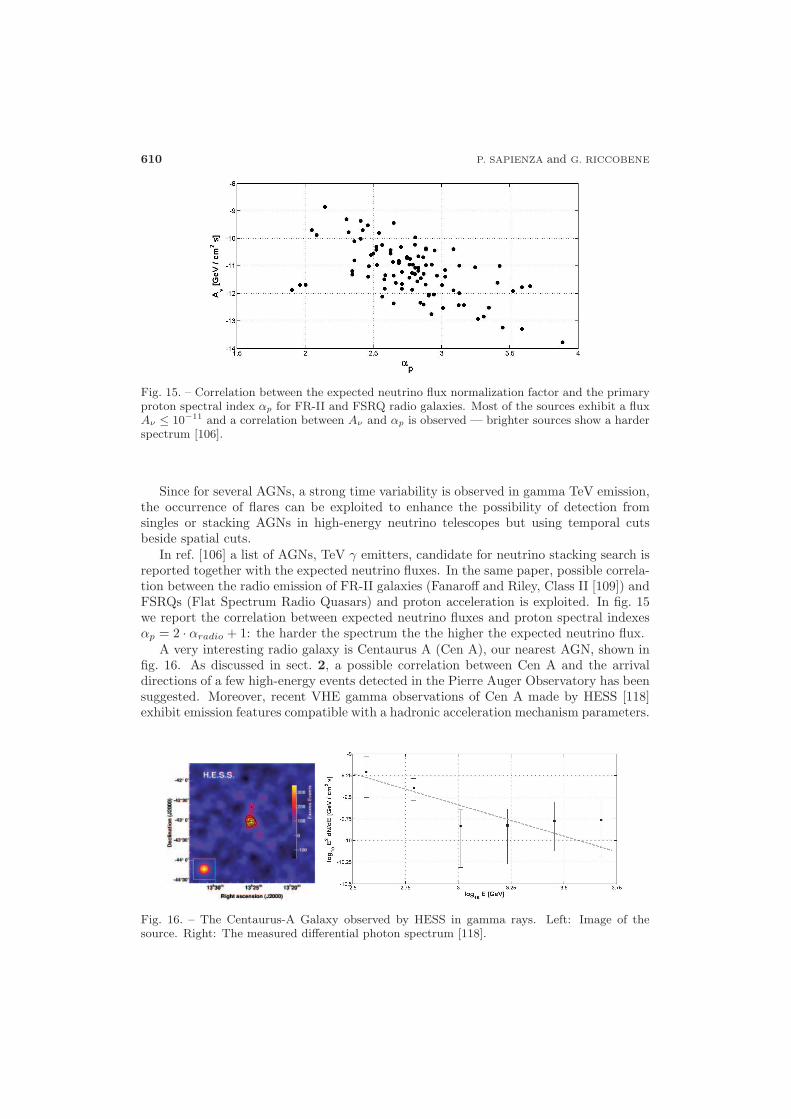
Fig. 15. – Correlation between the expected neutrino flux normalization factor and the primaryproton spectral index αp for FR-II and FSRQ radio galaxies. Most of the sources exhibit a fluxAν ≤ 10−11 and a correlation between Aν and αp is observed — brighter sources show a harderspectrum [106].
Since for several AGNs, a strong time variability is observed in gamma TeV emission,the occurrence of flares can be exploited to enhance the possibility of detection fromsingles or stacking AGNs in high-energy neutrino telescopes but using temporal cutsbeside spatial cuts.
In ref. [106] a list of AGNs, TeV γ emitters, candidate for neutrino stacking search isreported together with the expected neutrino fluxes. In the same paper, possible correla-tion between the radio emission of FR-II galaxies (Fanaroff and Riley, Class II [109]) andFSRQs (Flat Spectrum Radio Quasars) and proton acceleration is exploited. In fig. 15we report the correlation between expected neutrino fluxes and proton spectral indexesαp = 2 · αradio + 1: the harder the spectrum the the higher the expected neutrino flux.
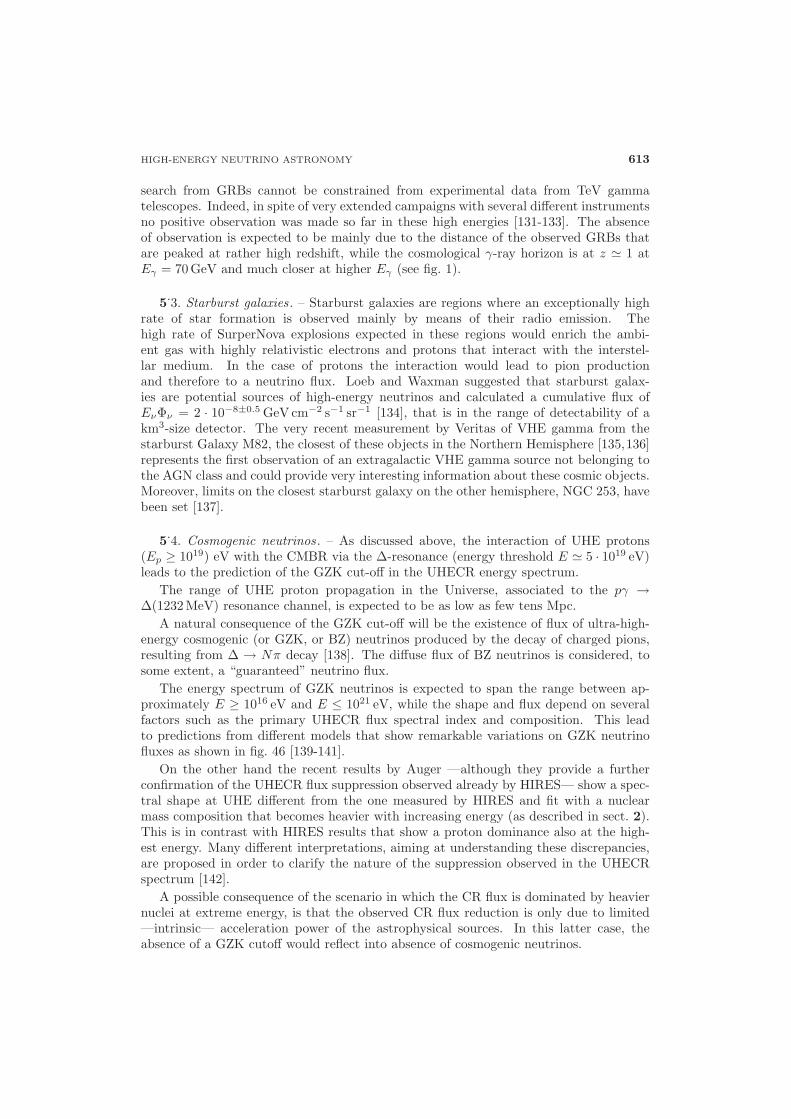
A very interesting radio galaxy is Centaurus A (Cen A), our nearest AGN, shown infig. 16. As discussed in sect. 2, a possible correlation between Cen A and the arrivaldirections of a few high-energy events detected in the Pierre Auger Observatory has beensuggested. Moreover, recent VHE gamma observations of Cen A made by HESS [118]exhibit emission features compatible with a hadronic acceleration mechanism parameters.
Fig. 16. – The Centaurus-A Galaxy observed by HESS in gamma rays. Left: Image of thesource. Right: The measured differential photon spectrum [118].

HIGH-ENERGY NEUTRINO ASTRONOMY 611
Another very important piece of information was provided by the recent observationsof the M87 radio galaxy by joint measurements in radio and VHE gamma [119] revealeda period of strong VHE gamma flares in coincidence with a strong enhancement of theradio emission from the core. These results imply the acceleration of charged particlesup to very high energy in the proximity of the central black hole, but still do not permitdisentangling between leptonic and hadronic origin of the VHE gamma emission.
5.2. Gamma-Ray Burst . – Gamma-Ray Bursts (GRB) are among the most mysteri-ous and violent phenomena ever observed in the Universe. A comprehensive review isreported in ref. [120], in the following only the basic features and their possible associa-tion with high-energy neutrino emission are discussed. The total energy release of GRBsis huge (≥ 1051 erg) though they are transient sources: their emission in hard-X-ray andsoft-gamma photons lasting from millisecond to several hundreds of seconds, with a lateafterglow in IR, radio and optical band. Historically, gamma-ray bursts were discoveredas extremely intense gamma-ray flashes in 1967 by the Vela satellites [121], launched bythe U.S. to monitor the sky for nuclear explosions that might violate the Nuclear TestBan Treaty. It was soon realized that GRB distribution in the sky is almost isotropic,thus suggesting an extragalactic origin, and their emission has been measured over a verybroad interval of wavelength. A major step was provided in the late 90’s by the Beppo-SAX satellite [122] measurement of the X-ray afterglow that permitted to localize theGRB and to send an alert to ground-based optical telescopes that succeed in identifyingthe host galaxy and determining its redshift, thus providing a conclusive evidence of thefact that GRB are at cosmological distances. A subsequent important step was achievedthrough the HETE-2 satellite [123] that, beside many other interesting observations, lo-calized GRB 030329 that was the first GRB unambiguous associated with a supernovaexplosion [124, 125]. The launch of the SWIFT satellite [126] in November 2004 leadto further remarkable advances in the field revealing the unexplored afterglow behaviorlasting from minutes to hours, as well as the afterglow of so-called “short” gamma-raybursts (gamma emission briefer than 2 s, described in the following) and extending thegamma-ray burst observations beyond z = 6 in redshift where very few astrophysicalobjects have been ever measured. The last frontier of GRB detection was achieved withthe launch of FERMI satellite [127] in June 2008 that largely extends the observabilityof GRB at energy higher than 100 MeV detecting almost 250 burst/year.
However, in spite of a large numbers of GBRs observed since their discovery and of thefact that their emission features have been studied in details, the nature of these objectsremains mysterious to a large extent. The bulk of the emission features indicate a non-thermal process, driven by a catastrophic event involving charged particle accelerationand the conversion of huge quantities of matter into energy. Accordingly to the durationof their γ emission a bimodal time distribution of GRBs is observed: for emission timest ≥ 2 s they are named “long” GRBs, while for t ≤ 2 s they are named “short” GRBs.These two classes of observations seem to be associated to different progenitors: thecore collapse of a massive star appears as a convincing explanation for long GRB, whilecompact merger of neutron star-neutron star (NS-NS) or black hole-neutron star (BH-NS) is the proposed scenario for short burst.
Concerning the photon fluence, energy releases up to Ωγ/(4π)× 1054 erg — where Ωγ
is the angle into which the gamma emission is beamed — are observed.The hypothesis of emission from a jet, similarly to AGN, allows to accommodate
the huge gamma-ray fluence with the extremely large distances, deduced by redshiftmeasurements.
612 P. SAPIENZA and G. RICCOBENE
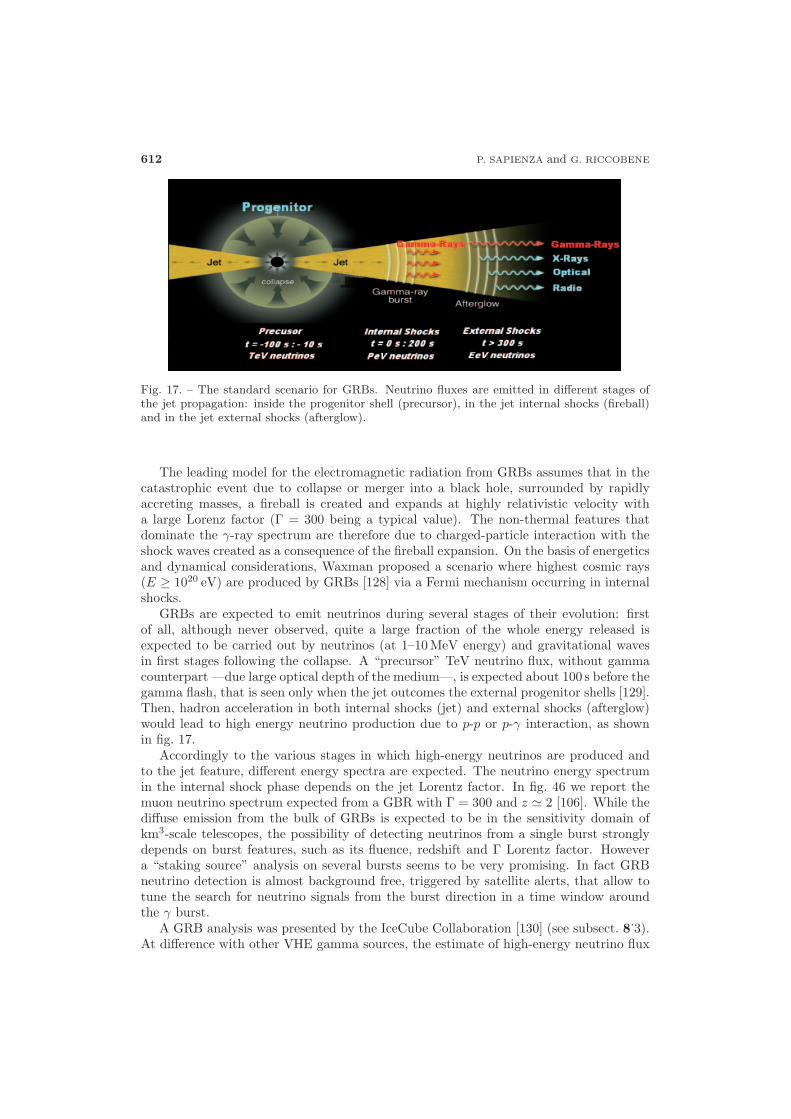
Fig. 17. – The standard scenario for GRBs. Neutrino fluxes are emitted in different stages ofthe jet propagation: inside the progenitor shell (precursor), in the jet internal shocks (fireball)and in the jet external shocks (afterglow).
The leading model for the electromagnetic radiation from GRBs assumes that in thecatastrophic event due to collapse or merger into a black hole, surrounded by rapidlyaccreting masses, a fireball is created and expands at highly relativistic velocity witha large Lorenz factor (Γ = 300 being a typical value). The non-thermal features thatdominate the γ-ray spectrum are therefore due to charged-particle interaction with theshock waves created as a consequence of the fireball expansion. On the basis of energeticsand dynamical considerations, Waxman proposed a scenario where highest cosmic rays(E ≥ 1020 eV) are produced by GRBs [128] via a Fermi mechanism occurring in internalshocks.
GRBs are expected to emit neutrinos during several stages of their evolution: firstof all, although never observed, quite a large fraction of the whole energy released isexpected to be carried out by neutrinos (at 1–10 MeV energy) and gravitational wavesin first stages following the collapse. A “precursor” TeV neutrino flux, without gammacounterpart —due large optical depth of the medium—, is expected about 100 s before thegamma flash, that is seen only when the jet outcomes the external progenitor shells [129].Then, hadron acceleration in both internal shocks (jet) and external shocks (afterglow)would lead to high energy neutrino production due to p-p or p-γ interaction, as shownin fig. 17.
Accordingly to the various stages in which high-energy neutrinos are produced andto the jet feature, different energy spectra are expected. The neutrino energy spectrumin the internal shock phase depends on the jet Lorentz factor. In fig. 46 we report themuon neutrino spectrum expected from a GBR with Γ = 300 and z � 2 [106]. While thediffuse emission from the bulk of GRBs is expected to be in the sensitivity domain ofkm3-scale telescopes, the possibility of detecting neutrinos from a single burst stronglydepends on burst features, such as its fluence, redshift and Γ Lorentz factor. Howevera “staking source” analysis on several bursts seems to be very promising. In fact GRBneutrino detection is almost background free, triggered by satellite alerts, that allow totune the search for neutrino signals from the burst direction in a time window aroundthe γ burst.
A GRB analysis was presented by the IceCube Collaboration [130] (see subsect. 8.3).At difference with other VHE gamma sources, the estimate of high-energy neutrino flux
HIGH-ENERGY NEUTRINO ASTRONOMY 613
search from GRBs cannot be constrained from experimental data from TeV gammatelescopes. Indeed, in spite of very extended campaigns with several different instrumentsno positive observation was made so far in these high energies [131-133]. The absenceof observation is expected to be mainly due to the distance of the observed GRBs thatare peaked at rather high redshift, while the cosmological γ-ray horizon is at z � 1 atEγ = 70 GeV and much closer at higher Eγ (see fig. 1).
5.3. Starburst galaxies. – Starburst galaxies are regions where an exceptionally highrate of star formation is observed mainly by means of their radio emission. Thehigh rate of SurperNova explosions expected in these regions would enrich the ambi-ent gas with highly relativistic electrons and protons that interact with the interstel-lar medium. In the case of protons the interaction would lead to pion productionand therefore to a neutrino flux. Loeb and Waxman suggested that starburst galax-ies are potential sources of high-energy neutrinos and calculated a cumulative flux ofEνΦν = 2 · 10−8±0.5 GeV cm−2 s−1 sr−1 [134], that is in the range of detectability of akm3-size detector. The very recent measurement by Veritas of VHE gamma from thestarburst Galaxy M82, the closest of these objects in the Northern Hemisphere [135,136]represents the first observation of an extragalactic VHE gamma source not belonging tothe AGN class and could provide very interesting information about these cosmic objects.Moreover, limits on the closest starburst galaxy on the other hemisphere, NGC 253, havebeen set [137].
5.4. Cosmogenic neutrinos. – As discussed above, the interaction of UHE protons(Ep ≥ 1019) eV with the CMBR via the Δ-resonance (energy threshold E � 5 · 1019 eV)leads to the prediction of the GZK cut-off in the UHECR energy spectrum.
The range of UHE proton propagation in the Universe, associated to the pγ →Δ(1232MeV) resonance channel, is expected to be as low as few tens Mpc.
A natural consequence of the GZK cut-off will be the existence of flux of ultra-high-energy cosmogenic (or GZK, or BZ) neutrinos produced by the decay of charged pions,resulting from Δ → Nπ decay [138]. The diffuse flux of BZ neutrinos is considered, tosome extent, a “guaranteed” neutrino flux.
The energy spectrum of GZK neutrinos is expected to span the range between ap-proximately E ≥ 1016 eV and E ≤ 1021 eV, while the shape and flux depend on severalfactors such as the primary UHECR flux spectral index and composition. This leadto predictions from different models that show remarkable variations on GZK neutrinofluxes as shown in fig. 46 [139-141].
On the other hand the recent results by Auger —although they provide a furtherconfirmation of the UHECR flux suppression observed already by HIRES— show a spec-tral shape at UHE different from the one measured by HIRES and fit with a nuclearmass composition that becomes heavier with increasing energy (as described in sect. 2).This is in contrast with HIRES results that show a proton dominance also at the high-est energy. Many different interpretations, aiming at understanding these discrepancies,are proposed in order to clarify the nature of the suppression observed in the UHECRspectrum [142].
A possible consequence of the scenario in which the CR flux is dominated by heaviernuclei at extreme energy, is that the observed CR flux reduction is only due to limited—intrinsic— acceleration power of the astrophysical sources. In this latter case, theabsence of a GZK cutoff would reflect into absence of cosmogenic neutrinos.

614 P. SAPIENZA and G. RICCOBENE
Fig. 18. – Left: The neutrino-nucleon cross-section as a function of energy for charged-currentinteraction (dashed line), neutral-current (dotted line) and total cross-section (solid line). Right:Neutrino absorption probability in the Earth as a function of the zenith angle for Eν = 1 TeV,10TeV and 100 TeV, respectively.
6. – High-energy neutrino detection
As shown in the previous section, light and neutral neutrinos are optimal probesfor high-energy astronomy, i.e. for the identification of astrophysical sources of UHEparticles [143]. To fulfill this task neutrino detectors must be design to reconstructboth the neutrino energy and direction, thus they are commonly referred as NeutrinoTelescopes (for a clear review see [144]).
At energies above few hundreds GeV, neutrinos are detected through deep-inelasticscattering of the ν with a target nucleon N . In the ν + N → l + X interaction, thelepton l escapes while the hadronic debris X leads to a hadronic cascade. The initialneutrino energy Eν , is shared among the lepton El and the hadronic cascade. Thecascade carries Eh = y · Eν , where y is the Bjorken inelasticity parameter, with a meanvalue of 〈y〉 � 0.25 at very high energies, and a very broad distribution; the lepton takesthe remaining energy [145].
In weak charged-current (CC) interactions the outgoing lepton is charged and it pre-serves the neutrino flavour (e, μ or τ). In neutral-current (NC) interactions, the outgoinglepton is a neutrino, thus only the hadronic cascade is detectable.
The detection of the ν interaction is, therefore, based on the observation of the out-going charged lepton and/or of the hadronic cascade.
The νN cross-section is as low as σνN � 10−35 cm2, at � 1 TeV, increasing linearlywith the neutrino energy up to 5 TeV energy, above this value its slope changes to E−0.4,as shown in fig. 18 [146]. The increase of the neutrino cross-section as a function of energyimplies also that at E > 10 TeV, the Earth is not transparent to neutrinos. Figure 18shows the probability of absorption of neutrinos as a function of zenith angle for differentneutrino energies, taking into account the different densities of the Earth core, mantleand crust [147]. This effect plays an important role for the energy range accessible todifferent experimental techniques, as described in the following.
Due to the low νN cross-section and to the faint expected astrophysical ν fluxes(∝ E−2
ν ), the detectors must have a ν interaction target mass of several GTons for Eν �1012–1017 eV and much larger for higher energies. For this reasons Markov, Zheleznykhand Askaryan proposed the use of natural media to detect cosmic neutrinos [148].
Depending on the candidate interaction target medium and on the energy range toexplore, different experimental techniques were proposed (see fig. 19):
HIGH-ENERGY NEUTRINO ASTRONOMY 615
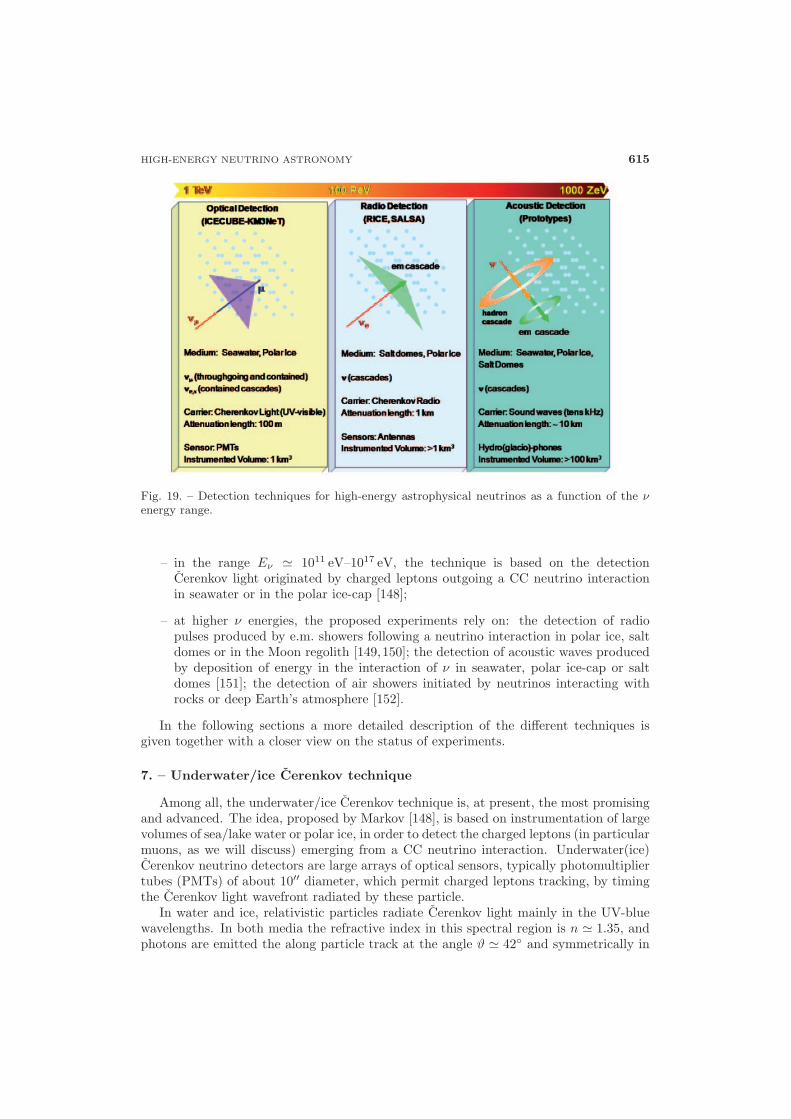
Fig. 19. – Detection techniques for high-energy astrophysical neutrinos as a function of the νenergy range.
– in the range Eν � 1011 eV–1017 eV, the technique is based on the detectionCerenkov light originated by charged leptons outgoing a CC neutrino interactionin seawater or in the polar ice-cap [148];
– at higher ν energies, the proposed experiments rely on: the detection of radiopulses produced by e.m. showers following a neutrino interaction in polar ice, saltdomes or in the Moon regolith [149,150]; the detection of acoustic waves producedby deposition of energy in the interaction of ν in seawater, polar ice-cap or saltdomes [151]; the detection of air showers initiated by neutrinos interacting withrocks or deep Earth’s atmosphere [152].
In the following sections a more detailed description of the different techniques isgiven together with a closer view on the status of experiments.
7. – Underwater/ice Cerenkov technique
Among all, the underwater/ice Cerenkov technique is, at present, the most promisingand advanced. The idea, proposed by Markov [148], is based on instrumentation of largevolumes of sea/lake water or polar ice, in order to detect the charged leptons (in particularmuons, as we will discuss) emerging from a CC neutrino interaction. Underwater(ice)Cerenkov neutrino detectors are large arrays of optical sensors, typically photomultipliertubes (PMTs) of about 10′′ diameter, which permit charged leptons tracking, by timingthe Cerenkov light wavefront radiated by these particle.
In water and ice, relativistic particles radiate Cerenkov light mainly in the UV-bluewavelengths. In both media the refractive index in this spectral region is n � 1.35, andphotons are emitted the along particle track at the angle ϑ � 42◦ and symmetrically in

616 P. SAPIENZA and G. RICCOBENE
Fig. 20. – The lepton Cerenkov wave front is reconstructed using the information on photon hitand PMT positions (see eq. (6)).
phi. The time sequence of Cerenkov photons hits on PMTs is thus correlated by thespace-time causality relation (see fig. 20):
(6) c(tj − t0) = lj + dj tan(ϑC).
The above relation is used to reconstruct the Cerenkov wave front, therefore theparticle track, from the experimental data. The reconstructed track direction is howeveraffected by experimental indetermination: the error on PMTs position and on absolutephoton hit time, due to photon scattering in the medium, PMT transit time spread andto detector time calibration. Photon scattering in the medium is an important issue,since scattering deflects Cerenkov photons, affecting track direction reconstruction. Inice the scattering length of light is only few tens of cm, in water it is about 100 m [153].
It is worth mentioning that particle energy loss via Cerenkov radiation is only a smallfraction of the total one, and the number of Cerenkov photons (UV-blue) is only 300 percm of track. Given this small amount of light, photons hits PMTs only if the averagedistance between optical sensors is not larger than the light absorption length in themedium. The medium optical properties, thus, determine the detector granularity (i.e.the PMT density) and its size. As shown in fig. 21, water is transparent only to a narrowrange of wavelengths (350 nm ≤ λ ≤ 550 nm). In particular, for deep polar ice La(UV-blue nm)� 100 m [154], and it is about 70 m for clear ocean waters [153]. This leads tothe use of not less than � 5000 optical sensors per km3.
The “golden channel” for astrophysical neutrino detection is the νμ CC interaction.The muon range in water is, at E � TeV, of the order of kilometres (see fig. 22), thereforethe νμ interaction can take place either within the detector or far outside it, providing aflux of high-energy muons, either contained or crossing the detector. The muon directionis recovered from the reconstruction of the Cerenkov wave front, radiated along themuon track, within the detector instrumented volume. The detection of the neutrino-induced muon also allows “neutrino astronomy”: the angle between the outgoing muonand the interacting neutrino decreases as a function of neutrino energy (see fig. 22): at

HIGH-ENERGY NEUTRINO ASTRONOMY 617
10-2
10-1
1
10
10 2
10 3
10 4
10 5
10 6
10 7
10-13
10-12
10-11
10-10
10-9
10-8
10-7
10-6
10-5
10-4
10-3
10-2
10-1
1 10 102
103
sea water
pure water
wavelength (m)
a (1
/m)
Fig. 21. – Light absorptionas a function of wavelength for pure water (solid line) and seawater(dashed line). The absorption length is defined as La(λ) = a−1(λ).
Eν > 1 TeV, the muon track is almost co-linear to the νμ one and permit pointing backto the ν cosmic source. These detectors are, in fact, also named as Neutrino Telescopes.
For the muon neutrino detection, up-going or horizontal muon tracks are preferred.In fact, when an upward-going muon is reconstructed this is a unique signature of aneutrino event, being the up-going atmospheric muon background completely filteredout within few tens of km of water (see fig. 23). The suppression of the intense down-going atmospheric muon flux is achieved installing the detector at large water(ice) depth:the muon stopping power of 3000 m of water is equivalent to the one of 1 km of rock.Water and ice have, therefore, a threefold function: huge (and inexpensive) neutrinotarget, Cerenkov light radiator and shield for cosmic muon background.
Neutrino telescopes are also expected to disentangle between neutrino flavours byreconstructing the Cerenkov wave front shape of the event which depends on the differentpropagation of e, μ and τ in water (and ice).
In case of νe CC interactions, the final state involves high-energy electrons that providea high-energy electromagnetic shower superimposed on the hadronic one. Both showersextend for few tens of metres from the ν interaction point, thus only interactions that
Fig. 22. – Left: Average muon range in water as a function of muon energy. Right: Medianof the distribution ΔΩν−νμ (muon exit angle with respect to the νμ direction) as a function ofneutrino energy.
618 P. SAPIENZA and G. RICCOBENE
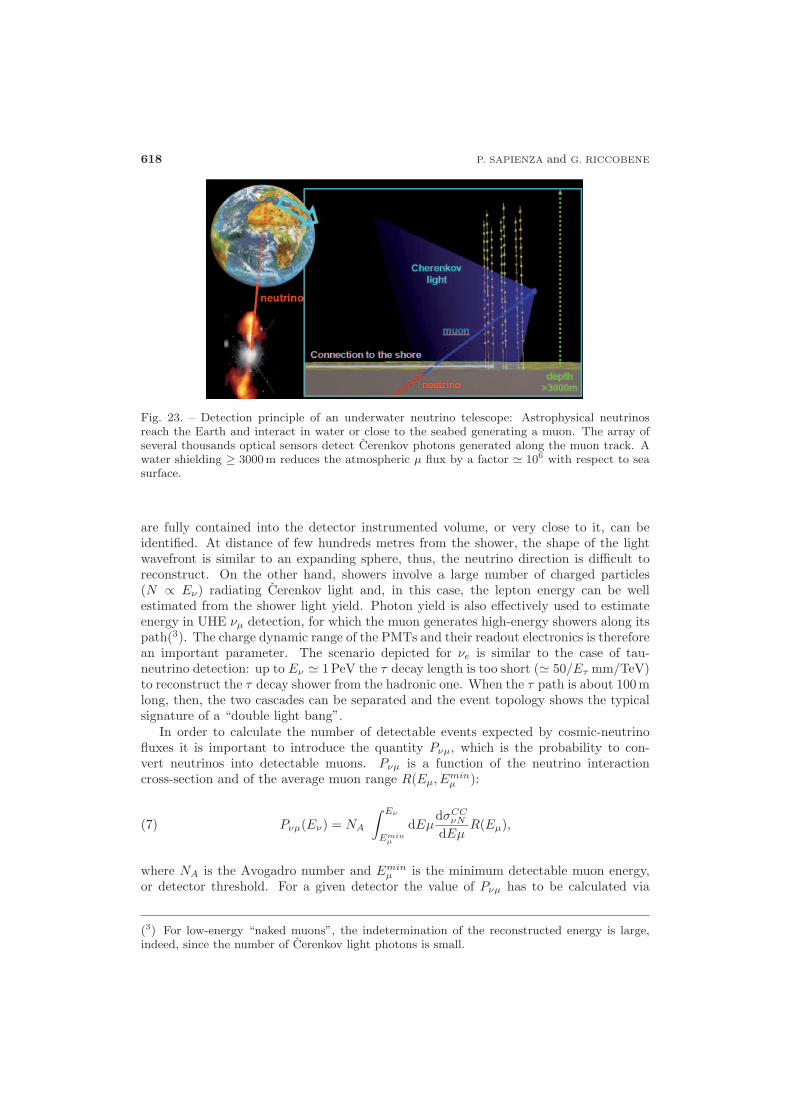
Fig. 23. – Detection principle of an underwater neutrino telescope: Astrophysical neutrinosreach the Earth and interact in water or close to the seabed generating a muon. The array ofseveral thousands optical sensors detect Cerenkov photons generated along the muon track. Awater shielding ≥ 3000m reduces the atmospheric μ flux by a factor � 106 with respect to seasurface.
are fully contained into the detector instrumented volume, or very close to it, can beidentified. At distance of few hundreds metres from the shower, the shape of the lightwavefront is similar to an expanding sphere, thus, the neutrino direction is difficult toreconstruct. On the other hand, showers involve a large number of charged particles(N ∝ Eν) radiating Cerenkov light and, in this case, the lepton energy can be wellestimated from the shower light yield. Photon yield is also effectively used to estimateenergy in UHE νμ detection, for which the muon generates high-energy showers along itspath(3). The charge dynamic range of the PMTs and their readout electronics is thereforean important parameter. The scenario depicted for νe is similar to the case of tau-neutrino detection: up to Eν � 1 PeV the τ decay length is too short (� 50/Eτ mm/TeV)to reconstruct the τ decay shower from the hadronic one. When the τ path is about 100 mlong, then, the two cascades can be separated and the event topology shows the typicalsignature of a “double light bang”.
In order to calculate the number of detectable events expected by cosmic-neutrinofluxes it is important to introduce the quantity Pνμ, which is the probability to con-vert neutrinos into detectable muons. Pνμ is a function of the neutrino interactioncross-section and of the average muon range R(Eμ, Emin
μ ):
(7) Pνμ(Eν) = NA
∫ Eν
Eminμ
dEμdσCC
νN
dEμR(Eμ),
where NA is the Avogadro number and Eminμ is the minimum detectable muon energy,
or detector threshold. For a given detector the value of Pνμ has to be calculated via
(3) For low-energy “naked muons”, the indetermination of the reconstructed energy is large,indeed, since the number of Cerenkov light photons is small.

HIGH-ENERGY NEUTRINO ASTRONOMY 619
Fig. 24. – The Pνμ as a function of neutrino energy for different detector thresholds: 1GeV(triangles) and 1 TeV (circles). The line represents the parametrization of Gaisser [144] for1GeV threshold.
simulations [144]. As a rule of thumb Pνμ � 1.3×10⁻⁶ for TeV neutrinos (Eminμ = 1 GeV)
and it increases with energy(4) as E0.8, as shown in fig. 24.As already mentioned, above 1012 eV, the muon range is larger than several kilometres,
and detectable muons can be originated far from the detector sensitive volume. Theparameter usually quoted to describe detector performance for muon neutrino detectionis its effective area — Aeff for muons, i.e. the surface intersecting the neutrino-inducedmuon flux folded with the detection efficiency for muons. The rate of events producedby a neutrino flux Φν(Eν , ϑ) per unit of detector effective area, is then expressed by
(8)Nμ(Emin
μ , ϑ)Aeff T
=∫ Eν
Eminμ
dEνΦν(Eν , ϑ)Pνμe− Z(ϑ)
LνN (Eν ) ,
being LνN the neutrino absorption length in the Earth and Z(ϑ) the Earth column depth(see fig. 18).
Plugging the WB bound flux (see formula (5)) into eq. (8) and integrating over thesolid angle, one gets a rate of about 102 up-going events per year for a 1 km2 effectivearea detector with Eμ � 1 TeV threshold. This number set the scale of dimension forastrophysical neutrino detectors.
Due to photon detector and installation costs, the affordable size of these apparatusesis of the order of few km3. This size is optimal for the exploration of the ν energy range1011 eV–1017 eV.
The study of detector performance in details requires Monte Carlo simulations thathave to take into account the detector layout, the characteristics of the Cerenkov radiatorwhich surrounds the detector (light refraction index, light absorption and scatteringcoefficients) and the sources of background, that will be discussed in the following section.
(4) For Eν � Eminμ the Pνμ shape is independent of Emin
μ .
620 P. SAPIENZA and G. RICCOBENE
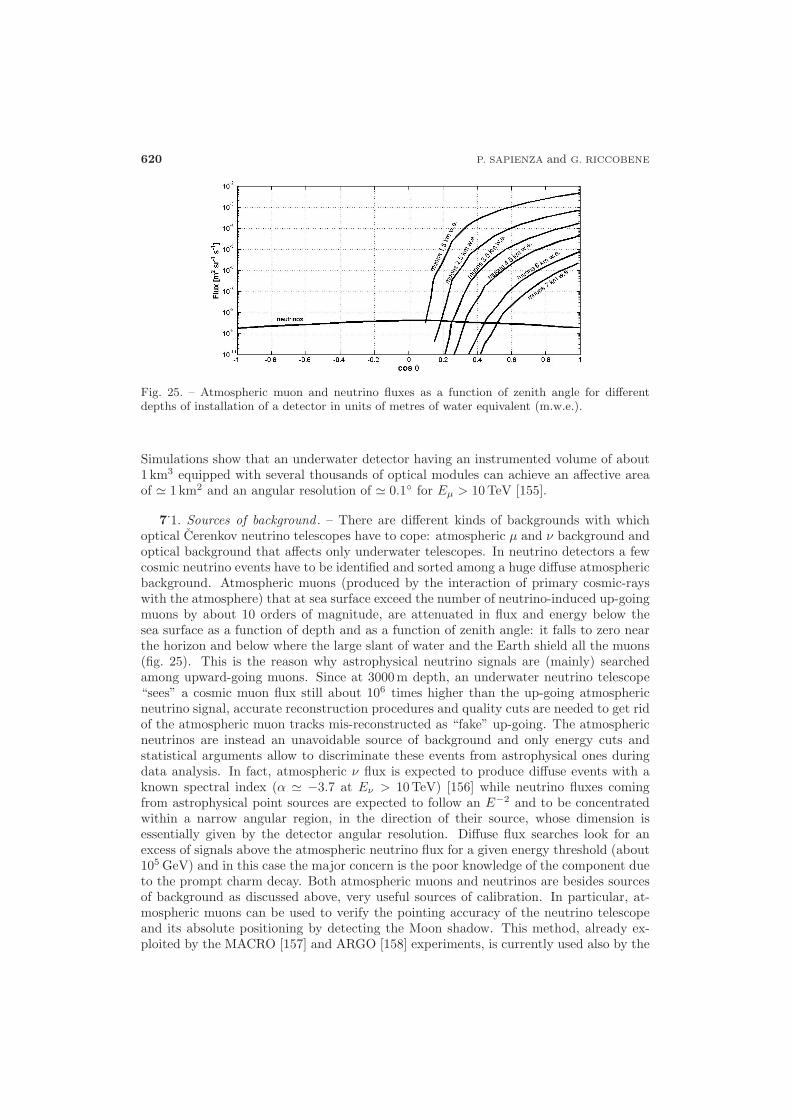
Fig. 25. – Atmospheric muon and neutrino fluxes as a function of zenith angle for differentdepths of installation of a detector in units of metres of water equivalent (m.w.e.).
Simulations show that an underwater detector having an instrumented volume of about1 km3 equipped with several thousands of optical modules can achieve an affective areaof � 1 km2 and an angular resolution of � 0.1◦ for Eμ > 10 TeV [155].
7.1. Sources of background . – There are different kinds of backgrounds with whichoptical Cerenkov neutrino telescopes have to cope: atmospheric μ and ν background andoptical background that affects only underwater telescopes. In neutrino detectors a fewcosmic neutrino events have to be identified and sorted among a huge diffuse atmosphericbackground. Atmospheric muons (produced by the interaction of primary cosmic-rayswith the atmosphere) that at sea surface exceed the number of neutrino-induced up-goingmuons by about 10 orders of magnitude, are attenuated in flux and energy below thesea surface as a function of depth and as a function of zenith angle: it falls to zero nearthe horizon and below where the large slant of water and the Earth shield all the muons(fig. 25). This is the reason why astrophysical neutrino signals are (mainly) searchedamong upward-going muons. Since at 3000 m depth, an underwater neutrino telescope“sees” a cosmic muon flux still about 106 times higher than the up-going atmosphericneutrino signal, accurate reconstruction procedures and quality cuts are needed to get ridof the atmospheric muon tracks mis-reconstructed as “fake” up-going. The atmosphericneutrinos are instead an unavoidable source of background and only energy cuts andstatistical arguments allow to discriminate these events from astrophysical ones duringdata analysis. In fact, atmospheric ν flux is expected to produce diffuse events with aknown spectral index (α � −3.7 at Eν > 10 TeV) [156] while neutrino fluxes comingfrom astrophysical point sources are expected to follow an E−2 and to be concentratedwithin a narrow angular region, in the direction of their source, whose dimension isessentially given by the detector angular resolution. Diffuse flux searches look for anexcess of signals above the atmospheric neutrino flux for a given energy threshold (about105 GeV) and in this case the major concern is the poor knowledge of the component dueto the prompt charm decay. Both atmospheric muons and neutrinos are besides sourcesof background as discussed above, very useful sources of calibration. In particular, at-mospheric muons can be used to verify the pointing accuracy of the neutrino telescopeand its absolute positioning by detecting the Moon shadow. This method, already ex-ploited by the MACRO [157] and ARGO [158] experiments, is currently used also by the
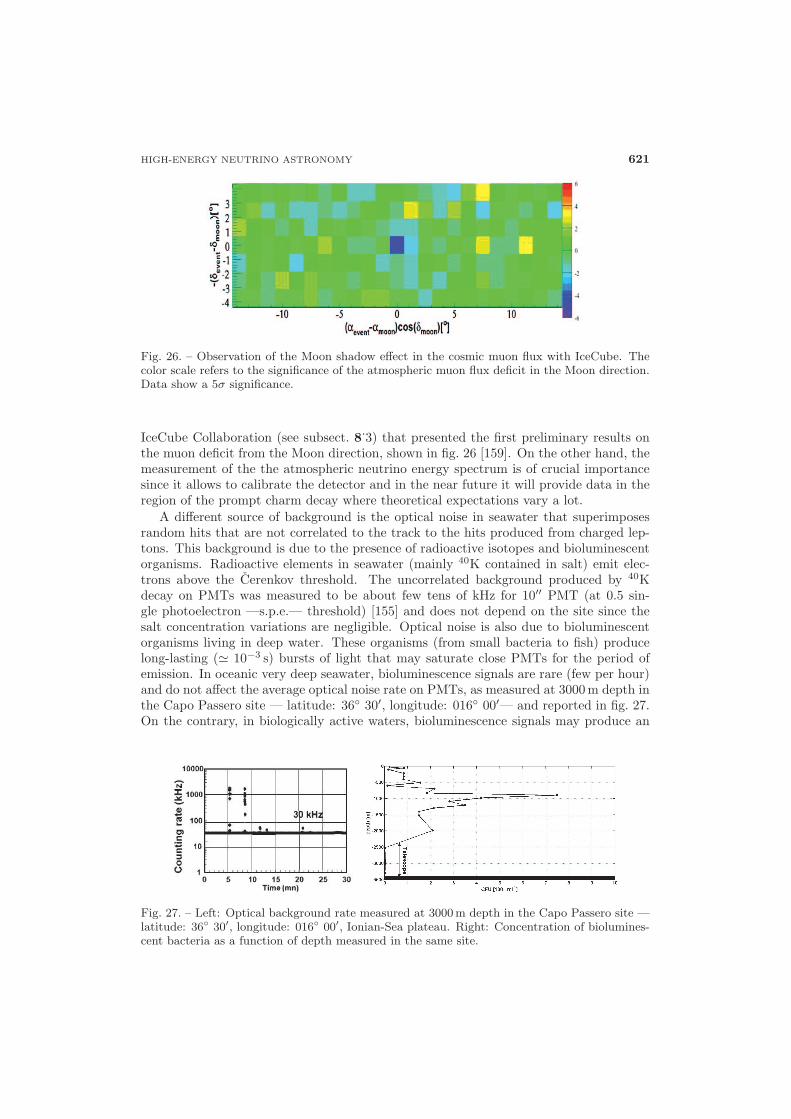
HIGH-ENERGY NEUTRINO ASTRONOMY 621
Fig. 26. – Observation of the Moon shadow effect in the cosmic muon flux with IceCube. Thecolor scale refers to the significance of the atmospheric muon flux deficit in the Moon direction.Data show a 5σ significance.
IceCube Collaboration (see subsect. 8.3) that presented the first preliminary results onthe muon deficit from the Moon direction, shown in fig. 26 [159]. On the other hand, themeasurement of the the atmospheric neutrino energy spectrum is of crucial importancesince it allows to calibrate the detector and in the near future it will provide data in theregion of the prompt charm decay where theoretical expectations vary a lot.
A different source of background is the optical noise in seawater that superimposesrandom hits that are not correlated to the track to the hits produced from charged lep-tons. This background is due to the presence of radioactive isotopes and bioluminescentorganisms. Radioactive elements in seawater (mainly 40K contained in salt) emit elec-trons above the Cerenkov threshold. The uncorrelated background produced by 40Kdecay on PMTs was measured to be about few tens of kHz for 10′′ PMT (at 0.5 sin-gle photoelectron —s.p.e.— threshold) [155] and does not depend on the site since thesalt concentration variations are negligible. Optical noise is also due to bioluminescentorganisms living in deep water. These organisms (from small bacteria to fish) producelong-lasting (� 10−3 s) bursts of light that may saturate close PMTs for the period ofemission. In oceanic very deep seawater, bioluminescence signals are rare (few per hour)and do not affect the average optical noise rate on PMTs, as measured at 3000 m depth inthe Capo Passero site — latitude: 36◦ 30′, longitude: 016◦ 00′— and reported in fig. 27.On the contrary, in biologically active waters, bioluminescence signals may produce an
Fig. 27. – Left: Optical background rate measured at 3000m depth in the Capo Passero site —latitude: 36◦ 30′, longitude: 016◦ 00′, Ionian-Sea plateau. Right: Concentration of biolumines-cent bacteria as a function of depth measured in the same site.

622 P. SAPIENZA and G. RICCOBENE
Fig. 28. – Pictorial view of the Baikal telescope NT200+: the compact NT200 detector (center)and the three outer strings are shown.
intense background noise up to several hundreds kHz (on 10′′ PMTs, 0.5 s.p.e) [155].Background hits have to be filtered by event triggers and reconstruction algorithms.Very high rates of bioluminescence can deteriorate the track reconstruction quality andin the worst cases could affect the data transmission.
8. – Status of neutrino telescope projects
The realization of km3-scale neutrino Cerenkov detectors both under the ice and indeep water requires extended R&D activities in order to cope with the huge technologicalchallenges that work in hostile environments (high-pressure, low-temperature, corrosion,. . . ) implies. In the following sections the status of experimental activities in the field isreported.
8.1. Baikal . – After the pioneering experience made by the DUMAND Collaborationoff-shore Hawai Island [160], Baikal was the first neutrino telescope operating underwater.The Baikal Neutrino Telescope (NT) is operated in Lake Baikal (Siberia) where thedetector is moored between 1000 and 1100 m depth [161]. Deployment and recoveryoperations are carried out during winter, when a thick ice cap of about 1 meter is formedover the lake. After a first deployment stage, in 1993 (NT36, equipped with 36 PMTs),the Baikal NT200 (fig. 28) was completed in 1998 and it takes data since then. BaikalNT200 is an umbrella-like array with a 72 m height and a diameter of 43 m. It is made of8 strings, each with 24 pairs of down-looking Optical Modules (OM). Each OM containsa 37 cm quasar photomultiplier. The two OMs of a pair operate in coincidence in orderto suppress the background due to bioluminescence. Baikal NT200 is a high-granularitydetector with a threshold Eμ � 15 GeV [162].
A rather low light transmission length in water, 15–20 m, high sedimentation, bio-

HIGH-ENERGY NEUTRINO ASTRONOMY 623
fouling rate and a high optical background rate due to bioluminescence limit the NT200detector performances as HE astrophysical neutrino telescope. Due also to the small leverarm, the angular resolution of NT200 for muon track is only 4◦. Nevertheless, for severalyears, Baikal has been the largest high-energy neutrino telescope in the world and the onlyone operating in the Northern Hemisphere thus providing upper limits on several physicsitems that were the most stringent ones up to the advent of AMANDA (see subsect. 8.2).In particular the Baikal Collaboration set the first limits on diffuse HE neutrino fluxes.From the analysis of the 5-year sample (1008 days live time) 372 upward-going neutrinocandidates were selected in good agreement with Monte Carlo simulations of atmosphericneutrinos that give 385 neutrino events to be detected in a corresponding lifetime. Thecollaboration has presented also data analysis of νe events, which set an upper limitfor diffuse astrophysical neutrino fluxes E2
νΦν < 8.1 · 10−7 cm−2 s−1 sr−1 GeV (at 90%confidence level, not including systematic uncertainties) [162].
In order to improve the pattern recognition and vertex reconstruction of high-energycascade events, an upgrading of the NT200 telescope, named NT200+, was realized in2005 by adding three outer strings (see fig. 28). Each string of NT200+ is made of 12 OMeach with a larger spacing. NT200+ has an enclosed detector volume of about 5 Mtonand it is expected to increase the sensitivity to diffuse fluxes by almost a factor four.The collaboration also plans the construction of a km3-size detector in Lake Baikal, theGiant Volume Detector (GVD). The GVD will be made of 90–100 sparsely instrumentedstrings with 12–16 OMs/string arranged over a 350 m string length. The detector willbe made of triangular detection units made of three (200 m)-spaced strings and a fourthone located in the center of the triangle. GVD configuration will instrument a volume ofabout 0.7 km3 for cascade (E ≥ 100 TeV) and will detect muon with an energy thresholdof few tens of TeV. NT200+ represents, in this framework, the first step towards GVD.
8.2. AMANDA. – The Antarctic Muon And Neutrino Detector Array (AMANDA),constructed at the Amundsen-Scott South Pole Station was completed in 2001 [163].AMANDA was a first-generation instrument that served as test bench for technologiesand as prototype for the km3-size detector IceCube. During an exploratory phase ofthe project in 1993-1994, four strings equipped with 20 OM each (with a 8′′ PMT andanalogue readout) were deployed between 800 and 1000 m. The strings were connected tosurface electronics via coaxial cables. OMs were illuminated by laser light shot into dif-fusers placed close to the OMs, thus allowing time calibration and, from the arrival timeson distant PMT, to derive the optical properties of the ice. These studies showed thatat these depths the high residual concentration of air bubbles leads to a light scatteringso strong that does not allow an accurate track reconstruction. For this reason, the nextstage of the project AMANDA-B10, made of ten strings, was deployed at depths be-tween 1500 m and 2000 m below the ice sheet surface where the concentration of residualbubbles was expected to be negligible [164].
The final detector configuration, AMANDA II that started in 2000 and run for sevenyears, consisted of 677 OMs arranged in 19 strings [165]. High-voltage power was providedto the OMs from the surface and the PMT signals were amplified and sent to the surfacevia electro-optical cables. Strings were arranged in concentric circles, the outermostdiameter being 200 m, thus giving an instrumented volume of about 15 Mton of ice.
AMANDA II accumulated a total exposure of 3.8 years, taking into account main-tenance periods and acquisition system dead time. The average rate of single photo-electron signals on PMTs (mainly dominated by housing and PMT glass impurities) andwas about 400 Hz per PMT.
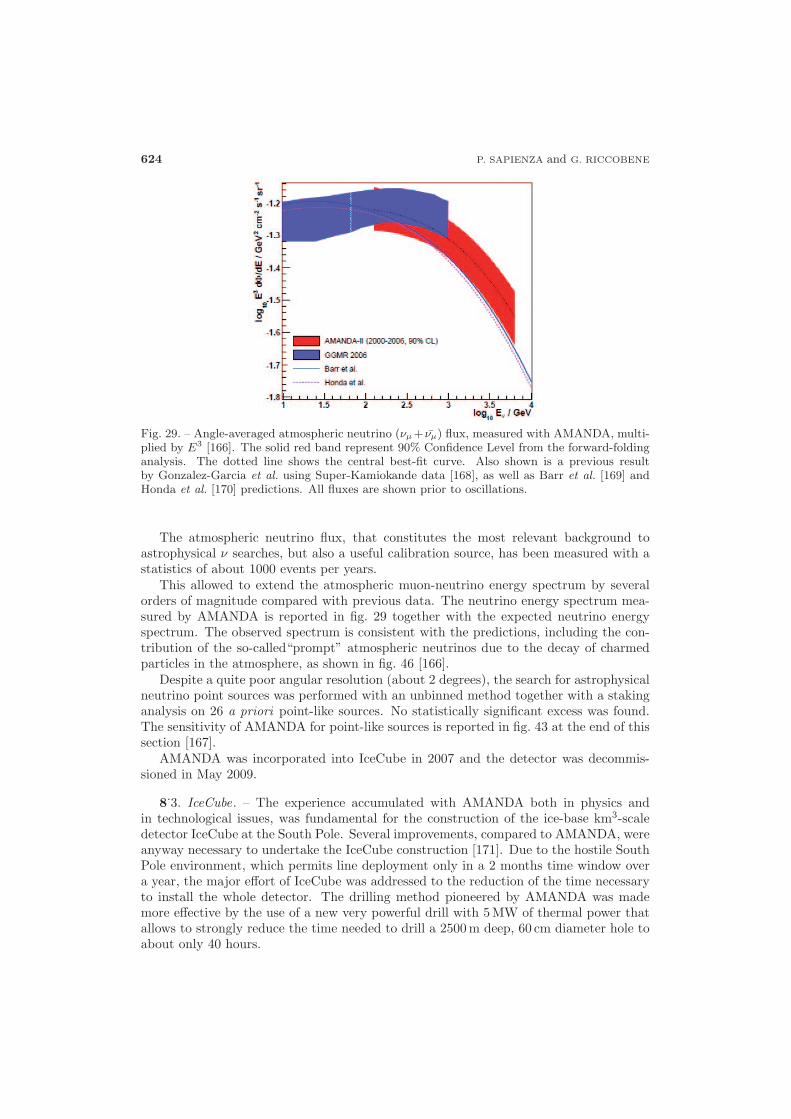
624 P. SAPIENZA and G. RICCOBENE
Fig. 29. – Angle-averaged atmospheric neutrino (νμ + νμ) flux, measured with AMANDA, multi-plied by E3 [166]. The solid red band represent 90% Confidence Level from the forward-foldinganalysis. The dotted line shows the central best-fit curve. Also shown is a previous resultby Gonzalez-Garcia et al. using Super-Kamiokande data [168], as well as Barr et al. [169] andHonda et al. [170] predictions. All fluxes are shown prior to oscillations.
The atmospheric neutrino flux, that constitutes the most relevant background toastrophysical ν searches, but also a useful calibration source, has been measured with astatistics of about 1000 events per years.
This allowed to extend the atmospheric muon-neutrino energy spectrum by severalorders of magnitude compared with previous data. The neutrino energy spectrum mea-sured by AMANDA is reported in fig. 29 together with the expected neutrino energyspectrum. The observed spectrum is consistent with the predictions, including the con-tribution of the so-called“prompt” atmospheric neutrinos due to the decay of charmedparticles in the atmosphere, as shown in fig. 46 [166].
Despite a quite poor angular resolution (about 2 degrees), the search for astrophysicalneutrino point sources was performed with an unbinned method together with a stakinganalysis on 26 a priori point-like sources. No statistically significant excess was found.The sensitivity of AMANDA for point-like sources is reported in fig. 43 at the end of thissection [167].
AMANDA was incorporated into IceCube in 2007 and the detector was decommis-sioned in May 2009.
8.3. IceCube. – The experience accumulated with AMANDA both in physics andin technological issues, was fundamental for the construction of the ice-base km3-scaledetector IceCube at the South Pole. Several improvements, compared to AMANDA, wereanyway necessary to undertake the IceCube construction [171]. Due to the hostile SouthPole environment, which permits line deployment only in a 2 months time window overa year, the major effort of IceCube was addressed to the reduction of the time necessaryto install the whole detector. The drilling method pioneered by AMANDA was mademore effective by the use of a new very powerful drill with 5 MW of thermal power thatallows to strongly reduce the time needed to drill a 2500 m deep, 60 cm diameter hole toabout only 40 hours.

HIGH-ENERGY NEUTRINO ASTRONOMY 625
Fig. 30. – Pictorial view of the IceCube detector.
In its complete configuration, IceCube, will consists of 80 vertical strings, eachequipped with 60 Digital Optical Modules (DOM) [172], deployed between 1450 m and2450 m depth below the surface, as shown in fig. 30. The DOM spacing along the stringis 17 m and the strings are placed on a hexagonal lay-out with 125 m spacing, giving1 km3 of instrumented volume. The DOM shown in fig. 31 contains a 10′′ PMT anddigital read-out electronics to permit signal wave form analysis, leading to a relevantimprovement of the detector performance. The size of IceCube is well matched to theenergy scale since a muon with an energy of about 200 GeV travels about 1 km in ice.An improvement of the telescope sensitivity in the low-energy range will be achieved bythe addition of six more densely instrumented strings that will be deployed in the bot-tom center of the telescope to form the so-called DeepCore detector that will lower theIceCube threshold for muons to about 10 GeV, thus allowing to address more effectivelylow-energy physics issues and especially to increase the sensitivity for the indirect searchof Dark Matter [173].
On the ice surface, above the IceCube strings, the IceTop air shower array is installed.IceTop will consist of 180 ice-filled tanks of about 1 m3 volume, shown in fig. 31, eachequipped with two DOMs [174]. IceTop allows to study high-energy cosmic-ray showers.With its 59 strings already deployed, 118 IceTop tanks in operation together with the firstDeepCore line, IceCube is currently the largest neutrino telescope operating in the world.
The detector is operational since 2006: with 9 lines during year 2006 (IC9, 137 dayslifetime), 22 lines (IC22, 275 days lifetime in 2007) and 40 lines (IC40, 365 days lifetime
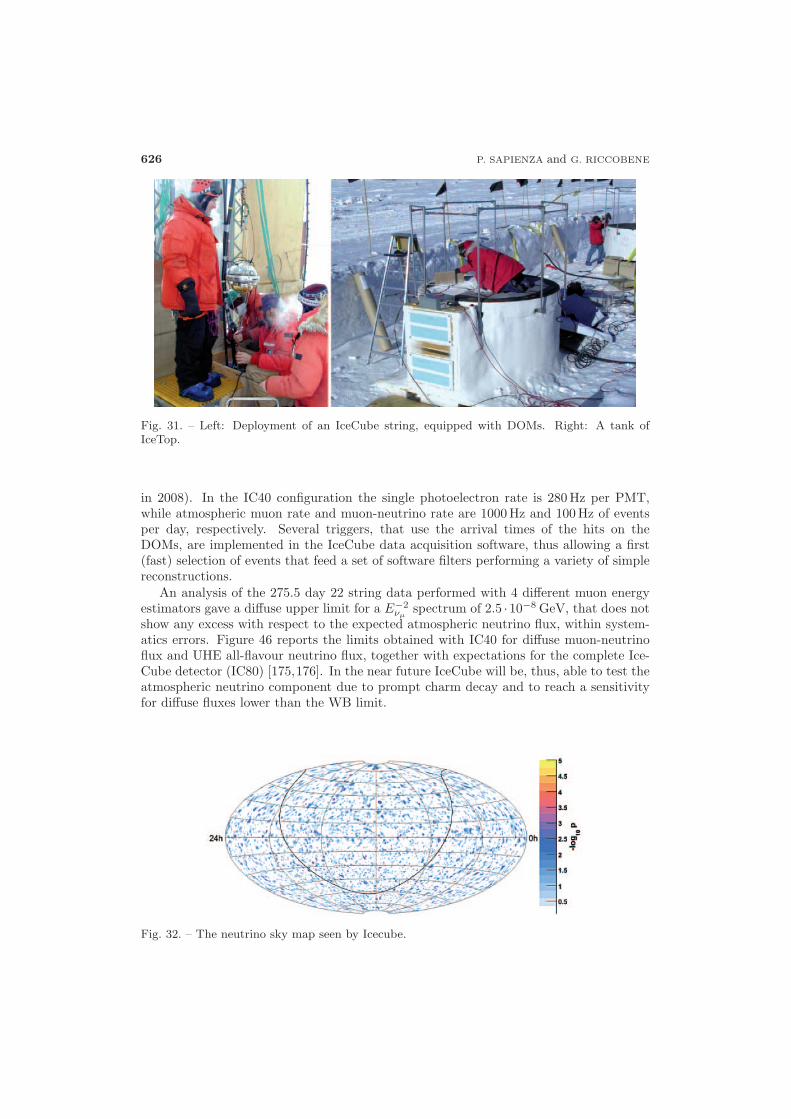
626 P. SAPIENZA and G. RICCOBENE
Fig. 31. – Left: Deployment of an IceCube string, equipped with DOMs. Right: A tank ofIceTop.
in 2008). In the IC40 configuration the single photoelectron rate is 280 Hz per PMT,while atmospheric muon rate and muon-neutrino rate are 1000 Hz and 100 Hz of eventsper day, respectively. Several triggers, that use the arrival times of the hits on theDOMs, are implemented in the IceCube data acquisition software, thus allowing a first(fast) selection of events that feed a set of software filters performing a variety of simplereconstructions.
An analysis of the 275.5 day 22 string data performed with 4 different muon energyestimators gave a diffuse upper limit for a E−2
νμspectrum of 2.5 ·10−8 GeV, that does not
show any excess with respect to the expected atmospheric neutrino flux, within system-atics errors. Figure 46 reports the limits obtained with IC40 for diffuse muon-neutrinoflux and UHE all-flavour neutrino flux, together with expectations for the complete Ice-Cube detector (IC80) [175,176]. In the near future IceCube will be, thus, able to test theatmospheric neutrino component due to prompt charm decay and to reach a sensitivityfor diffuse fluxes lower than the WB limit.
Fig. 32. – The neutrino sky map seen by Icecube.
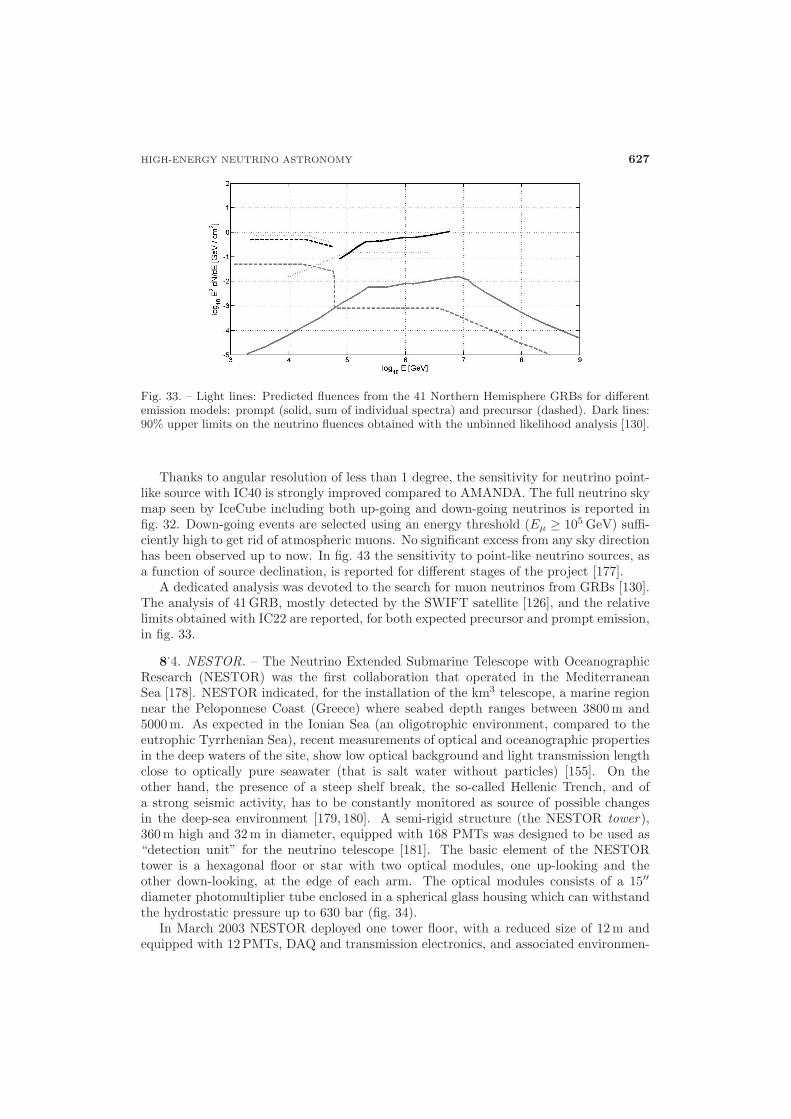
HIGH-ENERGY NEUTRINO ASTRONOMY 627
Fig. 33. – Light lines: Predicted fluences from the 41 Northern Hemisphere GRBs for differentemission models: prompt (solid, sum of individual spectra) and precursor (dashed). Dark lines:90% upper limits on the neutrino fluences obtained with the unbinned likelihood analysis [130].
Thanks to angular resolution of less than 1 degree, the sensitivity for neutrino point-like source with IC40 is strongly improved compared to AMANDA. The full neutrino skymap seen by IceCube including both up-going and down-going neutrinos is reported infig. 32. Down-going events are selected using an energy threshold (Eμ ≥ 105 GeV) suffi-ciently high to get rid of atmospheric muons. No significant excess from any sky directionhas been observed up to now. In fig. 43 the sensitivity to point-like neutrino sources, asa function of source declination, is reported for different stages of the project [177].
A dedicated analysis was devoted to the search for muon neutrinos from GRBs [130].The analysis of 41 GRB, mostly detected by the SWIFT satellite [126], and the relativelimits obtained with IC22 are reported, for both expected precursor and prompt emission,in fig. 33.
8.4. NESTOR. – The Neutrino Extended Submarine Telescope with OceanographicResearch (NESTOR) was the first collaboration that operated in the MediterraneanSea [178]. NESTOR indicated, for the installation of the km3 telescope, a marine regionnear the Peloponnese Coast (Greece) where seabed depth ranges between 3800 m and5000 m. As expected in the Ionian Sea (an oligotrophic environment, compared to theeutrophic Tyrrhenian Sea), recent measurements of optical and oceanographic propertiesin the deep waters of the site, show low optical background and light transmission lengthclose to optically pure seawater (that is salt water without particles) [155]. On theother hand, the presence of a steep shelf break, the so-called Hellenic Trench, and ofa strong seismic activity, has to be constantly monitored as source of possible changesin the deep-sea environment [179, 180]. A semi-rigid structure (the NESTOR tower),360 m high and 32 m in diameter, equipped with 168 PMTs was designed to be used as“detection unit” for the neutrino telescope [181]. The basic element of the NESTORtower is a hexagonal floor or star with two optical modules, one up-looking and theother down-looking, at the edge of each arm. The optical modules consists of a 15′′
diameter photomultiplier tube enclosed in a spherical glass housing which can withstandthe hydrostatic pressure up to 630 bar (fig. 34).
In March 2003 NESTOR deployed one tower floor, with a reduced size of 12 m andequipped with 12 PMTs, DAQ and transmission electronics, and associated environmen-

628 P. SAPIENZA and G. RICCOBENE
Fig. 34. – Concept of the NESTOR tower.
tal sensors. The electronics is placed at the center of the floor, housed in a 1 meterdiameter titanium sphere. The cable for connection to shore, previously deployed at3850 and connected to the off-shore station, was brought to the surface so that the floorwas attached, cabled and redeployed to a depth of 3800 m [182]. This array was opera-tional for about one month and the 745 down-going muon reconstructed events allowedto measure the cosmic-ray muon flux at the installation depth. As shown in fig. 35, good
Fig. 35. – Distribution of the zenith angle of reconstructed tracks for the data (open triangles)and Monte Carlo (solid points) event samples [183].
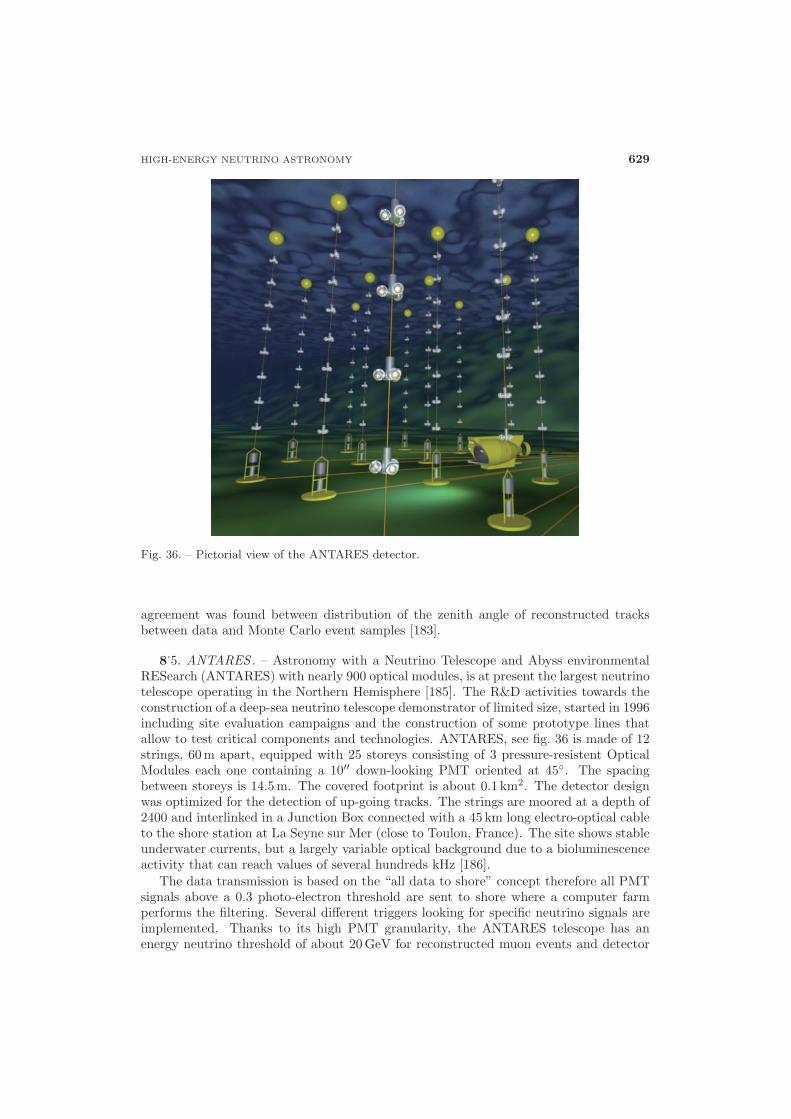
HIGH-ENERGY NEUTRINO ASTRONOMY 629
Fig. 36. – Pictorial view of the ANTARES detector.
agreement was found between distribution of the zenith angle of reconstructed tracksbetween data and Monte Carlo event samples [183].
8.5. ANTARES . – Astronomy with a Neutrino Telescope and Abyss environmentalRESearch (ANTARES) with nearly 900 optical modules, is at present the largest neutrinotelescope operating in the Northern Hemisphere [185]. The R&D activities towards theconstruction of a deep-sea neutrino telescope demonstrator of limited size, started in 1996including site evaluation campaigns and the construction of some prototype lines thatallow to test critical components and technologies. ANTARES, see fig. 36 is made of 12strings, 60 m apart, equipped with 25 storeys consisting of 3 pressure-resistent OpticalModules each one containing a 10′′ down-looking PMT oriented at 45◦. The spacingbetween storeys is 14.5 m. The covered footprint is about 0.1 km2. The detector designwas optimized for the detection of up-going tracks. The strings are moored at a depth of2400 and interlinked in a Junction Box connected with a 45 km long electro-optical cableto the shore station at La Seyne sur Mer (close to Toulon, France). The site shows stableunderwater currents, but a largely variable optical background due to a bioluminescenceactivity that can reach values of several hundreds kHz [186].
The data transmission is based on the “all data to shore” concept therefore all PMTsignals above a 0.3 photo-electron threshold are sent to shore where a computer farmperforms the filtering. Several different triggers looking for specific neutrino signals areimplemented. Thanks to its high PMT granularity, the ANTARES telescope has anenergy neutrino threshold of about 20 GeV for reconstructed muon events and detector
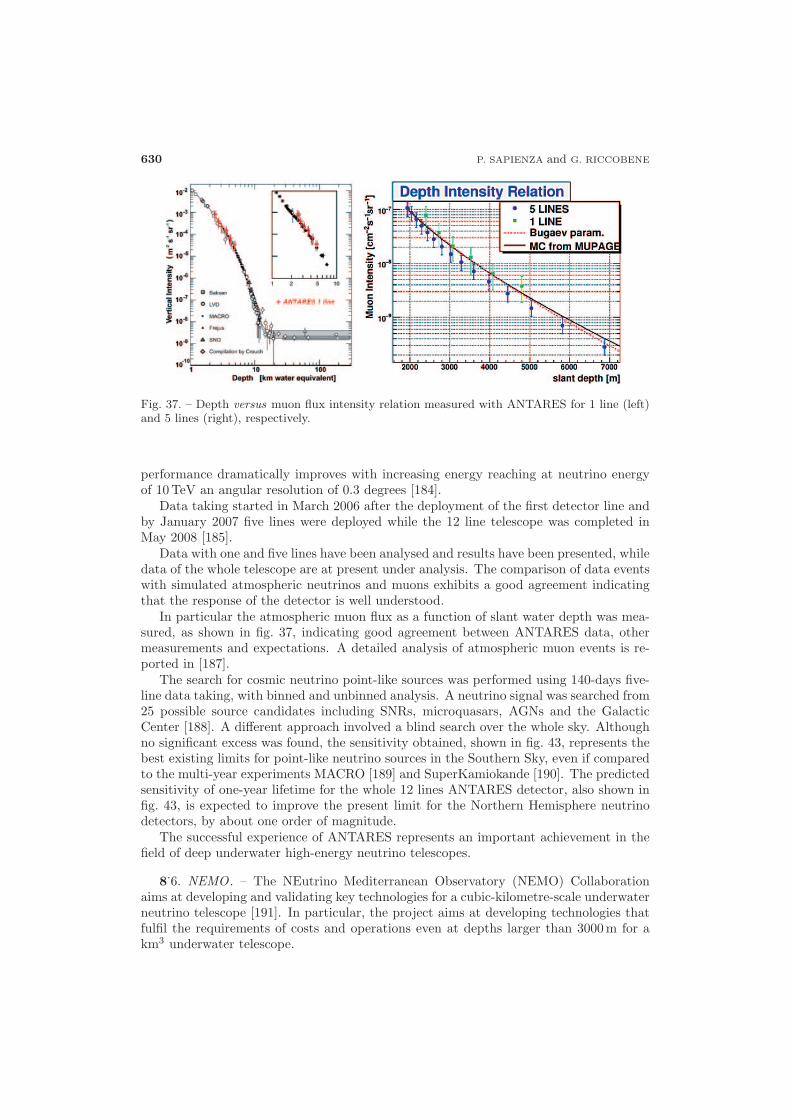
630 P. SAPIENZA and G. RICCOBENE
Fig. 37. – Depth versus muon flux intensity relation measured with ANTARES for 1 line (left)and 5 lines (right), respectively.
performance dramatically improves with increasing energy reaching at neutrino energyof 10 TeV an angular resolution of 0.3 degrees [184].
Data taking started in March 2006 after the deployment of the first detector line andby January 2007 five lines were deployed while the 12 line telescope was completed inMay 2008 [185].
Data with one and five lines have been analysed and results have been presented, whiledata of the whole telescope are at present under analysis. The comparison of data eventswith simulated atmospheric neutrinos and muons exhibits a good agreement indicatingthat the response of the detector is well understood.
In particular the atmospheric muon flux as a function of slant water depth was mea-sured, as shown in fig. 37, indicating good agreement between ANTARES data, othermeasurements and expectations. A detailed analysis of atmospheric muon events is re-ported in [187].
The search for cosmic neutrino point-like sources was performed using 140-days five-line data taking, with binned and unbinned analysis. A neutrino signal was searched from25 possible source candidates including SNRs, microquasars, AGNs and the GalacticCenter [188]. A different approach involved a blind search over the whole sky. Althoughno significant excess was found, the sensitivity obtained, shown in fig. 43, represents thebest existing limits for point-like neutrino sources in the Southern Sky, even if comparedto the multi-year experiments MACRO [189] and SuperKamiokande [190]. The predictedsensitivity of one-year lifetime for the whole 12 lines ANTARES detector, also shown infig. 43, is expected to improve the present limit for the Northern Hemisphere neutrinodetectors, by about one order of magnitude.
The successful experience of ANTARES represents an important achievement in thefield of deep underwater high-energy neutrino telescopes.
8.6. NEMO . – The NEutrino Mediterranean Observatory (NEMO) Collaborationaims at developing and validating key technologies for a cubic-kilometre-scale underwaterneutrino telescope [191]. In particular, the project aims at developing technologies thatfulfil the requirements of costs and operations even at depths larger than 3000 m for akm3 underwater telescope.
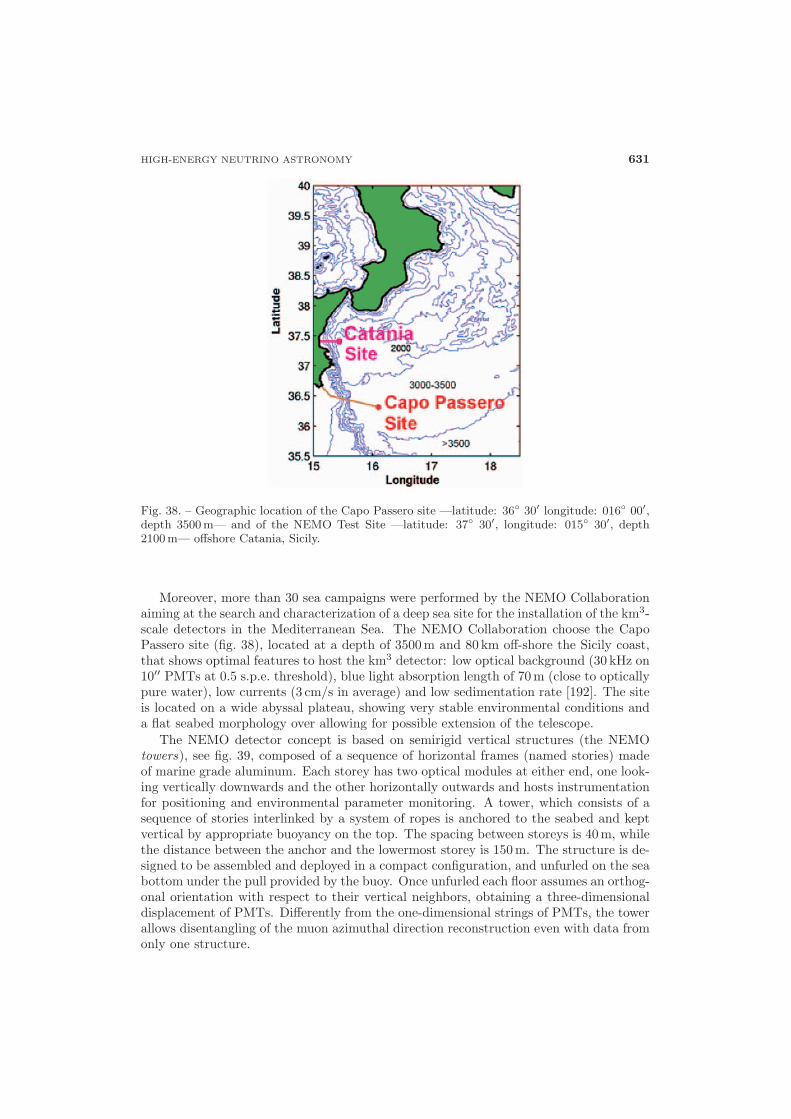
HIGH-ENERGY NEUTRINO ASTRONOMY 631
Fig. 38. – Geographic location of the Capo Passero site —latitude: 36◦ 30′ longitude: 016◦ 00′,depth 3500 m— and of the NEMO Test Site —latitude: 37◦ 30′, longitude: 015◦ 30′, depth2100m— offshore Catania, Sicily.
Moreover, more than 30 sea campaigns were performed by the NEMO Collaborationaiming at the search and characterization of a deep sea site for the installation of the km3-scale detectors in the Mediterranean Sea. The NEMO Collaboration choose the CapoPassero site (fig. 38), located at a depth of 3500 m and 80 km off-shore the Sicily coast,that shows optimal features to host the km3 detector: low optical background (30 kHz on10′′ PMTs at 0.5 s.p.e. threshold), blue light absorption length of 70 m (close to opticallypure water), low currents (3 cm/s in average) and low sedimentation rate [192]. The siteis located on a wide abyssal plateau, showing very stable environmental conditions anda flat seabed morphology over allowing for possible extension of the telescope.
The NEMO detector concept is based on semirigid vertical structures (the NEMOtowers), see fig. 39, composed of a sequence of horizontal frames (named stories) madeof marine grade aluminum. Each storey has two optical modules at either end, one look-ing vertically downwards and the other horizontally outwards and hosts instrumentationfor positioning and environmental parameter monitoring. A tower, which consists of asequence of stories interlinked by a system of ropes is anchored to the seabed and keptvertical by appropriate buoyancy on the top. The spacing between storeys is 40 m, whilethe distance between the anchor and the lowermost storey is 150 m. The structure is de-signed to be assembled and deployed in a compact configuration, and unfurled on the seabottom under the pull provided by the buoy. Once unfurled each floor assumes an orthog-onal orientation with respect to their vertical neighbors, obtaining a three-dimensionaldisplacement of PMTs. Differently from the one-dimensional strings of PMTs, the towerallows disentangling of the muon azimuthal direction reconstruction even with data fromonly one structure.
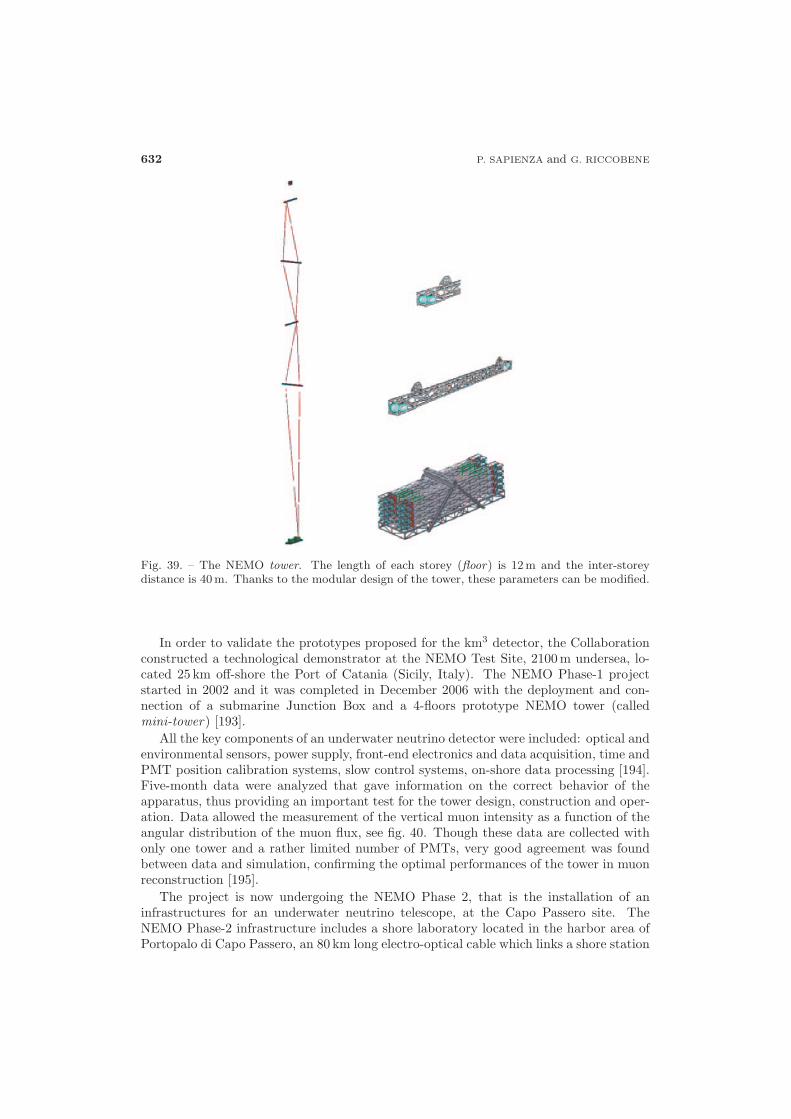
632 P. SAPIENZA and G. RICCOBENE
Fig. 39. – The NEMO tower. The length of each storey (floor) is 12 m and the inter-storeydistance is 40 m. Thanks to the modular design of the tower, these parameters can be modified.
In order to validate the prototypes proposed for the km3 detector, the Collaborationconstructed a technological demonstrator at the NEMO Test Site, 2100 m undersea, lo-cated 25 km off-shore the Port of Catania (Sicily, Italy). The NEMO Phase-1 projectstarted in 2002 and it was completed in December 2006 with the deployment and con-nection of a submarine Junction Box and a 4-floors prototype NEMO tower (calledmini-tower) [193].
All the key components of an underwater neutrino detector were included: optical andenvironmental sensors, power supply, front-end electronics and data acquisition, time andPMT position calibration systems, slow control systems, on-shore data processing [194].Five-month data were analyzed that gave information on the correct behavior of theapparatus, thus providing an important test for the tower design, construction and oper-ation. Data allowed the measurement of the vertical muon intensity as a function of theangular distribution of the muon flux, see fig. 40. Though these data are collected withonly one tower and a rather limited number of PMTs, very good agreement was foundbetween data and simulation, confirming the optimal performances of the tower in muonreconstruction [195].
The project is now undergoing the NEMO Phase 2, that is the installation of aninfrastructures for an underwater neutrino telescope, at the Capo Passero site. TheNEMO Phase-2 infrastructure includes a shore laboratory located in the harbor area ofPortopalo di Capo Passero, an 80 km long electro-optical cable which links a shore station

HIGH-ENERGY NEUTRINO ASTRONOMY 633
Fig. 40. – Atmospheric muon flux as a function of slant depth measured with the NEMO Phase-1detector. Data from previous measurements and the parameterization of Bugaev are also re-ported for comparison.
to the underwater infrastructure, consisting of a main Junction Box (JB) used to connectdetector prototypes and structures. The JB receives 10 kVDC from shore and distributes400 VDC power supply to the underwater instrumentation. The total available powerfor Phase-2 project is 10 kW, to be soon implemented up to 60 kW. The experiencegained with the NEMO Phase 1 led to a revision of the NEMO tower design aimed atsimplifying the tower integration and reducing construction costs. In 2010, a prototypaltower, taken into consideration for the KM3NeT telescope as a complete prototype ofdetection unit, will be constructed and eventually deployed in the Capo Passero site. Thetower will be equipped with 20 stories of 6 meters length, optical modules, environmentalsensors, hydrophones, data acquisition and transmission electronics, power supply anddistribution electronics, and a electro-optical cabling system [191].
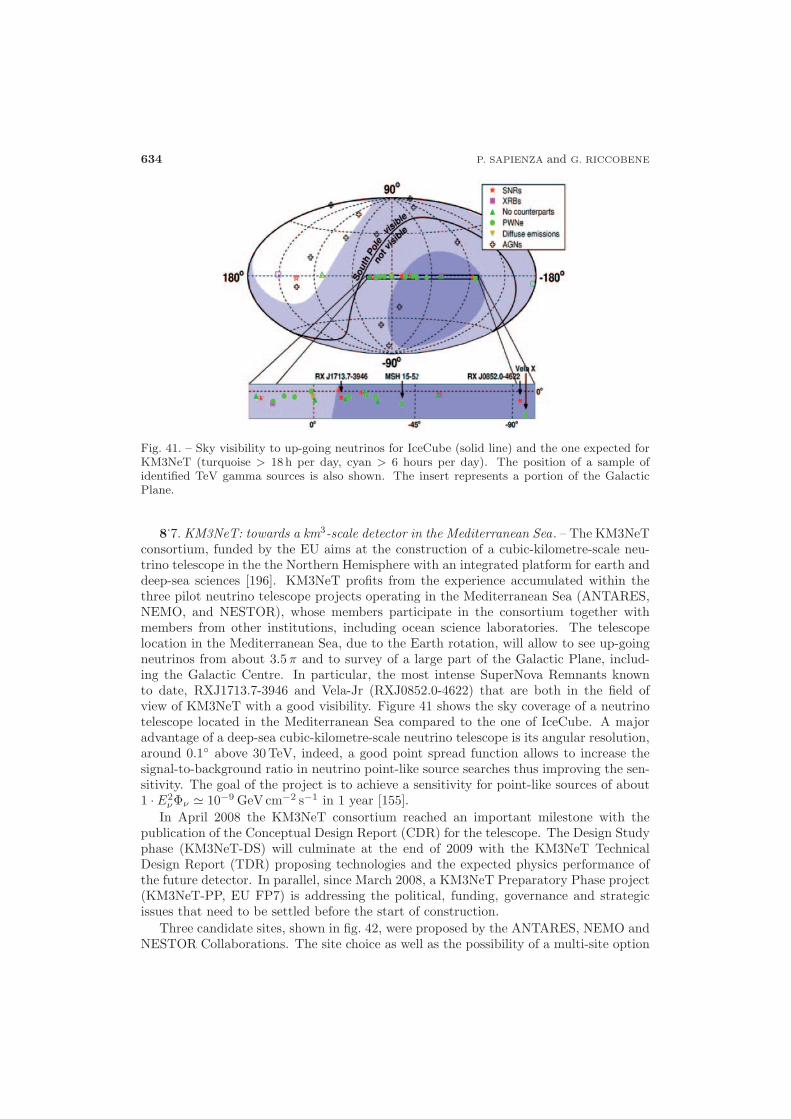
634 P. SAPIENZA and G. RICCOBENE
Fig. 41. – Sky visibility to up-going neutrinos for IceCube (solid line) and the one expected forKM3NeT (turquoise > 18 h per day, cyan > 6 hours per day). The position of a sample ofidentified TeV gamma sources is also shown. The insert represents a portion of the GalacticPlane.
8.7. KM3NeT: towards a km3-scale detector in the Mediterranean Sea. – The KM3NeTconsortium, funded by the EU aims at the construction of a cubic-kilometre-scale neu-trino telescope in the the Northern Hemisphere with an integrated platform for earth anddeep-sea sciences [196]. KM3NeT profits from the experience accumulated within thethree pilot neutrino telescope projects operating in the Mediterranean Sea (ANTARES,NEMO, and NESTOR), whose members participate in the consortium together withmembers from other institutions, including ocean science laboratories. The telescopelocation in the Mediterranean Sea, due to the Earth rotation, will allow to see up-goingneutrinos from about 3.5π and to survey of a large part of the Galactic Plane, includ-ing the Galactic Centre. In particular, the most intense SuperNova Remnants knownto date, RXJ1713.7-3946 and Vela-Jr (RXJ0852.0-4622) that are both in the field ofview of KM3NeT with a good visibility. Figure 41 shows the sky coverage of a neutrinotelescope located in the Mediterranean Sea compared to the one of IceCube. A majoradvantage of a deep-sea cubic-kilometre-scale neutrino telescope is its angular resolution,around 0.1◦ above 30 TeV, indeed, a good point spread function allows to increase thesignal-to-background ratio in neutrino point-like source searches thus improving the sen-sitivity. The goal of the project is to achieve a sensitivity for point-like sources of about1 · E2
νΦν � 10−9 GeV cm−2 s−1 in 1 year [155].In April 2008 the KM3NeT consortium reached an important milestone with the
publication of the Conceptual Design Report (CDR) for the telescope. The Design Studyphase (KM3NeT-DS) will culminate at the end of 2009 with the KM3NeT TechnicalDesign Report (TDR) proposing technologies and the expected physics performance ofthe future detector. In parallel, since March 2008, a KM3NeT Preparatory Phase project(KM3NeT-PP, EU FP7) is addressing the political, funding, governance and strategicissues that need to be settled before the start of construction.
Three candidate sites, shown in fig. 42, were proposed by the ANTARES, NEMO andNESTOR Collaborations. The site choice as well as the possibility of a multi-site option
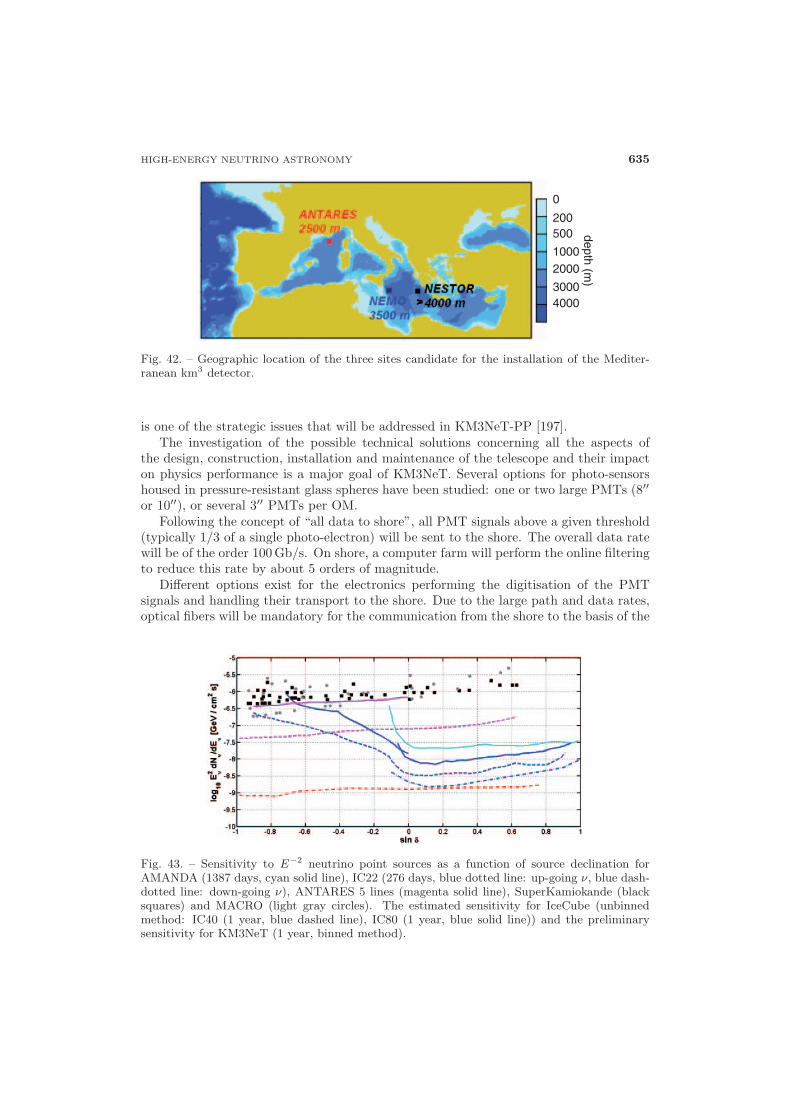
HIGH-ENERGY NEUTRINO ASTRONOMY 635
0
200500
10002000
30004000
depth (m)
Fig. 42. – Geographic location of the three sites candidate for the installation of the Mediter-ranean km3 detector.
is one of the strategic issues that will be addressed in KM3NeT-PP [197].The investigation of the possible technical solutions concerning all the aspects of
the design, construction, installation and maintenance of the telescope and their impacton physics performance is a major goal of KM3NeT. Several options for photo-sensorshoused in pressure-resistant glass spheres have been studied: one or two large PMTs (8′′
or 10′′), or several 3′′ PMTs per OM.Following the concept of “all data to shore”, all PMT signals above a given threshold
(typically 1/3 of a single photo-electron) will be sent to the shore. The overall data ratewill be of the order 100 Gb/s. On shore, a computer farm will perform the online filteringto reduce this rate by about 5 orders of magnitude.
Different options exist for the electronics performing the digitisation of the PMTsignals and handling their transport to the shore. Due to the large path and data rates,optical fibers will be mandatory for the communication from the shore to the basis of the
Fig. 43. – Sensitivity to E−2 neutrino point sources as a function of source declination forAMANDA (1387 days, cyan solid line), IC22 (276 days, blue dotted line: up-going ν, blue dash-dotted line: down-going ν), ANTARES 5 lines (magenta solid line), SuperKamiokande (blacksquares) and MACRO (light gray circles). The estimated sensitivity for IceCube (unbinnedmethod: IC40 (1 year, blue dashed line), IC80 (1 year, blue solid line)) and the preliminarysensitivity for KM3NeT (1 year, binned method).
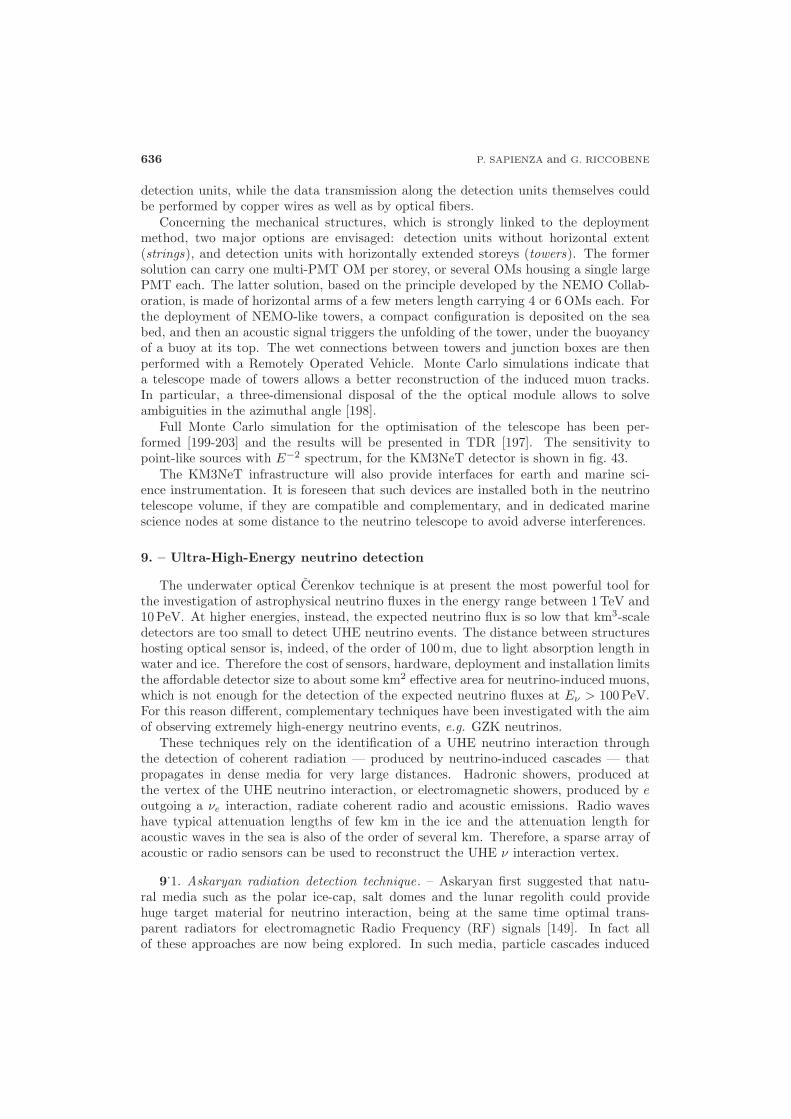
636 P. SAPIENZA and G. RICCOBENE
detection units, while the data transmission along the detection units themselves couldbe performed by copper wires as well as by optical fibers.
Concerning the mechanical structures, which is strongly linked to the deploymentmethod, two major options are envisaged: detection units without horizontal extent(strings), and detection units with horizontally extended storeys (towers). The formersolution can carry one multi-PMT OM per storey, or several OMs housing a single largePMT each. The latter solution, based on the principle developed by the NEMO Collab-oration, is made of horizontal arms of a few meters length carrying 4 or 6 OMs each. Forthe deployment of NEMO-like towers, a compact configuration is deposited on the seabed, and then an acoustic signal triggers the unfolding of the tower, under the buoyancyof a buoy at its top. The wet connections between towers and junction boxes are thenperformed with a Remotely Operated Vehicle. Monte Carlo simulations indicate thata telescope made of towers allows a better reconstruction of the induced muon tracks.In particular, a three-dimensional disposal of the the optical module allows to solveambiguities in the azimuthal angle [198].
Full Monte Carlo simulation for the optimisation of the telescope has been per-formed [199-203] and the results will be presented in TDR [197]. The sensitivity topoint-like sources with E−2 spectrum, for the KM3NeT detector is shown in fig. 43.
The KM3NeT infrastructure will also provide interfaces for earth and marine sci-ence instrumentation. It is foreseen that such devices are installed both in the neutrinotelescope volume, if they are compatible and complementary, and in dedicated marinescience nodes at some distance to the neutrino telescope to avoid adverse interferences.
9. – Ultra-High-Energy neutrino detection
The underwater optical Cerenkov technique is at present the most powerful tool forthe investigation of astrophysical neutrino fluxes in the energy range between 1 TeV and10 PeV. At higher energies, instead, the expected neutrino flux is so low that km3-scaledetectors are too small to detect UHE neutrino events. The distance between structureshosting optical sensor is, indeed, of the order of 100 m, due to light absorption length inwater and ice. Therefore the cost of sensors, hardware, deployment and installation limitsthe affordable detector size to about some km2 effective area for neutrino-induced muons,which is not enough for the detection of the expected neutrino fluxes at Eν > 100 PeV.For this reason different, complementary techniques have been investigated with the aimof observing extremely high-energy neutrino events, e.g. GZK neutrinos.
These techniques rely on the identification of a UHE neutrino interaction throughthe detection of coherent radiation — produced by neutrino-induced cascades — thatpropagates in dense media for very large distances. Hadronic showers, produced atthe vertex of the UHE neutrino interaction, or electromagnetic showers, produced by eoutgoing a νe interaction, radiate coherent radio and acoustic emissions. Radio waveshave typical attenuation lengths of few km in the ice and the attenuation length foracoustic waves in the sea is also of the order of several km. Therefore, a sparse array ofacoustic or radio sensors can be used to reconstruct the UHE ν interaction vertex.
9.1. Askaryan radiation detection technique. – Askaryan first suggested that natu-ral media such as the polar ice-cap, salt domes and the lunar regolith could providehuge target material for neutrino interaction, being at the same time optimal trans-parent radiators for electromagnetic Radio Frequency (RF) signals [149]. In fact allof these approaches are now being explored. In such media, particle cascades induced
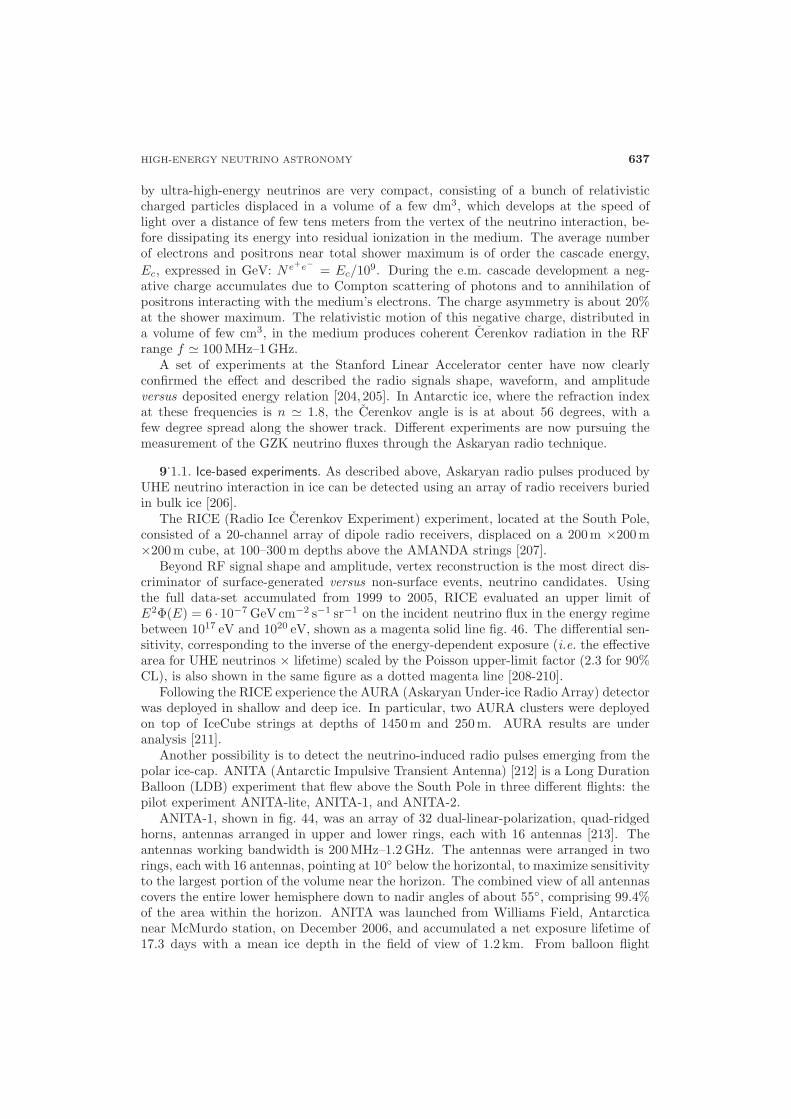
HIGH-ENERGY NEUTRINO ASTRONOMY 637
by ultra-high-energy neutrinos are very compact, consisting of a bunch of relativisticcharged particles displaced in a volume of a few dm3, which develops at the speed oflight over a distance of few tens meters from the vertex of the neutrino interaction, be-fore dissipating its energy into residual ionization in the medium. The average numberof electrons and positrons near total shower maximum is of order the cascade energy,Ec, expressed in GeV: Ne+e−
= Ec/109. During the e.m. cascade development a neg-ative charge accumulates due to Compton scattering of photons and to annihilation ofpositrons interacting with the medium’s electrons. The charge asymmetry is about 20%at the shower maximum. The relativistic motion of this negative charge, distributed ina volume of few cm3, in the medium produces coherent Cerenkov radiation in the RFrange f � 100 MHz–1 GHz.
A set of experiments at the Stanford Linear Accelerator center have now clearlyconfirmed the effect and described the radio signals shape, waveform, and amplitudeversus deposited energy relation [204, 205]. In Antarctic ice, where the refraction indexat these frequencies is n � 1.8, the Cerenkov angle is is at about 56 degrees, with afew degree spread along the shower track. Different experiments are now pursuing themeasurement of the GZK neutrino fluxes through the Askaryan radio technique.
9.1.1. Ice-based experiments. As described above, Askaryan radio pulses produced byUHE neutrino interaction in ice can be detected using an array of radio receivers buriedin bulk ice [206].
The RICE (Radio Ice Cerenkov Experiment) experiment, located at the South Pole,consisted of a 20-channel array of dipole radio receivers, displaced on a 200 m ×200 m×200 m cube, at 100–300 m depths above the AMANDA strings [207].
Beyond RF signal shape and amplitude, vertex reconstruction is the most direct dis-criminator of surface-generated versus non-surface events, neutrino candidates. Usingthe full data-set accumulated from 1999 to 2005, RICE evaluated an upper limit ofE2Φ(E) = 6 · 10−7 GeV cm−2 s−1 sr−1 on the incident neutrino flux in the energy regimebetween 1017 eV and 1020 eV, shown as a magenta solid line fig. 46. The differential sen-sitivity, corresponding to the inverse of the energy-dependent exposure (i.e. the effectivearea for UHE neutrinos × lifetime) scaled by the Poisson upper-limit factor (2.3 for 90%CL), is also shown in the same figure as a dotted magenta line [208-210].
Following the RICE experience the AURA (Askaryan Under-ice Radio Array) detectorwas deployed in shallow and deep ice. In particular, two AURA clusters were deployedon top of IceCube strings at depths of 1450 m and 250 m. AURA results are underanalysis [211].
Another possibility is to detect the neutrino-induced radio pulses emerging from thepolar ice-cap. ANITA (Antarctic Impulsive Transient Antenna) [212] is a Long DurationBalloon (LDB) experiment that flew above the South Pole in three different flights: thepilot experiment ANITA-lite, ANITA-1, and ANITA-2.
ANITA-1, shown in fig. 44, was an array of 32 dual-linear-polarization, quad-ridgedhorns, antennas arranged in upper and lower rings, each with 16 antennas [213]. Theantennas working bandwidth is 200 MHz–1.2 GHz. The antennas were arranged in tworings, each with 16 antennas, pointing at 10◦ below the horizontal, to maximize sensitivityto the largest portion of the volume near the horizon. The combined view of all antennascovers the entire lower hemisphere down to nadir angles of about 55◦, comprising 99.4%of the area within the horizon. ANITA was launched from Williams Field, Antarcticanear McMurdo station, on December 2006, and accumulated a net exposure lifetime of17.3 days with a mean ice depth in the field of view of 1.2 km. From balloon flight
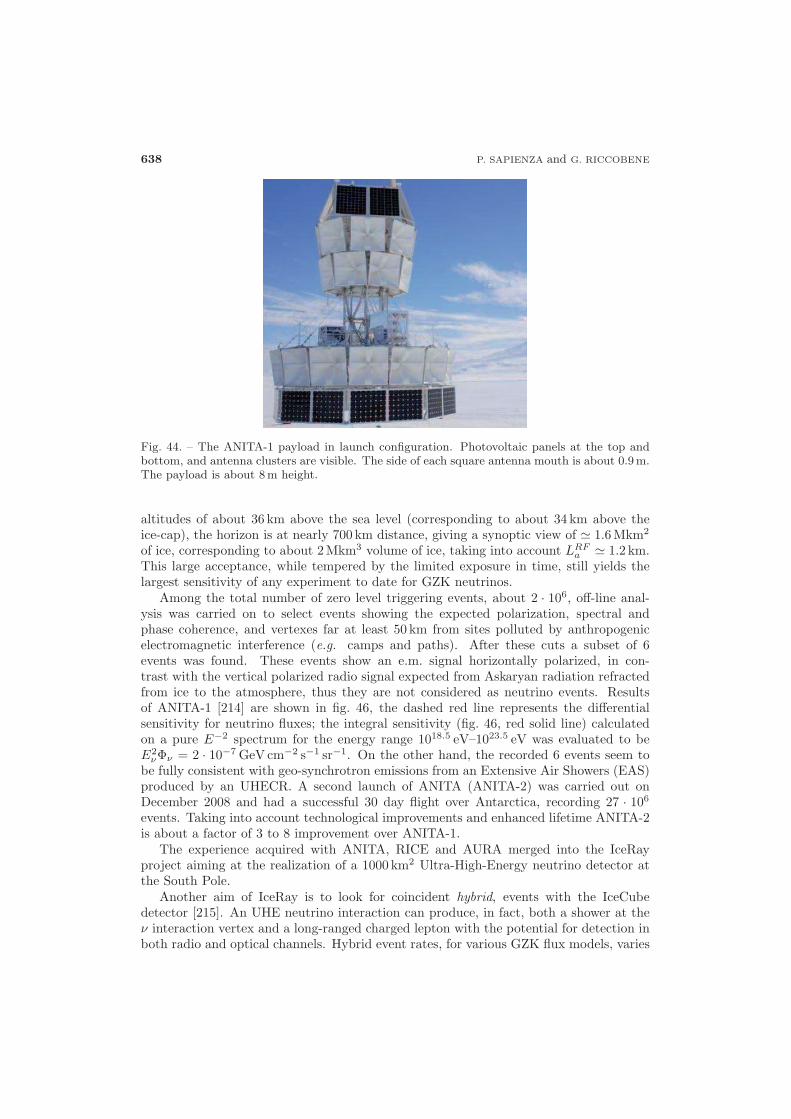
638 P. SAPIENZA and G. RICCOBENE
Fig. 44. – The ANITA-1 payload in launch configuration. Photovoltaic panels at the top andbottom, and antenna clusters are visible. The side of each square antenna mouth is about 0.9 m.The payload is about 8 m height.
altitudes of about 36 km above the sea level (corresponding to about 34 km above theice-cap), the horizon is at nearly 700 km distance, giving a synoptic view of � 1.6 Mkm2
of ice, corresponding to about 2 Mkm3 volume of ice, taking into account LRFa � 1.2 km.
This large acceptance, while tempered by the limited exposure in time, still yields thelargest sensitivity of any experiment to date for GZK neutrinos.
Among the total number of zero level triggering events, about 2 · 106, off-line anal-ysis was carried on to select events showing the expected polarization, spectral andphase coherence, and vertexes far at least 50 km from sites polluted by anthropogenicelectromagnetic interference (e.g. camps and paths). After these cuts a subset of 6events was found. These events show an e.m. signal horizontally polarized, in con-trast with the vertical polarized radio signal expected from Askaryan radiation refractedfrom ice to the atmosphere, thus they are not considered as neutrino events. Resultsof ANITA-1 [214] are shown in fig. 46, the dashed red line represents the differentialsensitivity for neutrino fluxes; the integral sensitivity (fig. 46, red solid line) calculatedon a pure E−2 spectrum for the energy range 1018.5 eV–1023.5 eV was evaluated to beE2
νΦν = 2 · 10−7 GeVcm−2 s−1 sr−1. On the other hand, the recorded 6 events seem tobe fully consistent with geo-synchrotron emissions from an Extensive Air Showers (EAS)produced by an UHECR. A second launch of ANITA (ANITA-2) was carried out onDecember 2008 and had a successful 30 day flight over Antarctica, recording 27 · 106
events. Taking into account technological improvements and enhanced lifetime ANITA-2is about a factor of 3 to 8 improvement over ANITA-1.
The experience acquired with ANITA, RICE and AURA merged into the IceRayproject aiming at the realization of a 1000 km2 Ultra-High-Energy neutrino detector atthe South Pole.
Another aim of IceRay is to look for coincident hybrid, events with the IceCubedetector [215]. An UHE neutrino interaction can produce, in fact, both a shower at theν interaction vertex and a long-ranged charged lepton with the potential for detection inboth radio and optical channels. Hybrid event rates, for various GZK flux models, varies

HIGH-ENERGY NEUTRINO ASTRONOMY 639
from few to about ten in a ten-year live-time. Despite such events are very rare, they arebackground-free, and would allow cross-calibration of the energy scale between IceCubeand IceRay. Moreover the detection of these events in coincidence with the IceCubeneutrino detector, will allow complete calorimetry, as described in subsect. 9.3 [216].IceRay, as a first stage, aims at building a 50 km2 array with the maximum sensitivity inthe energy region of the GZK neutrino flux, around 1018 eV. Each station consists of threeholes separated by 5–10 m, with four antennas (two of each polarization, horizontal andvertical) in each hole. Event directionality can be obtained even from a single-station. Atest-bed IceRay station, consisting of 4 antennas, was deployed in austral summer 2009.The test-bed will provide year-round monitoring of the radio environment at the SouthPole and it will facilitate further development of the 50 km2 array.
9.2. Moon radio Cerenkov observations. – As suggested by Dagkesamanskii andZheleznykh, observations of the Moon with ground-based radio-telescopes can be usedto search for cascades produced by UHE neutrino interactions. At UHE the neutrino-nucleon cross-section is such that neutrinos traversing the lunar diameter are severelyattenuated. This causes the appearance of GHz Cerenkov signals originated almost en-tirely from the limb of the Moon [217].
The first attempt to use the lunar regolith in the search for UHE neutrinos was madeat the 64 m Parkes radio telescope, Australia [218]. The Moon was observed for approxi-mately 10.5 hours using a wide-bandwidth dual-polarisation receiver. No real events wereidentified. Subsequently the Goldstone Lunar Ultra-High-Energy Neutrino Experiment(GLUE) [219], ran at NASA Goldstone Deep-Space Communications Complex, USA,and RAMHAND [220], ran at the Kalyazin Radio Astronomical Observatory, Russia,also recorded null results. These results set the first constraints on UHE neutrino fluxmodels such as Z-Bursts and Topological Defects.
The future plan for lunar Cherenkov observations foresee the utilisation of the plannedSKA (Square Kilometre Array) radio array. In order to improve real-time discriminationof Cherenkov pulses from background noise and terrestrial radio-frequency interference,the full capabilities offered of such instruments in nano-second pulse detection will haveto be exploited. This will require the latest in signal processing technology. In parallel,sophisticated simulations should be used to optimise observation parameters such asfrequency, beam pointing position, and bandwidth [221].
9.3. The thermo-acoustic technique. – Another technique for EHE ν detection is basedon the identification of the acoustic signature of neutrino-induced showers in water.Though the studies on this technique are still in an early stage, its potential use to buildvery large neutrino detectors water is appealing, thanks to the optimal properties ofwater as sound propagator [222].
The idea of acoustic neutrino detection, first proposed by Askaryan in 1957 [223],is based on the reconstruction of hadronic and electromagnetic showers produced byneutrino interaction in dense media. As discussed above, both in the case of CC or NCinteraction, the hadronic cascade carries about 25% of the neutrino’s energy. In case ofCC interaction of a νe, an e.m. shower is also produced close to the neutrino interactionvertex. The deposit of the cascade energy in a small volume of water, cylindrical inshape with a length Lc of few tens of metres and a few centimetres in radius rc turns
640 P. SAPIENZA and G. RICCOBENE
out in heating of the medium, therefore in its expansion(5). The typical time of theenergy deposition along the shower axis, almost co-linear with the neutrino direction, isof the order of LC/c � 10−7 s, while the expansion time is of the order of rc/csound �10−4 s. The net result is the coherent production of a mechanical wave, “pancake-shaped”propagating, in a homogeneous medium, perpendicularly to the shower axis.
Acoustic pulses from particle showers were first observed at Brookaven NL in1979 [226], using a beam of 200 MeV protons with a total energy deposit in water ofabout 1018 eV. The pulse amplitude as a function of total energy deposition, watertemperature and pressure was studied. The acoustic pulse production was recently con-firmed by several experiments, using proton beams (in Uppsala and ITEP Moscow) andhigh-intensity laser beams (in Erlangen).
According to Learned’s theoretical work [227], the acoustic pulse is bipolar, followingthe second time derivative of the temperature of the excited medium. The frequencyspectrum of the signal is a function of the transverse spread (rcascade) of the shower,with typical maximum amplitude in the range of few tens kHz. The amplitude of thebipolar signal is proportional to the deposited energy and to the medium properties: thethermal expansion coefficient (β), the sound velocity (cs) and the specific-heat capacity(Cp). A rule of thumb to calculate the acoustic pulse amplitude at 1 metre produced bya neutrino of energy Eν , impinging in a dense medium is
(9) P0 � 0.25 Eν · Γ Eν/Vc � 2 Γ Eν · 10−19 [Pa/eV],
where Vc is the volume of the medium where the shower deposits its energy, the factor0.25 is the fraction of Eν (in units of [eV]) transferred to the shower and Γ = c2
sβ/Cp isthe (dimensionless) Gruneisen coefficient of the medium [228]. The Γ-coefficient for deepMediterranean-Sea water is about 0.12, about a factor ten larger in polar ice and about3.2 in compact mineral salt. Since, at frequencies of few tens kHz, acoustic pulses cantravel large distances in ice, seawater and salt, these natural media can be used to buildlarge volume neutrino detectors instrumented with sparsely spaced arrays of acousticsensors.
Assuming radial propagation of the sound wave and that the sound absorption lengthin water is Lsound
a � 10 km at 20 kHz, the pulse amplitude produced by a Eν = 1020 eVneutrino, recorded at 1 km distance, is expected to be about 15 mPa. Ice, despite theGruneisen coefficient is larger, suffer for a stronger sound absorption (Lsound
a � 300 m,at about 400 m depth) compared to water.
The energy threshold for neutrino acoustic detection is set by the ratio between am-bient noise and signal.
In the frequency range of interest for neutrino detection (10–40 kHz), the acousticambient noise amplitude in deep sea adds up about few mPa. This permits, in a firstapproximation, the discrimination of acoustic signals originated by neutrinos having Eν >1019 eV (assuming 1 km distance). The possibility to use time and direction coincidencecan help to reduce the ambient noise by at least one order of magnitude. The absolutevalue of noise in deep ice has not been yet measured. Present data indicate a decrease
(5) This scenario is valid at energies below the LPM (Landau, Pomeranchuk, Migdal) effectenergy regime [224, 225], E ≥ 1019 eV, that causes a strong reduction of the Bremsstrahlungand pair production cross-sections for e and γ, respectively and, therefore, a lower energy depositper unit of volume.
HIGH-ENERGY NEUTRINO ASTRONOMY 641
of noise amplitude as a function of depth and a Gaussian distribution of amplitudes indeep ice [229].
In both media, moreover, sound refraction must be taken into account. Sound re-fraction is originated by change of sound velocity in the medium as a function of depth,due to different pressure and temperature (in ice and water) and salinity (in sea water).The effect of refraction is that the expected pancake-shaped neutrino-induced wave frontbecomes a hyperboloid in the real case.
Based on the previous considerations several groups have carried out simulations onfuture extremely large acoustic neutrino detectors. It is worth to mention, however, thatacoustic detectors can be hardly used as “telescopes”, due to the poor angular accuracyof the wave front reconstruction (� 10◦).
Calculation performed by the ANTARES [230] and by the AMADEUS [231] groupsindicate that a 1500 km3-detector deployed in deep seawater, made of about 200 sensorsper km3 may reach sensitivity at level of the WB limit for Eν = 1020 eV in few years.A different result was recently presented by the ACORNE group, that simulated the re-sponse of a dense array of 1100 acoustic modules displaced in a 1 km3 volume of seawater,anchored to the structures of a km3 Cerenkov neutrino telescope. Sophisticated acousticsignal identification, based on matched filters, and reconstruction strategy of the acous-tic wavefront geometry should allow to reach a sensitivity close to the Waxman-Bahcalllimit for UHE neutrinos [232] in 10 years of data taking.
Another intriguing possibility is also to use a very large volume array of acousticsensors both as independent detector and as a calorimeter for the (few, but almost back-ground free) UHE neutrino events detected by the km3 telescope. At energies greaterthan 10 PeV, the majority of neutrino-induced muon tracks, reconstructed by the km3
optical telescope, are quasi-horizontal. For these events, the νμN → μX interaction ver-tex is located several km outside the telescope. Clusters of acoustic modules, displaced ina large volume around the km3 telescope, could be able to identify the acoustic signaturegenerated by the hadronic cascade at the ν vertex. Once the ν vertex is located, thusthe muon range is reconstructed, the total energy of the muon crossing the km3 detectorcan be reconstructed. Despite the fact that, for independent acoustic detection, the neu-trino energy threshold is high (Eν > 1018 eV), the time and arrival direction correlationbetween optical and acoustic signals would help to strongly lower the acoustic detectionenergy threshold(6).
Thanks to the possibility to use also the optical, radio and acoustic techniques inice, the SPATS (South Pole Acoustic Test Setup) group —aiming at R&D and tests forthe construction of a large acoustic detector at the South Pole— has simulated a hybriddetector made of 80 IceCube strings plus an external ring of 13 strings deployed in holesat 1 km distance from the centre (2.5 km deep) and 91 radio/acoustic strings with aspacing of 1 km, 1.5 km deep. Monte Carlo simulations predict that, for optimistic GZKneutrino flux models, 16 events per year could be seen by the acoustic detector, and 8 incoincidence with the radio detectors: that would offer the potential for cross-calibrationof signals from the different technologies [233].
On the experimental side, in recent, years the possibility of using hydrophones in-stalled on military array and the infrastructures of new underwater/ice Cerenkov tele-
(6) An improvement of about one order of magnitude is expected using the information ofthe sound wave arrival direction, provided by the optical detector, to reduce the acousticsignal-to-background ratio.
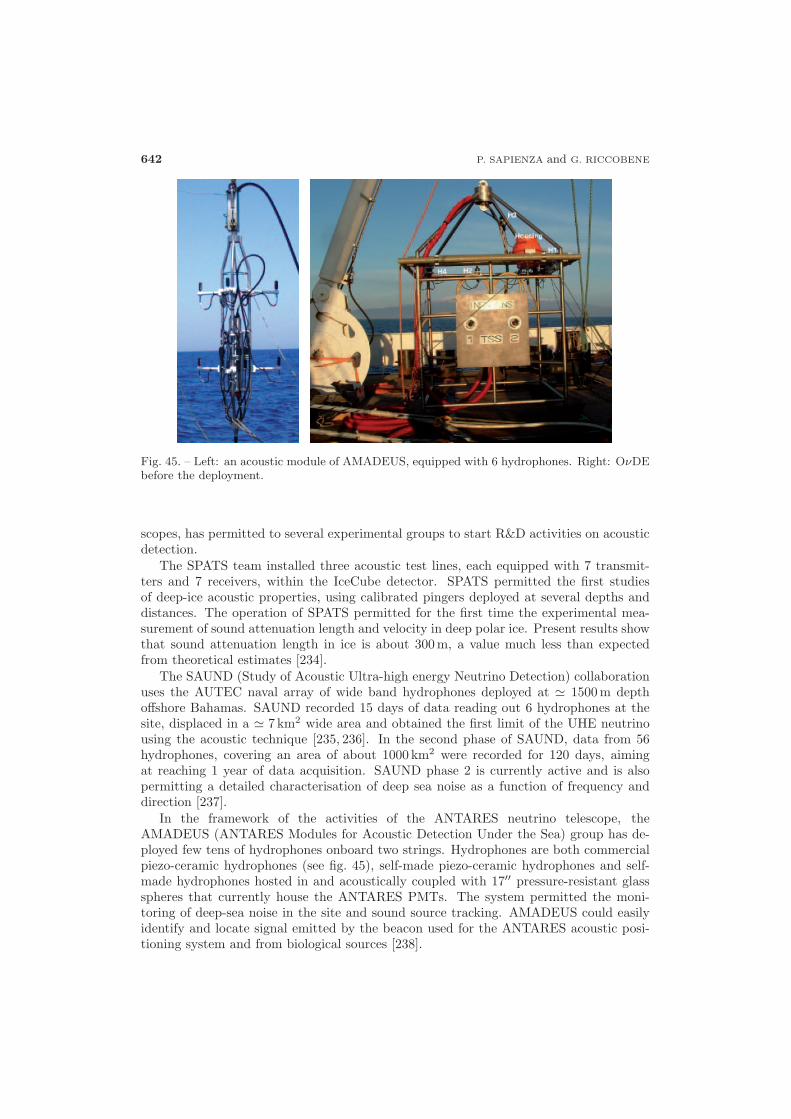
642 P. SAPIENZA and G. RICCOBENE
Fig. 45. – Left: an acoustic module of AMADEUS, equipped with 6 hydrophones. Right: OνDEbefore the deployment.
scopes, has permitted to several experimental groups to start R&D activities on acousticdetection.
The SPATS team installed three acoustic test lines, each equipped with 7 transmit-ters and 7 receivers, within the IceCube detector. SPATS permitted the first studiesof deep-ice acoustic properties, using calibrated pingers deployed at several depths anddistances. The operation of SPATS permitted for the first time the experimental mea-surement of sound attenuation length and velocity in deep polar ice. Present results showthat sound attenuation length in ice is about 300 m, a value much less than expectedfrom theoretical estimates [234].
The SAUND (Study of Acoustic Ultra-high energy Neutrino Detection) collaborationuses the AUTEC naval array of wide band hydrophones deployed at � 1500 m depthoffshore Bahamas. SAUND recorded 15 days of data reading out 6 hydrophones at thesite, displaced in a � 7 km2 wide area and obtained the first limit of the UHE neutrinousing the acoustic technique [235, 236]. In the second phase of SAUND, data from 56hydrophones, covering an area of about 1000 km2 were recorded for 120 days, aimingat reaching 1 year of data acquisition. SAUND phase 2 is currently active and is alsopermitting a detailed characterisation of deep sea noise as a function of frequency anddirection [237].
In the framework of the activities of the ANTARES neutrino telescope, theAMADEUS (ANTARES Modules for Acoustic Detection Under the Sea) group has de-ployed few tens of hydrophones onboard two strings. Hydrophones are both commercialpiezo-ceramic hydrophones (see fig. 45), self-made piezo-ceramic hydrophones and self-made hydrophones hosted in and acoustically coupled with 17′′ pressure-resistant glassspheres that currently house the ANTARES PMTs. The system permitted the moni-toring of deep-sea noise in the site and sound source tracking. AMADEUS could easilyidentify and locate signal emitted by the beacon used for the ANTARES acoustic posi-tioning system and from biological sources [238].

HIGH-ENERGY NEUTRINO ASTRONOMY 643
The NEMO Collaboration is also conducting the first studies for acoustic neutrinodetection. In 2005 the Collaboration deployed OνDE (Ocean Noise Detection Exper-iment) at the NEMO Test Site, 2000 m depth, 25 km off the coast of Sicily. OνDE,that was successfully recovered on April 2008, comprises four hydrophones arranged ona pyramidal-shaped (see fig. 45) mounting and low-cost electronics for data acquisitionand transmission. Data (sampled at 96 kHz and with 24 bit resolution) were transmit-ted in real-time from deep sea and recorder on shore. Acoustic noise was studied as afunction of time, weather conditions, presence of ships and biological sources, with im-portant drawbacks in bio-acoustics [239]. Based on the experience of OνDE, the NEMOCollaboration is designing an innovative acoustic position system for the km3 detectorthat will be installed on the KM3NeT tower prototype to be deployed in Capo Passero.The system, an array about 30 hydrophones, will be able to work both as positioningsystem and acoustic detector, in coincidence with the optical detector [240].
9.4. Neutrino extensive air shower detection. – Another method for looking at UHEneutrinos is the reconstruction of quasi-horizontal extensive atmospheric showers, initi-ated by CC or NC neutrino interaction in very deep atmosphere (close to ground) orlooking at up-going showers in atmosphere initiated by the decay products of an emerg-ing (Earth-skimming) τ lepton, after the propagation and interaction of a UHE ντ insidethe Earth [152].
Analysing atmospheric showers reconstructed by the surface array detector of Auger,a search for UHE neutrinos in the energy range 1017 eV–1019 eV, could be afforded.
Identification of neutrino-induced showers in the much larger background of the onesinitiated by nucleonic cosmic-rays is based on the idea that neutrinos can penetratelarge amounts of matter and generate “young” inclined showers developing close to theground. In contrast UHE nuclei interact within a few tens of g · cm−2 after enteringthe atmosphere, producing “old” showers with shower fronts narrower in time. The FastADC installed on the surface detector tanks, allows to distinguish the narrow signals intime, expected from a shower initiated high in the atmosphere, from the broad signalsexpected from a young shower [241].
On the other hand, air fluorescence detectors, such as HIRES [243, 242] and Auger-FD (Fluorescence Detector), and the Auger-SD (Surface Detector) were used to observeupgoing showers produced by the decay of τ . Tau may originate in the interaction of anupgoing or Earth-skimming ντ close to the Earth surface or inside a mountain.
Contrary to other flavours, in fact, the interaction of a UHE ντ inside the Earthgenerate a τ lepton that decays again in a ντ . This is equivalent to an energy loss processthat ends when the ντ has an energy such that the neutrino absorption length in the Earthis larger than the residual distance between the newly generated ντ and the Earth ground.Assuming a Φν(E) = k · E−2
ν flux Auger obtained a 90% C.L. limit on the all-flavourneutrino flux (using down-going showers) of k < 3.2 · 10−7 GeVcm−2 s−1 sr−1 shown infig. 46. In the same figure is shown the limit for Earth-skimming up-going neutrinosk < 4.7 ÷ 2.5 + 2.2 · 10−8 GeVcm−2 s−1 sr−1, where the upper/lower values correspondto best/worse scenario of systematics. The limit in differential format, proportional tothe inverse of the detector exposure as a function of energy, is also shown to highlightthe energy range at which the detector is more sensitive [244].

644 P. SAPIENZA and G. RICCOBENE
Fig. 46. – Expected HE neutrino fluxes and present limits measured by different experiments.Theoretical atmospheric neutrino flux (light green area): upper line horizontal ν, lower linevertical ν. Waxman Bahcall bound (black solid line). Expected cumulative AGN neutrino fluxes:the blueish area corresponds to maximal-flux models. Expected GRB neutrino flux for Γ = 300and z = 2: the violet area is the sum of different contribution reported in dashed lines; precursor(E < 105 GeV), prompt (105 GeV < E < 108.5 GeV), afterglow (E > 108.5 GeV). ExpectedGZK neutrino flux: the greyish area corresponds to maximal-flux models. Experimental datafrom AMANDA-II (solid cyan line): measured νμ flux (E < 104 GeV), sensitivity to upgoingastrophysical νμ (104 GeV < E < 106.5 GeV), sensitivity to ν-induced cascades (106.5 GeV< E < 1010 GeV). Experimental data from IceCube: IC22 measured νμ flux (blue diamonds),sensitivity to upgoing astrophysical νμ (solid blue line), sensitivity to ν-induced cascades (dashedblue line), expected IC80 sensitivity to astrophysical νμ (dotted blue line). Experimental datafrom RICE: sensitivity to ν-induced cascades (magenta solid line), differential sensitivity toν-induced cascades (magenta dotted line). Experimental data from ANITA: sensitivity to ν-induced cascades (red solid line), differential sensitivity to ν-induced cascades (red dotted line).Experimental data from Auger: sensitivity to upgoing ντ (light green solid line) and downgoingν (dark green solid line), differential sensitivity to ντ -induced cascades (light green dashed line)and downgoing ν (dark green dashed line). Experimental data from HIRES: sensitivity to ντ
(yellow solid line) and νe (orange solid line).
10. – Conclusions
High-energy neutrino telescopes are “discovery” instruments that are expected togather unique pieces of information for the comprehension of the High-Energy Universe.These detectors have high potential to solve several crucial questions in astroparticlephysics such as the origin of Cosmic Rays, the investigation of hadronic processes inextreme astrophysical environments and the identification of UHECR sources.
An important contribution to the design and optimization of both HE and UHEneutrino telescope comes from the results obtained by VHE gamma and UHECRexperiments.
HIGH-ENERGY NEUTRINO ASTRONOMY 645
In particular VHE gamma astronomy has reached in last few years a maturity levelthat allows, at least for some specific classes of Galactic sources, to obtain reasonableestimates of expected HE neutrino fluxes. Concerning the UHECR results, the discrep-ancy between HIRES and Auger experiments about the mass composition, introduces avery large uncertainty on the estimate of GZK (BZ) neutrino fluxes.
Perspectives for HE neutrino detection have dramatically improved in the last decadedue to the huge technological progresses. At South Pole, IceCube, with 59 strings de-ployed over 80 and the completion expected by 2011, is about to reach the sensitivityregion below the Waxman and Bahcall limit where, in the hypothesis of extragalacticproton dominance at E > 1019 eV, neutrino signals from cosmic sources are expected tobe detected.
On the other hand, after many years of activities focused to prototyping and valida-tion of deep-sea technologies, mainly undertaken by the collaborations operating in theMediterranean Sea, the KM3NeT consortium is ready for the start-up of the constructionphase of the km3 scale underwater neutrino telescope in the Mediterranean.
KM3NeT will cover a large fraction (about 3.5π) of the sky, for up-going neutrinos,where RXJ1713.7-3946 and Vela Jr. are visible for more than 18 hours per day.
Great progresses have also been made towards the detection of UHE neutrinos: thesensitivity reached by ANITA and Auger allows to exclude the exotic top-down models.
Moreover, after the results of several pioneering experiments, a very large array basedon radio Cerenkov techniques, IceRay, is proposed at the South Pole. On the other hand,an intense R&D activity is undergoing for example in the field of acoustic detection, thatalthough has not yet reached the maturity level of the radio Cerenkov technique, is apromising approach that can be exploitable for the UHE neutrino detection underwater.
We believe that the observation of the Universe in the “neutrino light” will play amajor role in the multi-messenger astronomy providing a new insight on the far andviolent Universe.
∗ ∗ ∗The authors are deeply grateful to E. Migneco, C. Distefano, R. Coniglione and
F. Vissani for helpful discussions, suggestions and reviews. We also thank the anony-mous referee who helped us to improve the manuscript with his/her precious comments.
REFERENCES
[1] Lipari P., Proc. Neutrino Oscillation (Venice, Italy), (2008) arXiv:0808.0417.[2] Greisen K. et al., Phys. Rev. Lett., 16 (1966) 748.[3] Zatsepin G. T. and Kuzmin V. A., JETP Lett., 4 (1966) 78.[4] Mangano G. et al., Nucl. Phys. B, 729 (2005) 221.[5] Bahcall J. N. and Pinsonneault M., Rev. Mod. Phys., 64 (1992) 64.[6] Ahmad Q. R. et al., Phys. Rev. Lett., 87 (2001) 071301.[7] Davis R. et al., Phys. Rev. Lett., 20 (1968) 1205.[8] The SuperKamiokande Collaboration, Phys. Rev. Lett., 82 (1992) 2644.[9] Hirata K. et al., Phys. Rev. Lett., 58 (1987) 1490; Hirata K. et al., Phys. Rev. D, 38
(1988) 448.[10] Bionta R. M. et al., Phys. Rev. Lett., 58 (1987) 1494; Bratton R. B. et al., Phys. Rev.
D, 37 (1988) 3361.[11] Alekseev E. N. et al., JETP Lett., 45 (1987) 589; Alekseev E. N. et al., Phys. Lett.
B, 205 (1988) 209.[12] Berezinsky V. S. and Zatsepin G. T., Phys. Lett. B, 28 (1969) 423.

646 P. SAPIENZA and G. RICCOBENE
[13] Hess V., Phys. Z., 13 (1913) 1084.[14] Pacini C., Nuovo Cimento, 6 (1912) 93.[15] Gaisser T. K., Cosmic Rays and Particle Physics (Cambrige University Press,
Cambrige) 1990.[16] Cronin J. W., Gaisser T. K. and Swordy S. P., Sci. Am., 276 (1997) 44.[17] Fermi E., Phys. Rev., 75 (1949) 1169.[18] Bell A. R., Mon. Not. R. Astron. Soc., 182 (1978) 147.[19] Hillas A. M., Annu. Rev. Astron. Astrophys., 22 (1984) 425.[20] Ginzburg V. L. and Syrovatsky S. I., Origin of Cosmic Rays (Pergamon, New York)
1964.[21] Berezinsky V., J. Phys. Conf. Ser., 120 (2008) 012001.[22] Butt Y., Nature, 460 (2009) 7256.[23] Abdo A. A. et al., Phys. Rev. Lett., 101 (2008) 221101.[24] Anemori M. et al., Science, 314 (2006) 439.[25] Vernetto S. et al., Proc. 31st ICRC, Lodz, Poland (2009).[26] Abbasi R. et al., Proc. 31st ICRC, Lodz, Poland (2009).[27] Abdo A. A. et al., Astoph. J., 688 (2008) 1078.[28] Takeda M. et al., Phys. Rev. Lett., 81 (1998) 1163.[29] Abbasi R. et al., Astropart. Phys., 32 (2009) 53.[30] Abbasi R. et al., submitted to Phys. Rev. Lett., arXiv:0910.4184.[31] Abbasi R. et al., Proc. 31th ICRC, Lodz, Poland (2009), arXiv:0906.2319.[32] Waxmann E. and Bahcall J., Phis. Rev. Lett., 78 (1997) 2292.[33] Biermann P. and Strittmatter P. A., Astrophys. J., 322 (1997) 643.[34] The Pierre Auger Collaboration, Science, 318 (2007) 938.[35] Veron-Cetty M. P. and Veron P., Astron. Asrtophys., 455 (2006) 773.[36] Hague J. D. for the Pierre Auger Collaboration, Proc. 31st ICRC, Lodz, Poland
(2009).[37] Tueller J. et al., Astrophys. J., 681-1 (2008) 113.[38] Gorbunov D. et al., JETP Lett., 87 (2008) 461.[39] The Hires Collaboration, Phys. Rev. Lett., 100 (2008) 101101.[40] Abraham J. for the Pierre Auger Collaboration, Phys. Rev. Lett., 101 (2008)
06110.[41] Soomers P. for the Pierre Auger Collaboration, Proc. 31st ICRC, Lodz, Poland
(2009).[42] Wahlberg H. for the Pierre Auger Collaboration, Proc. 31st ICRC, Lodz, Poland
(2009).[43] Aloisio R., Berezinsky V. and Gazizov A., arXiv:0907.5194v1 (2009).[44] Tanimori T. et al., Astrophys. J. Lett., 429 (1994) L61.[45] de la Calle Perez I. et al., Astrophys. J., 599-2 (2003) 909.[46] Aharonian F. et al., Astrophys. J., 539 (2000) 317.[47] Albert J. et al., Astropart. Phys., 23 (2005) 493.[48] Aharonian F. et al., Nature, 432 (2000) 75.[49] Acciari V. A. et al., Astrophys. J. Lett., 684 (2008) L73.[50] Aharonian F., Science, 315-5808 (2007) 70.[51] De Angelis A. et al., Riv. Nuovo Cimento, 31 (2008) 131.[52] Costamante L. and Ghisellini G., Astron. Asrtophys., 56 (2002) 384.[53] Spandre G. et al., Nucl. Instrum. Methods A, 572 (2007) 500.[54] Tibolla O. for the HESS Collaboration, Proc. 31st ICRC, Lodz, Poland (2009),
arXiv:0907.0574v1.[55] de Jager O. C. et al., arXiv:0906.2644.[56] Aharonian F. et al., Rep. Prog. Phys., 71 (2008) 096901.[57] Bartko H. et al., Proc. 23th ICRC, Pune, India (2005).[58] Aharonian F. et al., Astron. Asrtophys., 477-1 (2008) 353.[59] Gonzales-Garcia M. C., Halzen F. and Mohapatra S., Astropart. Phys., 31-6 (2009)
437.

HIGH-ENERGY NEUTRINO ASTRONOMY 647
[60] de Jager O. C. et al., Astrophys. J., 689 (2008) L125.[61] Funk J., Proc. 30th ICRC, Merida, Mexico (2007).[62] Abdo A. A. et al., Astrophys. J., 695 (2009) L72.[63] Tanaka T. et al., Astrophys. J., 685-2 (2008) 988.[64] Aharonian F. et al., Astron. Asrtophys., 464-1 (2007) 235.[65] Helder E. A. et al., Science, 325-5941 (2009) 719.[66] Aharonian F. et al., Astron. Asrtophys., 437-1 (2005) L7.[67] Gabici S., Aharonian F. and Casanova S., Mon. Not. R. Astron. Soc., 396-3 (2009)
1629.[68] Abdo A. et al., Astroph. J. Lett., 706 (2009) L1.[69] Aharonian F. et al., Astron. Asrtophys., 490-2 (2008) 685.[70] Villante F. L. and Vissani F., Phys. Rev. D, 76 (2007) 125019.[71] Villante F. L. and Vissani F., Phys. Rev. D, 78-10 (2008) 103007.[72] Morlino G., Blasi P. and Amatoo E., Astropart. Phys., 31-5 (2009) 376.[73] Berezhko E. G. and Volk H. J., Astron. Asrtophys., 492-3 (2008) 695.[74] Berezhko E. G., Puhlofer and Volk H. J., Astron. Asrtophys., 505-2 (2009) 641.[75] Mirabel I. F. and Rodriguez L. F., Nature, 392 (1998) 673.[76] Mirabel I. F., Science, 312 (2006) 1759.[77] Szostek A. et al., Proc. 31st ICRC, Lodz, Poland (2009), arXiv:0907.3034.[78] Albert J. et al., Science, 312 (2006) 1771.[79] Reynoso H. R. and Christiansen G. E., Astropart. Phys., 28-6 (2008) 565.[80] de Naurios M. et al., Proc. 29th ICRC, Pune, India, 4 (2005) 101.104.[81] Jogler T. et al., Proc. 31st ICRC, Lodz, Poland (2009), arXiv:0907.0992.[82] Aharonian F. et al., Astron. Asrtophys., 460-3 (2006) 743.[83] Sidro N. et al., PoS(MQW6), (2006) 8.[84] Vila G. S. and Romero G. E., AIP Conf. Proc., 1085 (2008) 289.[85] Bordas P., Bosch-Ramon V., Paredes J. M. and Perucho M., PoS(MQW7), 044
(2008) arXiv:0903.3293.[86] Levinson A. and Waxman E., Phys. Rev. Lett., 87 (2001) 171101.[87] Distefano C. et al., Astrophys. J., 575 (2002) 378.[88] Romero G. E. et al., Astrophys. J., 632 (2005) 1093.[89] Aharonian F. et al., J. Phys. Conf. Ser., 39 (2006) 408.[90] Aharonian F. et al., Nature, 439-1 (2006) 1038.[91] Kosack K. et al., Astrophys. J., 608 (2004) L97.[92] Tsuchiya K. et al., Astrophys. J., 606 (2004) L115.[93] Albert J. et al., Astrophys. J., 638 (2006) L101.[94] Aharonian F. et al., Astron. Asrtophys., 503-3 (2009) 817.[95] van Eldik C. et al., AIP Conf. Proc., 1085 (2008) 146.[96] Eckart A. et al., J. Phys. Conf. Ser., 131-3 (2008) 012002.[97] Crocker R. M. et al., Astrophys. J., 644 (2007) L95.[98] Wang Q. D. et al., Mon. Not. R. Astron. Soc., 367-3 (2006) 937.[99] Aharonian F. et al., Phys. Rev. Lett., 97 (2006) 221102.
[100] Liu S. et al., Astrophys. J., 636 (2006) 798.[101] Ballantyne D. R. et al., Astrophys. J., 657-1 (2007) L13.[102] Yusef-Zadhe F. et al., Astrophys. J., 682-1 (2008) 361.[103] Atoyan A. and Dermer C., Astrophys. J., 617 (2004) L123.[104] Robert J. Gould and Gerald Schreder, Phys. Rev. Lett., 16 (1966) 252.[105] Aharonian F. et al., Nature, 440 (2006) 1018.[106] Becker J. K., Rep. Prog. Phys., 458 (2008) 173.[107] Waxman E. and Bachall J., Phys. Rev. D, 59 (1999) 023002.[108] Battacharije P. and Sigl G., Phys. Rep., 327 (2000) 109.[109] Fanaroff B., Bernard L. and Riley J. M. , Mon. Not. R. Astron. Soc., 167 (1974)
31.[110] The MAGIC Collaboration, Science, 325 (2008) 1752.[111] Teshima M. for the MAGIC Collaboration, Proc. 30th ICRC, Merida, Mexico (2007).
648 P. SAPIENZA and G. RICCOBENE
[112] Mannhein K., Astrophys. Phys., 3 (1995) 295.[113] Osterbrock D. E., Rep. Prog. Phys., 54 (1991) 579.[114] Torres D. F. and Anchordoqui L. A., Rep. Prog. Phys., 67 (2004) 1663.[115] Stecker F. W. et al., Phys. Rev. Lett., 66 (1991) 2697; 59 (1999) 023002.[116] Achterberg A. et al., Proc. 29th ICRC, Pune, India (2005); Phys. Rev. D, 76 (2007)
042008.[117] Stecker F. W. et al., Phys. Rev. D, 72 (2005) 107301.[118] Aharonian F. et al., Astrophys. J. Lett., 695-1 (2009) L40.[119] VERITAS, VLBA, HESS and MAGIC Collaborations, Science, 320 (2009) 444.[120] Meszaros P., Rep. Prog. Phys., 69 (2006) 2259.[121] Conner J. P, Evans W. D. and Bellan R. D., Astrophys. J., 157 (1969) L157.[122] van Paradijs et al., Nature, 386 (1997) 686.[123] Barraud et al., Astron. Asrtophys., 400 (2003) 1021.[124] Hjorth J. et al., Nature, 423-6942 (2003) 847.[125] Meszaros P., Nature, 423-6942 (2003) 809.[126] Sakamoto T. et al., Astrophys. J. Suppl., 175 (2009) 179.[127] Band D. L. et al., Astrophys. J., 701-2 (2009) 1673.[128] Waxman E., Phys. Rev. Lett., 75 (1995) 386.[129] Guetta D. and Granot J., Astrophys. J., 585 (2003) 885.[130] Kappes A. for the IceCube Collaboration, Proc. 31st ICRC, Lodz, Poland (2009).[131] Aharonian F. et al., Astron. Asrtophys., 495 (2009) 505.[132] Albert J. et al., Astrophys. J., 667-1 (2007) 358.[133] McEnery J. E. for the Milagro Collaboration, Proc. 31st ICRC, Lodz, Poland
(2009).[134] Loeb A. and Waxman E., JCAP, 0605 (2006) 003.[135] Benbow W. et al., Proc. 31st ICRC, Lodz, Poland (2009).[136] The Veritas Collaboration, Nature Lett., (2009) doi:10.1038/nature08557.[137] Acero S. et al., Science, 326-5956 (2009) 1080.[138] Berezinsky V. S. and Zatsepin G. T., Phys. Lett. B, 28 (1969) 423.[139] Protheroe R. J. and Johnson P. A., Astropart. Phys., 4 (1996) 253.[140] Kalashev O. E. et al., Phys. Rev. D, 66 (2002) 063004.[141] Taylor A. M. and Aharonian F., Phys. Rev. D, 76-8 (2009) 083010.[142] Anchordoqui A. et al., Phys. Rev. D, 76 (2007) 123008.[143] Li Z. and Waxman E., arXiv:0711.4969.[144] Gaisser T. K., Halzen F. and Stanev T., Phys. Rep. D, 258 (1995) 173.[145] Okun L., Leptons and quarks (North Holland, Amsterdam) 1982.[146] Gandhi R. et al., Phys. Rev. D, 58 (1998) 93009.[147] Dziewonski A., Earth Sructure in The Encyclopedia of Solid Earth Geography (Van
Nosrtand Reinhold, New York) 1989.[148] Markov M. A. and Zheleznykh I. M., Nucl. Phys., 27 (1961) 385.[149] Askaryan G. A., JETP, 14 (1962) 441.[150] Askaryan G. A., JETP, 21 (1965) 658.[151] Askaryan G. A. et al., Nucl. Instrum. Methods, 164 (1979) 267.[152] Fargion D. et al., Astrophys. J., 613 (2004) 1285.[153] Mobley C. D., Light and Water: radiative transfer in natural waters (Academic Press,
San Diego) 1994.[154] Ackermann M. et al., J. Geophys. Res., 111 (2006) D13203.[155] Bagley P. et al., Conceptual Design Report for a Deep-Sea Research Infrastructure
Incorporating a Very Large Volume Neutrino Telescope in the Mediterranean Sea (2008)http://www.km3net.org/CDR/CDR-KM3NeT.pdf.
[156] Honda M. et al., Phys. Rev. D, 75 (2007) 043006.[157] Ambrosio M. et al., Astropart. Phys., 20-2 (2003) 145.[158] Wang Y. et al., Nucl. Phys. B Proc. Suppl., 175-176 (2008) 551.[159] Gladston L. for the IceCube Collaboration, Proc. 31st ICRC, Lodz, Poland (2009).[160] Roberts A. et al., Rev. Mod. Phys., 64 (1992) 259.
HIGH-ENERGY NEUTRINO ASTRONOMY 649
[161] Wischnewski R. for the Baikal Collaboration, Int. J. Mod. Phys. A, 20 (2005)6932.
[162] Ayutdinov V. for the Baikal Collaboration, Nucl. Instrum. Methods A, 602 (2009)14.
[163] Andres E. et al., Astropart. Phys., 13 (2000) 1.[164] Ahrens J. et al., Phys. Rev. Lett., 90 (2003) 251101.[165] Ahrens J. et al., Phys. Rev. Lett., 92 (2004) 071102.[166] The IceCube Collaboration, Phys. Rev. D, 79 (2009) 102005.[167] Schukraft A. for the IceCube Collaboration, Proc. 31st ICRC, Lodz, Poland (2009).[168] Gonzalez-Garcia M. C. et al., JHEP, 0610 (2006) 075.[169] Barr G. D. et al., Phys. Rev. D, 70 (2004) 023006.[170] Honda M. et al., Phys. Rev. D, 75 (2007) 043006.[171] The IceCube Collaboration, IceCube Preliminary Design Document, (2001)
http://www.icecube.wisc.edu/science/publications/pdd/pdd.pdf.[172] Stokstad R. G. for the IceCube Collaboration, Nucl. Phys. B Proc. Suppl., 118
(2003) 514.[173] Wiebuschv C. for the IceCube Collaboration, Proc. 31st ICRC, Lodz, Poland (2009).[174] Gaisser T. K. for the IceCube Collaboration, Proc. 30th ICRC, Merida, Mexico
(2007), arXiv:0711.0353.[175] DeYoung T. for the IceCube Collaboration, Mod. Phys. Lett. A, 24 (2009) 1543.[176] Karle A. for the IceCube Collaboration, Proc. 31st ICRC, Lodz, Poland (2009).[177] Abbasi R. for the IceCube Collaboration, Astrophys. J. Lett., 701 (2009) L47.[178] Resvanis L. K. for the NESTOR Collaboration, Proceedings of NOVE, Venice -
Italy, 2006.[179] Stanley D. J. et al., Nature, 273 (1978) 110.[180] Le Pinchon X. et al., Geolog. Soc., Special Publ., 10 (1982) 319.[181] Anassontis E. G. for the NESTOR Collaboration, Nucl. Instrum. Methods A, 479
(2002) 439.[182] Rapidis P. for the NESTOR Collaboration, Nucl. Instrum. Methods A, 602 (2009)
54.[183] Aggouras G. for the NESTOR Collaboration, Astropart. Phys., 23 (2005) 377.[184] Montaruli T. for the ANTARES Collaboration, Int. J. Mod. Phys. A, 24 (2009)
1656.[185] Circella M. for the ANTARES Collaboration, Nucl. Instrum. Methods A, 602
(2009) 2.[186] Vallage B. for the ANTARES Collaboration, Nucl. Phys. B, 151 (2006) 407.[187] Heijboer A. for the ANTARES Collaboration, Proc. 31st ICRC, Lodz, Poland
(2009), arXiv:0908.0816.[188] Toscano S. for the ANTARES Collaboration, Proc. 31st ICRC, Lodz, Poland (2009),
arXiv:0908.0864.[189] Ambrosio M. et al., Astrophys. J., 564 (2001) 1038.[190] Abe K. et al., Astrophys. J., 652 (2006) 198.[191] Migneco E. et al., Nucl. Instrum. Methods A, 588 (2008) 111.[192] Riccobene G. et al., Astropart. phys., 27 (2007) 1.[193] Capone A. et al., Nucl. Instrum. Methods A, 602 (2009) 47.[194] Ameli F. et al., IEEE Trans. Nucl. Sci., 55-1 (2008) 233.[195] Aiello S. et al., arXiv:0910.1269 (2009).[196] Katz U. F. et al., Nucl. Instrum. Methods A, 602 (2009) 40.[197] http://www.km3net.org/CDR/CDR-KM3NeT.pdf.[198] Coniglione R. et al., Nucl. Instrum. Methods A, 602 (2009) 98.[199] Sapienza P. et al., Nucl. Instrum. Methods A, 602 (2009) 101.[200] Vannoni G. et al., Proceedings of VLVnT09 Athens, Greece, to be published in Nucl.
Instrum. Methods.[201] Sapienza P. et al., Proceedings of VLVnT09 Athens, Greece, to be published in Nucl.
Instrum. Methods.
650 P. SAPIENZA and G. RICCOBENE
[202] Kopper C. et al., Proceedings of VLVnT09 Athens, Greece, to be published in Nucl.Instrum. Methods.
[203] Coniglione R. et al., Proceedings of VLVnT09 Athens, Greece, to be published in Nucl.Instrum. Methods.
[204] Saltzberg D. et al., Phys. Rev. Lett., 86 (2001) 2802.[205] Gorham P. W. et al., Phys. Rev. D, 72-2 (2004) 023002.[206] Connolly A., Nucl. Instrum. Methods A, 595-1 (2008) 260.[207] Kravchenko I. et al., Astropart. Phys., 19 (2003) 15.[208] Kravchenko I. et al., arXiv:0705.4491 (2007).[209] Hogan D. P. et al., Phys. Rev. D, 78 (2008) 075031.[210] Kravchenko I. et al., AIP Conf. Proc., 870 (2006) 212.[211] Landsman H. et al., Nucl. Instrum. Methods A, 604-1 (2009) S70.[212] Barwick S. W. et al., Phys. Rev. Lett., 96 (2006) 171101.[213] Gorham P. W. et al., Astropart. Phys., 32 (2009) 10.[214] Gorham P. W. et al., Phys. Rev. Lett., 103 (2009) 051103.[215] Allison P. et al., Nucl. Instrum. Methods A, 604-1 (2009) S64.[216] Besson D. Z., Astropart. Phys., 19 (2003) 15.[217] Dagkemanskii R. D. and Zheleznykh I. M., Sov. Phys. JETP Lett., 50 (1989) 233.[218] James C. W. et al., Proc. 30th ICRC, Merida, Mexico (2008), p. 1503.[219] Gorham P. W. et al., Proc. SPIE, 4858 (2003) 171.[220] Artemenko I. A. et al., Proc. 27th ICRC, Hamburg, Germany (2001).[221] Ekers R. D. et al., Nucl. Instrum. Methods A, 604-1 (2009) S106.[222] Riccobene G., J. Phys. Conf. Ser., 136 (2008) 022053.[223] Askaryan G. A., Atom. Ener., 3 (1957) 153.[224] Landau L. D. and Pomeranchuk I. J., Dokl. Akad. Nauk. SSSR, 92 (1953) 535.[225] Migdal A. B., Phys. Rev., 103 (1956) 1811.[226] Sulak L. et al., Nucl. Instrum. Methods, 161 (1979) 203.[227] Learned J. G., Phys. Rev. D, 19 (1979) 3293.[228] Urick R. J., Sound Propagation in the Sea (Peninsula Publishing) 1982.[229] Descamps F. et al., Proc. 31st ICRC, Lodz, Poland (2009), arXiv:0908.3251.[230] Niess V. and Bertin V., Astropart. Phys., 28 (2007) 366.[231] Karg T. et al., J. Mod. Phys. Int., A1S1 (2006) 212.[232] Perkin J. et al., Nucl. Instrum. Methods A, 604-1S (2009) S193.[233] Vandenbroucke J. et al., Nucl. Instrum. Methods A, 604-1S (2009) S164.[234] Descamps F. et al., Nucl. Instrum. Methods A, 604-1S (2009) S175.[235] Lethinen N. G. et al., Astropart. Phys., 17 (2002) 279.[236] Vandenbroucke J. et al., Astrophys. J., 612 (2005) 301.[237] Kurahashi N. et al., Nucl. Instrum. Methods A, 604-1S (2009) S127.[238] Lahman R. et al., Nucl. Instrum. Methods A, 604-1S (2009) S158.[239] Nosengo N., Nature, 426 (2009) 560.[240] Riccobene G. et al., Nucl. Instrum. Methods A, 604-1S (2009) S149.[241] The P. Auger Collaboration, Phys. Rev. Lett., 100-21 (2008) 211101.[242] Abbasi R. U. et al., Astrophys. J., 684 (2008) 790.[243] Martens K. et al., arXiv:0707.4417.[244] The P. Auger Collaboration, Proc. 31st ICRC, Lodz, Poland (2009).