high-dispersion optical spectra of nearby stars …
TRANSCRIPT

HIGH-DISPERSION OPTICAL SPECTRA OF NEARBY STARS YOUNGER THAN THE SUN
Russel J. White,1Jared M. Gabor,
2and Lynne A. Hillenbrand
Department of Astronomy, California Institute of Technology, Pasadena, CA 91125, USA;
[email protected], [email protected], [email protected]
Received 2006 July 21; accepted 2007 January 15
ABSTRACT
We present high-dispersion (R � 16;000) optical (3900Y8700 8) spectra of 390 stars obtained with the Palomar60 inch telescope. Themajority of stars observed are part of the Spitzer Legacy Science Program ‘‘The Formation andEvolution of Planetary Systems.’’ Through detailed analysis we determine stellar properties for this sample, includ-ing radial and rotational velocities, Li i k6708 and H� equivalent widths, the chromospheric activity index R0
HK, andtemperature- and gravity-sensitive line ratios. Several spectroscopic binaries are also identified. From our tabulations,we illustrate basic age- and rotation-related correlations among measured indices. One novel result is that Ca ii chro-mospheric emission appears to saturate at v sin i values above�30 km s�1, similar to the well-established saturationof X-rays that originate in the spatially separate coronal region.
Key words: stars: activity — stars: fundamental parameters — stars: preYmain-sequence
Online material: machine-readable table
1. INTRODUCTION
We have obtained high-dispersion spectra of several hundredsolar-type stars within 20Y160 pc of the Sun in order to determinefundamental stellar properties. Our work is in support of theSpitzer Legacy Program ‘‘Formation and Evolution of PlanetarySystems’’ (FEPS; Meyer et al. 2006), which aims to understandthe evolution of circumstellar dust from the primordial planet-building phase at an age of �3 Myr to mature debris-disk sys-tems up to an age of �3 Gyr. While data from the Spitzer SpaceTelescope probe the dust characteristics, a wide range of ancillaryground-based observations are required to estimate stellar prop-erties. High-dispersion spectroscopy, in particular, is a valuabletool for determining radial and rotational velocities, effectivetemperatures and surface gravities, abundances, and chromo-spheric activity diagnostics. These in turn provide useful con-straints on stellar masses and ages. The stellar parameters derivedfrom these spectroscopic observations thereby permit multipleaxes of investigation for the infrared data from Spitzer, such aswhether dust disk characteristics can be (anti)correlated with stel-lar mass, signatures of youth, and/or stellar multiplicity.
In x 2 we describe the observed sample and the spectroscopicobservations. In xx 3 and 4 we summarize the spectroscopic re-ductions and the methods used to extract spectroscopic proper-ties. In x 5 we discuss the spectroscopic binaries identified in thesample and illustrate basic age-related correlations among themea-sured properties; the relation and apparent saturation of chro-mospheric Ca ii emission versus projected rotational velocity ishighlighted. The analysis is meant to be representative rather thancomplete. The spectroscopic properties are presented primarily toassist more detailed studies of individual FEPS stars.
2. SAMPLE AND OBSERVATIONS
Our primary sample for high-dispersion spectroscopic ob-servations consists of actual FEPS targets as well as many can-didate targets eventually dropped from the FEPS program. Thesource list for FEPS is comprised of young near-solar analogs
that range in mass from 0.7 to 1.5 M� and span ages between3Myr and 3 Gyr. This source list was drawn from three samplesof young solar analogs. The first sample was assembled fromthe D. R. Soderblom (2000, private communication) volume-limited (<50 pc) spectroscopic study of stars with B� V colorsbetween 0.52 and 0.81 mag (spectral types � F8YK0) and MV
magnitudes within 1.0 mag of the solar-metallicity zero-age mainsequence; approximate ages are provided from the chromosphericactivity index R 0
HK. Since this nearby field sample primarily con-sists of stars older than a few ; 108 yr, a second sample was as-sembled with a targeted age range of 3Y300 Myr. Stars in thissample were identified based on observational investigationsto identify young main-sequence and preYmain-sequence solar-type stars with strong X-ray emission, high lithium abundances,and kinematics appropriate for the young Galactic disk (e.g.,Mamajek et al. 2002). The third sample consists of stars in nearbywell-studied clusters, including four open clusters ( IC 2602[55Myr],� Per [90Myr], the Pleiades [125Myr], and the Hyades[650 Myr]) and three younger T Tauri age clusters (R CoronaAustralis [3 Myr], Upper Scorpius [5 Myr], and Upper CentaurusLupus [10 Myr]). Stars in these clusters serve to benchmark ourfield star selection criteria by providing subsamples nearly iden-tical in age, composition, and birth environment. These threeparent samples and the procedure for downselecting to the finalFEPS sample observed with Spitzer are described more fully inMeyer et al. (2006). In addition to stars in this primary sample, ahandful of other young and/or chromospherically active stars(e.g., RSCVn) were observed for comparison, and�20 stars withprecisely known radial velocities (Nidever et al. 2002) were ob-served for calibration and analysis purposes.High-dispersion spectroscopic observations were obtained for
363 stars among the sample described above; 284 of these starsare among the 326 stars that comprise the final FEPS program asexecuted with Spitzer (the vast majority of FEPS stars not ob-served are in the southern hemisphere and thus inaccessible fromPalomar Observatory). Fifty-two of the 363 stars observed aremembers of the four open clusters and 31 stars are members ofthe three young clusters. For calibration purposes, we also ob-served 13 giant stars with spectral types ranging from G5 to M2,five early- to mid-M dwarf stars, and nine early A-type stars with
A
1 Currently at University of Alabama, Huntsville, AL 35899, USA.2 Currently at University of Arizona, Tucson, AZ 85721, USA.
2524
The Astronomical Journal, 133:2524Y2536, 2007 June
# 2007. The American Astronomical Society. All rights reserved. Printed in U.S.A.
brought to you by COREView metadata, citation and similar papers at core.ac.uk
provided by Caltech Authors

nearly featureless continua. Tables 1 and 2 list the observed sam-ple (excluding nonsolar-type calibration stars), ordered by rightascension; Table 1 contains spectroscopic single stars and candi-date single-lined spectroscopic binaries (for which stellar proper-ties could be determined) while Table 2 contains known or newlydiscovered double-lined spectroscopic binaries. Coordinates forall stars are from the 2MASS All-Sky Catalog of Point Sources(Cutri et al. 2003), as interpreted by VizieR (Ochsenbein et al.2000).
Spectroscopic observations were obtained on nine observingruns between 2001 July and 2003 June with the Palomar 60 inch(1.5 m) telescope and facility spectrograph (McCarthy 1988) inits echellemode. This instrument is no longer available.A 1:4300 ;7:3600 slit was used, yielding spectra spanning approximately3900Y87008, with some small gaps between the redder orders.While the 2 pixel resolving power of this instrument is �19,000,the achieved resolving power was typically �16,000 because ofimage-quality issues. The wavelength coverage was chosen so asto include both the Ca ii H and K features at the blue end and theCa ii infrared triplet at the red end. The spectrograph images theechelle spectra onto an 800 ; 800 CCD; the consequence of pro-jecting the broadwavelength coverage onto thismodest sizedCCDis that the orders are closely spaced, especially at the red end. Thedetector has a gain of 1.5 and a read noise of�12 electrons. Duringeach night of observations, series of bias exposures and flat-fieldexposures were obtained to effect standard image processing. Be-cause of the large spectral range of the instrument, the flat-fieldimages were taken with two separate incandescent lamps, oneappropriate for illumination of the blueward range of the detector(at 60 s exposure time) and the other appropriate for the redwardrange (5 s exposure time). For wavelength calibration, spectra ofthorium-argon lamps were obtained (45 s exposure time) gener-ally before or after each on-sky group of target exposures.
Each target observation consisted of between one and threeconsecutive exposures. The dates for these observations are listedin Tables 1 and 2; multiple-epoch observations are listed sepa-rately. At least three stars with precisely known radial velocitiesfrom Nidever et al. (2002) were observed per observing run.
One feature of this instrument is that the optimal focus for thebluest orders is not optimal for the reddest orders, so subjectivecompromises had to bemade in focusing the spectrograph. In ad-dition, the spectroscopic focuswas temperature sensitive and there-fore had to be tuned periodically throughout the night to achievethe best spectral resolution. On the night of 2002 February 2,many spectra were obtained at an exceptionally poor focus setting.When poorly focused, the spectrograph produces spectra that arestigmatic—spectral lines skewed relative to the dispersion direc-tion, which degrades resolution (by an amount that is wavelengthdependent). To help assess how poor focus may compromise theanalysis (e.g., v sin i measurements), on the night of 2002 Sep-tember 18 we observed the radial velocity standard HD 164992over a broad range of focus values.
3. SPECTROSCOPIC REDUCTIONS
3.1. Image Processing
Raw data frames were processed using tasks in IRAF and cus-tom IDL scripts. First, the detector bias was removed. Althoughthe bias pattern appeared to be stable during the course of an ob-serving run, the absolute bias level drifted substantially on time-scales of hours, changing by as much as 30% over the course of anight. Bias subtraction was performed, therefore, in a two-stepprocess. First, the bias sequence obtained on each night was me-dian combined using the IRAF zerocombine task, rejecting the
highest and lowest valued bias images. Second, since the detec-tor bias level for a given imagemay have drifted from themedianvalue determined at the beginning or end of the night, a bias scal-ing factor was also determined. This was done by measuring themedian pixel value within a specified area in the most poorlyilluminated, inefficient portion of the array, located well below3600 8 where useful spectra could not be extracted; even thebrightest, bluest stars observed on our program showed essen-tially zero counts above bias in this portion of the array. For eachtarget image, the median bias image from the beginning or end ofthe night was scaled by this factor and then subtracted.
Next, images were trimmed to exclude two unilluminated col-umns at the rightmost edge of the array. Cosmic-ray events wereremoved using IRAF’s cosmicrays task and fairly liberal param-eter settings that restricted the corrections to only bona fide cosmicrays.
The blue and red flat-field sequences from each night weremedian combined using IRAF’s flatcombine procedure with�-clipping. The blue and red medians were then stitched to-gether approximately a third of the way up the detector (at line250), which has the effect of distorting the one (curved) spectralorder which intersects this line. IRAF’s apflatten task was usedto normalize the combined flat for each night by fitting its inten-sity along the dispersion using a low-order (typically 3) polyno-mial while setting all pixels outside an order to unity. Flat-fieldingwas performed by dividing each image by the normalized flat-field image using IRAF’s ccdproc task.
Cosmetically, the images contain ‘‘tadpole streaks’’ of highcount levels, comprised of short ‘‘heads’’ along the dispersiondirection and then decaying count levels along long, mostly single-pixel ‘‘tails’’ perpendicular to the dispersion directionwhich thusaffect multiple orders. The number of such defects per image wasrelated to exposure time. A custom procedure was developed tocrawl down each column comparing values on either side of thecolumn and thus identifying these features. The pixels in the tailof the streak and a small square around the tadpole head wereinterpolated over.
The close spacing of the spectral orders did not permitmeasure-ment or removal of scattered light, an effect common in echellespectrographs. However, comparisons of our extracted spectrawith spectra previously obtained with other instruments (x 3.2)and of measured equivalent widths with those from the literature(x 4.1) suggest that the majority of excess flux caused by scatteredlight is removed during background subtraction.
3.2. Spectral Extraction and Wavelength Calibration
One-dimensional spectra were extracted from the processedtwo-dimensional images using IRAF’s doecslit task. Sixty orderswere identified over the 800 ; 800 pixel2 array. A moderate (9th)order trace was employed and the spectra in each order weresummed over 3Y5 pixels perpendicular to the dispersion. Varianceweighting was used for ‘‘optimal’’ extraction. The small separa-tion between orders made removal of background and scatteredlight especially challenging. After exploring a variety of methodsfor accomplishing this, the most robust method identified wassimply to subtract the average minimum value within two back-ground regions, one on each side of the spectrum. Aperture defini-tion, background region definition, and order tracing were attendedas opposed to automated processes.
To test the accuracy of the adopted background/scattered-lightsubtraction, J. Valenti kindly provided a careful comparison of ourspectra with spectra obtained with the HIRES spectrograph (Vogtet al. 1994) on the W. M. Keck I telescope. The widely spacedorders of HIRES permit accurate background and scattered-light
SPECTRA OF YOUNG NEARBY STARS 2525

TABLE 1
Spectroscopic Properties of Observed Single(-Lined) Stars
HD HIP Other Group
R.A.
(J2000.0)
Decl.
(J2000.0) Epoch
S/N
at Li
EW(Li i)
(8)EW(H�)
(8)RV
(km s�1)
v sin i
( km s�1)
S/N
at Ca HK SMWa
Spectral
Typeb B � V c R0HK
a,d
224873...... 110 RX J0001.4+3936 Field 00 01 23.66 +39 36 38.1 2001 Dec 2 105 0.032 1.74 �5.6 � 1.4 <16.3 50 0.365 � 0.068 K0 0.76t �4.49 � 0.11
105............ 490 RX J0005.9�4145 Field 00 05 52.55 �41 45 10.9 2001 Dec 2 217 0.156 3.06 1.6 � 1.2 <18.2 16 0.675 � 0.118e G0 V 0.59t �4.03 � 0.09e
377............ 682 1RXS J000826.8+063712 Field 00 08 25.74 +06 37 00.5 2001 Jul 27 348 0.122 2.34 �3.8 � 2.2 <12.0 135 0.348 � 0.12 G2 V 0.63t �4.41 � 0.20
691............ 919 V344 And Field 00 11 22.40 +30 26 58.4 2002 Oct 29 256 0.122 2.20 �2.4 � 0.8 <10.0 84 0.388 � 0.072 K0 V 0.78t �4.47 � 0.10
2002 Sep 18 174 0.115 2.14 �3.0 � 0.8 <13.7 84 0.391 � 0.073 K0 V 0.78t �4.47 � 0.10
984............ 1134 1RXS J001410.1�071200 Field 00 14 10.25 �07 11 57.0 2001 Jul 27 315 0.099 2.99 �3.2 � 2.2 42.1 � 1.7 131 0.296 � 0.104 F7 V 0.50t �4.43 � 0.22
1326A....... 1475 GJ 15A M star 00 18 22.57 +44 01 22.2 2002 Oct 30 198 <0.01 0.51 12.0 � 0.9 <20.5 38 0.568 � 0.101 M2 V 1.48t . . .
1326B....... . . . GJ 15B M star 00 18 25.50 +44 01 37.6 2002 Oct 30 87 <0.02 0.17 10.7 � 0.9 <18.9 14 1.083 � 0.181 M5 V 1.61s . . .3765.......... 3206 GJ 28 Field 00 40 49.29 +40 11 13.3 2002 Sep 17 259 0.015 1.31 �63.8 � 0.7 16.3 � 5.1 65 0.218 � 0.043 K2 V 0.97t �4.97 � 0.10c
. . . . . . QT And Field 00 41 17.32 +34 25 16.8 2002 Oct 29 160 0.128 �0.17 6.0 � 0.8 24.4 � 2.2 40 1.617 � 0.259 G 0.94t �3.99 � 0.11c
2002 Sep 18 83 0.166 �0.23 5.1 � 0.7 25.1 � 2.2 27 0.705 � 0.123 G 0.94t �4.37 � 0.11c
6434.......... 5054 GJ 9037 Field 01 04 40.15 �39 29 17.4 2001 Dec 2 231 <0.004 2.37 21.9 � 1.2 <10.0 28 0.396 � 0.074 G2/3 V 0.60t �4.32 � 0.11
6963.......... 5521 SAO 36995 Field 01 10 41.92 +42 55 54.7 2002 Sep 17 206 <0.003 2.05 �31.7 � 0.7 <12.58 77 0.226 � 0.045 G7 V 0.73t �4.75 � 0.14
7661.......... 5938 SAO 147702 Field 01 16 24.18 �12 05 49.3 2003 Feb 8 185 0.075 2.04 5.2 � 0.4 <10.0 33 0.479 � 0.087 K0 V 0.77t �4.35 � 0.10
. . . 6276 SAO 147747 Field 01 20 32.26 �11 28 03.6 2003 Feb 8 178 0.153 1.99 8.3 � 0.4 <10.0 29 0.619 � 0.110 G0 0.80t �4.25 � 0.09
8467.......... 6575 SAO 54666 Field 01 24 27.98 +39 03 43.6 2002 Sep 17 172 <0.011 1.64 15.0 � 0.7 <10.0 60 0.278 � 0.054 G5 0.77t �4.65 � 0.12
8941.......... 6869 SAO 92453 Field 01 28 24.36 +17 04 45.2 2001 Jul 29 421 0.006 2.59 9.3 � 2.2 <10.96 181 0.175 � 0.035 F8 IVYV 0.52t �4.83 � 0.18
2002 Sep 18 233 <0.004 2.69 8.29 � 0.70 <12.3 123 0.190 � 0.069 F8 IVYV 0.52t �4.76 � 0.31
8907.......... 6878 IRAS 01256+4200 Field 01 28 34.35 +42 16 03.8 2001 Jul 26 266 0.048 1.55 6.3 � 2.2 <14.34 142 0.263 � 0.093 F8 0.49t �4.50 � 0.24
9472.......... 7244 SAO 74789 Field 01 33 19.03 +23 58 32.1 2002 Sep 18 190 0.055 2.28 10.9 � 0.7 19.33 � 4.22 83 0.277 � 0.053 G0 0.68t �4.59 � 0.13
. . . . . . RX J0137.6+1835 Field 01 37 39.41 +18 35 33.2 2001 Jul 28 194 0.416 �0.59 1.8 � 2.2 21.25 � 3.26 26 0.512 � 0.171e K3 Ve 1.03t �4.64 � 0.23e,c
10780........ 8362 IRAS 01441+6336 Field 01 47 44.88 +63 51 09.1 2001 Jul 28 203 0.012 1.66 1.4 � 2.2 <10.0 55 0.237 � 0.085 K0 V 0.80t �4.77 � 0.22
11850........ 9073 SAO 75038 Field 01 56 47.28 +23 03 04.1 2002 Oct 29 176 0.018 2.32 3.3 � 0.8 <12.08 54 0.287 � 0.055 G5 0.69t �4.57 � 0.12
2002 Sep 18 138 0.015 2.27 1.6 � 0.7 <12.38 76 0.292 � 0.056 G5 0.69t �4.56 � 0.12
Notes.—Units of right ascension are hours, minutes, and seconds, and units of declination are degrees, arcminutes, and arcseconds. Table 1 is published in its entirety in the electronic edition of the Astronomical Journal. A portion isshown here for guidance regarding its form and content.
a Stars with especially uncertain S values are marked with an ‘‘e’’.b Stars which appear to be of low surface gravity are marked with an asterisk.c B� Vcolors from the Tycho catalog are marked with a ‘‘t’’ while those from the stellar spectral type are marked with an ‘‘s’’.d Stars with B� V colors outside the range over which R0
HK values are calibrated are marked with a ‘‘c’’.
corrections. These comparisons demonstrated that the average scat-tered and/or background light remaining in our spectra is approx-imately 4% at 39008, and drops roughly linearly to 0% at 62008.The implication is that equivalent widths of features at blue wave-lengths may be diminished by a small amount. Rather than attemptto correct for this in the reduction process, we account for this in therelative calibration of properties extracted from blue wavelengthfeatures (xx 4.3 and 4.4).
Although multiple thorium-argon spectra per night were ob-tained (often one for each star observed), in practice we establishedwavelength calibration as follows. The extraction trace definedby a single bright star on each night was applied to its correspond-ing thorium-argon exposure to extract a one-dimensional wave-length reference spectrum. Awavelength solutionwas determinedusing the ecidentify task in IRAF, and this solution was applied toall spectra for a given night. This established wavelength solutionwas then interpolated onto a loglinear scale.
From analysis of spectra taken on the same night, small spec-tral shifts of�0.18 were common, as inferred from comparisonsof the location of telluric absorption lines. These shifts were likelydue to flexure of the instrumental optics with telescope pointing,and consequently resulted in wavelength solution offsets of thisorder formany spectra.As discussed below, thiswavelength offsetis accounted for in determining radial velocities by cross-correlatingtelluric features.
4. SPECTROSCOPIC PROPERTIES
Figure 1 shows portions of the echelle spectra for seven starsnear the Ca ii H and K, Li i k6708, and H� features. To help as-sess the quality of the spectra, two signal-to-noise ratios (S/Ns)are estimated, one at�67008 and one at�39508 (labeled as Liand HK, respectively, in Tables 1 and 2). The S/N at 6700 8 isdetermined from the gain-corrected median signal within the cen-tral portion of this order. The S/N at 39508 is determined similarly,but is based on the average of the values determined for the twoadjacent orders containing the Ca ii H (3968 8) and K (3934 8)features, and thus represents an approximate average over thecontinuum and broad absorption. These estimates are valid abovevalues of k20, in which the noise is dominated by photon sta-tistics. Lower values may actually overestimate the S/N, becauseof the increased relative error in the background, scattered-light,and bias-level subtractions (x 3.1). The S/N distribution at 67008is shown in Figure 2.
The following sections described the procedures used to ex-tract stellar properties from these spectra. In comparisons with
previous measurements, values determined in this study are re-ferred to as P60 values. Specifically, equivalent widths (EWs) ofLi i k6708 and H� are measured in x 4.1, radial and rotationalvelocities are determined in x 4.2, temperature and surface grav-ity indices are discussed in x 4.3, and measured S values and cal-culated R0
HK indices are presented in x 4.4.
4.1. Equivalent Widths of Li i k6708 and H�
Equivalent widths of the Li i k6708 doublet (k6707.76,k6707.91), which is spectroscopically unresolved in our obser-vations, and H� k6562.8 are measured for all spectra using thesplot task within IRAF. For measurement of the Li i absorptionfeaturewhich is located near the peak of the blaze function in thesespectra, the local continuum is determined by fitting a Legendrepolynomial to a�308 portion of the spectrum, excluding valuesless than 2 � below the continuum (e.g., stellar absorption fea-tures) or more than 4 � above the continuum (e.g., noise spikes)in this fit. The order of the polynomial is varied (typically from 4to 7) to best match the local continuum. With the continuum de-fined in this way, the EWvalues are determined by fitting aGauss-ian profile to the absorption feature. Multiple measurements on asingle night are averaged, while separate epochs are listed inde-pendently. If no feature is discernible in the spectrum, upper limitsare determined from the noise in the local continuum. Table 1 liststhe measured values.
The measured Li i EW values include a contribution froman Fe i line at 6707.441 8. Soderblom et al. (1993) find that thestrength of this temperature-sensitive Fe i feature varies withB� Vcolor as EW(Fe i k6707.441) = 20(B � V ) � 3 m8. Since theB� V values of most stars are known or can be estimated (x 4.4),the contribution of this Fe i line to the Li i EW values can beremoved.
To assess possible systematic uncertainties caused by the sub-jective aspects involved inmeasuring EWvalues (e.g., continuumdetermination) or instrumental effects, we compare our measure-ments to previous values determined from high-dispersion spec-troscopy. Of the spectroscopically single stars observed here,21 Pleiads were observed by Soderblom et al. (1993; R ¼ 50;000),19 Hyads were observed by Thorburn et al. (1993; R ¼ 26;000Y32;000), 26 field stars were observed by Wichmann et al. (2003;R ¼ 40;000), and 28 field stars were observed by Strassmeier et al.(2000; R ¼ 25;000). The uncertainties in the EW(Li i)s from theseprevious studies are typically 5Y10m8. Of these 94 stars, 19wereobserved twice by us, yielding a total of 113 measurements forcomparison. Figure 3 shows the difference between the P60 and
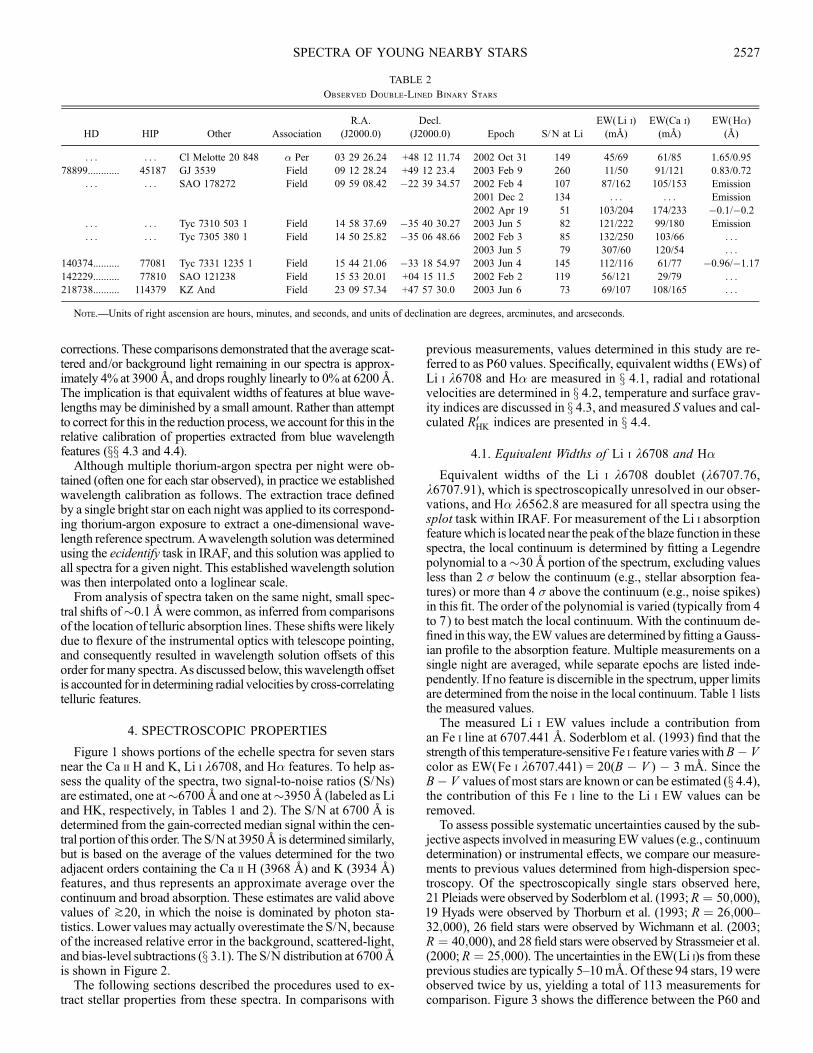
TABLE 2
Observed Double-Lined Binary Stars
HD HIP Other Association
R.A.
(J2000.0)
Decl.
(J2000.0) Epoch S/N at Li
EW(Li i)
(m8)EW(Ca i)
(m8)EW(H�)
(8)
. . . . . . Cl Melotte 20 848 � Per 03 29 26.24 +48 12 11.74 2002 Oct 31 149 45/69 61/85 1.65/0.95
78899............ 45187 GJ 3539 Field 09 12 28.24 +49 12 23.4 2003 Feb 9 260 11/50 91/121 0.83/0.72
. . . . . . SAO 178272 Field 09 59 08.42 �22 39 34.57 2002 Feb 4 107 87/162 105/153 Emission
2001 Dec 2 134 . . . . . . Emission
2002 Apr 19 51 103/204 174/233 �0.1/�0.2
. . . . . . Tyc 7310 503 1 Field 14 58 37.69 �35 40 30.27 2003 Jun 5 82 121/222 99/180 Emission
. . . . . . Tyc 7305 380 1 Field 14 50 25.82 �35 06 48.66 2002 Feb 3 85 132/250 103/66 . . .
2003 Jun 5 79 307/60 120/54 . . .
140374.......... 77081 Tyc 7331 1235 1 Field 15 44 21.06 �33 18 54.97 2003 Jun 4 145 112/116 61/77 �0.96/�1.17
142229.......... 77810 SAO 121238 Field 15 53 20.01 +04 15 11.5 2002 Feb 2 119 56/121 29/79 . . .218738.......... 114379 KZ And Field 23 09 57.34 +47 57 30.0 2003 Jun 6 73 69/107 108/165 . . .
Note.—Units of right ascension are hours, minutes, and seconds, and units of declination are degrees, arcminutes, and arcseconds.
SPECTRA OF YOUNG NEARBY STARS 2527

previousEWvalues; all values are asmeasured and thus uncorrectedfor the contamination of the Fe i line or potential scattered light.Overall the agreement is good. The average and/or median differ-ence for any of the four studies is�15m8, with standard deviationsof difference that range from 16 to 21 m8. The average difference
with the entire comparison sample is�8 m8 with a standard de-viation of 20m8.We conclude that any systematic bias in ourmea-surements isP10 m8. We adopt a uniform uncertainty of 0.028.For H� EWs, considerable care had to be taken both in nor-
malizing to the local continuum and in fitting a functional form
Fig. 1.—Portions of the extracted spectra. The top three spectra are G5 stars with decreasing levels of Ca ii H and K emission ( log R0HK ¼�4:13,�4.59,�5.01). The
next three spectra are Pleiads (and thus coeval), with spectral types of F5 (HII 1200), G2 (HII 250), and K0 (HII 2106). With a S/N of only�18 in the Ca ii region, HII2106 is typical of the poorest quality spectra from which log R0
HK values can be extracted; strong core emission can be seen in this case. The bottom spectrum shows thespectroscopic binary HD 78899, whose features are clearly doubled.
WHITE, GABOR, & HILLENBRAND2528 Vol. 133

to the line profiles because of the broad wings. The local contin-uum was determined by fitting a Legendre polynomial generallyof order 10 to the entire spectral order, excluding values less than2 � below or more than 4 � above the continuum. The procedurevaried slightly as dictated by the noise level in the data, by theline breadth (because of, for example, rapid rotation), or if H�was found to be in emission. Both the �-rejection limits and thefitting order were modified in these cases to optimize the contin-uum fit. The EW values were determined by fitting a Voigt profileto the absorption feature; in a few cases of dramatically filled-inH�, direct integration was used to determine the EW rather thanfunction fitting. EWs are listed in Table 1; negative values indicateH� emission.
Four stars (HD 143006, RX J1842.9�3532, RX J1852.3�3700, and LH98 196) show especially strong H� emission(>108); their H� profiles are shown in Figure 4. In these cases,the strength and breadth of these emission-line profiles are greaterthan that expected from chromospheric activity alone, and moreconsistent with that expected from the accretion of circumstellarmaterial (e.g., Muzerolle et al. 1998; White & Basri 2003). Wesuggest that these stars are accreting.
For the eight stars identified as double-lined spectroscopicbinaries, EW(Li i)s and EW(H�)s for the individual componentswere determined by fitting two Gaussian profiles to the doubledfeatures, when possible. For these pairs, we also measured EWsof the temperature sensitive Ca i k6717 feature, which can be usedto identify better the primary and the secondary. The EW valuesfor the binaries are listed in Table 2.
4.2. Radial and Rotational Velocities
Radial velocities and projected rotational velocities are deter-mined via a cross-correlation analysis similar to that of White &Hillenbrand (2004). The analysis is restricted to the 36 ordersspanning�4000Y7500 8, excluding the 3 orders containing thetelluric B-band, H�, and Na iiD features; orders at longer wave-lengths have poorer wavelength solutions and those at shorterwavelengths typically have low S/Ns. From this restricted range,orders having an average S/N greater than �25 are then cross-
correlated with the spectral orders of at least three slowly rotatingcomparison standards that have radial velocities accurate to 0.3Y0.4 km s�1 (Nidever et al. 2002). The radial velocity, relative toeach standard, is then determined from the average velocity offsetmeasured from all orders.
To determine the heliocentric radial velocities of the stars, therelative radial velocity must be corrected for barycentric mo-tions and possible errors in the wavelength solution of either thestandard or target spectrum. The former is determined using thervcorrect task in IRAF. The latter correction is determined bycross-correlating the telluric A and B bands of the standard andthe target star; the telluric correlationswould yield an offset of zerofor perfect wavelength calibration, but are typically 1Y3 km s�1 forthe spectra analyzed here. Themultiple heliocentric radial velocityestimates, determined frommultiple radial velocity standards, arethen averaged to find the final radial velocity.
Uncertainties in the radial velocities are estimated from a com-bination of statistical and empirical error estimates. First, the un-certainty in the radial velocity relative to each standard is assumedto be the uncertainty in themean value of all orders used, combinedwith the uncertainty in the radial velocity of the standard (typically0.3 km s�1). The radial velocity estimates from all standards arethen combined using a weighted average; the resulting statisticaluncertainties are typically small (0.1Y0.3 km s�1). As an empiricalcheck on these uncertainty estimates, the radial velocity of eachstandard is determined from all other radial velocity standards ob-served during that run and compared to its assumed value. Theaverage agreement of the radial velocity standards is typically acouple times larger than the statistical uncertainties, except in low-S/N caseswhere the statistical uncertainty dominates. This suggeststhere may be systematic effects unaccounted for in the statisticaluncertainty estimates. Thus, we combine the statistical uncertaintywith this empirical uncertainty to determine final (conservative) ra-dial velocity uncertainty estimates given in Table 1. Figure 5 showsthe distributions of radial velocities for the field, open cluster, andyoung cluster samples.
Rotational velocities (v sin i) for the observed targets are deter-mined from the width of the peak in their cross-correlation with a
Fig. 2.—S/N distribution of all spectra obtained (includes multiple measure-ments and stars observed for calibration) of the 390 unique targets.
Fig. 3.—Comparison of measured EW(Li i k6708) values with values fromSoderblom et al. (1993; squares), Thorburn et al. (1993; circles),Wichmann et al.(2003; diamonds), and Strassmeier et al. (2000; triangles).
SPECTRA OF YOUNG NEARBY STARS 2529No. 6, 2007

slowly rotating standard. Specifically, the peak is fit by a parabolawith the fitted width at half-peak maximum. To convert this widthto a v sin i value, an empirical width versus v sin i relation is deter-mined by cross-correlating many artificially ‘‘spun-up’’ spectrawith the same slowly rotating standard. These artificially broadenedspectra are constructed using the rotational profiles given in Gray(1992; � ¼ 0:6). This procedure is computed for each order, yield-ing a v sin i estimate for each order. For each standard used, a v sin ivalue is computed from themedian of all order estimates; a medianis preferred since the v sin i measurements are often upper limits.
Uncertainties in v sin i are determined first from the standarddeviation of the multiple v sin i measurements provided by allstandards used. For observations consisting of multiple expo-sures, the uncertainty is the average standard deviation of thesemeasurements. The v sin i values are assumed to be upper limitsif less than 10 km s�1 ( just over one-half the velocity resolution),or if v sin i is less than 3 times the uncertainty in v sin i. We findthat all templates of F, G, and K spectral types give consistentv sin i values; an exact match in spectral type is not critical in de-termining v sin i.
As noted in the introduction, poor focus plagued some of ourmeasurements, especially on the night of 2002 February 2. Toassess how this may affect inferred properties, the above radialvelocity and rotational velocity analysis was conducted on theobservations of radial velocity standard HD 164922 observed atmultiple focus settings (x 2). Fortunately the inferred radial ve-locities for modest focus offsets, typical of changes over a given
night, agree with the nominal value to �1 km s�1, consistentwith the inferred uncertainties. For extreme focus offsets, how-ever, the discrepancy can be as large as 3 km s�1. Similarly, formodest focus offsets from nominal, the inferred v sin i valueswould increase modestly, but since the standard deviation of mea-surements among the orders correspondingly increased, the endresult is simply larger upper limits (e.g., <16 km s�1 for HD164922, compared with <10 when observed at nominal focus).However, for extreme focus offsets, the spectroscopic blurringresulted in a large apparent v sin i (e.g., 22:0 � 3:3 km s�1 for HD164922). Since the majority of our spectra have at most onlymodest focus errors, no correction for this is made. Rotationalvelocities inferred from observations made on 2002 February 2,however, are marked with a colon in Table 1 as likely being ar-tificially too large.To empirically assess systematic errors in our radial and rota-
tional velocity measurements, our values are compared with val-uesmeasured byNordstrom et al. (2004; which appeared after allof our data were taken). There are 135 stars in common betweenthe surveys that (1) are not previously identified spectroscopicbinaries, (2) are not used as radial velocity standards by us, and(3) have radial velocity uncertainties less than 4 km s�1. Figure 6shows the difference between our radial velocities and those ofNordstrom et al. (2004). The agreement is quite good; the averagedifference is�0.2 km s�1 with a standard deviation of 2.4 km s�1.With the exception of two stars, HIP 67904 and HIP 61072, allmeasured radial velocity values agree to within 10 km s�1. HIP
Fig. 4.—H� profiles for the four strong emission-line stars normalized by the local continuum; the H� equivalent width for each star is given in parentheses. Avelocitywidth of 300 km s�1 is indicated.
WHITE, GABOR, & HILLENBRAND2530 Vol. 133

67904 and HIP 61072, on the other hand, have significantly dif-ferent radial velocity measurements (>25 � difference). As dis-cussed below, we suggest these stars are spectroscopic binaries.This comparison also demonstrates that the radial velocities ofstars with v sin i values as large as 45 km s�1 can be measuredwithout significantly degraded precision.
In Figure 7 are shown Nordstrom et al. (2004) v sin i valuesversus the P60 v sin i values for the overlapping subsample de-scribed above.While Nordstrom et al. (2004) report v sin i valuesas low as 0 km s�1 (which is likely unrealistic), our lower resolu-tion data restrict us to v sin i upper limits of 10 km s�1 or greater.The majority of our v sin i upper limits are thus greater than thevalues measured by Nordstrom et al. (2004), which inhibitsinterpretation of an overall comparison. However, a compari-son of the 22 stars with measured values suggests a systematicdifference. The P60 v sin i values are larger, in the median, thanthose of Nordstrom et al. (2004) by 8.6 km s�1. A portion of thisdifference may be a consequence of the spectroscopic blurringcaused by the focus errors discussed above. When the threemeasured values from 2002 February 2 are removed, the P60values are larger by only 6.3 km s�1 in the median. However, anindependent comparison of the 389 stars with v sin i measure-ments in both Nordstrom et al. (2004) and Strassmeier et al.(2000), upper limits excluded, indicates that the Nordstromet al. (2004) values are less than the Strassmeier et al. (2000)values by 2.6 km s�1. Thus, a portion of the difference with ourmeasurements may be a consequence of artificially low valuesreported by Nordstrom et al. (2004). Overall we conclude thatthe majority of our measured v sin i values suffer from no sys-tematic biases greater than�5 km s�1. The exceptions are starsobserved on 2002 February 2, which may be biased towardartificially large values by �10Y20 km s�1 because of espe-cially poor focus. Since we are uncertain what the systematiccorrection to the v sin i values for these stars should be, ifany, we make no correction for this in the values presented inTable 1.
4.3. Temperature and Gravity Indicators
Within the broad wavelength coverage provided by our echellespectra are many temperature- and gravity-sensitive lines. Em-pirically, we find that the EWs of the photospheric features Fe ik4063, Fe i k4071, and Ca ii k4226 (see Jaschek & Jaschek1987) are especially useful temperature diagnostics. In our data,
Fig. 6.—Difference between P60 radial velocities and values reported byNordstrom et al. (2004). The filled squares are likely spectroscopic binaries.
Fig. 7.—Comparison of measured v sin i values with values from Nordstromet al. (2004). Triangles are upper limits and squares aremeasured values; Nordstromet al. (2004) report no upper limits. The four crosses indicate measurementsfrom the night of 2002 February 2, which had significant focus problems (x 4.2).
Fig. 5.—Distributions of radial velocities of the observed sample. The top panelshows the distribution for field stars and the bottom four panels show the distribu-tions for cluster stars.
SPECTRA OF YOUNG NEARBY STARS 2531No. 6, 2007

these features all increase in strength in a roughly linear fashionfrom spectral types F8 to K5, before degenerate flattening andturnover occurs toward later spectral types. However, fits of theEWs versus B� V color for main-sequence stars (not shownhere) are accurate to only 0.05Y0.1 in B� V . This impliesthat if we were to attempt spectral classification from the EWs,spectral-type uncertainties of more than one spectral subclasswould result. Therefore we do not use these features to esti-mate spectral types. Spectral types instead are taken from severalcatalogs of stellar spectral classification, when available. These,in order of preference, are Houk & Swift (1999), A. B. Skiff(2004),3 and Kharchenko (2001). The spectral types are listed inTable 1; 349 of the 370 stars observed have stellar spectral types.
For gravity indicators, we considered the ratios of the gravity-sensitive Sr ii k4216 and k4077 lines (see Jaschek & Jaschek1987) to the above temperature-sensitive lines. In Figure 8 weshow for our dwarf and giant standard stars the ratios (Sr ii k4216 +k4077) to (Ca i k4226 + Fe i k4063 + Fe i k4071) and Sr ii k4216 toCa i k4226, as a function of B�V color. These ratios are sensitiveto both temperature and gravity; the dwarf and giant stars arereasonablywell separated in these plots. Parabolic fits to the dwarfand giant points are shown. The majority of our target objectscluster around the dwarf locus, although some are securely be-tween the dwarf and giant loci. Other diagnostic figures, such asSr ii k4077/(Fe i k4063 + Fe i k4071) versus Ca i k4226 (whichhas the advantage of considering only our spectroscopic data),have similar appearances. In principle onemight use such figuresto quantitatively estimate the surface gravities of our programstars; in practice, however, the data do not allow this to be carriedout with the precision normally expected of surface gravity mea-surements. Rather than estimate surface gravities, we simply iden-tify all stars which are more than the 1 � above the dwarf loci inboth diagnostic planes. Sixty-six potentially low surface gravitystars are identified by these criteria and marked in Table 1.
4.4. Chromospheric Ca ii H and K Activity Measurements
Core emission in the calcium H and K spectral lines serves asan indicator of stellar chromospheric activity, which is known tobe correlated with stellar age (e.g., Soderblom et al. 1991), pri-
marily as a consequence of rotation. We parameterize the coreemission in our spectra using the standardMountWilson Projectprocedures (Wilson 1968; Vaughan et al. 1978). Our prescrip-tion for measuring the core emission closely follows that out-lined by Duncan et al. (1991). First we define the index of coreemission, S, as
S ¼ NH þ NK
NR þ NV
; ð1Þ
whereNi is the number of counts in band i. The continuum bands,R and V, are 20 8 wide and centered at 4001.07 and 3901.07 8,respectively. The emission bands, H and K, are centered on theemission features whose natural centers are at 3968.470 and3933.664 8, respectively. The bandpass for the H and K chan-nels is triangular, with a full width at half-maximum of 1.09 8.Before measuring the counts within these four bands, the spectraare normalized to account for the blaze function and shifted tocorrect for radial velocity. The spectra are normalized in a two-step iterative process. First, a�4th-order polynomial is fit to thespectra; the broad H and K absorption features are excluded inthis fit. A second polynomial is then fit to the spectra, excludingall spectral features that extend 0.5 � below the initial polyno-mial fit. The spectra are then normalized by dividing by thispolynomial. The velocity shift is determined by cross-correlatingthe two spectra orders with the Ca ii H and K features, with thespectrum of a bright comparison standard. The implied radialvelocity is compared with that determined in x 4.2 to ensure con-sistency; for the chromospheric activity analysis we adopted val-ues determined directly from these orders as they typically providethe most accurate shift for these orders.With velocity-shifted and normalized spectra, the counts within
the continuum and emission bands of the S index are summed. Forthe emission bands, the number of counts in each pixel is firstmultiplied by a number from 0 to 1 tomimic a triangular bandpasswith a full width at half-maximum of 1.09 8. With these sums,equation (1) is used to compute S.To correct for systematic offsets in the measured S values re-
lative to previous work, possibly due to slight differences in themethodology or data quality, the S values are compared to thosemeasured byWright et al. (2004; also appearing after all data for thisprogram were gathered). These comparisons permit transformation
3 Catalogue of Stellar Spectral Classifications (Vizier Online Data Catalog,III /233B).
Fig. 8.—Gravity-sensitive equivalent-width ratios vs. B� V color. Dwarf stars are indicated with filled circles and giant stars are indicated with crosses.
WHITE, GABOR, & HILLENBRAND2532 Vol. 133

of the S values to what we refer to as Mount Wilson S values,SMW. This is realized as a first-order regression analysis on log Sin the form of
log SMW ¼ Aþ B log S: ð2Þ
The uncertainty �SMWis given by the standard formula
�2SMW
¼ @SMW
@A�A
� �2þ @SMW
@B�B
� �2: ð3Þ
The analysis was performed on 8 of the 9 observing runs andfor the entire overlapping sample; there were too few overlap-ping stars for the 2001 December observing run for comparison.Fortunately, the uncertainties in the implied correction estimatesfor 7 of the 8 observing runs agree well with that determined forthe entire overlapping sample. The one exceptionwas for the 2001July observing run, for which the corrections appeared signifi-cantly different. Therefore, the corrections determined for this runwere used to transform its S values to SMW values, while the re-maining runs used the corrections determined for the entire sam-ple, which are more precise. The resulting Mount Wilson calciumindex values and uncertainties are listed in Table 1. Stars with un-certainties that are possibly much larger than reported, becauseof a large systematic uncertainty that is not formally propagated(e.g., radial velocity error), are marked with an ‘‘e’’ in Table 1.
Finally, the SMW values are converted to R0HK values, which
express the activity as a fractional ratio with the underlying star,following the prescription described in Noyes et al. (1984). How-ever, this conversion requires proper characterization of the under-lying photospheric flux, which can be assessed from the intrinsicstellar B� V color. B� V colors for most stars are obtained fromthe Tycho-2 catalog (Høg et al. 2000). These values are transformedto Johnson B�V colors, following the relations inMamajek et al.(2002).4 For objects without Tycho photometry, the B�V colorsare estimated from the stellar spectral type (x 4.3) following therelations of Johnson (1966).
R0HK is calculated as the difference in the logarithms of the flux-
calibrated core emission RHK and photospheric emission Rphot:
R0HK ¼ RHK� Rphot: ð4Þ
Here RHK is calculated from the SMW values and calibrated us-ing the stellar B� V color, and Rphot is calculated from the B� Vcolor alone (see Appendix B in Noyes et al. 1984 for explicit for-mulae). Although the calibration of these terms is determined overthe restricted B� V range of 0:44 < (B� V ) < 0:82, we use itfor the full B� V range of the observed sample [0:19 < (B�V ) < 1:65]. The resulting R0
HK values are listed in Table 1.
5. SAMPLE PROPERTIES
5.1. Spectroscopic Binaries
Table 2 lists the eight stars with photospheric spectral featuresthat are doubled in our observations. Two of these double-linedspectroscopic binaries were previously known (HE 848, SAO178 272), while HD 78899, Tyc 7310 503 1, Tyc 7305 380 1, andHD 140374 are newly identified. The multiple-epoch observa-tions of some stars also allow us to identify single-lined binariesbased on changes in radial velocity. We consider an object a can-didate binary if its radial velocity changed by more than 10 �between observations; three stars meet this criteria: HD 92855
(HIP 52498), HD 132173 (HIP 73269), and HD 61994 (HIP38018; see Table 1). Similarly, based on comparisons with radialvelocities published in Nordstrom et al. (2004) HD 108944 (HIP61072) and HD 121320 (HIP 67904) are candidate binaries (seeFig. 6). All five are newly identified candidate binary systems.
4 There is a typographical error in the relations of Mamajek et al. (2002). The+0.007813 in eq. (C6) should be �0.007813.
Fig. 9.—EW(Li i k6708), EW(H�), and v sin i vs. the chromospheric activitydiagnostic log R0
HK. Measured values are shown as squares while upper limits areshown as triangles.
SPECTRA OF YOUNG NEARBY STARS 2533No. 6, 2007

Finally, since the radial velocity dispersion in young clusters istypically <2 km s�1, comparison of cluster member radial ve-locity measurements with the median cluster values can identifysingle-lined spectroscopic binaries. Based on these comparisons,the two Pleiades members HII 571 and LH98 103 are identified asspectroscopic binaries; both have been identified previously assuch (Mermilliod et al. 1992; Queloz et al. 1998).
5.2. Sample Age Dispersion
Several of the quantities extracted from the observed spectraare likely to be correlated with stellar age, based on extensivestudies in the literature. Generally speaking, younger stars tendto be more rapidly rotating, have larger lithium abundances, andhave stronger chromospheric emission lines such asCa iiHandK,and H�. Thus the measured quantities v sin i, EW(Li i k6708),log R0
HK, and EW(H�) should correlate with age. Unfortunatelythe precision with which stellar ages can be estimated from thesequantities is in general poor, in part because of the additional de-pendencies on stellar spectral type and rotation. Rather than at-tempting to disentangle these complicating effects for individualstars, we simply present the data to illustrate the empirical corre-lations among the measured quantities and to assess the overallage range of the observed sample.
Fig. 10.—EW(H�) and v sin i vs. EW(Li i k6708). Measured values areshown as squares while upper limits are shown as triangles.
Fig. 11.—Projected rotational velocity (v sin i), EW(Li i k6708), log R0HK, and
EW(H�) vs. B� V color. Filled circles indicate dwarf standard stars. For clarity,a few stars in the observed sample are bluer than (SAO 41857) and redder than(HIP108467, HIP 90190, and HIP 60783) the B� V range shown here; the val-ues are nevertheless included in Table 1. Similarly, in the bottom panel four starswith strong H� emission [EW(H�) < �10; Fig. 4] are not shown.
WHITE, GABOR, & HILLENBRAND2534 Vol. 133

Figure 9 shows the distributions of EW(Li i k6708), EW(H�),and v sin i versus log R0
HK. Error bars are not displayed due tocrowding, but can be inferred from the information in Table 1.The EW(Li i) and log R0
HK values are reasonably well correlated,as expected if strong lithium absorption and strong chromosphericemission, as traced by Ca ii emission, both indicate stellar youth.The EW(H�) and log R0
HK values are at best weakly correlated;starswith larger log R0
HK values have, on average, smaller EW(H�)values, suggesting they are partially filled in by emission. Thestrong spectral-type dependence of this temperature-sensitive linelikely masks much of the underlying correlation which might berevealed by considering an analogously defined quantity R0
H�. Thev sin i values are well correlated, in themean, with log R0
HK values.This is expected since increased rotation is believed to cause in-creased chromospheric activity, a characteristic common in youngstars. Finally, in Figure 10 are shown the distributions of EW(H�)and v sin i versus EW(Li i). Both the EW(H�) and v sin i valuesare correlated with EW(Li i) in the mean, although both show alarge scatter at all EW(Li i) values.
The above correlations corroborate the suggestion that thesemeasured quantities trace stellar age. While the large scatter inthese correlations inhibits assigning specific ages to individualstars, the ensemble distributions can help assess the age of the ob-served sample. Since the stellar temperature can also affect thesequantities, we consider these distributions as a function of B� Vcolor, a proxy for stellar temperature. The range of observed val-ues at anyB� V color should therefore (mostly) be a consequenceof the age spread in the sample; a comparison of the spread of val-ues at different colors can serve as a check for age biases with re-spect to temperature.
In Figure 11 are shown the distributions of v sin i, EW(Li ik6708), log R0
HK, and EW(H�) versus B� V color (as assem-bled in x 4.4). The observed dwarf standards are distinguished inorder to illustrate the properties of old slowly rotating stars. Thedistributions of v sin i and log R0
HK are independent of B� Vcolor, indicating a similar spread in rotation rate and chromo-spheric activity over the range of spectral types observed. TheEW(Li i) values span a broad range at each B� V color. Thelarger EW(Li i) values at the red end are a temperature effect;for a specified lithium abundance, the EW(Li i) increases withdecreasing stellar temperature (Pavlenko & Magazzu 1996).The EW(H�) values show the strongest B� V trend, as expectedfor this temperature-sensitive line; the EW(H�) values decreasewith increasing B� V color. There is also a larger scatter at largerB� V values. The scatter above the dwarf loci can be inter-preted as stars with some H� emission, whether this is partially orcompletely [e.g., EW(H�)<0.0] filling in the photospheric absorp-tion line. Four stars with strong H� emission [EW(H�) >�10 8]are not plotted; their profiles are shown in Figure 4. Stars with someH� emission span the full range of B� V colors, although thereappear to be many more at redder colors (B� V > 1:0) than bluercolors (B� V < 0:6). However, since an EW is defined relative tothe continuum flux, a unique EW(H�) value corresponds tomuchless H� flux for cooler (red) stars than hotter (blue) stars. Overall,these age indicators are consistent with the observed sample havingages that span from a fewmillion years to a fewbillion years, aswasintended. Moreover, all spectral types appear to span this range ofages; there is no strong age bias with spectral type among the ob-served sample.
5.3. Ca ii H and K Saturation in Young Stars
While log R0HK values have been shown to correlate with stel-
lar age (e.g., Soderblom et al. 1991), this diagnostic typically has
not been used to estimate ages less than�100 Myr. This primar-ily stems from the lack of R0
HK measurements for stars in youngclusters of known age, from which the age relation could be cal-ibrated. Although the P60 R0
HK measurements of young clustermembers presented here may help establish this calibration, weillustrate that accurate ages will be inhibited by the broad rangein rotation rates for stars at a given young age and the saturationof flux at high rotation rates.
In Figure 12 are shown the R0HK measurements versus pro-
jected rotational velocity (v sin i) of stars in the open clustersrepresented in our sample, including � Persei, the Pleiades, theHyades, and collectively (post) T Tauri stars in Upper Scorpius,Upper Centaurus Lupus, and R Corona Australis. As expected,the R0
HK measurements are correlated with v sin i; the most rapidlyrotating stars have, on average, the largest R0
HK values. However,Figure 12 also indicates that once the v sin i values increase above�30 km s�1, the R0
HK values stay roughly constant, implying noincrease in the Ca ii H and K emission-line flux toward larger ro-tation rates. A similar ‘‘saturation’’ phenomenon has been seenbefore based on observations of other emission lines originating instellar chromospheres (O i k1304, C ii k1335), as well as X-raysoriginating in stellar coronae (e.g., Vilhu 1984). It is not yet knownwhether the cause for flux saturation is internal (e.g., dynamo) orexternal (e.g., active regions) to the star (see Gudel 2004). Satu-ration of the Ca ii H and K fluxes, as measured by the R0
HK diag-nostic, has not been demonstrated before.
While saturation of the Ca ii H and K flux seems consistentwith other chromospheric and coronal observations of rapidlyrotating stars, we considered the possibility that this saturationis simply a consequence of the method used to determine theS values, which are used to calculate R0
HK. Specifically, since theprescription outlined in x 4.4 involves measuring the Ca iiK andH emission with a triangular passband of specified width, appar-ent saturation could be caused by emission-line flux being rota-tionally broadened outside of this passband, and thus not includedin the measurement. To test this, we remeasured S values for a set
Fig. 12.—R0HK and LX/Lbol measurements of open-cluster members vs. v sin i.
Filled circles are� Permembers, squares are Pleiads, triangles are Hyads, and opencircles are T Tauri stars in Upper Scorpius, Upper Centaurus Lupus, and R CoronaAustralis. Stars with a v sin i upper limit are plotted with a v sin i of 5 km s�1 forclarity.
SPECTRA OF YOUNG NEARBY STARS 2535No. 6, 2007

of stars that were artificially rotationally broadened from 10 to150 km s�1; we assume the core emission is rotationally broad-ened by the same amount as the photosphere. This showed thatthe technique used to measure the S values begins to miss coreemission flux above v sin i of�100 km s�1. Since the saturationobserved for R0
HK occurs well below this value, we interpret thesaturation as a real effect.
To further demonstrate the case for saturation, in Figure 12 wealso illustrate the ratio of X-ray flux to bolometric flux (LX/Lbol)for the stars in these clusters which have the available data. X-rayfluxes are from ROSAT observations and bolometric fluxes aredetermined from the atmospheric model which best fits the stel-lar energy distribution (see E. E. Mamajek et al. [2007, in prep-aration] for a complete description of the LX/Lbol derivation). Asaturation trend is identified for coronal X-rays similar to that forchromospheric Ca ii H and K core emission. The most rapidlyrotating stars are the most fractionally X-ray bright, but LX/Lbolremains roughly constant above v sin i values of �30 km s�1.
This phenomenon has been demonstrated previously by manyauthors. What we have newly demonstrated here is that the sameyoung cluster stars that have saturated X-ray emission also havesaturated chromospheric Ca ii H and K emission.
We are grateful to the observing assistants formerly present atthe Palomar 60 inch, Karl Dunscombe and Skip Staples, for theirhelp and patience in acquiring this large data set. We thank E.Mamajek and C. Slesnick for assisting with the observations andJonathan Foster, Francesca Colonnese, andMichael Inadomi fortheir assistance with data reduction and analysis. We appreciategreatly the scattered-light analysis provided by J. Valenti for someof our spectra. This research has made use of the SIMBAD and2MASS databases. We acknowledge support for these observa-tions from NASA contract 1224566 administered through JPL.This work has benefited from the ability to organize our datawithin the FEPS database created by John Carpenter.
REFERENCES
Cutri, R. M., et al. 2003, The IRSA 2MASS All-Sky Point Source Catalog(Pasadena: NASA/ IPAC)
Duncan, D. K., et al. 1991, ApJS, 76, 383Gray, D. 1992, The Observation and Analysis of Stellar Photospheres (Cam-bridge: Cambridge Univ. Press)
Gudel, M. 2004, A&A Rev., 12, 71Høg, E., et al. 2000, A&A, 357, 367Houk, N., & Swift, C. 1999, Michigan Catalogue of Two-Dimensional SpectralTypes for the HD Stars, Vol. 5 (Ann Arbor: Univ. Michigan)
Jaschek, C., & Jaschek, M. 1987, The Classification of Stars (Cambridge:Cambridge Univ. Press)
Johnson, H. L. 1966, ARA&A, 4, 193Kharchenko, N. V. 2001, Kinematika Fiz. Nebesnykh Tel, 17, 409Mamajek, E. E., Meyer, M. R., & Liebert, J. 2002, AJ, 124, 1670McCarthy, J. K. 1988, Ph.D. thesis, CaltechMermilliod, J.-C., Rosvick, J. M., Duquennoy, A., & Mayor, M. 1992, A&A,265, 513
Meyer, M. R., et al. 2006, PASP, 118, 1690Muzerolle, J., Calvet, N., & Hartmann, L. 1998, ApJ, 492, 743Nidever, D. L., Marcy, G. W., Butler, R. P., Fischer, D. A., & Vogt, S. S. 2002,ApJS, 141, 503
Nordstrom, B., et al. 2004, A&A, 418, 989
Noyes, R.W., Hartmann, L.W., Baliunas, S. L., Duncan, D. K., & Vaughan, A. H.1984, ApJ, 279, 763
Ochsenbein, F., Bauer, P., & Marcout, J. 2000, A&AS, 143, 23Pavlenko, Y. V., & Magazzu, A. 1996, A&A, 311, 961Queloz, D., Allain, S., Mermilliod, J.-C, Bouvier, J., & Mayor, M. 1998, A&A, 335,183
Soderblom, D. R., Duncan, D. K., & Johnson, D. R. H. 1991, ApJ, 375, 722Soderblom, D. R., Jones, B. F., Balachandran, S., Stauffer, J. R., Duncan, D. K.,Fedele, S. B., & Hudon, J. D. 1993, AJ, 106, 1059
Strassmeier, K., Washuettl, A., Granzer, Th., Scheck, M., & Weber, M. 2000,A&AS, 142, 275
Thorburn, J. A., Hobbs, L. M., Deliyannis, C. P., & Pinsonneault, M. H. 1993,ApJ, 415, 150
Vaughan, A. H., Preston, G. W., & Wilson, O. C. 1978, PASP, 90, 267Vilhu, O. 1984, A&A, 133, 117Vogt, S. S., et al. 1994, Proc. SPIE, 2198, 362White, R. J., & Basri, G. 2003, ApJ, 582, 1109White, R. J., & Hillenbrand, L. A. 2004, ApJ, 616, 998Wichmann, R., Schmitt, J. H. M. M., & Hubrig, S. 2003, A&A, 399, 983Wilson, O. C. 1968, ApJ, 153, 221Wright, J. T., Marcy, G. W., Butler, R. P., & Vogt, S. S. 2004, ApJS, 152,261
WHITE, GABOR, & HILLENBRAND2536