high-density wireless networks for auditoriums validated...
TRANSCRIPT
High-Density Wireless Networks for Auditoriums
Validated Reference Design
Sol
utio
n G
uid
e
Copyright
© 2010 Aruba Networks, Inc. AirWave®, Aruba Networks®, Aruba Mobility Management System®, Bluescanner, For Wireless That Works®, Mobile Edge Architecture®, People Move. Networks Must Follow®, RFprotect®, The All Wireless Workplace Is Now Open For Business, Green Island, and The Mobile Edge Company® are trademarks of Aruba Networks, Inc. All rights reserved. Aruba Networks reserves the right to change, modify, transfer, or otherwise revise this publication and the product specifications without notice. While Aruba uses commercially reasonable efforts to ensure the accuracy of the specifications contained in this document, Aruba will assume no responsibility for any errors or omissions.
Open Source Code
Certain Aruba products include Open Source software code developed by third parties, including software code subject to the GNU General Public License (“GPL”), GNU Lesser General Public License (“LGPL”), or other Open Source Licenses. The Open Source code used can be found at this site:
http://www.arubanetworks.com/open_source
Legal Notice
ARUBA DISCLAIMS ANY AND ALL OTHER REPRESENTATIONS AND WARRANTIES, WEATHER EXPRESS, IMPLIED, OR STATUTORY, INCLUDING WARRANTIES OF MERCHANTABILITY, FITNESS FOR A PARTICULAR PURPOSE, TITLE, NONINFRINGEMENT, ACCURACY AND QUET ENJOYMENT. IN NO EVENT SHALL THE AGGREGATE LIABILITY OF ARUBA EXCEED THE AMOUNTS ACUTALLY PAID TO ARUBA UNDER ANY APPLICABLE WRITTEN AGREEMENT OR FOR ARUBA PRODUCTS OR SERVICES PURSHASED DIRECTLY FROM ARUBA, WHICHEVER IS LESS.
www.arubanetworks.com
1344 Crossman AvenueSunnyvale, California 94089
Phone: 408.227.4500Fax 408.227.4550
High-Density Wireless Networks for Auditoriums Validated Reference Design | Solution Guide October 2010
High-Density Wireless Networks for Auditoriums VRD | Solution Guide
ContentsChapter 1 Introduction 7About Aruba Networks 7
Aruba Validated Reference Designs 7
Solution Guide Assumptions and Scope 8
Design Validation and Testing 9
Reference Documents 9
Chapter 2 Design Requirements for Auditorium HD WLANs 11
Functional Requirements 12
Technical Requirements—Client Devices 13
Technical Requirements—Wired Infrastructure 13
Technical Requirements – Wireless Infrastructure 14
Chapter 3 Capacity Planning for HD-WLANs 17HD WLAN Capacity Planning Methodology 17
Step #1: Choose a High-Density WLAN Capacity Goal 18
Step #2: Determine the Usable Number of Channels 1920-MHz vs. 40-MHz Channels 19Available 5-GHz Channels 20
To DFS or Not to DFS? 22Site-Specific Restrictions 22
5-GHz Channel Reuse 23Available 2.4-GHz Channels 242.4-GHz Channel Reuse 24
Step #3: Choose a Concurrent User Target 25Mixed Auditoriums with Both 802.11n and Legacy Clients 25Choosing a Concurrent User Target 27
Step #4: Predict Total Capacity 275-GHz Capacity 272.4-GHz Capacity 29
Step #5: Validate the Capacity Goal 29
Chapter 4 RF Design for HD WLANs 31
Coverage Strategies for Auditoriums 31Overhead Coverage 32Side Coverage (Walls or Pillars) 35Floor Coverage (Picocells) 38
Choosing Access Points and Antennas 40Recommended Products 41Choosing an Access Point 44External Antenna Selection 44
Minimum Spacing Between Adjacent Channel APs 45AP and Antenna Spacing – Overhead and Underfloor Strategies 45AP and Antenna Spacing – Side Coverage Strategy 46
Aesthetic Considerations 47
Contents | 3
General Installation Best Practices 48
Managing Adjacent HD WLANs 48Managing Clients 48Overhead or Floor Coverage 49Side Coverage with Directional Antennas in Series 49Side Coverage with Back-to-Back APs and Directional Antennas 50
Chapter 5 Infrastructure Optimizations for HD WLANs 51Essential ArubaOS Features for HD WLANs 51
Achieving Optimal Channel Distribution 51ARM Channel Selection 52Mode-Aware ARM 52
Achieving Optimal Client Distribution 53Band Steering 53Spectrum Load Balancing 54
Optimal Power Control 54How ACI and CCI Reduce WLAN Performance 54
How the 802.11 Carrier Sense Works 55How Adjacent Channel Interference Reduces WLAN Performance 55How Co-Channel Interference Reduces WLAN Performance 58
Limiting AP Transmitter Power 60Limiting Client Transmitter Power 60Enabling the Aruba RX Sensitivity Tuning-Based Channel Reuse Feature 60
Optimal Airtime Management 61Ensuring Equal Access with Airtime Fairness 61Limiting “Chatty” Protocols 63Maximizing Data Rate of Multicast traffic 64Enabling Dynamic Multicast Optimization for Video 64Limiting Supported Legacy Data Rates 65
Other Required Infrastructure Settings 65VLAN Pooling 65
Chapter 6 Configuring ArubaOS for HD-WLANs 67Achieving Optimal Channel Distribution 68
Enabling ARM Channel/Power Selection 68Enabling Mode-Aware ARM 69Enabling DFS Channels 70
Achieving Optimal Client Distribution 71Enabling Band Steering 71Enabling ARM Spectrum Load Balancing 72
Achieving Optimal Power Control 73Reducing AP Transmitter Power 73Limiting Client Transmitter Power 74Minimizing CCI with RX Sensitivity Tuning-Based Channel Reuse 74
Achieving Optimal Airtime Management 76Enabling Airtime Fairness 76Limiting “Chatty” Protocols 77Implementing Multicast Enhancements 78
Enabling Multicast Rate Optimization 78Enabling IGMP Snooping 80
Enabling Dynamic Multicast Optimization for Video 80Video Scalability 81
Reducing Rate Adaptation by Eliminating Low Legacy Data Rates 82
Other Required Infrastructure Settings 83VLAN Pooling 83
4 | Contents High-Density Wireless Networks for Auditoriums VRD | Solution Guide
Chapter 7 Troubleshooting for HD WLANs 85Scoping the Problem 85
End-to-End Solution Framework 86
HD WLAN Troubleshooting 86
Troubleshooting Flow Chart 87
Symptom #1: Device cannot see any SSIDs 88
Symptom #2: Device can see SSIDs but not the one it needs 88
Symptom #3: Device successfully authenticates but cannot communicate 90
Symptom #4: Device has Connection Loss and/or Poor Performance 91
Before You Contact Aruba Support 92
Appendix A HD WLAN Testbed 95Testbed Design 95
What is a Client Scaling Test? 95Testbed Design 95
Test Plan Summary 9620-MHz Channel Tests 9640-MHz Channel Tests 97Adjacent Channel Interference Tests 98Co-Channel Interference Tests 98
Test Results: 20-MHz Channel 99How does total channel capacity change as clients are added? 99How does per-client throughput change as clients are added? 101How much does throughput decrease as legacy stations are added? 102How many stations can contend before channel capacity declines? 102Is there a limit to the number of concurrent users an AP can serve? 103
Test Results: 40-MHz Channel 103How does total HT40 channel capacity change as clients are added? 103How does per-client HT40 throughput change as clients are added? 104
Appendix B Advanced Capacity Planning Theory for HD WLANs 107Predicting Total Capacity 107
Predicting Device Counts Using a Radio Budget 107Predicting Performance Using a Throughput Budget 109
Capacity Planning Methodology for HD WLANs 111
Appendix C Basic Picocell Design 113RF Design for Picocell 113
Understanding Structure of a Picocell 114Link Budget Analysis 115Minimum Channel Reuse Distance 116
Capacity Planning for Picocell 117
Reconciling the RF and Capacity Plans 117
Appendix D Dynamic Frequency Selection Operation 119Behavior of 5-GHz Client Devices in Presence of Radar 119
Behavior and Capabilities of 5 GHz Client Devices 120
DFS Summary 120
Appendix E Aruba Contact Information 121Contacting Aruba Networks 121
High-Density Wireless Networks for Auditoriums VRD | Solution Guide Contents | 5

6 | Contents High-Density Wireless Networks for Auditoriums VRD | Solution Guide
High-Density Wireless Networks for Auditoriums VRD | Solution Guide
Chapter 1Introduction
This guide explains how to implement an Aruba 802.11n wireless network that must provide high-speed access to an auditorium-style room with 500 or more seats. Aruba Networks refers to such networks as high-density wireless LANs (HD WLANs). Lecture halls, hotel ballrooms, and convention centers are common examples of spaces with this requirement. Because the number of concurrent users on an AP is limited, to serve such a large number of devices requires access point (AP) densities well in excess of the usual AP per 2,500 – 5,000 ft2 (225 – 450 m2). Such coverage areas therefore have many special technical design challenges. This validated reference design provides the design principles, capacity planning methods, and physical installation knowledge needed to successfully deploy HD WLANs.
About Aruba Networks Aruba delivers secure enterprise networks wherever users work or roam. Our mobility solutions bring the network to you — reliably, securely, and cost-effectively — whether you're working in a corporate office, teaching space, hospital, warehouse, or outdoors. Aruba 802.11n WLANs reduce the need for wired ports, which lowers operating costs. Our remote access point technology brings the network to branch offices, home offices, or temporary locations with plug-and-play simplicity, and all of the heavy lifting stays at the data center. For customers with legacy wireless LANs, our AirWave multivendor management tool supports WLAN devices from 16 manufacturers, which allows you to seamlessly manage old and new networks from a single console.
Aruba Validated Reference Designs An Aruba validated reference design (VRD) is a package of product selections, network decisions, configuration procedures and deployment best practices that comprise a reference model for common customer deployment scenarios. Each Aruba VRD has been constructed in a lab environment and thoroughly tested by Aruba engineers. By using these proven designs, our customers are able to rapidly deploy Aruba solutions in production with the assurance that they will perform and scale as expected.
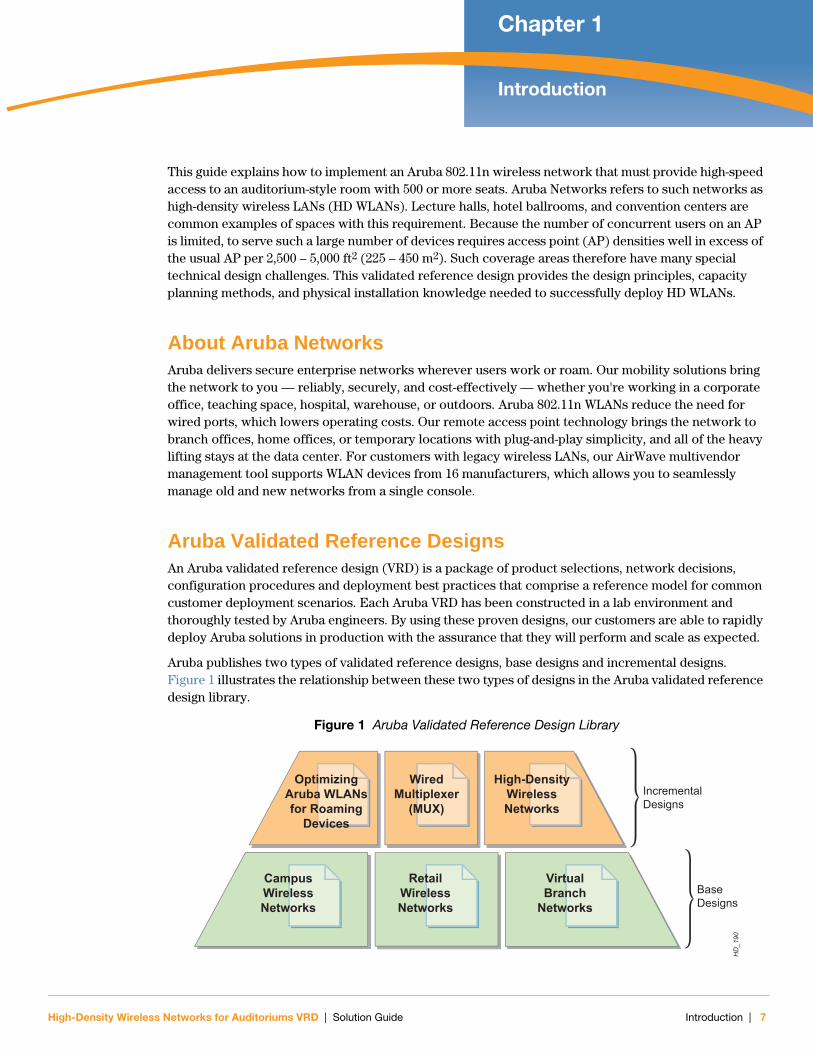
Aruba publishes two types of validated reference designs, base designs and incremental designs. Figure 1 illustrates the relationship between these two types of designs in the Aruba validated reference design library.
Figure 1 Aruba Validated Reference Design LibraryH
D_1
90
CampusWirelessNetworks
RetailWirelessNetworks
VirtualBranch
Networks
OptimizingAruba WLANsfor Roaming
Devices
WiredMultiplexer
(MUX)
High-DensityWirelessNetworks
IncrementalDesigns
BaseDesigns
Introduction | 7
A base design is a complete, end-to-end reference design for common customer scenarios. Aruba publishes the following base designs:
Campus Wireless Networks VRD: This guide describes the best practices for implementing a large campus wireless LAN (WLAN) that serve thousands of users spread across many different buildings joined by SONET, MPLS, or any other high-speed, high-availability backbone.
Retail Wireless Networks VRD: This guide describes the best practices for implementing retail networks for merchants who want to deploy centrally managed and secure WLANs with wireless intrusion detection capability across distribution centers, warehouses, and hundreds or thousands of stores.
Virtual Branch Networks VRD: This guide describes the best practices for implementing small remote networks that serve fewer than 100 wired and wireless devices that are centrally managed and secured in a manner that replicates the simplicity and ease of use of a software VPN solution.
An incremental design provides an optimization or enhancement that can be applied to any base design. Aruba publishes the following incremental designs:
High-Density Wireless Networks VRD (this guide): This guide describes the best practices for implementing coverage zones with high numbers of wireless clients and APs in a single room such as lecture halls and auditoriums.
Optimizing Aruba WLANs for Roaming Devices VRD: This guide describes best the practices for implementing an Aruba 802.11 wireless network that supports thousands of highly mobile devices such as Wi-Fi® phones, handheld scanning terminals, voice badges, and computers mounted to vehicles.
Wired Multiplexer (MUX) VRD: This guide describes the best practices for implementing a wired network access control system that enables specific wired Ethernet ports on a customer network to benefit from Aruba role-based security features.
Solution Guide Assumptions and ScopeThis guide is an incremental design. It addresses advanced radio frequency (RF) design topics, and it is intended for experienced WLAN engineers. This design builds on the base VRDs that Aruba has published (Campus Wireless Networks, Retail Wireless Networks, and Virtual Branch Networks). A properly implemented master/local design is a prerequisite to proceed with this High-Density VRD.
This guide is based on ArubaOS version 3.4.2.3. This guide makes assumptions about the knowledge level of the engineer, the existing architecture and configuration of the Aruba WLAN, and the AP type and wireless frequency band that will be used. Table 1 lists these assumptions.
Table 1 Solution Guide Assumptions
Category Assumption
Engineer Knowledge Level Thorough understanding of and experience with RF design principles, link budgets, RF behaviors, antenna selection, regulatory bodies, and allowable channel/power combinations, with Certified Wireless Network Administrator (CWNA) level or equivalent.
Thorough understanding of 802.11 MAC layer operation, beacons, probes, rate adaption, retries, CSMA/CA.
Experience with spectrum analysis and troubleshooting RF problems. Comfort with controller-based WLAN architectures that employ thin
APs. Thorough understanding of Aruba controller design, master/local
architectures, and controller and AP redundancy.
8 | Introduction High-Density Wireless Networks for Auditoriums VRD | Solution Guide

Design Validation and TestingTest cases for this VRD were executed against the RF design and physical architecture recommended in this guide using a heterogenous mix of up to 50 late-model laptops with varying operating systems, CPUs, and wireless network adapters. This mix approximates actual conditions in a typical auditorium. Aruba 3000 Series controllers were tested with AP-120 Series and AP-105 Series access points. ArubaOS release 3.4.2.3 was used to conduct these tests. Ixia Chariot 7.1 was used to produce repeatable controlled test loads that were used to characterize relative performance of various design choices. More information on test methodology can be found in Chapter 3, “Capacity Planning for HD-WLANs” on page 17 and Appendix A, “HD WLAN Testbed” on page 95.
Reference DocumentsThe following technical documents provide additional detail on the technical issues found in HD WLANs:
ARM Yourself to Increase Enterprise WLAN Data Capacity, Gokul Rajagopalan and Peter Thornycroft, Aruba Networks, 2009
Adaptive CSMA for Scalable Network Capacity in High-Density WLAN: a Hardware Prototyping
Approach, Jing Zhu, Benjamin Metzler, Xingang Guo and York Liu, Intel Corporation, 2006
Next Generation Wireless LANs: Throughput, Robustness, and Reliability in 802.11n, Eldad Perahia and Robert Stacey, Cambridge University Press, 2008
Own the Air: Testing Aruba Networks’ Adaptive Radio Management (ARM) in a High-Density
Client Environment, Network Test Inc., July 2010
Data sheets for Aruba AP-105, AP-124, and AP-125 access points
Data sheets for Aruba AP-ANT-13B, AP-ANT-16, AP-ANT-17, and AP-ANT-18 external antennas
Existing Aruba Configuration Base design was architected using one or more master/local clusters that conforms to the Campus, Retail (for example, distributed), or Virtual Branch Networks VRDs.
Complete control over the RF airspace; freedom to choose any combination of channels and power levels that are legal within the country/regulatory domain.
High-Density WLAN Design 5 GHz is the primary band for servicing clients and all 5-GHz-capable clients will be steered to that band; 2.4 GHz will accommodate legacy devices or provide overflow capacity for 5 GHz.
802.11n is required, with Gigabit Ethernet connections between each AP and the IDF to support peak AP throughputs.
High-throughput 20-MHz (HT20) channels are used exclusively in HD WLAN coverage zones to increase capacity. 40-MHz channels are not used in HD WLAN coverage zones.
Channels are not reused inside any single auditorium. However, reuse may occur for adjacent HD WLANs or adjacent conventional WLAN deployments. (See Appendix C, “Basic Picocell Design” on page 113 for discussion of advanced designs requiring reuse in a single room.)
Clients are stationary and evenly distributed within each auditorium. The infrastructure may influence them to roam to balance the load.
Table 1 Solution Guide Assumptions (Continued)
Category Assumption
High-Density Wireless Networks for Auditoriums VRD | Solution Guide Introduction | 9

10 | Introduction High-Density Wireless Networks for Auditoriums VRD | Solution Guide

High-Density Wireless Networks for Auditoriums VRD | Solution Guide
Chapter 2Design Requirements for Auditorium HD WLANs
HD WLANs are defined as RF coverage zones with a large number of wireless clients and APs in a single room. With the proliferation of wireless-enabled personal and enterprise mobile devices, a surprisingly diverse range of facilities need this type of connectivity:
Large meeting rooms
Lecture halls and auditoriums
Convention center meeting halls
Hotel ballrooms
Stadiums, arenas, and ballparks
Press areas at public events
Concert halls and ampitheaters
Airport concourses
Financial trading floors
Casinos
This VRD addresses auditorium-style areas. When you understand the auditorium scenario, it is quite straightforward to apply the design principles to almost any type of high-density coverage zone.
The high concentration of users in any high-density environment presents challenges for designing and deploying a wireless network. The explosion of Wi-Fi-enabled smartphones means that each person could have two or more 802.11 NICs vying for service, some of which may be capable of only 2.4-GHz communication. At the same time, maximum HD WLAN capacity varies from country to country based on the number of available radio channels. Balancing demand, capacity, and performance in this type of wireless network requires careful planning.
This chapter defines the functional and technical requirements of the auditorium scenario, including those for client devices, wired infrastructure, and wireless infrastructure. Understanding these requirements sets the stage for the design, configuration, and troubleshooting chapters to follow.
Design Requirements for Auditorium HD WLANs | 11
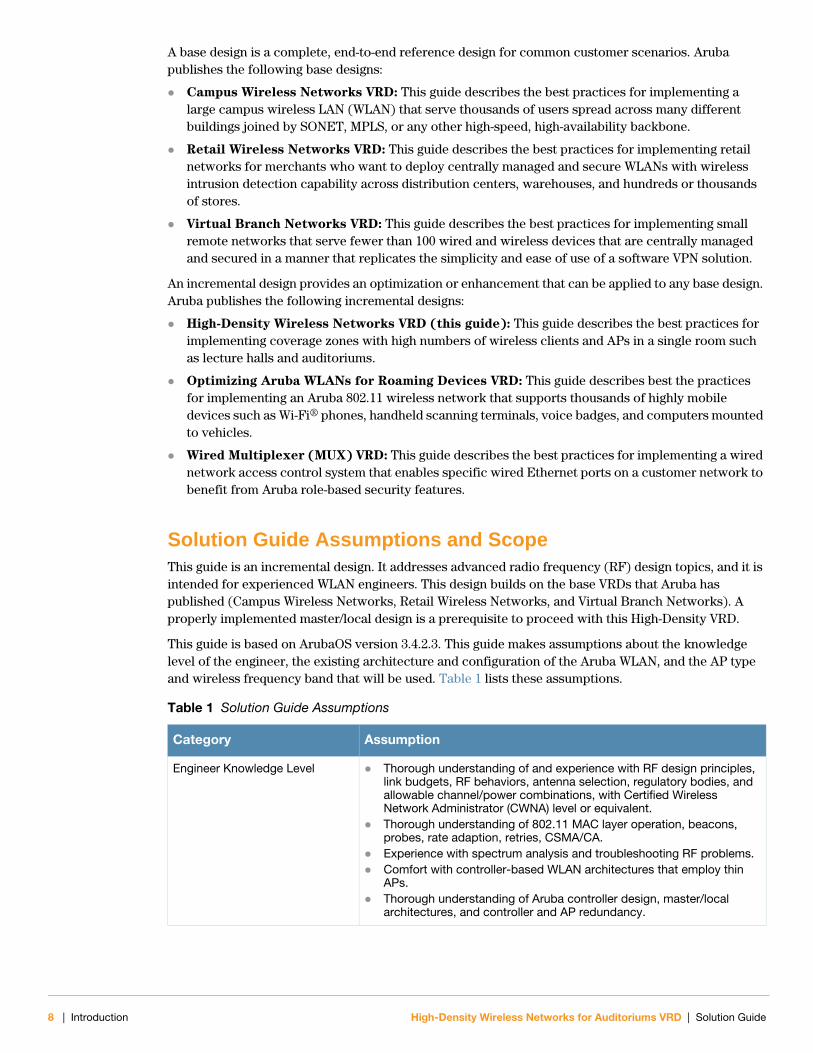
Functional RequirementsThe typical auditorium addressed by this VRD has a total target capacity of 500 seats. If each user is carrying a laptop and a Wi-Fi-enabled PDA or smartphone, the total WLAN client count could be as high as 1,000 devices. The average real-world, per-client bandwidth need is usually no more than 1 Mbps even for many video streaming deployments. In Chapter 3, “Capacity Planning for HD-WLANs” on page 17, we discuss how higher or lower throughput targets alter the total capacity of an HD WLAN.
Figure 2 500 Seat University Lecture Hall
The users in an auditorium are evenly distributed across the space because they are usually sitting in rows of stadium-type seating. The user density in the seating areas is an average of 1 user per 15 ft2 (5 m2), including aisles and other common areas. As many as 20 APs could be deployed in a single auditorium, depending on the total number of allowed channels in the regulatory domain. Available mounting locations are often less than ideal, and aesthetic and cable routing considerations limit installation choices.
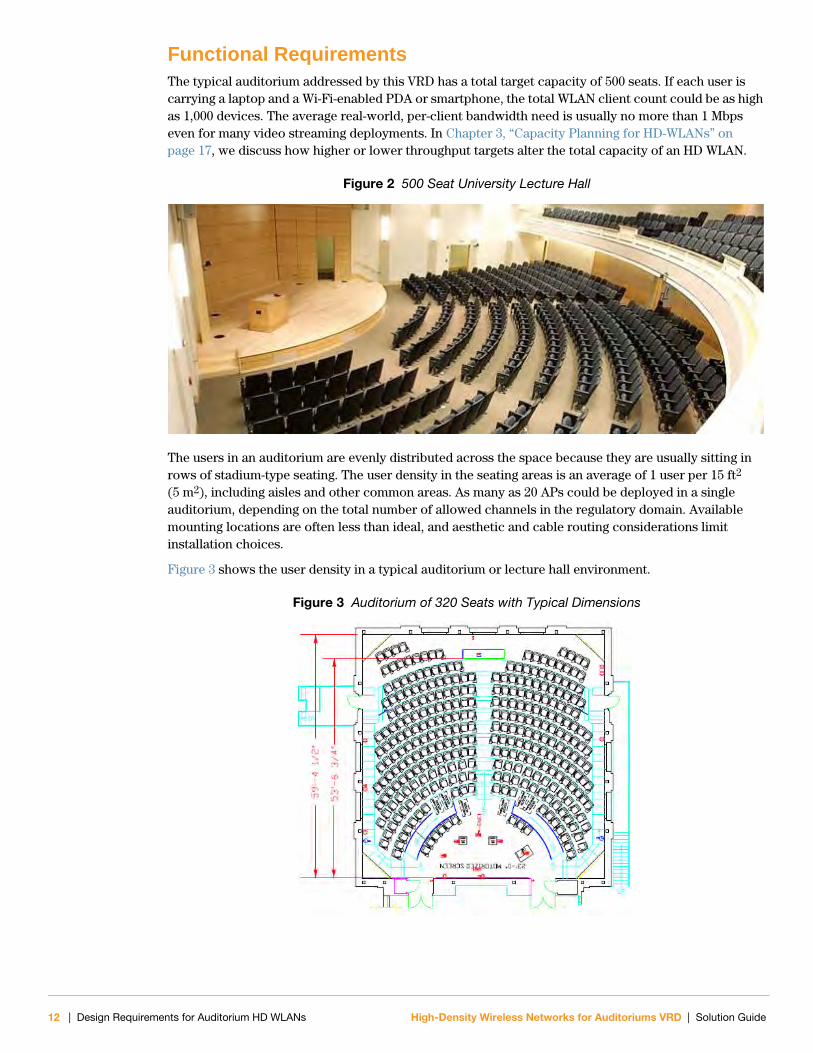
Figure 3 shows the user density in a typical auditorium or lecture hall environment.
Figure 3 Auditorium of 320 Seats with Typical Dimensions
12 | Design Requirements for Auditorium HD WLANs High-Density Wireless Networks for Auditoriums VRD | Solution Guide
The user density of the typical auditorium is approximately 20 times greater than an office environment. In a typical office environment with a mix of cubicles and offices, a typical client density is 250 – 350 ft2 (23 to 33 m2) per person, including common areas, with a per-client bandwidth need of 500 Kbps or less. It is common to deploy one AP every 2,500 to 5,000 ft2 (225 to 450 m2), which provides for average received signal strengths of -65 to -75 dBm depending on the walls and other structures in the area. Also, the office environment provides much more flexibility in AP mounting and placement choices.
In universities and convention centers, it is common for several auditoriums of varying capacities to exist side-by-side or above-and-below. This situation makes the design aspect even more challenging because the rooms are almost always adjacent and close enough to require careful management of co-channel interference (CCI) and adjacent channel interference (ACI) between auditoriums. This situation can include intended and unintended RF interaction between APs, clients, and between clients in different rooms. As a result, such facilities require special RF design consideration, which is covered in Chapter 4, “RF Design for HD WLANs” on page 31.
Technical Requirements—Client DevicesUnderstanding and controlling the output power and roaming behavior of the client devices is an essential requirement for any HD WLAN. Client radios greatly outnumber AP radios in any high-density coverage zone and therefore they dominate the CCI/ACI problem. 802.11h and Transmit Power Control (TPC) are critical, but they are totally dependent on the client WLAN hardware driver. Encouraging or requiring users to implement these features will greatly improve overall client satisfaction.
The usage profile of most dense auditorium environments is a heterogeneous, uncontrolled mix of client types. The devices are not owned and controlled by the facility operator, so they cannot be optimized or guaranteed to have the latest drivers, wireless adapters, or even application versions. Any operating system of any vintage or device form factor could be in use. Network adapters could be any combination of 802.11a, 802.11b, 802.11g, and 802.11n.
Users of the wireless network in an auditorium expect moderate throughput, high reliability, and low latency. Concurrent usage and initial connection is of primary concern in the design and configuration. Some common small handheld devices, such as the iPhone, go into a low power state frequently and cause a reconnection to the WLAN periodically. This demand puts more control path load on the WLAN infrastructure and it must be considered in the design.
The user traffic in an auditorium WLAN is a variety of application types. Some of the most common applications in the auditorium WLAN are HTTP/HTTPS traffic, email, and collaboration and custom classroom applications. Custom applications in an auditorium include classroom presentation and exam applications, as well as multicast streaming video applications. With the exception of video, these applications are bursty in nature and require concurrent usage by many or all of the wireless clients. Therefore, this VRD assumes that fair access to the medium is a fundamental requirement.
Technical Requirements—Wired InfrastructureThe user density and heterogeneous client mix inherent in the auditorium HD WLAN scenario also places a number of unique requirements on the wired network infrastructure. Some key requirements are:
Gigabit Ethernet (GbE) Edge Ports with 802.3af or 802.3at: This guide assumes 802.11n APs, which provide up to 300 Mbps per radio. This speed in turn requires gigabit connections at the edge.
10-Gigabit Ethernet Uplinks to Distribution Switches: Most, if not all, APs in each auditorium will terminate on the same IDF, so edge switch backplanes and uplinks must be sized for the expected peak aggregate throughput from the HD WLAN.
High-Density Wireless Networks for Auditoriums VRD | Solution Guide Design Requirements for Auditorium HD WLANs | 13
Simultaneous Logins/Logoffs: The RADIUS or other authentication server must be able to handle the inrush and outrush of users at fixed times (such as a class start and stop bell). Ensure that the AAA server can accommodate the expected peak number of authentications per second. You can use the Aruba command “show aaa authentication-server radius statistics“ to monitor average response time.
IP Address Space: Sufficient addresses must be available to support not only laptops but also smartphones and other future Wi-Fi-compatible devices that may expect connectivity. Some surplus space will be necessary to support inrush and outrush of users in a transparent fashion and in concert with the DHCP service lease times in order to prevent address exhaustion.
DHCP Service: The DHCP server for the HD WLAN must also be able to accommodate an appropriate inrush peak load of leases per second. Lease times must be optimized to the length of sessions in the room so that the address space can be turned over smoothly between classes or meetings.
Technical Requirements – Wireless InfrastructureHD WLANs also require specific capabilities in the wireless infrastructure, including:
Adaptive Radio Management (ARM) Dynamic RF Management: To minimize the IT administration burden and enable HD WLANs to adapt to changing RF conditions, dynamic channel and power selection features are a requirement. So are dynamic client distribution features including the ability to steer 5-GHz-capable clients to that band and spectrum load balancing to ensure even allocation of clients across available channels. Because there are many fewer 2.4-GHz channels than 5-GHz channels, another requirement is that the minimum number of 2.4-GHz radios are enabled inside each HD WLAN. This requires either an automatic coverage-management feature, such as the Aruba Mode-Aware ARM to convert surplus 2.4-GHz radios into air monitors to prevent unnecessary CCI. Alternatively, a static channel plan may be used in the 2.4-GHz band in parallel with ARM in the 5-GHz band.
ARM Airtime Fairness: Airtime fairness is basic requirement of any heterogenous client environment with an unpredictable mix of legacy and new wireless adapters. Older 802.11a/b/g clients that require more airtime to transmit frames must not be allowed to starve newer high-throughput clients. The ARM Airtime Fairness algorithm uses infrastructure control to dynamically manage the per-client airtime allocation. This algorithm takes into account the traffic type, client activity, and traffic volume before allocating airtime on a per-client basis for all its downstream transmissions. This ensures that with multiple clients associated to the same radio, no client is starved of airtime and all clients have acceptable performance.
VLAN Pooling: There must be adequate address space to accommodate all of the expected devices, including a reserve capacity for leases that straddle different meetings in the same room. At the same time, limiting the broadcast domain size is crucial to limiting over-the-air management traffic. Aruba’s VLAN Pooling feature provides a simple way to allocate multiple /24 subnets to accommodate any size auditorium.
Disabling Low Rates: By definition, any high-density coverage area has APs and clients in a single room or space. To minimize unnecessary rate adaptation due to higher collision activity, it is a requirement to reduce the number of supported rates. This may be accomplished by just enabling 24-54-Mbps legacy OFDM rates. However, all 802.11n MCS rates must be enabled for compatibility with client device drivers.
“Chatty” Protocols: A “chatty” protocol is one that sends small frames at frequent intervals, usually as part of its control plane. Small frames are the least efficient use of scarce airtime, and they should be reduced whenever possible unless part of actual data transmissions. Wherever chatty protocols are not needed, they should be blocked or firewalled. These protocols include IPv6 if it is not in production use, netbios-ns, netbios-dgm, Bonjour, mDNS, UPnP, and SSDP.
14 | Design Requirements for Auditorium HD WLANs High-Density Wireless Networks for Auditoriums VRD | Solution Guide
Dynamic Multicast Optimization (DMO): DMO makes reliable, high-quality multicast transmissions over WLAN possible. To ensure that video data is transmitted reliably, multicast video data is transmitted as unicast, which can be transmitted at much higher speeds and has an acknowledgement mechanism to ensure reliability. Transmission automatically switches back to multicast when the client count increases high enough that the efficiency of unicast is lost.
IGMP Snooping: Ensures that the wired infrastructure sends video traffic to only those APs that have subscribers.
Multicast-Rate-Optimization (MRO): Multicast over WLAN, by provision of the 802.11 standard, needs to be transmitted at the lowest supported rate so that all clients can decode it. MRO keeps track of the transmit rates sustainable for each associated client and uses the highest possible common rate for multicast transmissions.
Quality of Service (QoS): If voice or video clients are expected in the HD WLAN, it is essential that QoS be implemented both in the air as well as on the wire, end-to-end between the APs and the media distribution infrastructure.
Receive Sensitivity Tuning: Receive sensitivity tuning can be used to fine tune the APs to “ignore” clients that attempt to associate at a signal level below what is determined to be the minimum acceptable for a client in the intended coverage zone. This tuning helps to reduce network degradation to outside interference and/or client associations that may be attempted below the minimum acceptable signal level based on the desired performance criteria.
High-Density Wireless Networks for Auditoriums VRD | Solution Guide Design Requirements for Auditorium HD WLANs | 15

16 | Design Requirements for Auditorium HD WLANs High-Density Wireless Networks for Auditoriums VRD | Solution Guide

High-Density Wireless Networks for Auditoriums VRD | Solution Guide
Chapter 3Capacity Planning for HD-WLANs
Over the next four chapters you will learn capacity planning, RF design, configuration, and validation for HD WLANs. In this chapter, you will learn the basic approach to planning an HD WLAN and making a first-order assessment of whether the desired level of performance is possible for an area of a given size.
This chapter uses charts and lookup tables to provide the wireless architect with the necessary sizing parameters. These tables are based on extensive validation testing conducted in the Aruba labs. For those interested in the mathematics and theory of HD WLAN design behind the charts, Appendix B, “Advanced Capacity Planning Theory for HD WLANs” on page 107 provides a technical explanation of the process.
HD WLAN Capacity Planning MethodologyThe process of sizing an HD WLAN is straightforward if you have the benefit of certain test data and an accurate database of allowable channels in each country. You will follow the same five steps for each coverage zone you plan:
1. Choose a capacity goal: The first step is to pick an application-layer throughput target linked to the seating capacity of the auditorium.
2. Determine the usable number of channels: For each band, decide how many nonoverlapping channels are usable for the HD WLAN. Use a database of regulatory information included here, augmented by site-specific decisions such as whether or not Dynamic Frequency Selection (DFS) channels are available.
3. Choose a concurrent user target: Determine the maximum number of simultaneously transmitting clients that each AP will handle. Use a lookup table based on test data supplied by Aruba. You must do this for each radio on the AP.
4. Predict total capacity: Use the channel and concurrent user count limits to estimate the maximum capacity of the auditorium using lookup tables supplied by Aruba.
5. Validate against capacity goal: Compare the capacity prediction with the capacity goal from step 1. If the prediction falls short, you must start over and adjust the goal, concurrent user limit, or
HD
_277
Choose capacitygoal
Determine usablechannel count
Choose concurrentuser target
Predict totalcapacity
Validateagainst goal
Capacity Planning for HD-WLANs | 17
channel count until you have a plan that you can live with. For large auditoriums over 500 seats, you should be prepared to accept a per-client throughput of 500 Kbps or less, assuming a 50/50 mix of .11n and .11a stations and nine usable channels.
If Channel reuse is required to achieve the capacity goal, see Appendix C, “Basic Picocell Design” on page 113 for an advanced discussion of the theoretical issues involved in managing AP-to-AP and client-to-client interference. In practice, reuse is extremely difficult to achieve in most auditoriums due to their relatively small size and the signal propagation characteristics of multiple-in multiple-out (MIMO) radios. Reuse requires more complex calculations and testing as well as the potential for modifying physical structures in the user environment.
Step #1: Choose a High-Density WLAN Capacity GoalEvery HD WLAN design begins by defining a capacity goal. This goal has two parts, which are the key factors are necessary for the designer to properly scale and produce a HD WLAN project design.
Total number of devices: Often, this is just equal to the seating capacity of the area. Sometimes, each seat may contain more than one client (that is, one laptop and one Wi-Fi-capable smartphone). This is important because every MAC address consumes airtime, an IP address, and other network resources.
Minimum bandwidth per device: This is primarily driven by the mix of data, voice, and video applications that will be used in the room. Aruba recommends using LAN traffic studies to precisely quantify this value.
Here are some common examples of a complete capacity goal:
“Each classroom has 30 students who each need 2 Mbps of symmetrical throughput.”
“The auditorium holds 500 people. Each one has a laptop that must have at least 350 Kbps for data and a voice handset that requires at least 128 Kbps.”
“The trading floor must serve 800 people with at least 512 Kbps each.”
Each of these scenarios provides the wireless architect with a clear, concise, and measurable end state. It’s a good idea to build in future capacity needs. While the number of seats in the auditorium is not likely to change, it is nearly certain that the number of 802.11 radios per seat will increase in the future.
Be sure to consider the actual duty cycle of each device type when setting the capacity goal. In many cases, it is unlikely that every device will need access to the maximum capacity simultaneously (unless there are specific applications that require it such as interactive learning systems). It's a good idea to use a wireless packet capture utility to study the actual bandwidth requirements of a typical user. Many customers initially overestimate their bandwidth requirements.
N O T E
This guide assumes that channels will not be reused within a single auditorium.
18 | Capacity Planning for HD-WLANs High-Density Wireless Networks for Auditoriums VRD | Solution Guide
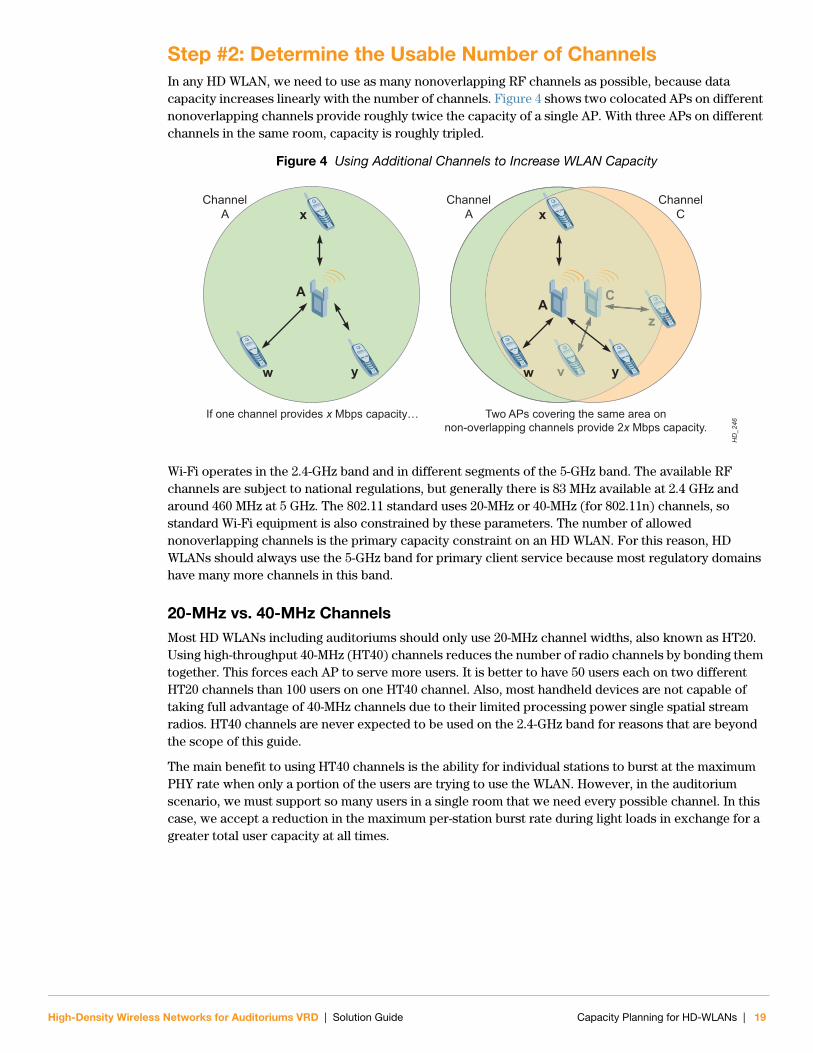
Step #2: Determine the Usable Number of ChannelsIn any HD WLAN, we need to use as many nonoverlapping RF channels as possible, because data capacity increases linearly with the number of channels. Figure 4 shows two colocated APs on different nonoverlapping channels provide roughly twice the capacity of a single AP. With three APs on different channels in the same room, capacity is roughly tripled.
Figure 4 Using Additional Channels to Increase WLAN Capacity
Wi-Fi operates in the 2.4-GHz band and in different segments of the 5-GHz band. The available RF channels are subject to national regulations, but generally there is 83 MHz available at 2.4 GHz and around 460 MHz at 5 GHz. The 802.11 standard uses 20-MHz or 40-MHz (for 802.11n) channels, so standard Wi-Fi equipment is also constrained by these parameters. The number of allowed nonoverlapping channels is the primary capacity constraint on an HD WLAN. For this reason, HD WLANs should always use the 5-GHz band for primary client service because most regulatory domains have many more channels in this band.
20-MHz vs. 40-MHz ChannelsMost HD WLANs including auditoriums should only use 20-MHz channel widths, also known as HT20. Using high-throughput 40-MHz (HT40) channels reduces the number of radio channels by bonding them together. This forces each AP to serve more users. It is better to have 50 users each on two different HT20 channels than 100 users on one HT40 channel. Also, most handheld devices are not capable of taking full advantage of 40-MHz channels due to their limited processing power single spatial stream radios. HT40 channels are never expected to be used on the 2.4-GHz band for reasons that are beyond the scope of this guide.
The main benefit to using HT40 channels is the ability for individual stations to burst at the maximum PHY rate when only a portion of the users are trying to use the WLAN. However, in the auditorium scenario, we must support so many users in a single room that we need every possible channel. In this case, we accept a reduction in the maximum per-station burst rate during light loads in exchange for a greater total user capacity at all times.
HD
_246
x
w y
If one channel provides x Mbps capacity… Two APs covering the same area onnon-overlapping channels provide 2x Mbps capacity.
ChannelA
ChannelA
ChannelC
CA
z
v
C
z
v
x
w
A
y
High-Density Wireless Networks for Auditoriums VRD | Solution Guide Capacity Planning for HD-WLANs | 19
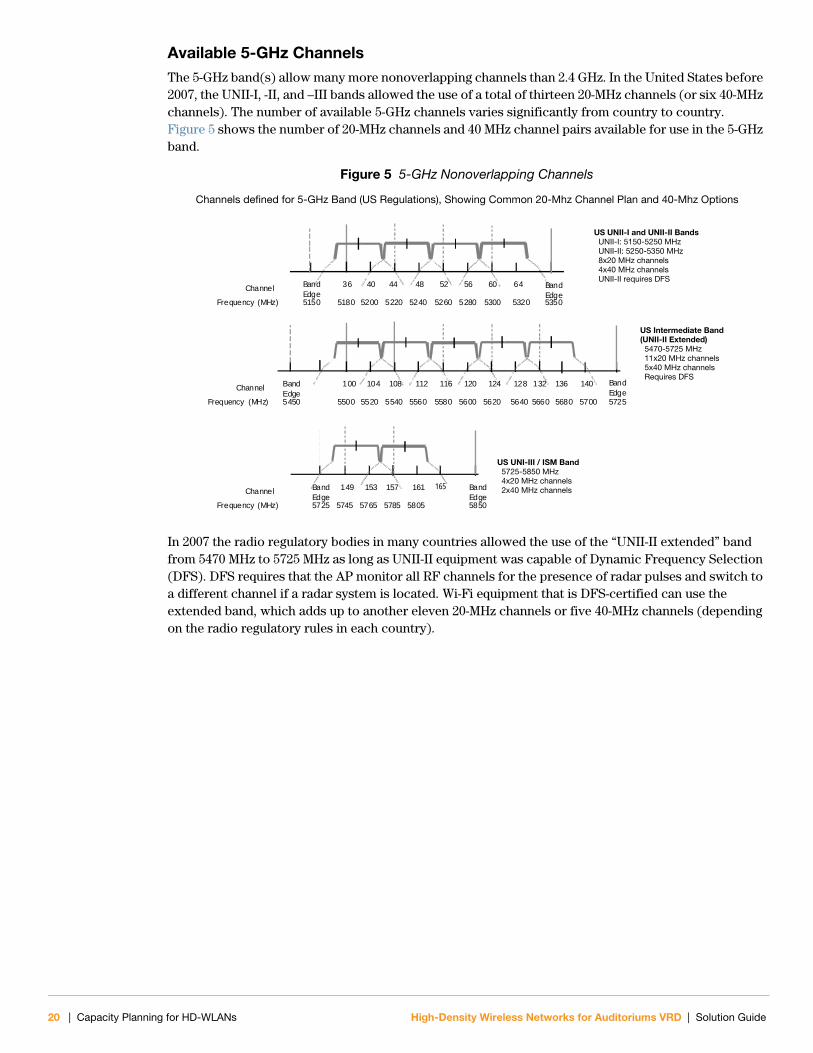
Available 5-GHz Channels The 5-GHz band(s) allow many more nonoverlapping channels than 2.4 GHz. In the United States before 2007, the UNII-I, -II, and –III bands allowed the use of a total of thirteen 20-MHz channels (or six 40-MHz channels). The number of available 5-GHz channels varies significantly from country to country. Figure 5 shows the number of 20-MHz channels and 40 MHz channel pairs available for use in the 5-GHz band.
Figure 5 5-GHz Nonoverlapping Channels
In 2007 the radio regulatory bodies in many countries allowed the use of the “UNII-II extended” band from 5470 MHz to 5725 MHz as long as UNII-II equipment was capable of Dynamic Frequency Selection (DFS). DFS requires that the AP monitor all RF channels for the presence of radar pulses and switch to a different channel if a radar system is located. Wi-Fi equipment that is DFS-certified can use the extended band, which adds up to another eleven 20-MHz channels or five 40-MHz channels (depending on the radio regulatory rules in each country).
Channels defined for 5 GHz band (US regulations), showing common 20 MHz channel plan and 40 MHz o ptions
Channel
Frequency (MHz)
US UNII I and UNII II bandsUNII I: 5150-5250 MHzUNII I I: 5250-5350 MHz8x 20 MHz channels4x 40 MHz channelsUNII I I requires DFS
149 161157153 BandEdge
Channel
Frequency (MHz) 5745 5765 5785 5805 5850
BandEdge5725
US UNII I II / ISM band5725-5850 MHz4x 20 MHz channels2x 40 MHz channels
Channel
Frequency (MHz)
US intermediate band (UNII I I extended)5450-5725 MHz11x 20 MHz channels5x 40 MHz channelsRequires DFS
36 4844 5240 56 6460 BandEdge
5180 5200 5220 5240 5260 5280 5300 5320 5350
BandEdge5150
100 112108 116104 120 128124
5500 5520 5540 5560 5580 5600 5620 5640
BandEdge5450
136 140 BandEdge
5680 5700 5725
132
5660
US Intermediate Band(UNII-II Extended)
5470-5725 MHz11x20 MHz channels5x40 MHz channelsRequires DFS
US UNII-I and UNII-II BandsUNII-I: 5150-5250 MHzUNII-II: 5250-5350 MHz8x20 MHz channels4x40 MHz channelsUNII-II requires DFS
US UNI-III / ISM Band5725-5850 MHz4x20 MHz channels2x40 MHz channels
Channels defined for 5-GHz Band (US Regulations), Showing Common 20-Mhz Channel Plan and 40-Mhz Options
165
20 | Capacity Planning for HD-WLANs High-Density Wireless Networks for Auditoriums VRD | Solution Guide
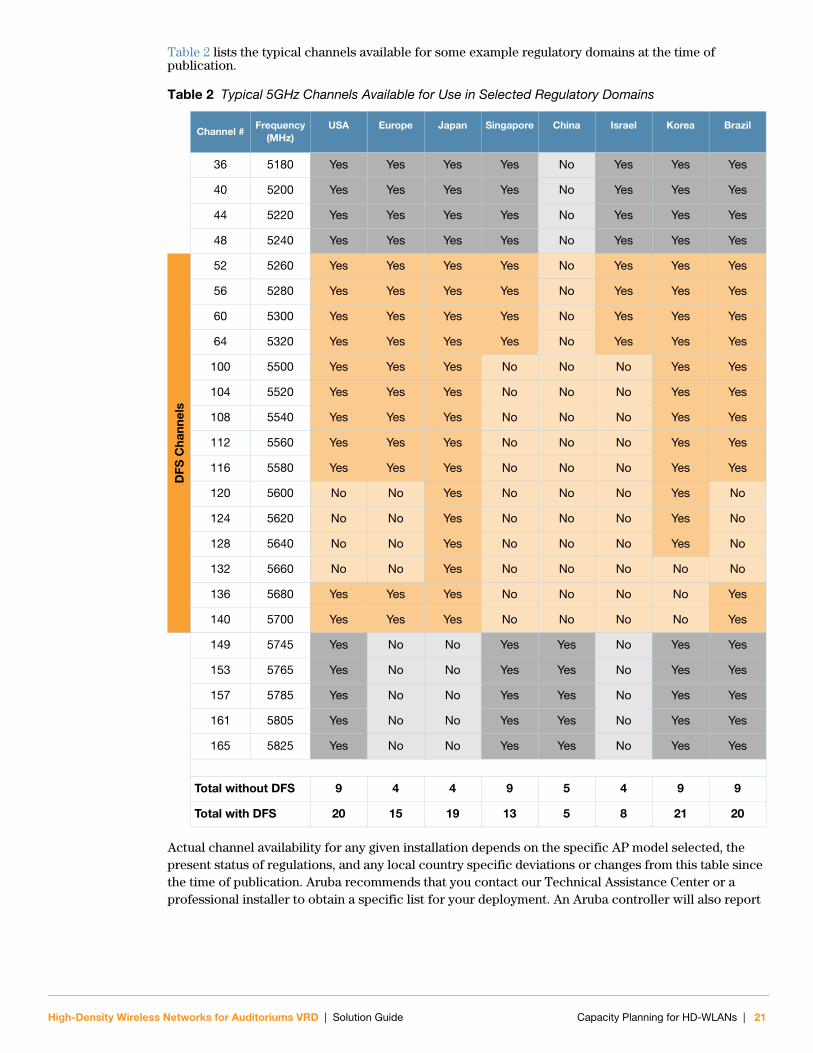
Table 2 lists the typical channels available for some example regulatory domains at the time of publication.
Actual channel availability for any given installation depends on the specific AP model selected, the present status of regulations, and any local country specific deviations or changes from this table since the time of publication. Aruba recommends that you contact our Technical Assistance Center or a professional installer to obtain a specific list for your deployment. An Aruba controller will also report
Table 2 Typical 5GHz Channels Available for Use in Selected Regulatory Domains
Channel #Frequency
(MHz)USA Europe Japan Singapore China Israel Korea Brazil
36 5180 Yes Yes Yes Yes No Yes Yes Yes
40 5200 Yes Yes Yes Yes No Yes Yes Yes
44 5220 Yes Yes Yes Yes No Yes Yes Yes
48 5240 Yes Yes Yes Yes No Yes Yes Yes
DFS
Cha
nnel
s
52 5260 Yes Yes Yes Yes No Yes Yes Yes
56 5280 Yes Yes Yes Yes No Yes Yes Yes
60 5300 Yes Yes Yes Yes No Yes Yes Yes
64 5320 Yes Yes Yes Yes No Yes Yes Yes
100 5500 Yes Yes Yes No No No Yes Yes
104 5520 Yes Yes Yes No No No Yes Yes
108 5540 Yes Yes Yes No No No Yes Yes
112 5560 Yes Yes Yes No No No Yes Yes
116 5580 Yes Yes Yes No No No Yes Yes
120 5600 No No Yes No No No Yes No
124 5620 No No Yes No No No Yes No
128 5640 No No Yes No No No Yes No
132 5660 No No Yes No No No No No
136 5680 Yes Yes Yes No No No No Yes
140 5700 Yes Yes Yes No No No No Yes
149 5745 Yes No No Yes Yes No Yes Yes
153 5765 Yes No No Yes Yes No Yes Yes
157 5785 Yes No No Yes Yes No Yes Yes
161 5805 Yes No No Yes Yes No Yes Yes
165 5825 Yes No No Yes Yes No Yes Yes
Total without DFS 9 4 4 9 5 4 9 9
Total with DFS 20 15 19 13 5 8 21 20
High-Density Wireless Networks for Auditoriums VRD | Solution Guide Capacity Planning for HD-WLANs | 21
the valid channels for a given regulatory domain with the “show ap allowed-channels country-code <country code>” command.
Enabling or disabling specific channels is done through the Regulatory Domain Profile of the AP Group to which the auditorium APs belong. Configuration of channel availability is covered in Chapter 6, “Configuring ArubaOS for HD-WLANs” on page 67.
To DFS or Not to DFS?
With as many as twenty 20-MHz channels (different vendors support slightly different numbers), the 5-GHz band with DFS now has sufficient channels to achieve high performance in a 500-seat auditorium without channel reuse in dozens of countries. Without DFS channels, the goal can still be achieved, but the radios will be oversubscribed and the per-client average throughput will be much lower. So why wouldn’t everyone use DFS?
Three significant exceptions could adversely affect HD WLAN performance with DFS enabled. The wireless architect must assess whether either of these exceptions applies to their organization:
Proximity to radar sources in the 5250-MHz to 5725-MHz band.
Lack of DFS support on critical client devices.
The Receive Sensitivity Tuning-Based Channel Reuse feature of ArubaOS is needed.
First, actual or false positive radar events can be extremely disruptive to a WLAN that attempts to use DFS channels. Users on DFS channels can potentially experience lengthy service interruptions from radar events. Because radar frequencies do not align with 802.11 channelization, such events can impact multiple Wi-Fi channels simultaneously. See Appendix D, “Dynamic Frequency Selection Operation” on page 119 for a more detailed discussion of radar operation and DFS compatibility.
Second, as of this writing, many 802.11 client Network Interface Cards (NICs) do not support DFS channels, especially outside the United States. Client devices in an auditorium are not generally under the control of the facility operator, so always be sure to include non-DFS channels in your HD WLAN channel plan for these devices.
Third, ArubaOS will not allow the Aruba Receive Sensitivity Tuning-Based Channel Reuse feature to be used with DFS channels, because it could result in the AP missing radar events. This feature is only available on the non-DFS channels in any regulatory domain.
Site-Specific Restrictions
Because high-density coverage zones are just one part of a larger facility, the channel plan for the rest of the site may also impose constraints on channel availability. Be sure to consider any reserved channels that are required for indoor or outdoor mesh operations, or for dedicated applications such as
N O T E
As of October 5, 2009, the United States FCC and European Technical Standardization Institute have disallowed 5600 to 5650MHz (approximately channels 120-132) for use with WLANs. This is to avoid interference with airport terminal doppler radar systems. Aruba APs with approvals as of that date, including AP-120 series and AP-105, are allowed to continue using those channels, but future AP models may not support them.
N O T E
The question of usability is also a function of the client and what channels its chipset/driver combination supports for that regulatory profile. For example, with driver version 13.1.1.1, both the Intel 5100agn and 5300agn WLAN NICs support all DFS channels in the US (both 52-64 and 100-140). However, with the same driver, the Intel 4965agn does not support channels 100-140. Another example is the Cisco 7925g voice handset, which does not support channel 165.
22 | Capacity Planning for HD-WLANs High-Density Wireless Networks for Auditoriums VRD | Solution Guide
IP surveillance video. It is prudent to conduct a spectrum clearing survey to ensure that no fixed frequency interference sources would further reduce channel selection.
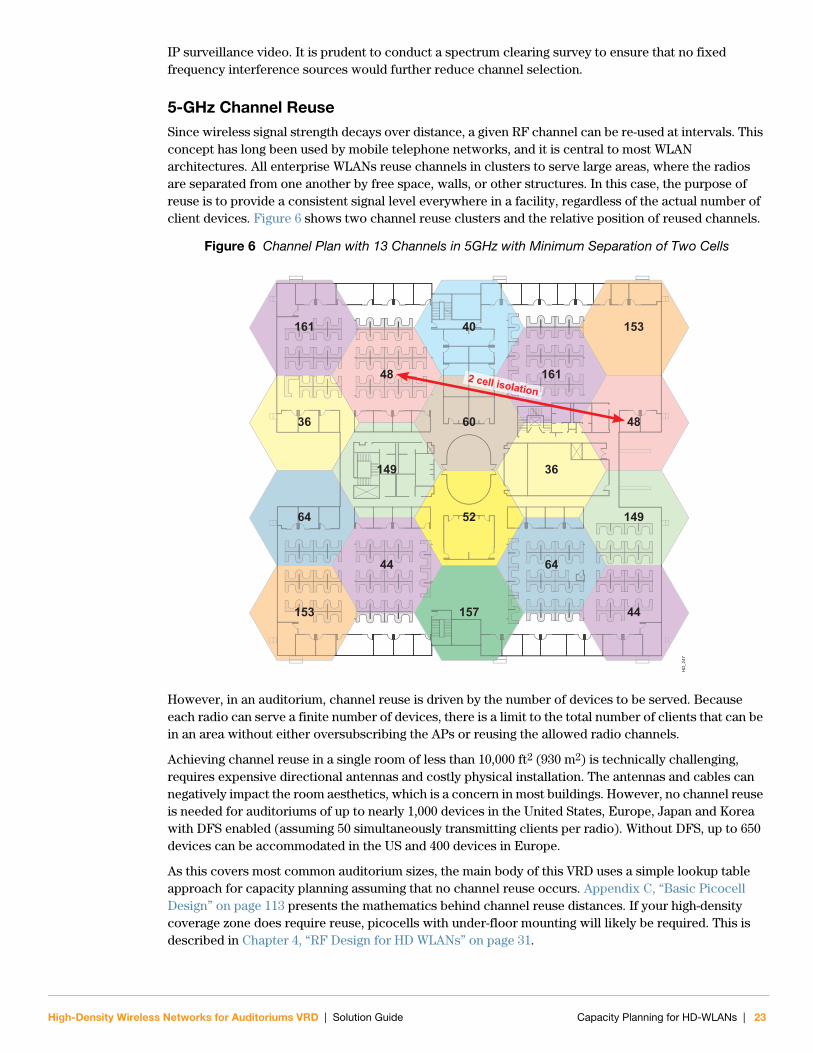
5-GHz Channel ReuseSince wireless signal strength decays over distance, a given RF channel can be re-used at intervals. This concept has long been used by mobile telephone networks, and it is central to most WLAN architectures. All enterprise WLANs reuse channels in clusters to serve large areas, where the radios are separated from one another by free space, walls, or other structures. In this case, the purpose of reuse is to provide a consistent signal level everywhere in a facility, regardless of the actual number of client devices. Figure 6 shows two channel reuse clusters and the relative position of reused channels.
Figure 6 Channel Plan with 13 Channels in 5GHz with Minimum Separation of Two Cells
However, in an auditorium, channel reuse is driven by the number of devices to be served. Because each radio can serve a finite number of devices, there is a limit to the total number of clients that can be in an area without either oversubscribing the APs or reusing the allowed radio channels.
Achieving channel reuse in a single room of less than 10,000 ft2 (930 m2) is technically challenging, requires expensive directional antennas and costly physical installation. The antennas and cables can negatively impact the room aesthetics, which is a concern in most buildings. However, no channel reuse is needed for auditoriums of up to nearly 1,000 devices in the United States, Europe, Japan and Korea with DFS enabled (assuming 50 simultaneously transmitting clients per radio). Without DFS, up to 650 devices can be accommodated in the US and 400 devices in Europe.
As this covers most common auditorium sizes, the main body of this VRD uses a simple lookup table approach for capacity planning assuming that no channel reuse occurs. Appendix C, “Basic Picocell Design” on page 113 presents the mathematics behind channel reuse distances. If your high-density coverage zone does require reuse, picocells with under-floor mounting will likely be required. This is described in Chapter 4, “RF Design for HD WLANs” on page 31.
161
36
149
48
44
40
60
52
157153
153
64
161
36
149
48
2 cell isolation
44
64
HD
_247
High-Density Wireless Networks for Auditoriums VRD | Solution Guide Capacity Planning for HD-WLANs | 23
Available 2.4-GHz Channels This solution guide assumes that the 5-GHz band is the primary service band for all auditoriums. However, many of today’s personal smartphones and enterprise single-mode voice handsets are not 5-GHz-capable. Therefore, many high-density coverage zones must be dual-band to provide some reduced level of service to those devices. The IEEE 802.11b/g standard allows only three nonoverlapping channels in 2.4 GHz, installed facing downward, as shown in Figure 7.
Figure 7 2.4-GHz Nonoverlapping Channels
These channels are available in most countries today. With a small amount of overlap, four channels have sometimes been employed to increase overall system capacity. However, four-channel plans are not advisable in HD WLANs due to the very high levels of ACI already present in the environment.
Because of the very limited number of nonoverlapping channels in the 2.4-GHz band, it is vital to anticipate how many of those radios will be on that band and to conduct a basic traffic study for the applications expected in your high-density coverage area. Aruba has found that most smartphones that provide basic push email service have low duty cycles and consume 256 Kbps or less. Voice-over-Wi-Fi handsets using higher quality G.711 codecs generate 128 Kbps of bidirectional traffic.
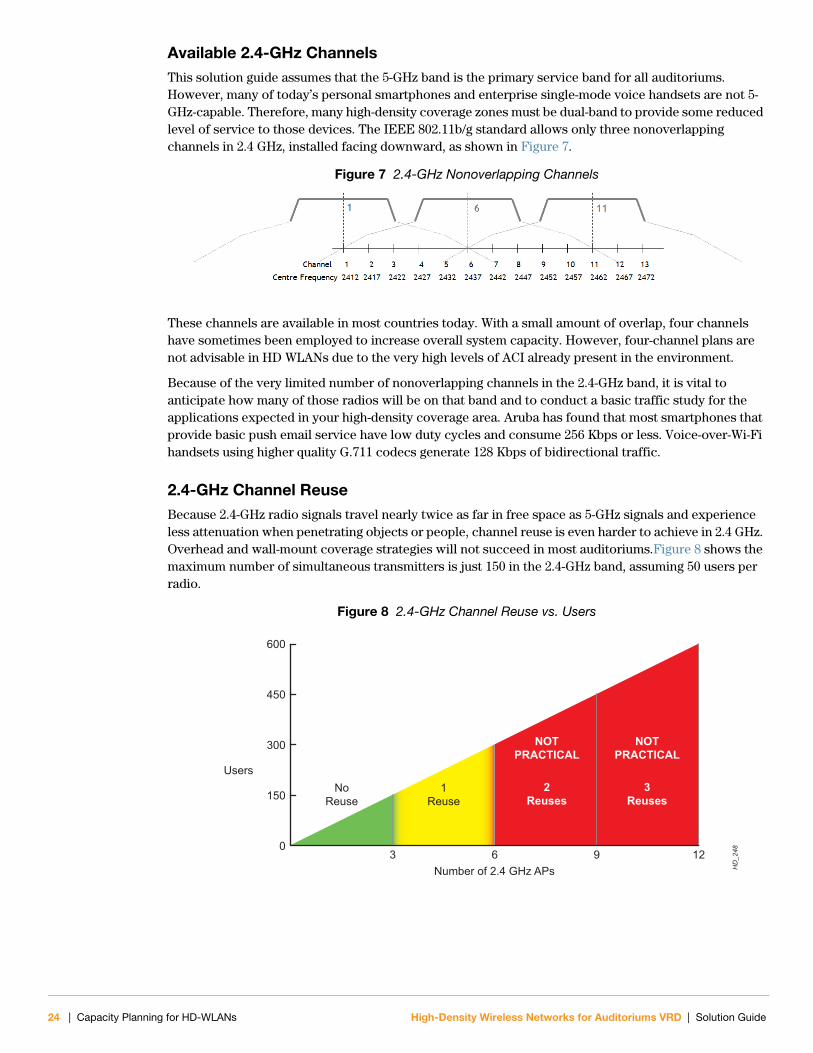
2.4-GHz Channel ReuseBecause 2.4-GHz radio signals travel nearly twice as far in free space as 5-GHz signals and experience less attenuation when penetrating objects or people, channel reuse is even harder to achieve in 2.4 GHz. Overhead and wall-mount coverage strategies will not succeed in most auditoriums.Figure 8 shows the maximum number of simultaneous transmitters is just 150 in the 2.4-GHz band, assuming 50 users per radio.
Figure 8 2.4-GHz Channel Reuse vs. Users
HD
_248
Users
Number of 2.4 GHz APs
NoReuse
1Reuse
2Reuses
3Reuses
NOTPRACTICAL
NOTPRACTICAL
600
450
300
150
03 6 9 12
24 | Capacity Planning for HD-WLANs High-Density Wireless Networks for Auditoriums VRD | Solution Guide
In planning mixed 2.4-GHz and 5-GHz deployments with dual-band APs, only one 2.4-GHz radio should be enabled on each of the three channels. Don't forget that these channels are very likely already being reused outside the auditorium, which will further reduce overall capacity of each 2.4-GHz channel.
Step #3: Choose a Concurrent User TargetThe next step is to figure out the practical limit for the number of client devices that can transmit simultaneously on a radio in your environment while still achieving your capacity goal. This is one of two main constraints on HD WLAN performance (the other being available channel count). The concurrent user limit is determined by looking up the per-client throughput value that best matches the capacity goal you picked in Step #1, adjusted for the expected mix of legacy and high-throughput stations.
Some vendors attempt to simplify this with blanket rules, such as recommending no more than 10 active voice calls or 25 active data clients. This works well enough for standard WLAN deployments, but is nowhere near precise enough for HD WLANs that need to serve large numbers of heterogeneous users with relatively few radios. The wireless architect trying to serve 500 auditorium users with just 10 available channels needs to know for sure how far each AP can scale and whether channel reuse can be avoided. If it cannot, then many more radios and a much more expensive and complex physical installation will be required.
Aruba’s research has shown that per-client limits are primarily determined by the mix of legacy 802.11a/b/g and 802.11n devices expected in the auditorium. The more legacy devices that are present, the lower the limit will be. For further information on the testbed Aruba constructed for this VRD, including detailed test results for both 20-MHz and 40-MHz channels, see Appendix A, “HD WLAN Testbed” on page 95.
Mixed Auditoriums with Both 802.11n and Legacy ClientsIn most auditoriums, it is probable that there will be a mix of 802.11a, 802.11g, and even 802.11b devices coexisting with faster 802.11n clients. The important parameter here is time on the medium, because an 802.11a client with a top rate of 54 Mbps will tend to slow down a population of 802.11n HT20 clients at 150 Mbps if all have data to send. The same phenomenon exists in the 2.4-GHz band. Therefore, the presence of even one older device can dramatically reduce the aggregate channel capacity, which in turn reduces the maximum per-client limit per radio.
Mixed WLAN environments support the latest high throughput standards while still supporting the legacy technologies 802.11g, 802.11b, and 802.11a through a protection mode mechanism that is part of the 802.11n standard. This is an automatic response by the APs and high throughput clients in the presence of legacy clients as detected in management frame capability fields. High throughput devices support legacy clients by transmitting additional management frames that can be decoded by the legacy clients. This support results in significantly reduced throughput for both HT and legacy station types. It is important to note that the legacy client does NOT need to be associated to the HD WLAN to cause a protection mode to be triggered. The mere presence of a legacy client will reduce throughput. It is very difficult to create an environment where no legacy devices are present.
N O T E
With under-floor mounting, it may be possible to reuse each 2.4-GHz channel one time in a very large auditorium over 10,000 ft2 (930 m2). If this is a requirement in your environment, see the section on picocells using under-floor mounting in Chapter 4, “RF Design for HD WLANs” on page 31.
High-Density Wireless Networks for Auditoriums VRD | Solution Guide Capacity Planning for HD-WLANs | 25
As part of the validation testing for this VRD, Aruba completed open air client scaling test runs for five different mixes of 802.11n and 802.11a clients:
100% HT20 clients
75% HT20 and 25% 802.11a clients
50% HT20 and 50% 802.11a clients
25% HT20 and 75% 802.11a clients
100% 802.11a clients
The testbed included a heterogeneous mix of 50 different laptops and netbooks with a wide variety of operating systems and wireless NICs, just as you would find in a real auditorium. Ixia Chariot was used as the traffic generator.
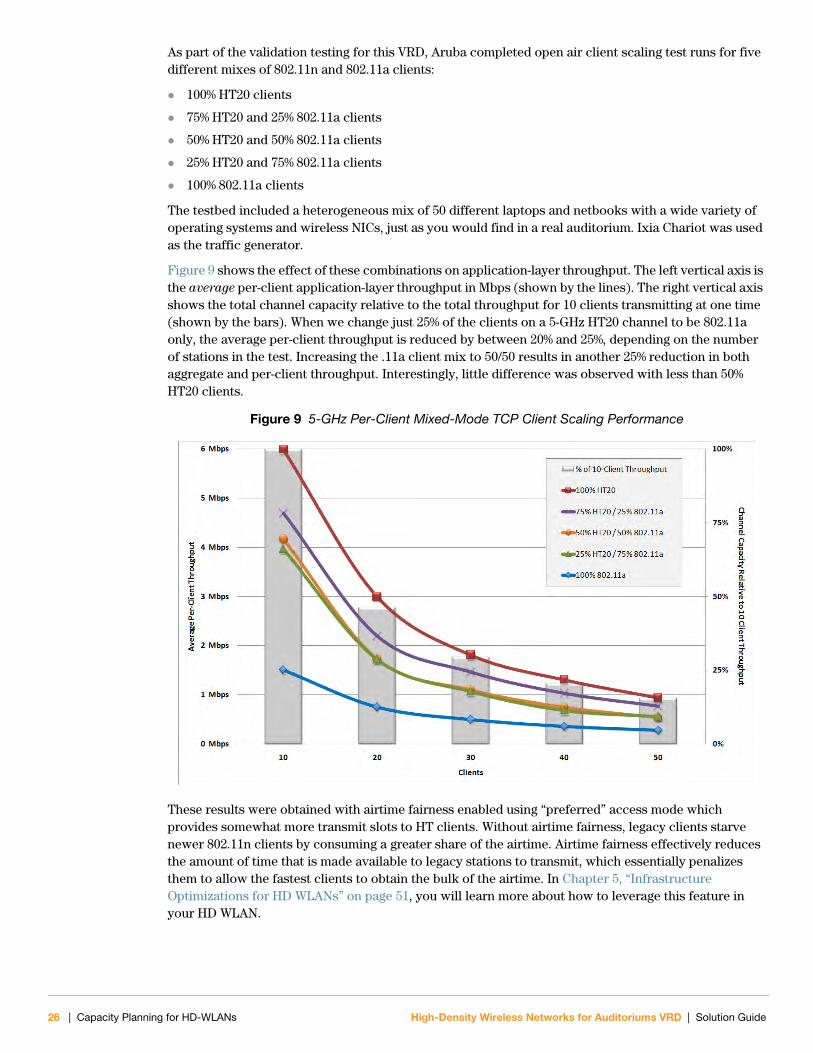
Figure 9 shows the effect of these combinations on application-layer throughput. The left vertical axis is the average per-client application-layer throughput in Mbps (shown by the lines). The right vertical axis shows the total channel capacity relative to the total throughput for 10 clients transmitting at one time (shown by the bars). When we change just 25% of the clients on a 5-GHz HT20 channel to be 802.11a only, the average per-client throughput is reduced by between 20% and 25%, depending on the number of stations in the test. Increasing the .11a client mix to 50/50 results in another 25% reduction in both aggregate and per-client throughput. Interestingly, little difference was observed with less than 50% HT20 clients.
Figure 9 5-GHz Per-Client Mixed-Mode TCP Client Scaling Performance
These results were obtained with airtime fairness enabled using “preferred” access mode which provides somewhat more transmit slots to HT clients. Without airtime fairness, legacy clients starve newer 802.11n clients by consuming a greater share of the airtime. Airtime fairness effectively reduces the amount of time that is made available to legacy stations to transmit, which essentially penalizes them to allow the fastest clients to obtain the bulk of the airtime. In Chapter 5, “Infrastructure Optimizations for HD WLANs” on page 51, you will learn more about how to leverage this feature in your HD WLAN.
26 | Capacity Planning for HD-WLANs High-Density Wireless Networks for Auditoriums VRD | Solution Guide
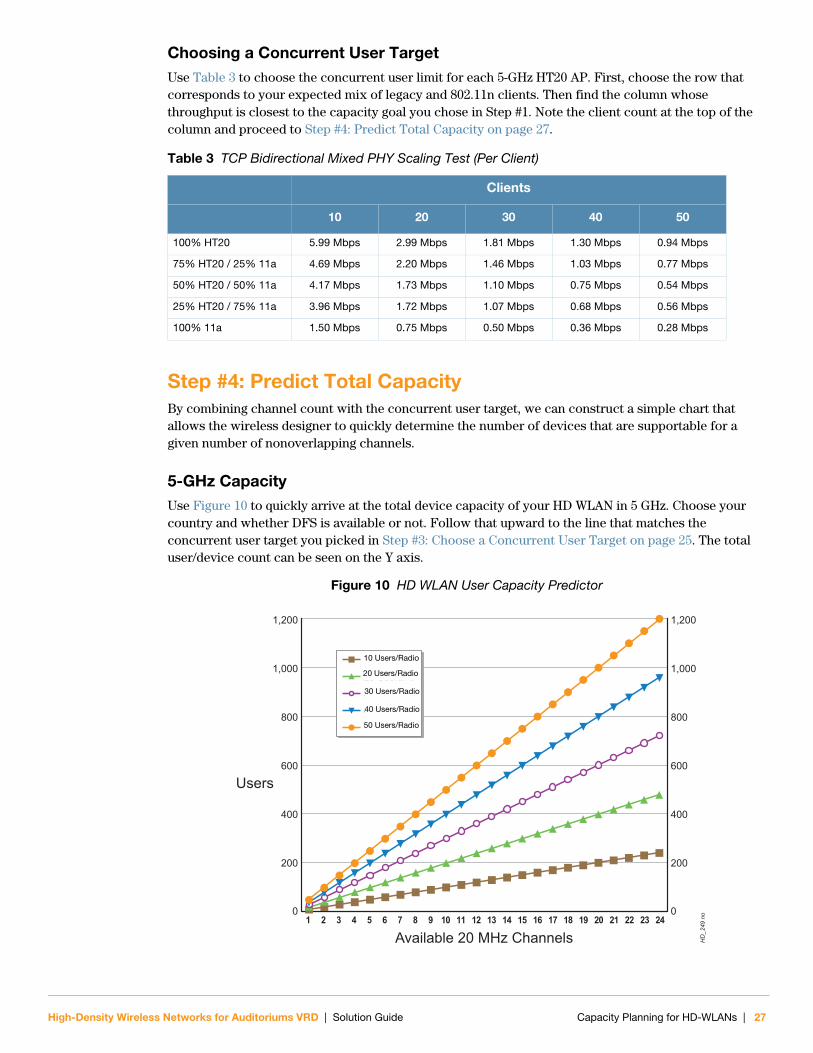
Choosing a Concurrent User TargetUse Table 3 to choose the concurrent user limit for each 5-GHz HT20 AP. First, choose the row that corresponds to your expected mix of legacy and 802.11n clients. Then find the column whose throughput is closest to the capacity goal you chose in Step #1. Note the client count at the top of the column and proceed to Step #4: Predict Total Capacity on page 27.
Step #4: Predict Total CapacityBy combining channel count with the concurrent user target, we can construct a simple chart that allows the wireless designer to quickly determine the number of devices that are supportable for a given number of nonoverlapping channels.
5-GHz CapacityUse Figure 10 to quickly arrive at the total device capacity of your HD WLAN in 5 GHz. Choose your country and whether DFS is available or not. Follow that upward to the line that matches the concurrent user target you picked in Step #3: Choose a Concurrent User Target on page 25. The total user/device count can be seen on the Y axis.
Figure 10 HD WLAN User Capacity Predictor
Table 3 TCP Bidirectional Mixed PHY Scaling Test (Per Client)
Clients
10 20 30 40 50
100% HT20 5.99 Mbps 2.99 Mbps 1.81 Mbps 1.30 Mbps 0.94 Mbps
75% HT20 / 25% 11a 4.69 Mbps 2.20 Mbps 1.46 Mbps 1.03 Mbps 0.77 Mbps
50% HT20 / 50% 11a 4.17 Mbps 1.73 Mbps 1.10 Mbps 0.75 Mbps 0.54 Mbps
25% HT20 / 75% 11a 3.96 Mbps 1.72 Mbps 1.07 Mbps 0.68 Mbps 0.56 Mbps
100% 11a 1.50 Mbps 0.75 Mbps 0.50 Mbps 0.36 Mbps 0.28 Mbps
HD
_249
no
1,200
200
400
600
Users
Available 20 MHz Channels
800
1,000
1,200
200
0 0
400
600
800
1,000
1 2 3 4 5 6 7 8 9 10 11 12 13 14 15 16 17 18 19 20 21 22 23 24
10 Users/AP
50 Users/AP
40 Users/AP
30 Users/AP
20 Users/AP
10 Users/Radio
20 Users/Radio
30 Users/Radio
40 Users/Radio
50 Users/Radio
High-Density Wireless Networks for Auditoriums VRD | Solution Guide Capacity Planning for HD-WLANs | 27

The chart allows a wireless designer to rapidly assess the capacity limit of a given auditorium. Table 4 provides the same information in tabular form.
Table 4 HD WLAN User Capacity Matrix - 5 GHz
Radios 10/radio 20/radio 30/radio 40/radio 50/radio
1 10 20 30 40 50
2 20 40 60 80 100
3 30 60 90 120 150
4 40 80 120 160 200
5 50 100 150 200 250
6 60 120 180 240 300
7 70 140 210 280 350
8 80 160 240 320 400
9 90 180 270 360 450
10 100 200 300 400 500
11 110 220 330 440 550
12 120 240 360 480 600
13 130 260 390 520 650
14 140 280 420 560 700
15 150 300 450 600 750
16 160 320 480 640 800
17 170 340 510 680 850
18 180 360 540 720 900
19 190 380 570 760 950
20 200 400 600 800 1,000
21 210 420 630 840 1,050
22 220 440 660 880 1,100
23 230 460 690 920 1,150
24 240 480 720 960 1,200
28 | Capacity Planning for HD-WLANs High-Density Wireless Networks for Auditoriums VRD | Solution Guide
2.4-GHz CapacityWe begin by determining how large the current population of 2.4-GHz-only devices is and what type of growth to expect on that band. The following approaches can be used to answer these questions:
Simply assume that each user has one 5-GHz and one 2.4-GHz client (such as a laptop and a smartphone). This is the worst case.
If dual-band coverage exists elsewhere in the facility, use historical WLAN client association data from a network monitoring system, such as the AirWave Wireless Management Suite, to obtain a ratio of 2.4-GHz to 5-GHz users as well as per-station bandwidth consumption.
In the second case, you would then multiply the base occupancy of the auditorium by the ratio of users to get the 2.4-GHz population. To be conservative, increase the ratio by 5-10% to provide a safety margin for near-term growth in the 2.4-GHz band.
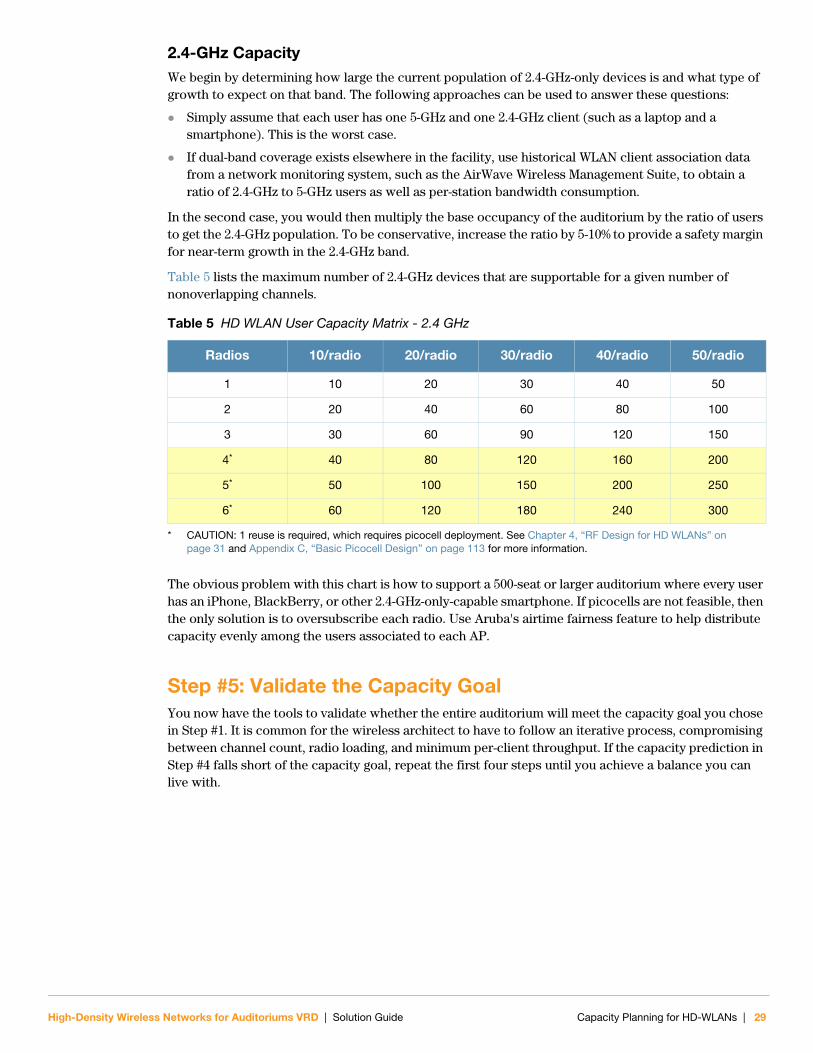
Table 5 lists the maximum number of 2.4-GHz devices that are supportable for a given number of nonoverlapping channels.
The obvious problem with this chart is how to support a 500-seat or larger auditorium where every user has an iPhone, BlackBerry, or other 2.4-GHz-only-capable smartphone. If picocells are not feasible, then the only solution is to oversubscribe each radio. Use Aruba's airtime fairness feature to help distribute capacity evenly among the users associated to each AP.
Step #5: Validate the Capacity GoalYou now have the tools to validate whether the entire auditorium will meet the capacity goal you chose in Step #1. It is common for the wireless architect to have to follow an iterative process, compromising between channel count, radio loading, and minimum per-client throughput. If the capacity prediction in Step #4 falls short of the capacity goal, repeat the first four steps until you achieve a balance you can live with.
Table 5 HD WLAN User Capacity Matrix - 2.4 GHz
Radios 10/radio 20/radio 30/radio 40/radio 50/radio
1 10 20 30 40 50
2 20 40 60 80 100
3 30 60 90 120 150
4*
* CAUTION: 1 reuse is required, which requires picocell deployment. See Chapter 4, “RF Design for HD WLANs” on page 31 and Appendix C, “Basic Picocell Design” on page 113 for more information.
40 80 120 160 200
5* 50 100 150 200 250
6* 60 120 180 240 300
High-Density Wireless Networks for Auditoriums VRD | Solution Guide Capacity Planning for HD-WLANs | 29

30 | Capacity Planning for HD-WLANs High-Density Wireless Networks for Auditoriums VRD | Solution Guide
High-Density Wireless Networks for Auditoriums VRD | Solution Guide
Chapter 4RF Design for HD WLANs
Coverage in HD WLANs is achieved by carefully combining the number of APs as determined in the previous chapter with the physical space for which the designer is providing wireless services.
Placing many APs in close proximity to one another and enabling them to operate with minimal interference requires the use of a several specific wireless design principles. These principles must be balanced against building limitations like mounting restrictions, cabling requirements, room shape, and room size. This chapter will teach you how to achieve this balance successfully.
Coverage Strategies for AuditoriumsA coverage strategy is a specific method or approach for locating APs inside a wireless service area. Generally, any given coverage strategy will also call for a specific antenna pattern providing required directionality (even if it is just using integrated antennas in the AP).
Three basic coverage strategies for auditoriums are available to the wireless architect. Each strategy has advantages and disadvantages that we will explore in this chapter. These methods should never be combined to ensure that signal levels are as consistent as possible throughout the coverage area.
Overhead Coverage: This refers to placing APs on the ceiling above the seats in the auditorium, usually with a special low-gain antenna with a radiation pattern directing the signal at the floor.
Side Coverage: The AP is mounted to walls and/or pillars that exist in the auditorium, generally no more than 12 ft (4 m) above the floor. Either directional or omnidirectional antennas can be used, with the direction of maximum gain aimed sideways across the seats.
Floor Coverage: This design creates picocells using APs mounted in, under, or just above the floor of the auditorium, with a low-gain downtilt antenna reversed to face straight up at the ceiling. This strategy is the only one that can allow for multiple channel reuse inside a room of 10,000 ft2 (930 m2) or less.
Within each of these approaches, a number of choices must be made, such as whether to use integrated or external antennas, mounting method, minimum AP spacing, how APs will connect to the LAN, and so forth.
RF Design for HD WLANs | 31
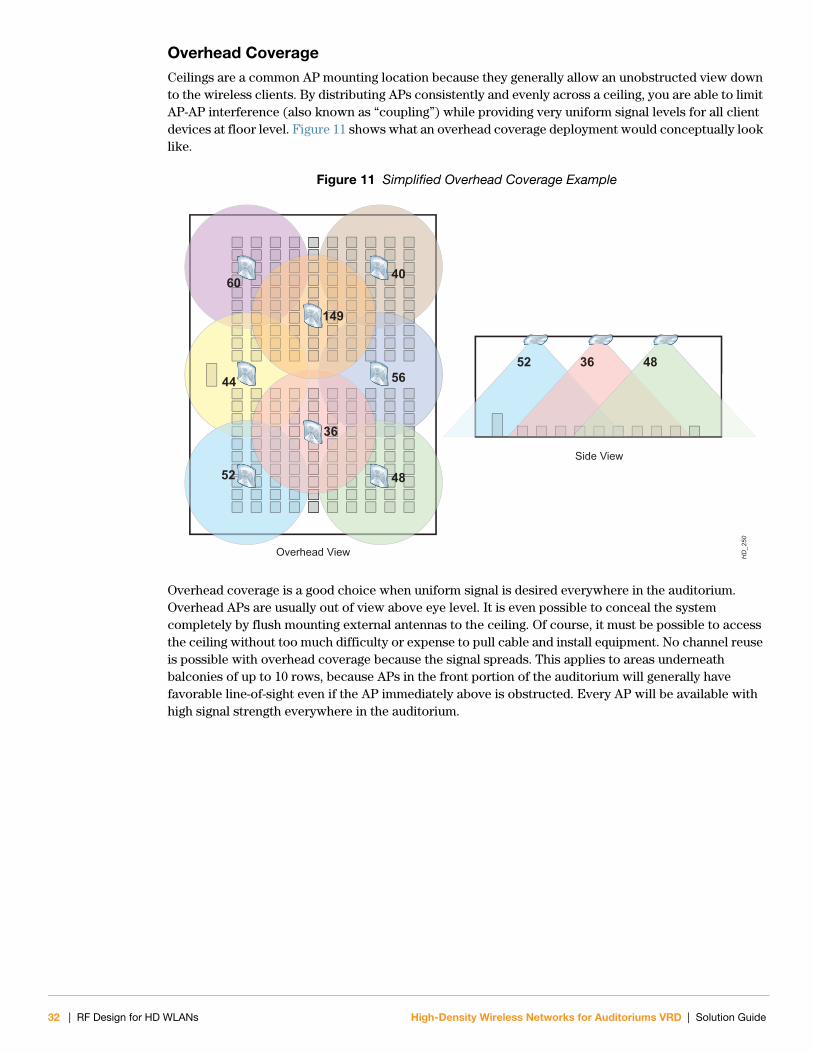
Overhead CoverageCeilings are a common AP mounting location because they generally allow an unobstructed view down to the wireless clients. By distributing APs consistently and evenly across a ceiling, you are able to limit AP-AP interference (also known as “coupling”) while providing very uniform signal levels for all client devices at floor level. Figure 11 shows what an overhead coverage deployment would conceptually look like.
Figure 11 Simplified Overhead Coverage Example
Overhead coverage is a good choice when uniform signal is desired everywhere in the auditorium. Overhead APs are usually out of view above eye level. It is even possible to conceal the system completely by flush mounting external antennas to the ceiling. Of course, it must be possible to access the ceiling without too much difficulty or expense to pull cable and install equipment. No channel reuse is possible with overhead coverage because the signal spreads. This applies to areas underneath balconies of up to 10 rows, because APs in the front portion of the auditorium will generally have favorable line-of-sight even if the AP immediately above is obstructed. Every AP will be available with high signal strength everywhere in the auditorium.
HD
_250
60
149
36
44
52
52
48
56
Overhead View
Side View
40
36 48
32 | RF Design for HD WLANs High-Density Wireless Networks for Auditoriums VRD | Solution Guide
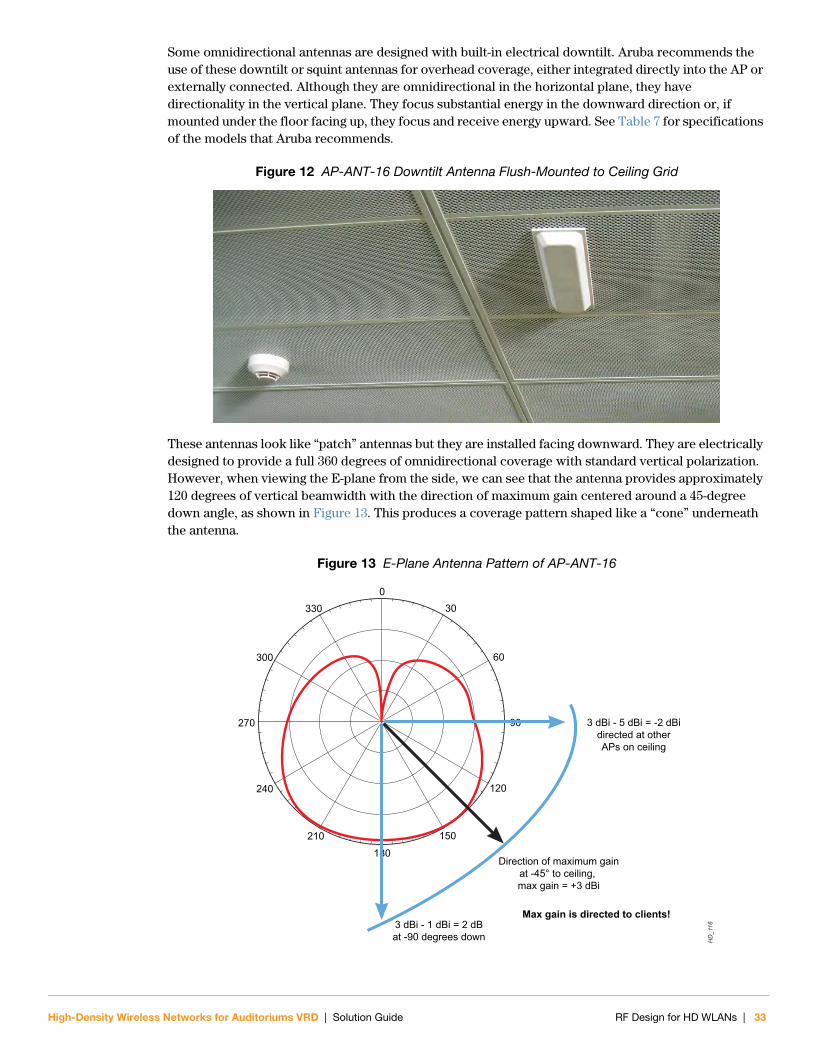
Some omnidirectional antennas are designed with built-in electrical downtilt. Aruba recommends the use of these downtilt or squint antennas for overhead coverage, either integrated directly into the AP or externally connected. Although they are omnidirectional in the horizontal plane, they have directionality in the vertical plane. They focus substantial energy in the downward direction or, if mounted under the floor facing up, they focus and receive energy upward. See Table 7 for specifications of the models that Aruba recommends.
Figure 12 AP-ANT-16 Downtilt Antenna Flush-Mounted to Ceiling Grid
These antennas look like “patch” antennas but they are installed facing downward. They are electrically designed to provide a full 360 degrees of omnidirectional coverage with standard vertical polarization. However, when viewing the E-plane from the side, we can see that the antenna provides approximately 120 degrees of vertical beamwidth with the direction of maximum gain centered around a 45-degree down angle, as shown in Figure 13. This produces a coverage pattern shaped like a “cone” underneath the antenna.
Figure 13 E-Plane Antenna Pattern of AP-ANT-16
HD
_116
0330 30
60
90
120
150
180
210
240
270
300
3 dBi - 5 dBi = -2 dBidirected at otherAPs on ceiling
3 dBi - 1 dBi = 2 dBat -90 degrees down
Max gain is directed to clients!
Direction of maximum gainat -45° to ceiling, max gain = +3 dBi
High-Density Wireless Networks for Auditoriums VRD | Solution Guide RF Design for HD WLANs | 33
These are commonly referred to as “downtilt” or “squint” antennas. From the plot, it is clear that the antenna pattern helps with interference rejection in two important ways:
External room interference: Because the direction of maximum gain is straight down, 802.11 signals outside the room on the same floor will not be aligned within the 3-dB beamwidth of the antenna. In the case of two auditoriums on top of one another, the back lobe is up to 12 dB down from the main lobe.
Reduced AP-AP interference at ceiling level: In the plane of the ceiling, the pattern of a downtilt antenna is about 8 dB down from the main lobe, which allows APs to be spaced somewhat more closely for a given EIRP.
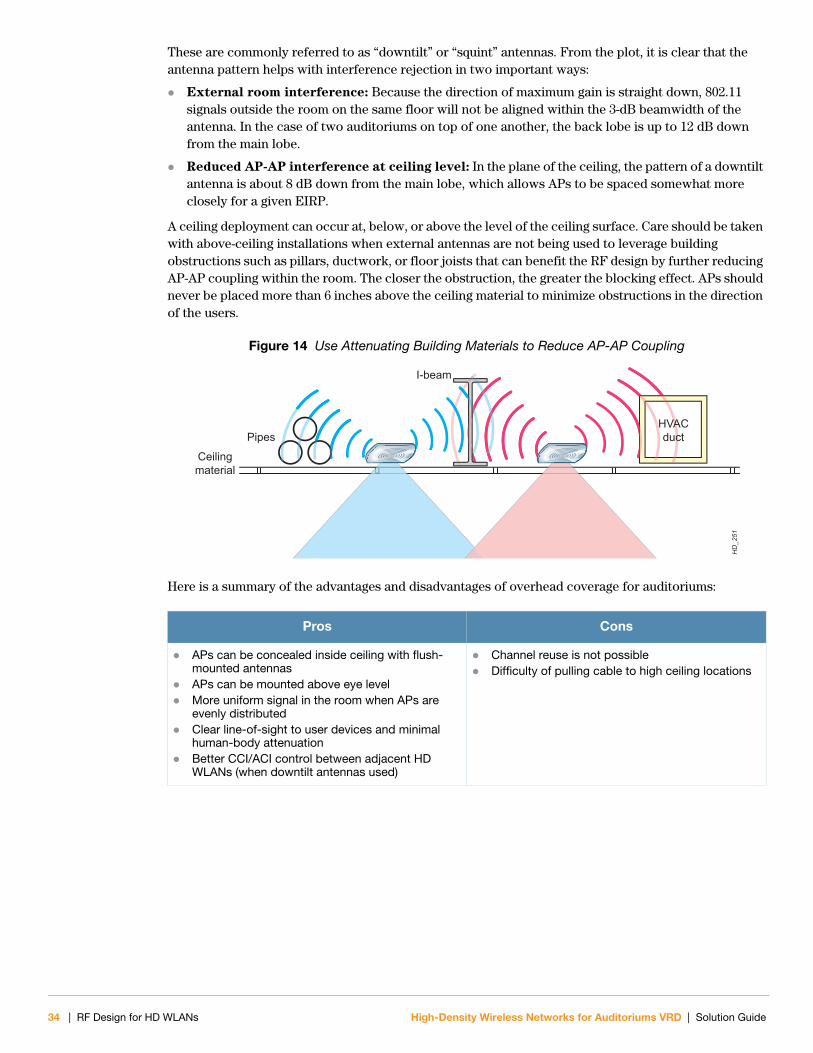
A ceiling deployment can occur at, below, or above the level of the ceiling surface. Care should be taken with above-ceiling installations when external antennas are not being used to leverage building obstructions such as pillars, ductwork, or floor joists that can benefit the RF design by further reducing AP-AP coupling within the room. The closer the obstruction, the greater the blocking effect. APs should never be placed more than 6 inches above the ceiling material to minimize obstructions in the direction of the users.
Figure 14 Use Attenuating Building Materials to Reduce AP-AP Coupling
Here is a summary of the advantages and disadvantages of overhead coverage for auditoriums:
Pros Cons
APs can be concealed inside ceiling with flush-mounted antennas
APs can be mounted above eye level More uniform signal in the room when APs are
evenly distributed Clear line-of-sight to user devices and minimal
human-body attenuation Better CCI/ACI control between adjacent HD
WLANs (when downtilt antennas used)
Channel reuse is not possible Difficulty of pulling cable to high ceiling locations
HD
_251
Ceilingmaterial
g gto reduce AP-AP coupling
HVACductPipes
I-beam
34 | RF Design for HD WLANs High-Density Wireless Networks for Auditoriums VRD | Solution Guide
Side Coverage (Walls or Pillars)Wall installations are most often seen where ceiling or under-floor access is not possible or too expensive. Wall installations come in every variety you can think of, because no two auditoriums are the same. Common examples include:
Co-located APs in an A/V area in the back of an auditorium with directional antennas facing forwards.
Hotel ballrooms where APs with integrated antennas can only be placed along the sides of the room, mounted to speaker stands or simply placed on tables.
Where pillars or columns exist in very large auditoriums, it is often practical to mount on them 3-6 ft (1-2 m) above the users.
Structures with no overhead or under-floor access, which could include temporary structures like tents or open air fairs.
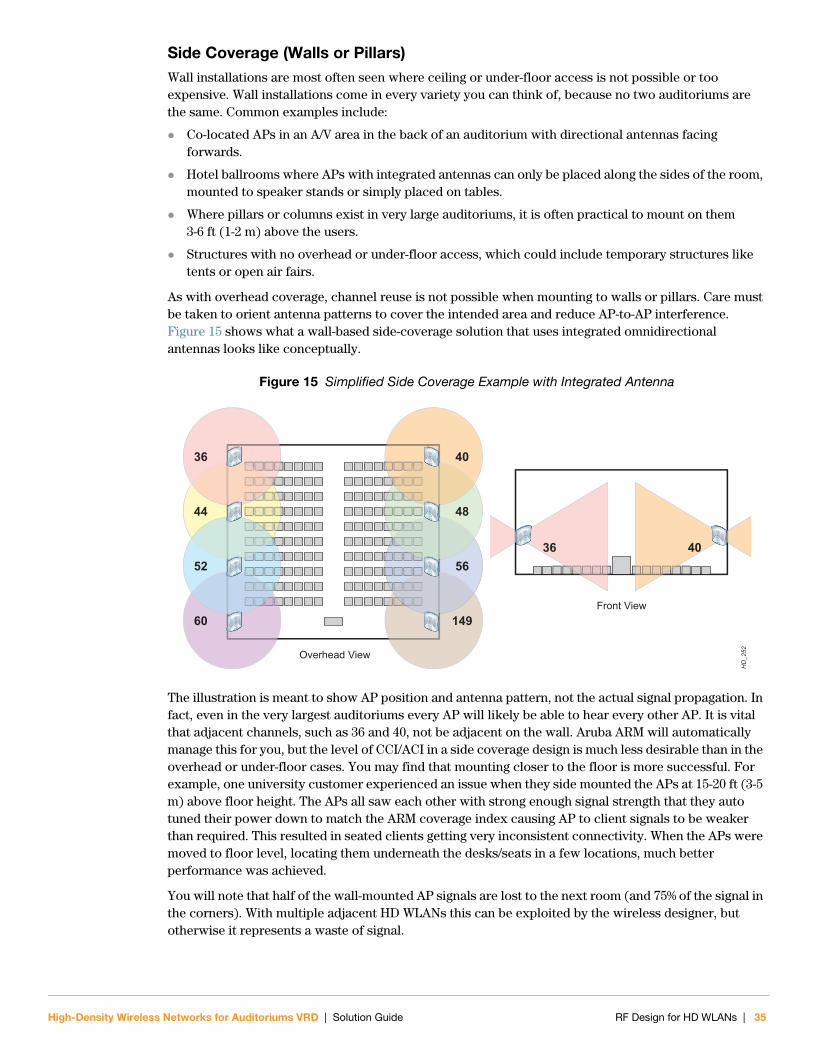
As with overhead coverage, channel reuse is not possible when mounting to walls or pillars. Care must be taken to orient antenna patterns to cover the intended area and reduce AP-to-AP interference. Figure 15 shows what a wall-based side-coverage solution that uses integrated omnidirectional antennas looks like conceptually.
Figure 15 Simplified Side Coverage Example with Integrated Antenna
The illustration is meant to show AP position and antenna pattern, not the actual signal propagation. In fact, even in the very largest auditoriums every AP will likely be able to hear every other AP. It is vital that adjacent channels, such as 36 and 40, not be adjacent on the wall. Aruba ARM will automatically manage this for you, but the level of CCI/ACI in a side coverage design is much less desirable than in the overhead or under-floor cases. You may find that mounting closer to the floor is more successful. For example, one university customer experienced an issue when they side mounted the APs at 15-20 ft (3-5 m) above floor height. The APs all saw each other with strong enough signal strength that they auto tuned their power down to match the ARM coverage index causing AP to client signals to be weaker than required. This resulted in seated clients getting very inconsistent connectivity. When the APs were moved to floor level, locating them underneath the desks/seats in a few locations, much better performance was achieved.
You will note that half of the wall-mounted AP signals are lost to the next room (and 75% of the signal in the corners). With multiple adjacent HD WLANs this can be exploited by the wireless designer, but otherwise it represents a waste of signal.
HD
_252
60
4036
44
52
48
56
Overhead View
Front View149
4036
High-Density Wireless Networks for Auditoriums VRD | Solution Guide RF Design for HD WLANs | 35
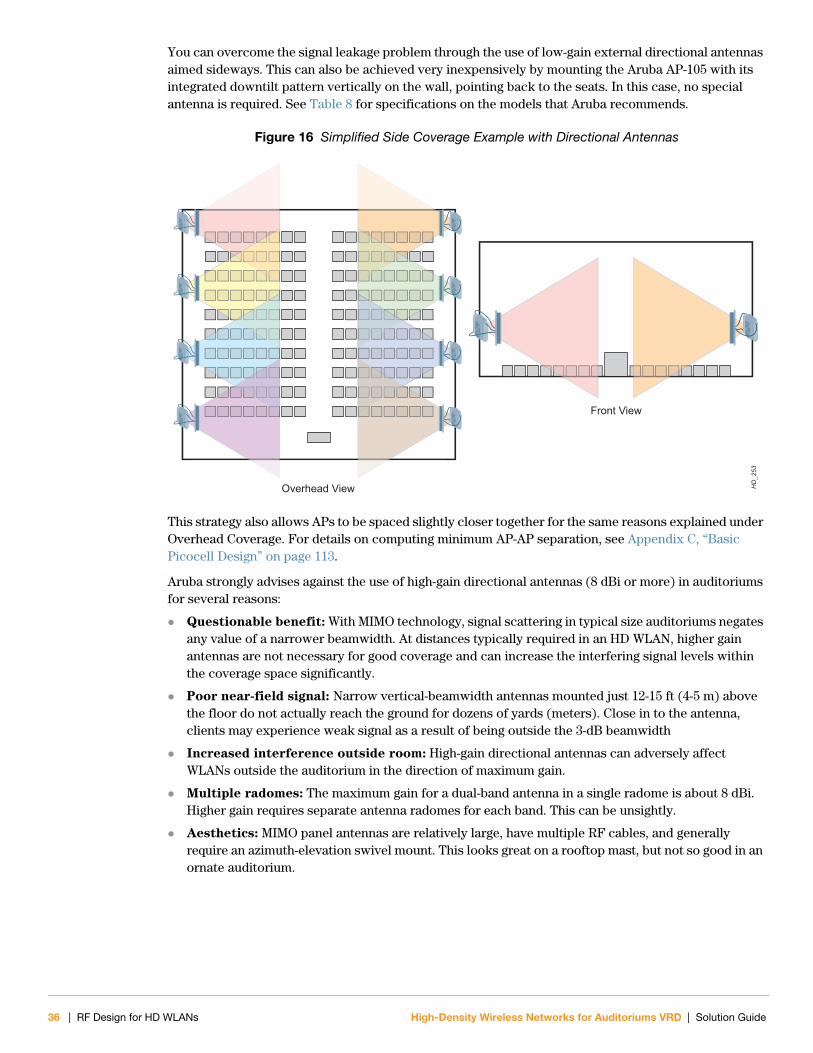
You can overcome the signal leakage problem through the use of low-gain external directional antennas aimed sideways. This can also be achieved very inexpensively by mounting the Aruba AP-105 with its integrated downtilt pattern vertically on the wall, pointing back to the seats. In this case, no special antenna is required. See Table 8 for specifications on the models that Aruba recommends.
Figure 16 Simplified Side Coverage Example with Directional Antennas
This strategy also allows APs to be spaced slightly closer together for the same reasons explained under Overhead Coverage. For details on computing minimum AP-AP separation, see Appendix C, “Basic Picocell Design” on page 113.
Aruba strongly advises against the use of high-gain directional antennas (8 dBi or more) in auditoriums for several reasons:
Questionable benefit: With MIMO technology, signal scattering in typical size auditoriums negates any value of a narrower beamwidth. At distances typically required in an HD WLAN, higher gain antennas are not necessary for good coverage and can increase the interfering signal levels within the coverage space significantly.
Poor near-field signal: Narrow vertical-beamwidth antennas mounted just 12-15 ft (4-5 m) above the floor do not actually reach the ground for dozens of yards (meters). Close in to the antenna, clients may experience weak signal as a result of being outside the 3-dB beamwidth
Increased interference outside room: High-gain directional antennas can adversely affect WLANs outside the auditorium in the direction of maximum gain.
Multiple radomes: The maximum gain for a dual-band antenna in a single radome is about 8 dBi. Higher gain requires separate antenna radomes for each band. This can be unsightly.
Aesthetics: MIMO panel antennas are relatively large, have multiple RF cables, and generally require an azimuth-elevation swivel mount. This looks great on a rooftop mast, but not so good in an ornate auditorium.
HD
_253
Front View
Overhead View
36 | RF Design for HD WLANs High-Density Wireless Networks for Auditoriums VRD | Solution Guide
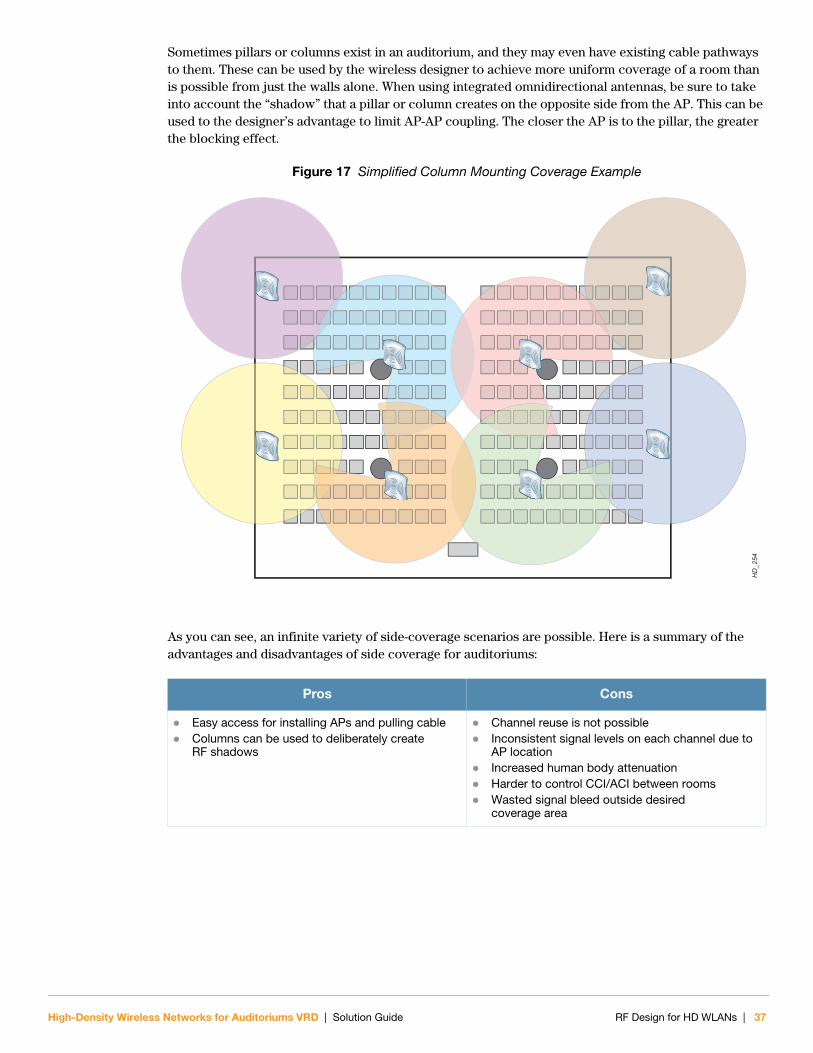
Sometimes pillars or columns exist in an auditorium, and they may even have existing cable pathways to them. These can be used by the wireless designer to achieve more uniform coverage of a room than is possible from just the walls alone. When using integrated omnidirectional antennas, be sure to take into account the “shadow” that a pillar or column creates on the opposite side from the AP. This can be used to the designer’s advantage to limit AP-AP coupling. The closer the AP is to the pillar, the greater the blocking effect.
Figure 17 Simplified Column Mounting Coverage Example
As you can see, an infinite variety of side-coverage scenarios are possible. Here is a summary of the advantages and disadvantages of side coverage for auditoriums:
Pros Cons
Easy access for installing APs and pulling cable Columns can be used to deliberately create
RF shadows
Channel reuse is not possible Inconsistent signal levels on each channel due to
AP location Increased human body attenuation Harder to control CCI/ACI between rooms Wasted signal bleed outside desired
coverage area
HD
_254
High-Density Wireless Networks for Auditoriums VRD | Solution Guide RF Design for HD WLANs | 37
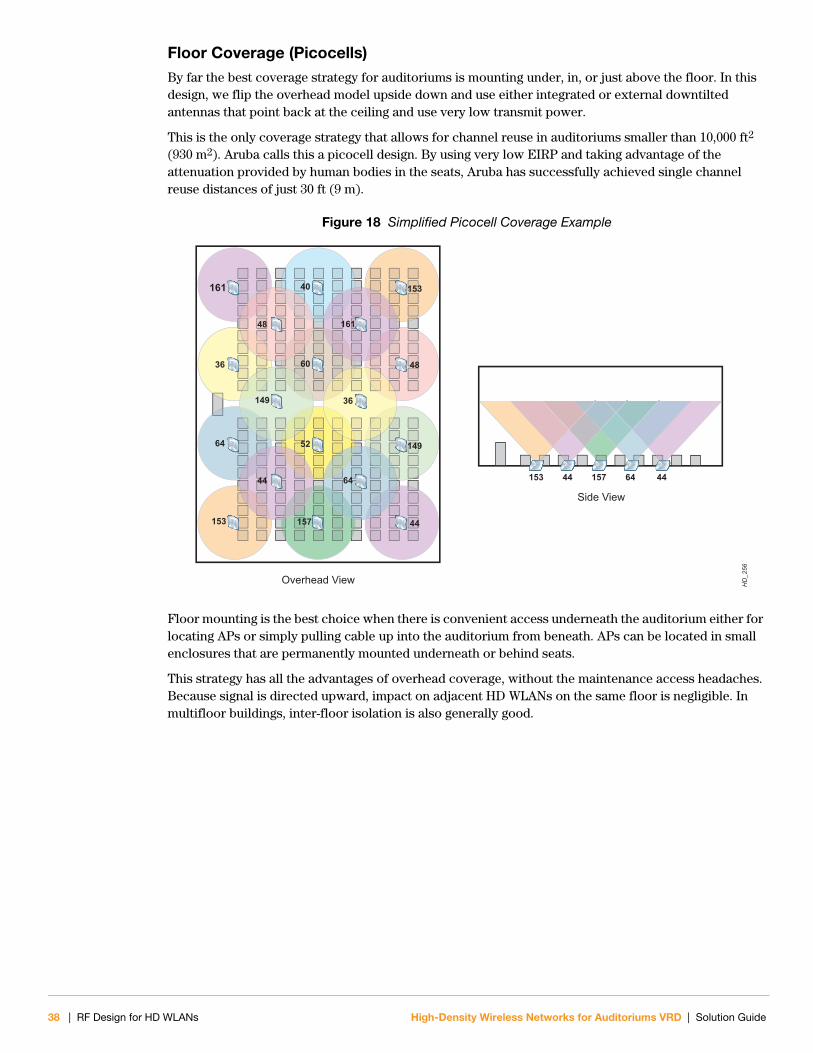
Floor Coverage (Picocells)By far the best coverage strategy for auditoriums is mounting under, in, or just above the floor. In this design, we flip the overhead model upside down and use either integrated or external downtilted antennas that point back at the ceiling and use very low transmit power.
This is the only coverage strategy that allows for channel reuse in auditoriums smaller than 10,000 ft2 (930 m2). Aruba calls this a picocell design. By using very low EIRP and taking advantage of the attenuation provided by human bodies in the seats, Aruba has successfully achieved single channel reuse distances of just 30 ft (9 m).
Figure 18 Simplified Picocell Coverage Example
Floor mounting is the best choice when there is convenient access underneath the auditorium either for locating APs or simply pulling cable up into the auditorium from beneath. APs can be located in small enclosures that are permanently mounted underneath or behind seats.
This strategy has all the advantages of overhead coverage, without the maintenance access headaches. Because signal is directed upward, impact on adjacent HD WLANs on the same floor is negligible. In multifloor buildings, inter-floor isolation is also generally good.
HD
_256
Overhead View
Side View
161
36
149
48
44
40
60
52
157153
153
64
161
36
149
48
44
64 44 157153 4464
38 | RF Design for HD WLANs High-Density Wireless Networks for Auditoriums VRD | Solution Guide
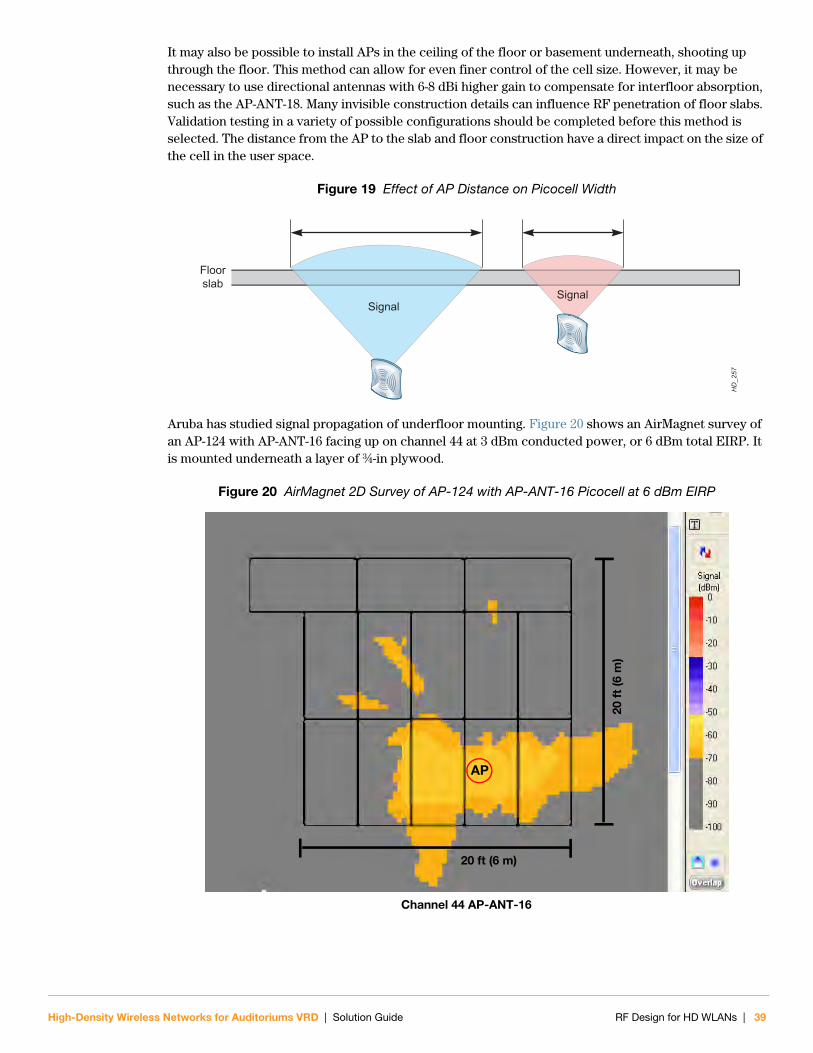
It may also be possible to install APs in the ceiling of the floor or basement underneath, shooting up through the floor. This method can allow for even finer control of the cell size. However, it may be necessary to use directional antennas with 6-8 dBi higher gain to compensate for interfloor absorption, such as the AP-ANT-18. Many invisible construction details can influence RF penetration of floor slabs. Validation testing in a variety of possible configurations should be completed before this method is selected. The distance from the AP to the slab and floor construction have a direct impact on the size of the cell in the user space.
Figure 19 Effect of AP Distance on Picocell Width
Aruba has studied signal propagation of underfloor mounting. Figure 20 shows an AirMagnet survey of an AP-124 with AP-ANT-16 facing up on channel 44 at 3 dBm conducted power, or 6 dBm total EIRP. It is mounted underneath a layer of ¾-in plywood.
Figure 20 AirMagnet 2D Survey of AP-124 with AP-ANT-16 Picocell at 6 dBm EIRP
HD
_257
Floorslab
SignalSignal
Channel 44 AP-ANT-16
20 ft (6 m)
20 f
t (6
m)
AP
High-Density Wireless Networks for Auditoriums VRD | Solution Guide RF Design for HD WLANs | 39
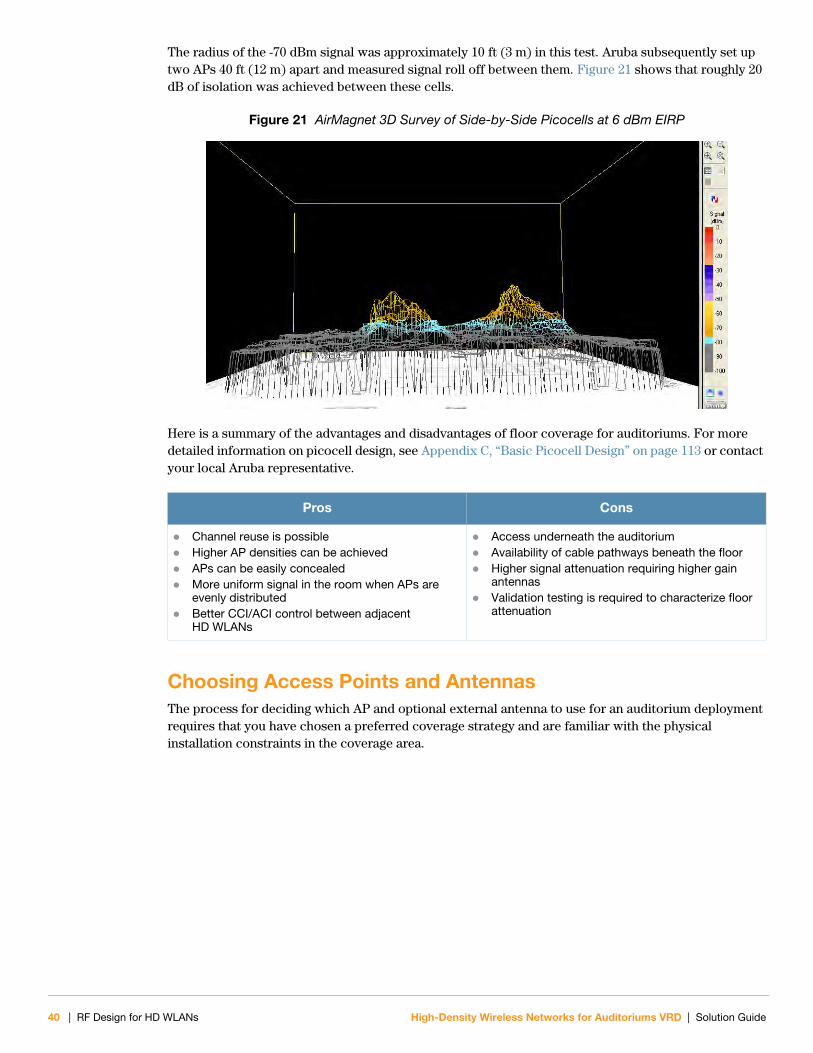
The radius of the -70 dBm signal was approximately 10 ft (3 m) in this test. Aruba subsequently set up two APs 40 ft (12 m) apart and measured signal roll off between them. Figure 21 shows that roughly 20 dB of isolation was achieved between these cells.
Figure 21 AirMagnet 3D Survey of Side-by-Side Picocells at 6 dBm EIRP
Here is a summary of the advantages and disadvantages of floor coverage for auditoriums. For more detailed information on picocell design, see Appendix C, “Basic Picocell Design” on page 113 or contact your local Aruba representative.
Choosing Access Points and AntennasThe process for deciding which AP and optional external antenna to use for an auditorium deployment requires that you have chosen a preferred coverage strategy and are familiar with the physical installation constraints in the coverage area.
Pros Cons
Channel reuse is possible Higher AP densities can be achieved APs can be easily concealed More uniform signal in the room when APs are
evenly distributed Better CCI/ACI control between adjacent
HD WLANs
Access underneath the auditorium Availability of cable pathways beneath the floor Higher signal attenuation requiring higher gain
antennas Validation testing is required to characterize floor
attenuation
40 | RF Design for HD WLANs High-Density Wireless Networks for Auditoriums VRD | Solution Guide
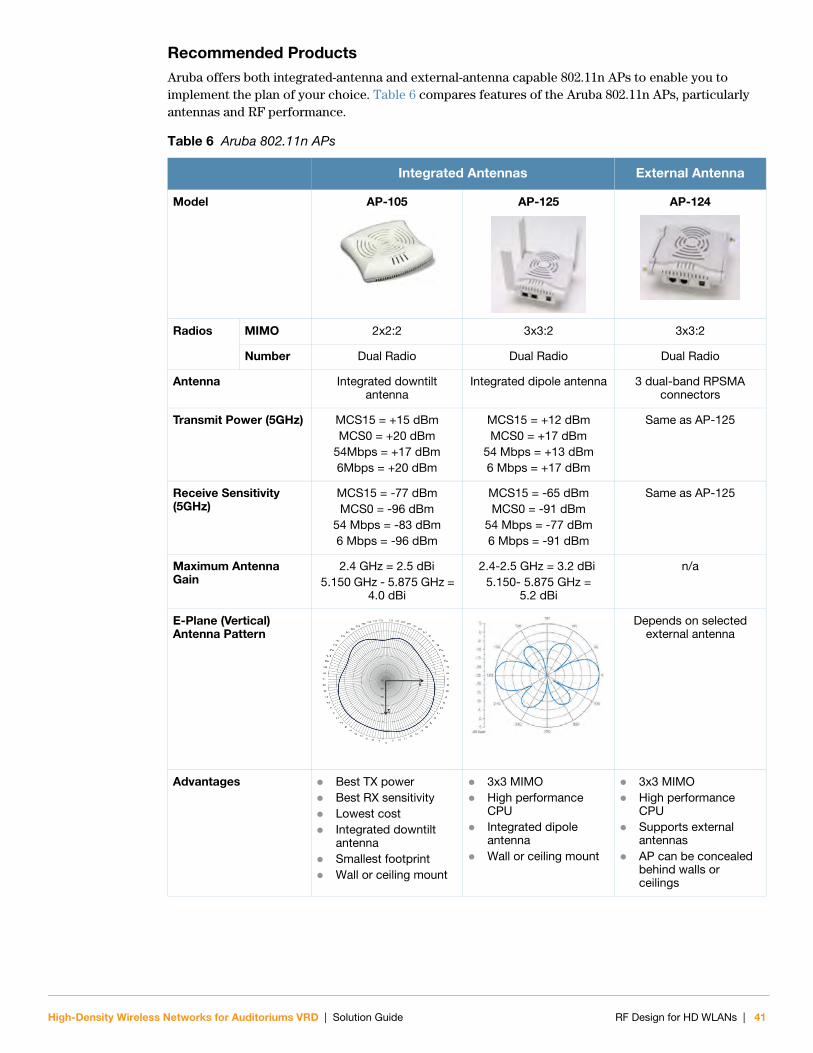
Recommended ProductsAruba offers both integrated-antenna and external-antenna capable 802.11n APs to enable you to implement the plan of your choice. Table 6 compares features of the Aruba 802.11n APs, particularly antennas and RF performance.
Table 6 Aruba 802.11n APs
Integrated Antennas External Antenna
Model AP-105 AP-125 AP-124
Radios MIMO 2x2:2 3x3:2 3x3:2
Number Dual Radio Dual Radio Dual Radio
Antenna Integrated downtilt antenna
Integrated dipole antenna 3 dual-band RPSMA connectors
Transmit Power (5GHz) MCS15 = +15 dBmMCS0 = +20 dBm
54Mbps = +17 dBm6Mbps = +20 dBm
MCS15 = +12 dBmMCS0 = +17 dBm
54 Mbps = +13 dBm6 Mbps = +17 dBm
Same as AP-125
Receive Sensitivity (5GHz)
MCS15 = -77 dBmMCS0 = -96 dBm
54 Mbps = -83 dBm6 Mbps = -96 dBm
MCS15 = -65 dBmMCS0 = -91 dBm
54 Mbps = -77 dBm6 Mbps = -91 dBm
Same as AP-125
Maximum Antenna Gain
2.4 GHz = 2.5 dBi 5.150 GHz - 5.875 GHz =
4.0 dBi
2.4-2.5 GHz = 3.2 dBi 5.150- 5.875 GHz =
5.2 dBi
n/a
E-Plane (Vertical) Antenna Pattern
Depends on selected external antenna
Advantages Best TX power Best RX sensitivity Lowest cost Integrated downtilt
antenna Smallest footprint Wall or ceiling mount
3x3 MIMO High performance
CPU Integrated dipole
antenna Wall or ceiling mount
3x3 MIMO High performance
CPU Supports external
antennas AP can be concealed
behind walls or ceilings
High-Density Wireless Networks for Auditoriums VRD | Solution Guide RF Design for HD WLANs | 41
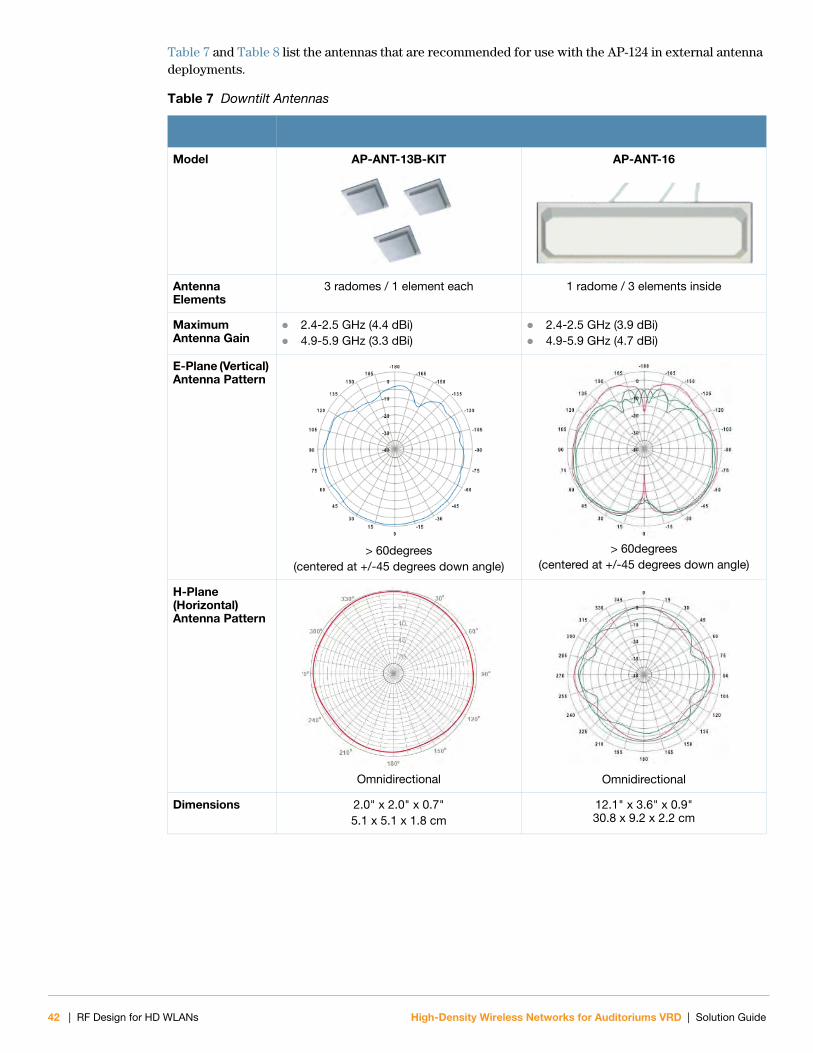
Table 7 and Table 8 list the antennas that are recommended for use with the AP-124 in external antenna deployments.
Table 7 Downtilt Antennas
Model AP-ANT-13B-KIT AP-ANT-16
Antenna Elements
3 radomes / 1 element each 1 radome / 3 elements inside
Maximum Antenna Gain
2.4-2.5 GHz (4.4 dBi) 4.9-5.9 GHz (3.3 dBi)
2.4-2.5 GHz (3.9 dBi) 4.9-5.9 GHz (4.7 dBi)
E-Plane (Vertical) Antenna Pattern
> 60degrees(centered at +/-45 degrees down angle)
> 60degrees(centered at +/-45 degrees down angle)
H-Plane (Horizontal) Antenna Pattern
Omnidirectional Omnidirectional
Dimensions 2.0" x 2.0" x 0.7"5.1 x 5.1 x 1.8 cm
12.1" x 3.6" x 0.9"30.8 x 9.2 x 2.2 cm
42 | RF Design for HD WLANs High-Density Wireless Networks for Auditoriums VRD | Solution Guide
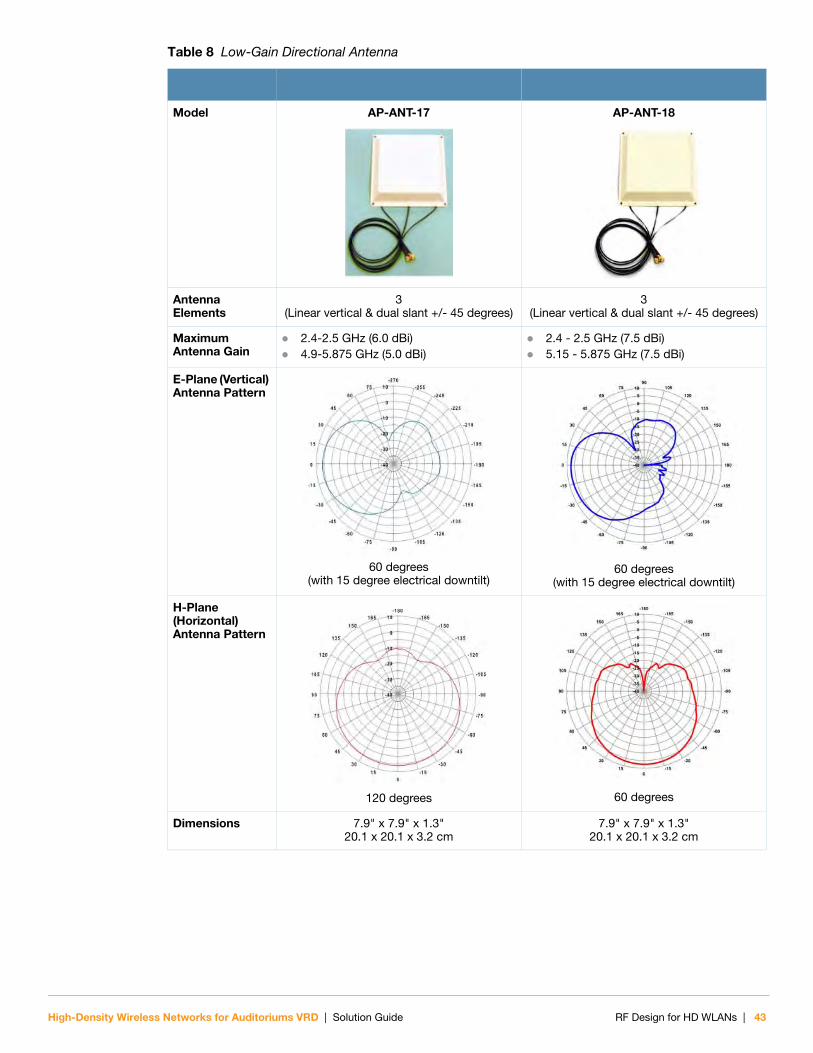
Table 8 Low-Gain Directional Antenna
Model AP-ANT-17 AP-ANT-18
Antenna Elements
3(Linear vertical & dual slant +/- 45 degrees)
3(Linear vertical & dual slant +/- 45 degrees)
Maximum Antenna Gain
2.4-2.5 GHz (6.0 dBi) 4.9-5.875 GHz (5.0 dBi)
2.4 - 2.5 GHz (7.5 dBi) 5.15 - 5.875 GHz (7.5 dBi)
E-Plane (Vertical) Antenna Pattern
60 degrees(with 15 degree electrical downtilt)
60 degrees(with 15 degree electrical downtilt)
H-Plane (Horizontal) Antenna Pattern
120 degrees 60 degrees
Dimensions 7.9" x 7.9" x 1.3"20.1 x 20.1 x 3.2 cm
7.9" x 7.9" x 1.3"20.1 x 20.1 x 3.2 cm
High-Density Wireless Networks for Auditoriums VRD | Solution Guide RF Design for HD WLANs | 43
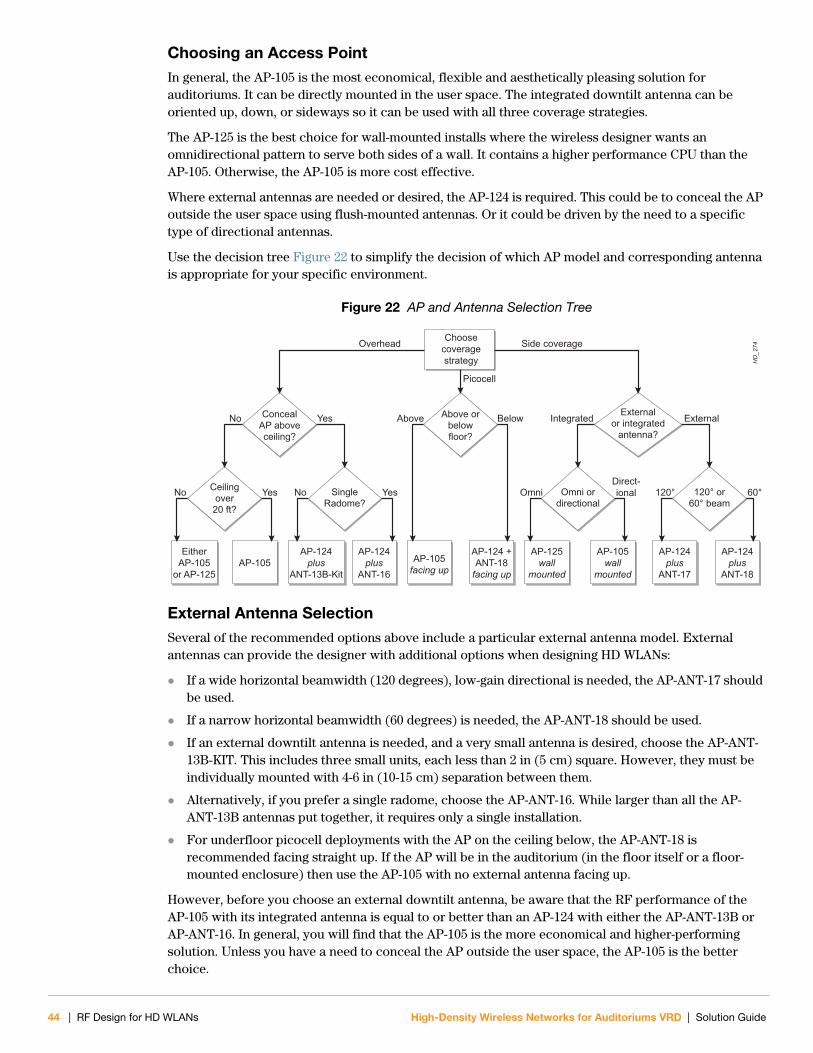
Choosing an Access PointIn general, the AP-105 is the most economical, flexible and aesthetically pleasing solution for auditoriums. It can be directly mounted in the user space. The integrated downtilt antenna can be oriented up, down, or sideways so it can be used with all three coverage strategies.
The AP-125 is the best choice for wall-mounted installs where the wireless designer wants an omnidirectional pattern to serve both sides of a wall. It contains a higher performance CPU than the AP-105. Otherwise, the AP-105 is more cost effective.
Where external antennas are needed or desired, the AP-124 is required. This could be to conceal the AP outside the user space using flush-mounted antennas. Or it could be driven by the need to a specific type of directional antennas.
Use the decision tree Figure 22 to simplify the decision of which AP model and corresponding antenna is appropriate for your specific environment.
Figure 22 AP and Antenna Selection Tree
External Antenna SelectionSeveral of the recommended options above include a particular external antenna model. External antennas can provide the designer with additional options when designing HD WLANs:
If a wide horizontal beamwidth (120 degrees), low-gain directional is needed, the AP-ANT-17 should be used.
If a narrow horizontal beamwidth (60 degrees) is needed, the AP-ANT-18 should be used.
If an external downtilt antenna is needed, and a very small antenna is desired, choose the AP-ANT-13B-KIT. This includes three small units, each less than 2 in (5 cm) square. However, they must be individually mounted with 4-6 in (10-15 cm) separation between them.
Alternatively, if you prefer a single radome, choose the AP-ANT-16. While larger than all the AP-ANT-13B antennas put together, it requires only a single installation.
For underfloor picocell deployments with the AP on the ceiling below, the AP-ANT-18 is recommended facing straight up. If the AP will be in the auditorium (in the floor itself or a floor-mounted enclosure) then use the AP-105 with no external antenna facing up.
However, before you choose an external downtilt antenna, be aware that the RF performance of the AP-105 with its integrated antenna is equal to or better than an AP-124 with either the AP-ANT-13B or AP-ANT-16. In general, you will find that the AP-105 is the more economical and higher-performing solution. Unless you have a need to conceal the AP outside the user space, the AP-105 is the better choice.
HD
_274
Choosecoveragestrategy
ConcealAP aboveceiling?
Overhead Side coverage
Picocell
Above orbelowfloor?
Externalor integrated
antenna?
No Yes
Ceilingover20 ft?
No Yes
EitherAP-105
or AP-125AP-105
Above Below
AP-105facing up
AP-124 +ANT-18
facing up
SingleRadome?
No Yes
AP-124plus
ANT-13B-Kit
AP-124plus
ANT-16
Integrated External
Omni ordirectional
OmniDirect-ional
AP-125wall
mounted
AP-105wall
mounted
120° or60° beam
120° 60°
AP-124plus
ANT-17
AP-124plus
ANT-18
44 | RF Design for HD WLANs High-Density Wireless Networks for Auditoriums VRD | Solution Guide
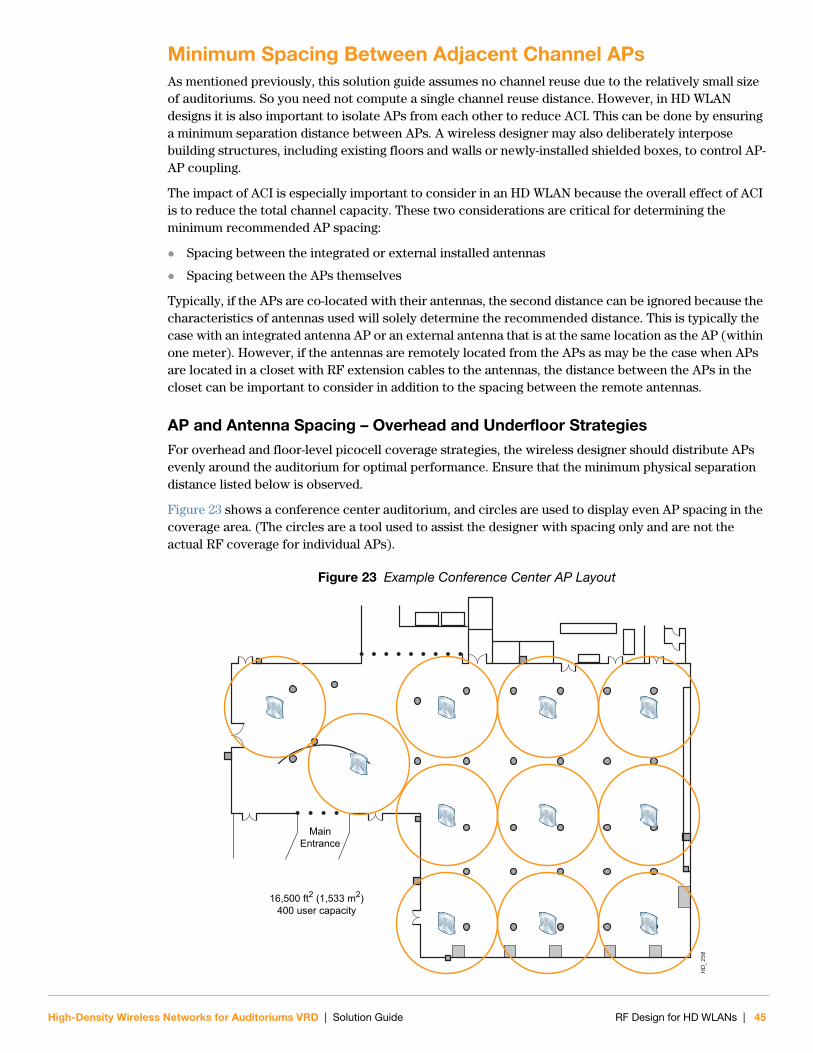
Minimum Spacing Between Adjacent Channel APsAs mentioned previously, this solution guide assumes no channel reuse due to the relatively small size of auditoriums. So you need not compute a single channel reuse distance. However, in HD WLAN designs it is also important to isolate APs from each other to reduce ACI. This can be done by ensuring a minimum separation distance between APs. A wireless designer may also deliberately interpose building structures, including existing floors and walls or newly-installed shielded boxes, to control AP-AP coupling.
The impact of ACI is especially important to consider in an HD WLAN because the overall effect of ACI is to reduce the total channel capacity. These two considerations are critical for determining the minimum recommended AP spacing:
Spacing between the integrated or external installed antennas
Spacing between the APs themselves
Typically, if the APs are co-located with their antennas, the second distance can be ignored because the characteristics of antennas used will solely determine the recommended distance. This is typically the case with an integrated antenna AP or an external antenna that is at the same location as the AP (within one meter). However, if the antennas are remotely located from the APs as may be the case when APs are located in a closet with RF extension cables to the antennas, the distance between the APs in the closet can be important to consider in addition to the spacing between the remote antennas.
AP and Antenna Spacing – Overhead and Underfloor Strategies For overhead and floor-level picocell coverage strategies, the wireless designer should distribute APs evenly around the auditorium for optimal performance. Ensure that the minimum physical separation distance listed below is observed.
Figure 23 shows a conference center auditorium, and circles are used to display even AP spacing in the coverage area. (The circles are a tool used to assist the designer with spacing only and are not the actual RF coverage for individual APs).
Figure 23 Example Conference Center AP Layout
HD
_258
MainEntrance
16,500 ft2 (1,533 m2)400 user capacity
High-Density Wireless Networks for Auditoriums VRD | Solution Guide RF Design for HD WLANs | 45
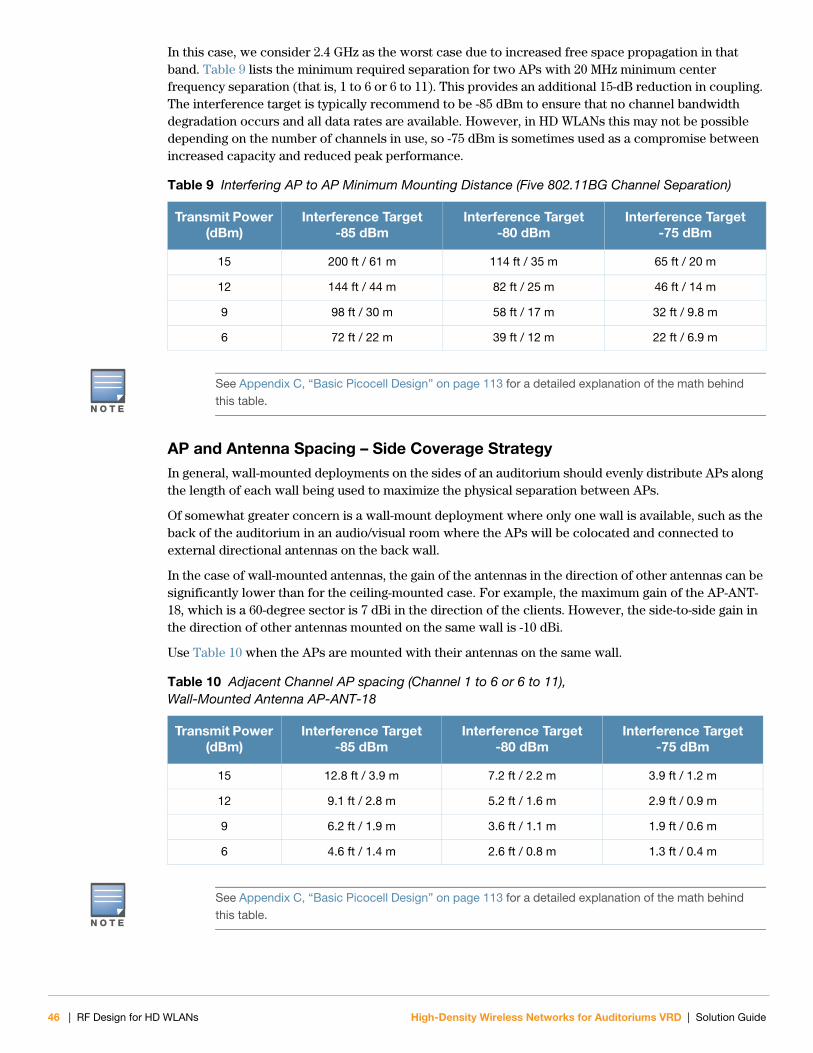
In this case, we consider 2.4 GHz as the worst case due to increased free space propagation in that band. Table 9 lists the minimum required separation for two APs with 20 MHz minimum center frequency separation (that is, 1 to 6 or 6 to 11). This provides an additional 15-dB reduction in coupling. The interference target is typically recommend to be -85 dBm to ensure that no channel bandwidth degradation occurs and all data rates are available. However, in HD WLANs this may not be possible depending on the number of channels in use, so -75 dBm is sometimes used as a compromise between increased capacity and reduced peak performance.
AP and Antenna Spacing – Side Coverage Strategy In general, wall-mounted deployments on the sides of an auditorium should evenly distribute APs along the length of each wall being used to maximize the physical separation between APs.
Of somewhat greater concern is a wall-mount deployment where only one wall is available, such as the back of the auditorium in an audio/visual room where the APs will be colocated and connected to external directional antennas on the back wall.
In the case of wall-mounted antennas, the gain of the antennas in the direction of other antennas can be significantly lower than for the ceiling-mounted case. For example, the maximum gain of the AP-ANT-18, which is a 60-degree sector is 7 dBi in the direction of the clients. However, the side-to-side gain in the direction of other antennas mounted on the same wall is -10 dBi.
Use Table 10 when the APs are mounted with their antennas on the same wall.
Table 9 Interfering AP to AP Minimum Mounting Distance (Five 802.11BG Channel Separation)
Transmit Power (dBm)
Interference Target-85 dBm
Interference Target-80 dBm
Interference Target-75 dBm
15 200 ft / 61 m 114 ft / 35 m 65 ft / 20 m
12 144 ft / 44 m 82 ft / 25 m 46 ft / 14 m
9 98 ft / 30 m 58 ft / 17 m 32 ft / 9.8 m
6 72 ft / 22 m 39 ft / 12 m 22 ft / 6.9 m
N O T E
See Appendix C, “Basic Picocell Design” on page 113 for a detailed explanation of the math behind this table.
Table 10 Adjacent Channel AP spacing (Channel 1 to 6 or 6 to 11), Wall-Mounted Antenna AP-ANT-18
Transmit Power (dBm)
Interference Target-85 dBm
Interference Target-80 dBm
Interference Target-75 dBm
15 12.8 ft / 3.9 m 7.2 ft / 2.2 m 3.9 ft / 1.2 m
12 9.1 ft / 2.8 m 5.2 ft / 1.6 m 2.9 ft / 0.9 m
9 6.2 ft / 1.9 m 3.6 ft / 1.1 m 1.9 ft / 0.6 m
6 4.6 ft / 1.4 m 2.6 ft / 0.8 m 1.3 ft / 0.4 m
N O T E
See Appendix C, “Basic Picocell Design” on page 113 for a detailed explanation of the math behind this table.
46 | RF Design for HD WLANs High-Density Wireless Networks for Auditoriums VRD | Solution Guide
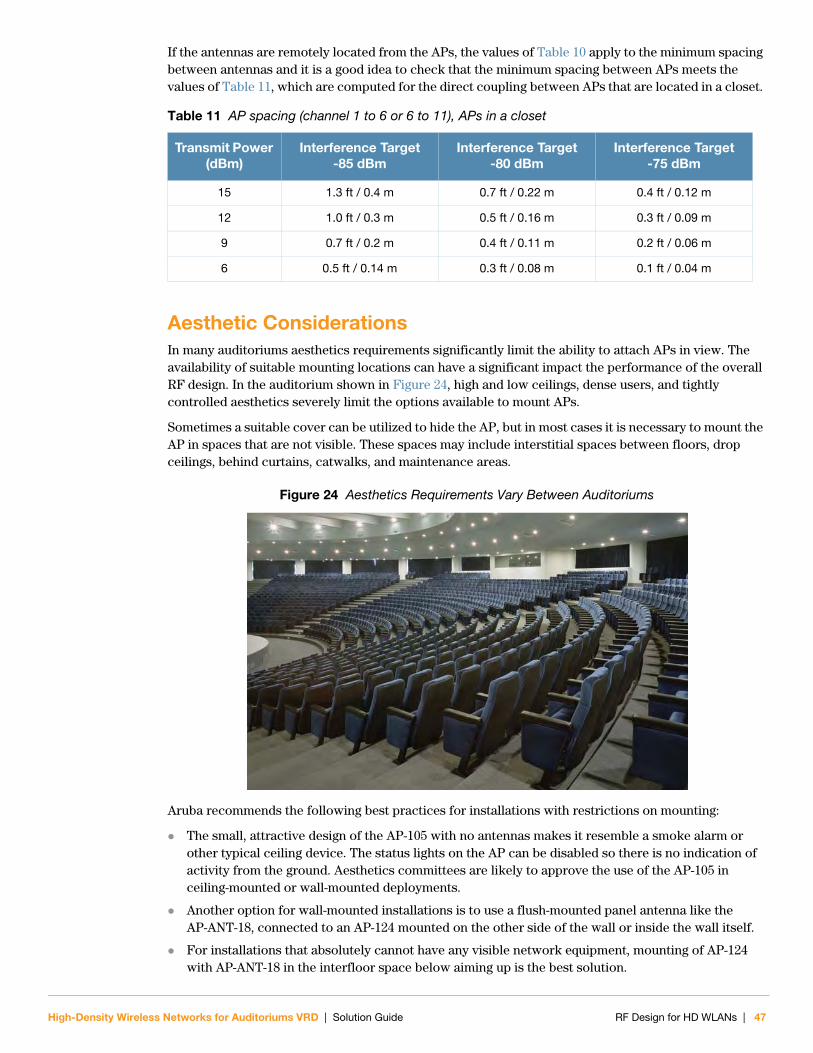
If the antennas are remotely located from the APs, the values of Table 10 apply to the minimum spacing between antennas and it is a good idea to check that the minimum spacing between APs meets the values of Table 11, which are computed for the direct coupling between APs that are located in a closet.
Aesthetic Considerations In many auditoriums aesthetics requirements significantly limit the ability to attach APs in view. The availability of suitable mounting locations can have a significant impact the performance of the overall RF design. In the auditorium shown in Figure 24, high and low ceilings, dense users, and tightly controlled aesthetics severely limit the options available to mount APs.
Sometimes a suitable cover can be utilized to hide the AP, but in most cases it is necessary to mount the AP in spaces that are not visible. These spaces may include interstitial spaces between floors, drop ceilings, behind curtains, catwalks, and maintenance areas.
Figure 24 Aesthetics Requirements Vary Between Auditoriums
Aruba recommends the following best practices for installations with restrictions on mounting:
The small, attractive design of the AP-105 with no antennas makes it resemble a smoke alarm or other typical ceiling device. The status lights on the AP can be disabled so there is no indication of activity from the ground. Aesthetics committees are likely to approve the use of the AP-105 in ceiling-mounted or wall-mounted deployments.
Another option for wall-mounted installations is to use a flush-mounted panel antenna like the AP-ANT-18, connected to an AP-124 mounted on the other side of the wall or inside the wall itself.
For installations that absolutely cannot have any visible network equipment, mounting of AP-124 with AP-ANT-18 in the interfloor space below aiming up is the best solution.
Table 11 AP spacing (channel 1 to 6 or 6 to 11), APs in a closet
Transmit Power (dBm)
Interference Target-85 dBm
Interference Target-80 dBm
Interference Target-75 dBm
15 1.3 ft / 0.4 m 0.7 ft / 0.22 m 0.4 ft / 0.12 m
12 1.0 ft / 0.3 m 0.5 ft / 0.16 m 0.3 ft / 0.09 m
9 0.7 ft / 0.2 m 0.4 ft / 0.11 m 0.2 ft / 0.06 m
6 0.5 ft / 0.14 m 0.3 ft / 0.08 m 0.1 ft / 0.04 m
High-Density Wireless Networks for Auditoriums VRD | Solution Guide RF Design for HD WLANs | 47
General Installation Best PracticesAntenna mounting locations are always important. Here are some suggestions:
Select mounting locations that have no obstructions between the front of the antennas (or integrated antenna APs) and the intended wireless clients.
If external antennas are being used, plan to mount your APs as close to their antennas as possible. If absolutely necessary, use good-quality, low-loss coaxial cable to connect AP to antenna when mounting the AP some distance away from the antenna.
Follow these guidelines when aligning antennas:
Do not mix mounting strategies in the same room. When planning adjacent HD WLANs, use the same strategy (overhead, side, or picocell) in all rooms.
Always mount antennas with built-in downtilt flat against the ceiling or floor so that the beam is exactly vertical.
Keep a safe distance between your integrated antenna APs and any location where people will be present. There are Specific Absorption Rate (SAR) distance requirements designed to protect the human body from coming into too-close contact with wireless devices and wireless energy. In the U.S. the SAR regulations require at least 6 in (15 cm) of clearance between WLAN antennas and the human body. Plan to allow at least this much clearance, though more is better.
When using side coverage with directional antennas on opposite sides of the same room, mount the antennas using an appropriate amount of mechanical downtilt so that the 3-dB beamwidth of the E-plane is aimed below the far antennas. (Note that the AP-ANT-17 and AP-ANT-18 have a built-in downtilt of about 20 degrees).
Managing Adjacent HD WLANsIt is common to find adjacent auditoriums at universities, hotels, and convention centers, either on the same level or spanning multiple floors. In this case, it’s very possible that auditoriums will interfere with one another and reduce overall throughput. In this situation, it may be necessary to use APs with integrated or external directional antennas to preserve network performance.
Managing ClientsWe stated earlier that the client devices dominate the CCI/ACI problem in HD WLANs because they greatly outnumber the AP. Always use very low EIRP on the AP in an high-density deployment. Then, enabling TPC is critical to getting as many client devices as possible to lower their power to match the APs. Clients that do not honor TPC and use full power may create interference with adjacent auditoriums. There is little you can do about it—user education is the key. Provide resources for your users that identify the best version of driver and its appropriate configuration. Strongly encourage users to update their drivers—and remind them often.
N O T E
Each strategy is carefully designed to (i) ensure a uniform signal level throughout the auditorium; and (ii) control both AP-to-AP interference inside and outside the auditorium. Mixing strategies will reduce performance and increase interference.
48 | RF Design for HD WLANs High-Density Wireless Networks for Auditoriums VRD | Solution Guide
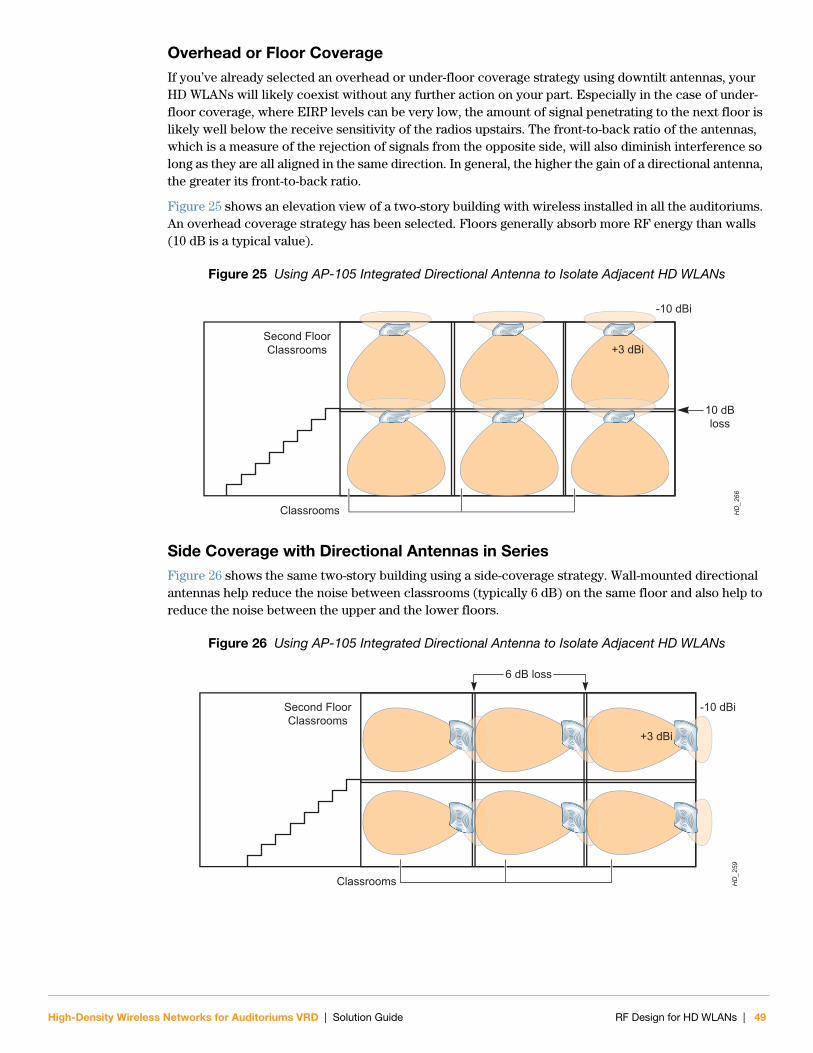
Overhead or Floor CoverageIf you’ve already selected an overhead or under-floor coverage strategy using downtilt antennas, your HD WLANs will likely coexist without any further action on your part. Especially in the case of under-floor coverage, where EIRP levels can be very low, the amount of signal penetrating to the next floor is likely well below the receive sensitivity of the radios upstairs. The front-to-back ratio of the antennas, which is a measure of the rejection of signals from the opposite side, will also diminish interference so long as they are all aligned in the same direction. In general, the higher the gain of a directional antenna, the greater its front-to-back ratio.
Figure 25 shows an elevation view of a two-story building with wireless installed in all the auditoriums. An overhead coverage strategy has been selected. Floors generally absorb more RF energy than walls (10 dB is a typical value).
Figure 25 Using AP-105 Integrated Directional Antenna to Isolate Adjacent HD WLANs
Side Coverage with Directional Antennas in SeriesFigure 26 shows the same two-story building using a side-coverage strategy. Wall-mounted directional antennas help reduce the noise between classrooms (typically 6 dB) on the same floor and also help to reduce the noise between the upper and the lower floors.
Figure 26 Using AP-105 Integrated Directional Antenna to Isolate Adjacent HD WLANs
HD
_266
Classrooms
+3 dBi
-10 dBi
10 dBloss
Second FloorClassrooms
HD
_259
Classrooms
+3 dBi
-10 dBi
6 dB loss
Second FloorClassrooms
High-Density Wireless Networks for Auditoriums VRD | Solution Guide RF Design for HD WLANs | 49
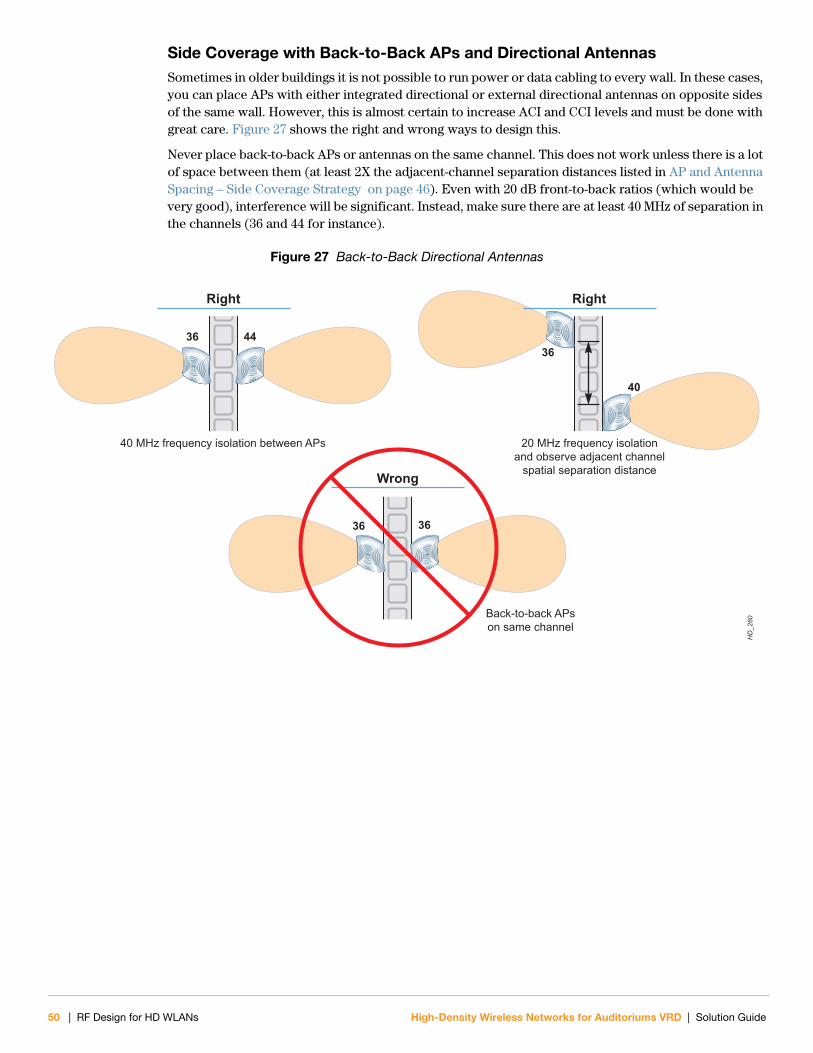
Side Coverage with Back-to-Back APs and Directional AntennasSometimes in older buildings it is not possible to run power or data cabling to every wall. In these cases, you can place APs with either integrated directional or external directional antennas on opposite sides of the same wall. However, this is almost certain to increase ACI and CCI levels and must be done with great care. Figure 27 shows the right and wrong ways to design this.
Never place back-to-back APs or antennas on the same channel. This does not work unless there is a lot of space between them (at least 2X the adjacent-channel separation distances listed in AP and Antenna Spacing – Side Coverage Strategy on page 46). Even with 20 dB front-to-back ratios (which would be very good), interference will be significant. Instead, make sure there are at least 40 MHz of separation in the channels (36 and 44 for instance).
Figure 27 Back-to-Back Directional Antennas
HD
_260
40 MHz frequency isolation between APs
3636
40
44
Wrong
Right
36 36
20 MHz frequency isolationand observe adjacent channel
spatial separation distance
Right
Back-to-back APson same channel
50 | RF Design for HD WLANs High-Density Wireless Networks for Auditoriums VRD | Solution Guide
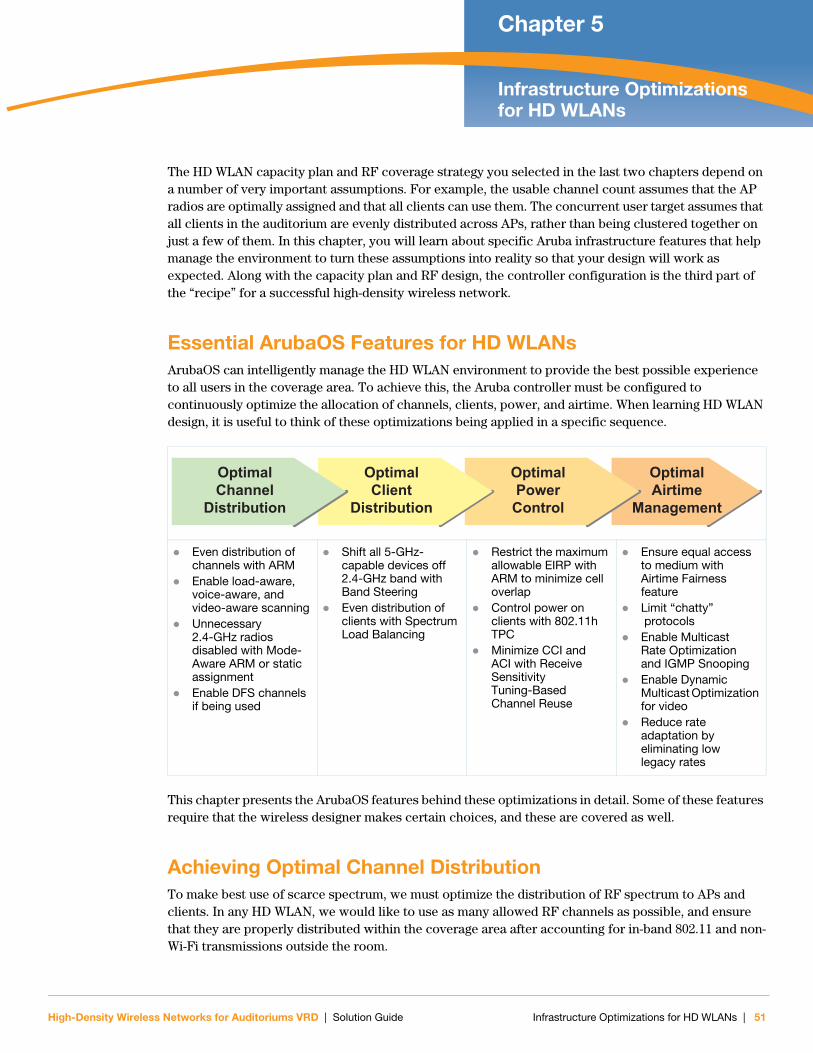
High-Density Wireless Networks for Auditoriums VRD | Solution Guide
Chapter 5Infrastructure Optimizations for HD WLANs
The HD WLAN capacity plan and RF coverage strategy you selected in the last two chapters depend on a number of very important assumptions. For example, the usable channel count assumes that the AP radios are optimally assigned and that all clients can use them. The concurrent user target assumes that all clients in the auditorium are evenly distributed across APs, rather than being clustered together on just a few of them. In this chapter, you will learn about specific Aruba infrastructure features that help manage the environment to turn these assumptions into reality so that your design will work as expected. Along with the capacity plan and RF design, the controller configuration is the third part of the “recipe” for a successful high-density wireless network.
Essential ArubaOS Features for HD WLANsArubaOS can intelligently manage the HD WLAN environment to provide the best possible experience to all users in the coverage area. To achieve this, the Aruba controller must be configured to continuously optimize the allocation of channels, clients, power, and airtime. When learning HD WLAN design, it is useful to think of these optimizations being applied in a specific sequence.
This chapter presents the ArubaOS features behind these optimizations in detail. Some of these features require that the wireless designer makes certain choices, and these are covered as well.
Achieving Optimal Channel DistributionTo make best use of scarce spectrum, we must optimize the distribution of RF spectrum to APs and clients. In any HD WLAN, we would like to use as many allowed RF channels as possible, and ensure that they are properly distributed within the coverage area after accounting for in-band 802.11 and non-Wi-Fi transmissions outside the room.
Even distribution of channels with ARM
Enable load-aware, voice-aware, and video-aware scanning
Unnecessary 2.4-GHz radios disabled with Mode-Aware ARM or static assignment
Enable DFS channels if being used
Shift all 5-GHz-capable devices off 2.4-GHz band with Band Steering
Even distribution of clients with Spectrum Load Balancing
Restrict the maximum allowable EIRP with ARM to minimize cell overlap
Control power on clients with 802.11h TPC
Minimize CCI and ACI with Receive Sensitivity Tuning-Based Channel Reuse
Ensure equal access to medium with Airtime Fairness feature
Limit “chatty” protocols
Enable Multicast Rate Optimization and IGMP Snooping
Enable Dynamic Multicast Optimization for video
Reduce rate adaptation by eliminating low legacy rates
OptimalAirtime
Management
OptimalPowerControl
OptimalClient
Distribution
OptimalChannel
Distribution
Infrastructure Optimizations for HD WLANs | 51
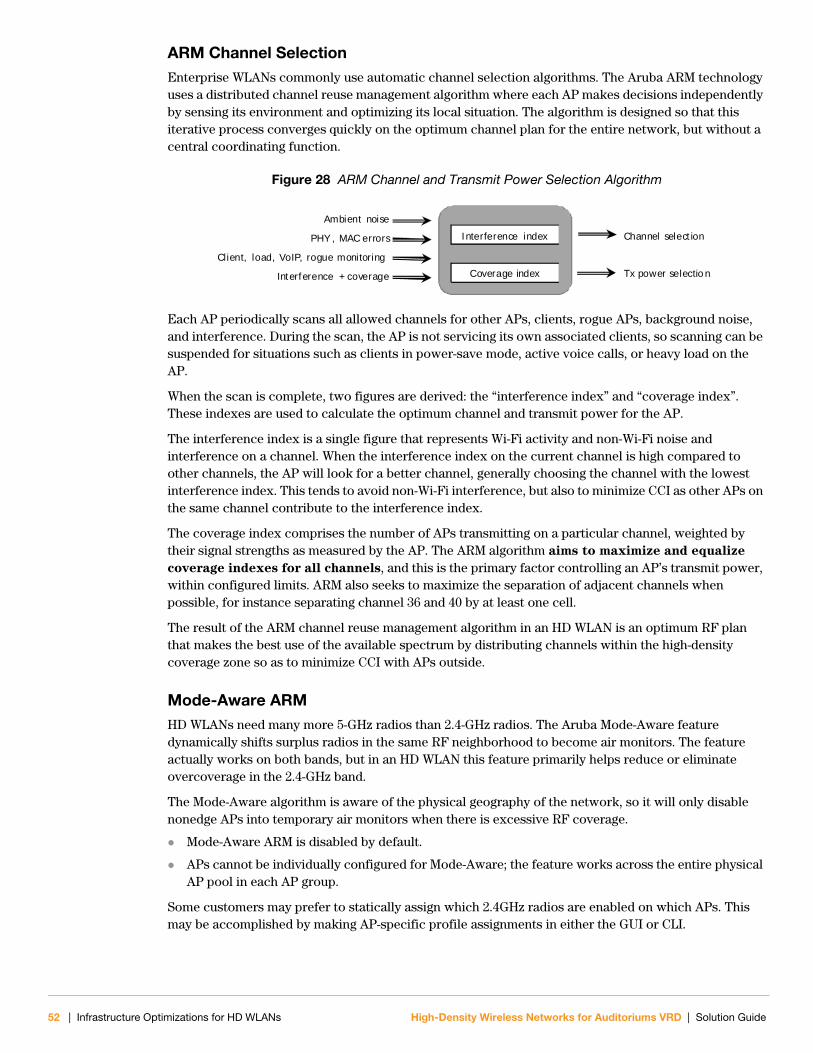
ARM Channel SelectionEnterprise WLANs commonly use automatic channel selection algorithms. The Aruba ARM technology uses a distributed channel reuse management algorithm where each AP makes decisions independently by sensing its environment and optimizing its local situation. The algorithm is designed so that this iterative process converges quickly on the optimum channel plan for the entire network, but without a central coordinating function.
Figure 28 ARM Channel and Transmit Power Selection Algorithm
Each AP periodically scans all allowed channels for other APs, clients, rogue APs, background noise, and interference. During the scan, the AP is not servicing its own associated clients, so scanning can be suspended for situations such as clients in power-save mode, active voice calls, or heavy load on the AP.
When the scan is complete, two figures are derived: the “interference index” and “coverage index”. These indexes are used to calculate the optimum channel and transmit power for the AP.
The interference index is a single figure that represents Wi-Fi activity and non-Wi-Fi noise and interference on a channel. When the interference index on the current channel is high compared to other channels, the AP will look for a better channel, generally choosing the channel with the lowest interference index. This tends to avoid non-Wi-Fi interference, but also to minimize CCI as other APs on the same channel contribute to the interference index.
The coverage index comprises the number of APs transmitting on a particular channel, weighted by their signal strengths as measured by the AP. The ARM algorithm aims to maximize and equalize
coverage indexes for all channels, and this is the primary factor controlling an AP’s transmit power, within configured limits. ARM also seeks to maximize the separation of adjacent channels when possible, for instance separating channel 36 and 40 by at least one cell.
The result of the ARM channel reuse management algorithm in an HD WLAN is an optimum RF plan that makes the best use of the available spectrum by distributing channels within the high-density coverage zone so as to minimize CCI with APs outside.
Mode-Aware ARMHD WLANs need many more 5-GHz radios than 2.4-GHz radios. The Aruba Mode-Aware feature dynamically shifts surplus radios in the same RF neighborhood to become air monitors. The feature actually works on both bands, but in an HD WLAN this feature primarily helps reduce or eliminate overcoverage in the 2.4-GHz band.
The Mode-Aware algorithm is aware of the physical geography of the network, so it will only disable nonedge APs into temporary air monitors when there is excessive RF coverage.
Mode-Aware ARM is disabled by default.
APs cannot be individually configured for Mode-Aware; the feature works across the entire physical AP pool in each AP group.
Some customers may prefer to statically assign which 2.4GHz radios are enabled on which APs. This may be accomplished by making AP-specific profile assignments in either the GUI or CLI.
Coverage index
Interference index
Ambient noise
PHY , MAC errors
Client, load, VoIP, rogue monitoring
Interference + coverage
Channel selection
Tx power selectio n
52 | Infrastructure Optimizations for HD WLANs High-Density Wireless Networks for Auditoriums VRD | Solution Guide
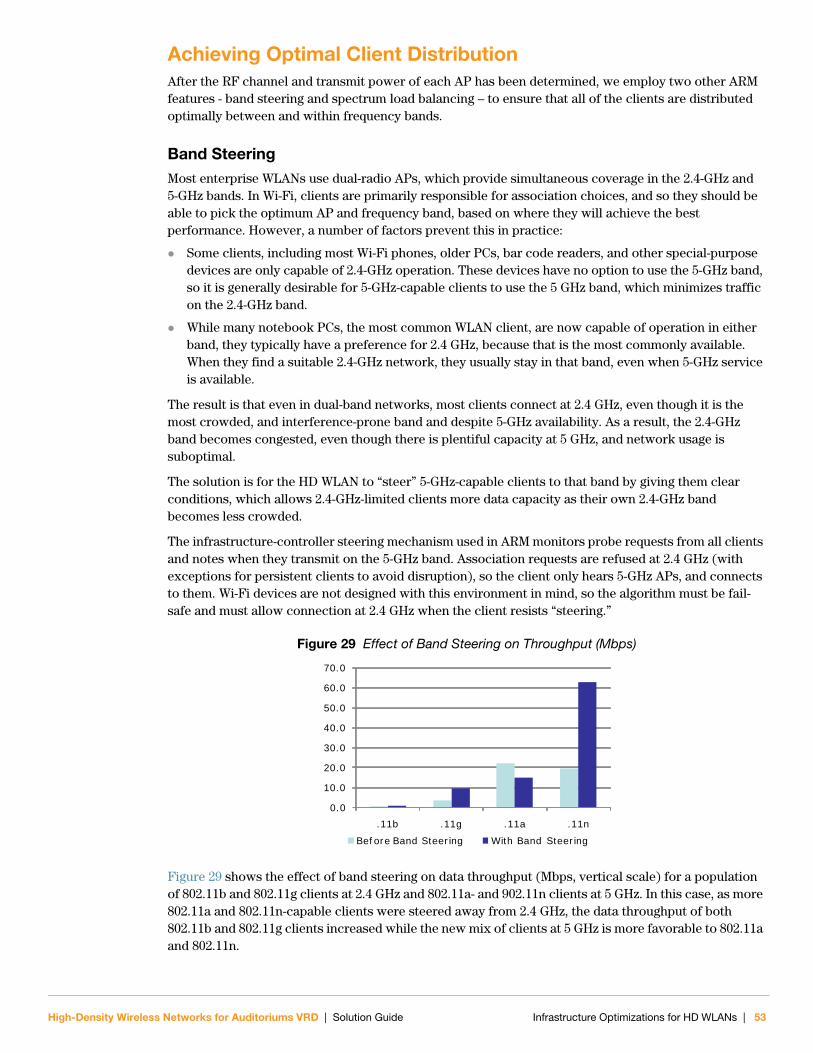
Achieving Optimal Client DistributionAfter the RF channel and transmit power of each AP has been determined, we employ two other ARM features - band steering and spectrum load balancing – to ensure that all of the clients are distributed optimally between and within frequency bands.
Band SteeringMost enterprise WLANs use dual-radio APs, which provide simultaneous coverage in the 2.4-GHz and 5-GHz bands. In Wi-Fi, clients are primarily responsible for association choices, and so they should be able to pick the optimum AP and frequency band, based on where they will achieve the best performance. However, a number of factors prevent this in practice:
Some clients, including most Wi-Fi phones, older PCs, bar code readers, and other special-purpose devices are only capable of 2.4-GHz operation. These devices have no option to use the 5-GHz band, so it is generally desirable for 5-GHz-capable clients to use the 5 GHz band, which minimizes traffic on the 2.4-GHz band.
While many notebook PCs, the most common WLAN client, are now capable of operation in either band, they typically have a preference for 2.4 GHz, because that is the most commonly available. When they find a suitable 2.4-GHz network, they usually stay in that band, even when 5-GHz service is available.
The result is that even in dual-band networks, most clients connect at 2.4 GHz, even though it is the most crowded, and interference-prone band and despite 5-GHz availability. As a result, the 2.4-GHz band becomes congested, even though there is plentiful capacity at 5 GHz, and network usage is suboptimal.
The solution is for the HD WLAN to “steer” 5-GHz-capable clients to that band by giving them clear conditions, which allows 2.4-GHz-limited clients more data capacity as their own 2.4-GHz band becomes less crowded.
The infrastructure-controller steering mechanism used in ARM monitors probe requests from all clients and notes when they transmit on the 5-GHz band. Association requests are refused at 2.4 GHz (with exceptions for persistent clients to avoid disruption), so the client only hears 5-GHz APs, and connects to them. Wi-Fi devices are not designed with this environment in mind, so the algorithm must be fail-safe and must allow connection at 2.4 GHz when the client resists “steering.”
Figure 29 Effect of Band Steering on Throughput (Mbps)
Figure 29 shows the effect of band steering on data throughput (Mbps, vertical scale) for a population of 802.11b and 802.11g clients at 2.4 GHz and 802.11a- and 902.11n clients at 5 GHz. In this case, as more 802.11a and 802.11n-capable clients were steered away from 2.4 GHz, the data throughput of both 802.11b and 802.11g clients increased while the new mix of clients at 5 GHz is more favorable to 802.11a and 802.11n.
0.0
10.0
20.0
30.0
40.0
50.0
60.0
70.0
.11b .11g .11a .11n
Before Band Steering With Band Steering
High-Density Wireless Networks for Auditoriums VRD | Solution Guide Infrastructure Optimizations for HD WLANs | 53
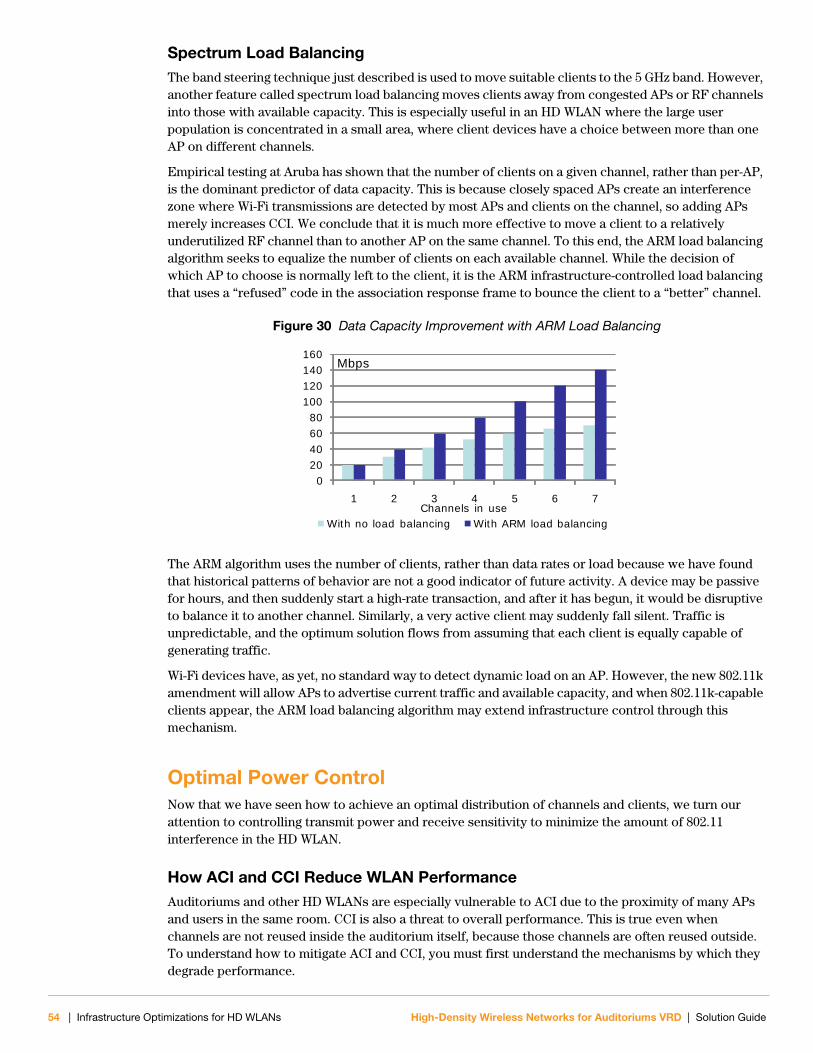
Spectrum Load BalancingThe band steering technique just described is used to move suitable clients to the 5 GHz band. However, another feature called spectrum load balancing moves clients away from congested APs or RF channels into those with available capacity. This is especially useful in an HD WLAN where the large user population is concentrated in a small area, where client devices have a choice between more than one AP on different channels.
Empirical testing at Aruba has shown that the number of clients on a given channel, rather than per-AP, is the dominant predictor of data capacity. This is because closely spaced APs create an interference zone where Wi-Fi transmissions are detected by most APs and clients on the channel, so adding APs merely increases CCI. We conclude that it is much more effective to move a client to a relatively underutilized RF channel than to another AP on the same channel. To this end, the ARM load balancing algorithm seeks to equalize the number of clients on each available channel. While the decision of which AP to choose is normally left to the client, it is the ARM infrastructure-controlled load balancing that uses a “refused” code in the association response frame to bounce the client to a “better” channel.
Figure 30 Data Capacity Improvement with ARM Load Balancing
The ARM algorithm uses the number of clients, rather than data rates or load because we have found that historical patterns of behavior are not a good indicator of future activity. A device may be passive for hours, and then suddenly start a high-rate transaction, and after it has begun, it would be disruptive to balance it to another channel. Similarly, a very active client may suddenly fall silent. Traffic is unpredictable, and the optimum solution flows from assuming that each client is equally capable of generating traffic.
Wi-Fi devices have, as yet, no standard way to detect dynamic load on an AP. However, the new 802.11k amendment will allow APs to advertise current traffic and available capacity, and when 802.11k-capable clients appear, the ARM load balancing algorithm may extend infrastructure control through this mechanism.
Optimal Power ControlNow that we have seen how to achieve an optimal distribution of channels and clients, we turn our attention to controlling transmit power and receive sensitivity to minimize the amount of 802.11 interference in the HD WLAN.
How ACI and CCI Reduce WLAN PerformanceAuditoriums and other HD WLANs are especially vulnerable to ACI due to the proximity of many APs and users in the same room. CCI is also a threat to overall performance. This is true even when channels are not reused inside the auditorium itself, because those channels are often reused outside. To understand how to mitigate ACI and CCI, you must first understand the mechanisms by which they degrade performance.
020406080
100120140160
1 2 3 4 5 6 7Channels in use
With no load balancing With ARM load balancing
Mbps
54 | Infrastructure Optimizations for HD WLANs High-Density Wireless Networks for Auditoriums VRD | Solution Guide
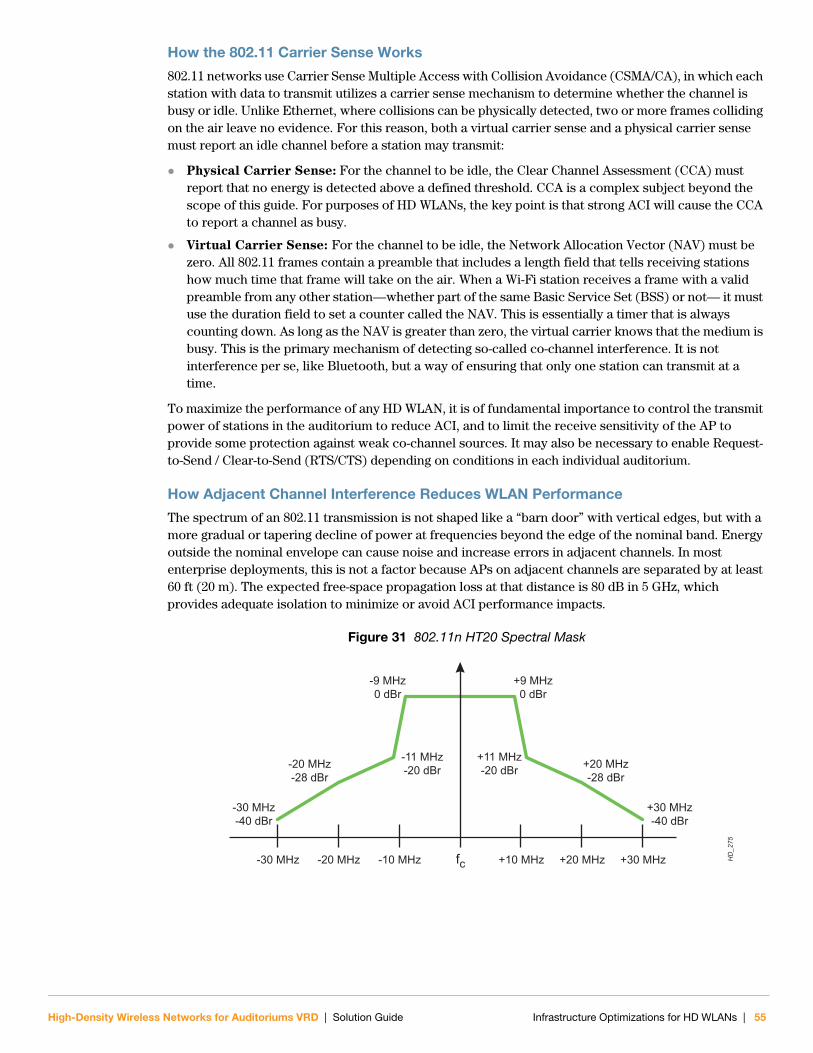
How the 802.11 Carrier Sense Works
802.11 networks use Carrier Sense Multiple Access with Collision Avoidance (CSMA/CA), in which each station with data to transmit utilizes a carrier sense mechanism to determine whether the channel is busy or idle. Unlike Ethernet, where collisions can be physically detected, two or more frames colliding on the air leave no evidence. For this reason, both a virtual carrier sense and a physical carrier sense must report an idle channel before a station may transmit:
Physical Carrier Sense: For the channel to be idle, the Clear Channel Assessment (CCA) must report that no energy is detected above a defined threshold. CCA is a complex subject beyond the scope of this guide. For purposes of HD WLANs, the key point is that strong ACI will cause the CCA to report a channel as busy.
Virtual Carrier Sense: For the channel to be idle, the Network Allocation Vector (NAV) must be zero. All 802.11 frames contain a preamble that includes a length field that tells receiving stations how much time that frame will take on the air. When a Wi-Fi station receives a frame with a valid preamble from any other station—whether part of the same Basic Service Set (BSS) or not— it must use the duration field to set a counter called the NAV. This is essentially a timer that is always counting down. As long as the NAV is greater than zero, the virtual carrier knows that the medium is busy. This is the primary mechanism of detecting so-called co-channel interference. It is not interference per se, like Bluetooth, but a way of ensuring that only one station can transmit at a time.
To maximize the performance of any HD WLAN, it is of fundamental importance to control the transmit power of stations in the auditorium to reduce ACI, and to limit the receive sensitivity of the AP to provide some protection against weak co-channel sources. It may also be necessary to enable Request-to-Send / Clear-to-Send (RTS/CTS) depending on conditions in each individual auditorium.
How Adjacent Channel Interference Reduces WLAN Performance
The spectrum of an 802.11 transmission is not shaped like a “barn door” with vertical edges, but with a more gradual or tapering decline of power at frequencies beyond the edge of the nominal band. Energy outside the nominal envelope can cause noise and increase errors in adjacent channels. In most enterprise deployments, this is not a factor because APs on adjacent channels are separated by at least 60 ft (20 m). The expected free-space propagation loss at that distance is 80 dB in 5 GHz, which provides adequate isolation to minimize or avoid ACI performance impacts.
Figure 31 802.11n HT20 Spectral Mask
HD
_275
-30 MHz -20 MHz -10 MHz fc +10 MHz +20 MHz +30 MHz
+9 MHz0 dBr
-9 MHz0 dBr
+11 MHz-20 dBr
-11 MHz-20 dBr +20 MHz
-28 dBr-20 MHz-28 dBr
+30 MHz-40 dBr
-30 MHz-40 dBr
High-Density Wireless Networks for Auditoriums VRD | Solution Guide Infrastructure Optimizations for HD WLANs | 55
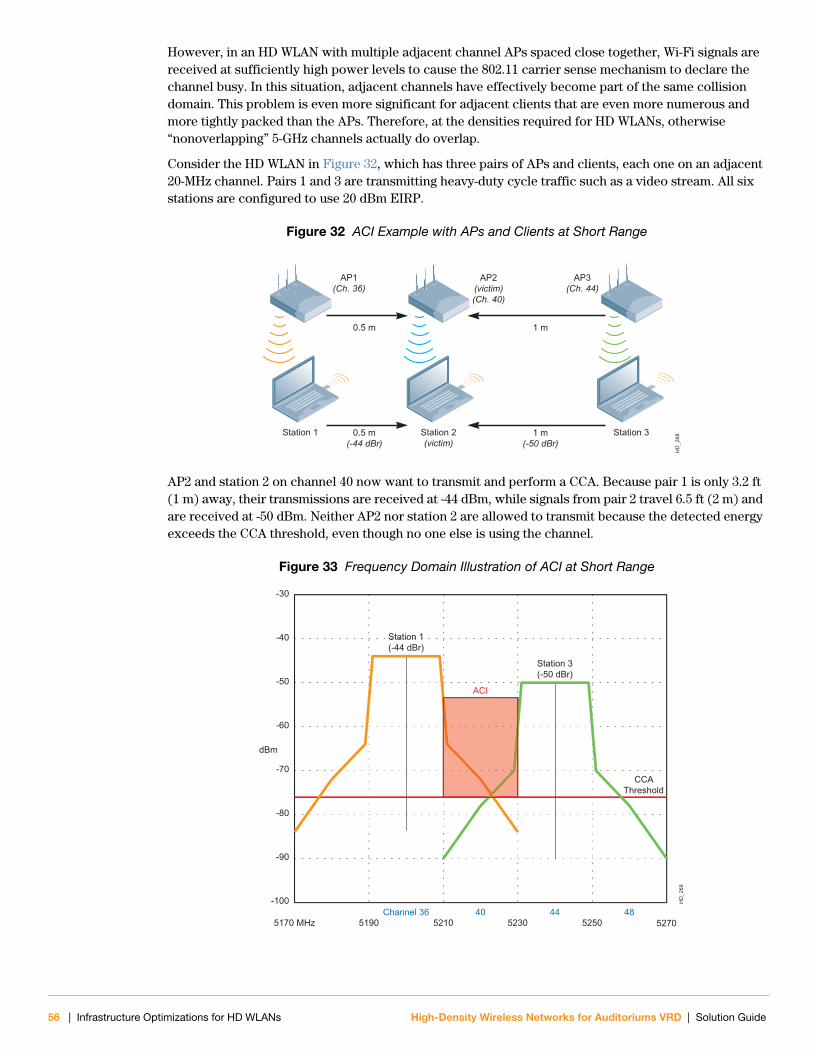
However, in an HD WLAN with multiple adjacent channel APs spaced close together, Wi-Fi signals are received at sufficiently high power levels to cause the 802.11 carrier sense mechanism to declare the channel busy. In this situation, adjacent channels have effectively become part of the same collision domain. This problem is even more significant for adjacent clients that are even more numerous and more tightly packed than the APs. Therefore, at the densities required for HD WLANs, otherwise “nonoverlapping” 5-GHz channels actually do overlap.
Consider the HD WLAN in Figure 32, which has three pairs of APs and clients, each one on an adjacent 20-MHz channel. Pairs 1 and 3 are transmitting heavy-duty cycle traffic such as a video stream. All six stations are configured to use 20 dBm EIRP.
Figure 32 ACI Example with APs and Clients at Short Range
AP2 and station 2 on channel 40 now want to transmit and perform a CCA. Because pair 1 is only 3.2 ft (1 m) away, their transmissions are received at -44 dBm, while signals from pair 2 travel 6.5 ft (2 m) and are received at -50 dBm. Neither AP2 nor station 2 are allowed to transmit because the detected energy exceeds the CCA threshold, even though no one else is using the channel.
Figure 33 Frequency Domain Illustration of ACI at Short Range
HD
_268
AP1(Ch. 36)
AP2(victim)(Ch. 40)
AP3(Ch. 44)
0.5 m 1 m
Station 1 Station 2(victim)
Station 30.5 m(-44 dBr)
1 m(-50 dBr)
HD
_269
-30
-40
-50
-60
-70
-80
-90
-100
5170 MHz 5190 5210 5230 5250Channel 36 40
dBm
44
Station 1(-44 dBr)
Station 3(-50 dBr)
CCAThreshold
ACI
485270
56 | Infrastructure Optimizations for HD WLANs High-Density Wireless Networks for Auditoriums VRD | Solution Guide

Inside an auditorium, with minimal free space propagation loss between stations, the edge of the skirt can easily be -75 dBm or higher. This is easily modeled. Note how reducing the transmit EIRP from 20 dBm to just 3 dBm reduces the interference radius by more than a factor of 4.
Figure 34 ACI Power vs. Receiver Distance(Peak Skirt Power = 20 dBr, n=2.2, 2.4-GHz NF = -95 dBm, 5-GHz NF = -105 dBm)
The effect of ACI is easy to measure in an HD WLAN environment. The following test was conducted with two side-by-side groups of 10 clients, each associated to an AP on an adjacent HT20 channel. A baseline was taken first, with each group testing separately. Then the test was rerun with each group (channel) transmitting simultaneously. The two groups were moved 25 ft (7.6 m) and 50 ft (15.2 m) apart with tests run at both locations. These results align with the previous model quite well.
Figure 35 TCP Throughput with Decreasing Distance and Increasing ACI
High-Density Wireless Networks for Auditoriums VRD | Solution Guide Infrastructure Optimizations for HD WLANs | 57
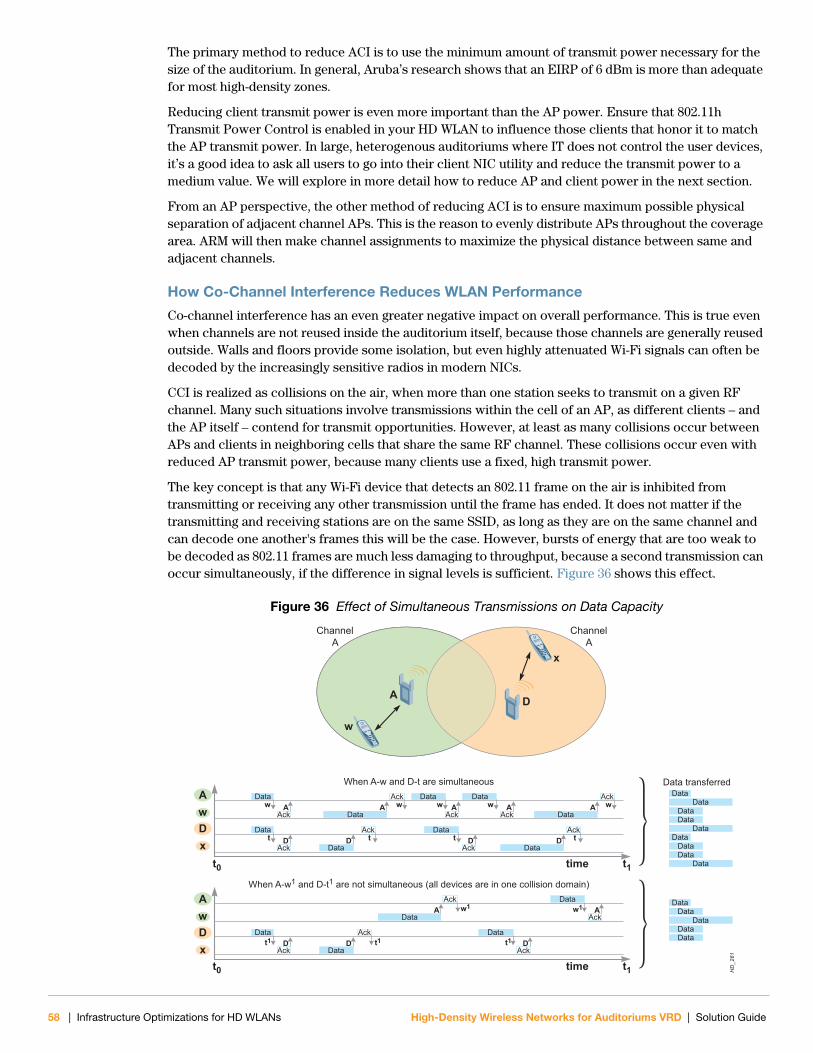
The primary method to reduce ACI is to use the minimum amount of transmit power necessary for the size of the auditorium. In general, Aruba’s research shows that an EIRP of 6 dBm is more than adequate for most high-density zones.
Reducing client transmit power is even more important than the AP power. Ensure that 802.11h Transmit Power Control is enabled in your HD WLAN to influence those clients that honor it to match the AP transmit power. In large, heterogenous auditoriums where IT does not control the user devices, it’s a good idea to ask all users to go into their client NIC utility and reduce the transmit power to a medium value. We will explore in more detail how to reduce AP and client power in the next section.
From an AP perspective, the other method of reducing ACI is to ensure maximum possible physical separation of adjacent channel APs. This is the reason to evenly distribute APs throughout the coverage area. ARM will then make channel assignments to maximize the physical distance between same and adjacent channels.
How Co-Channel Interference Reduces WLAN Performance
Co-channel interference has an even greater negative impact on overall performance. This is true even when channels are not reused inside the auditorium itself, because those channels are generally reused outside. Walls and floors provide some isolation, but even highly attenuated Wi-Fi signals can often be decoded by the increasingly sensitive radios in modern NICs.
CCI is realized as collisions on the air, when more than one station seeks to transmit on a given RF channel. Many such situations involve transmissions within the cell of an AP, as different clients – and the AP itself – contend for transmit opportunities. However, at least as many collisions occur between APs and clients in neighboring cells that share the same RF channel. These collisions occur even with reduced AP transmit power, because many clients use a fixed, high transmit power.
The key concept is that any Wi-Fi device that detects an 802.11 frame on the air is inhibited from transmitting or receiving any other transmission until the frame has ended. It does not matter if the transmitting and receiving stations are on the same SSID, as long as they are on the same channel and can decode one another's frames this will be the case. However, bursts of energy that are too weak to be decoded as 802.11 frames are much less damaging to throughput, because a second transmission can occur simultaneously, if the difference in signal levels is sufficient. Figure 36 shows this effect.
Figure 36 Effect of Simultaneous Transmissions on Data Capacity
HD
_261
ChannelA
ChannelA
When A-w and D-t are simultaneousData Data
Data transferred
DataData
DataDataData
Ack
D
x
w
w
A
AData
Ackw
Ackw A
DataA
Ackw
DataData
Data
Data
A
Ackt
DataD
Ackt
DataD
Data
Ackw A
Data
Ackt D
Data
Ackt D
t0 time t1
wA
xD
wA
xD
When A-w1 and D-t1 are not simultaneous (all devices are in one collision domain)
Data
DataData
DataAck
w1Data
AData
Ack
DataD
Data
Ackt1 t1 t1D
Data
Ackw1 A
Data
AckD
t0 time t1
58 | Infrastructure Optimizations for HD WLANs High-Density Wireless Networks for Auditoriums VRD | Solution Guide
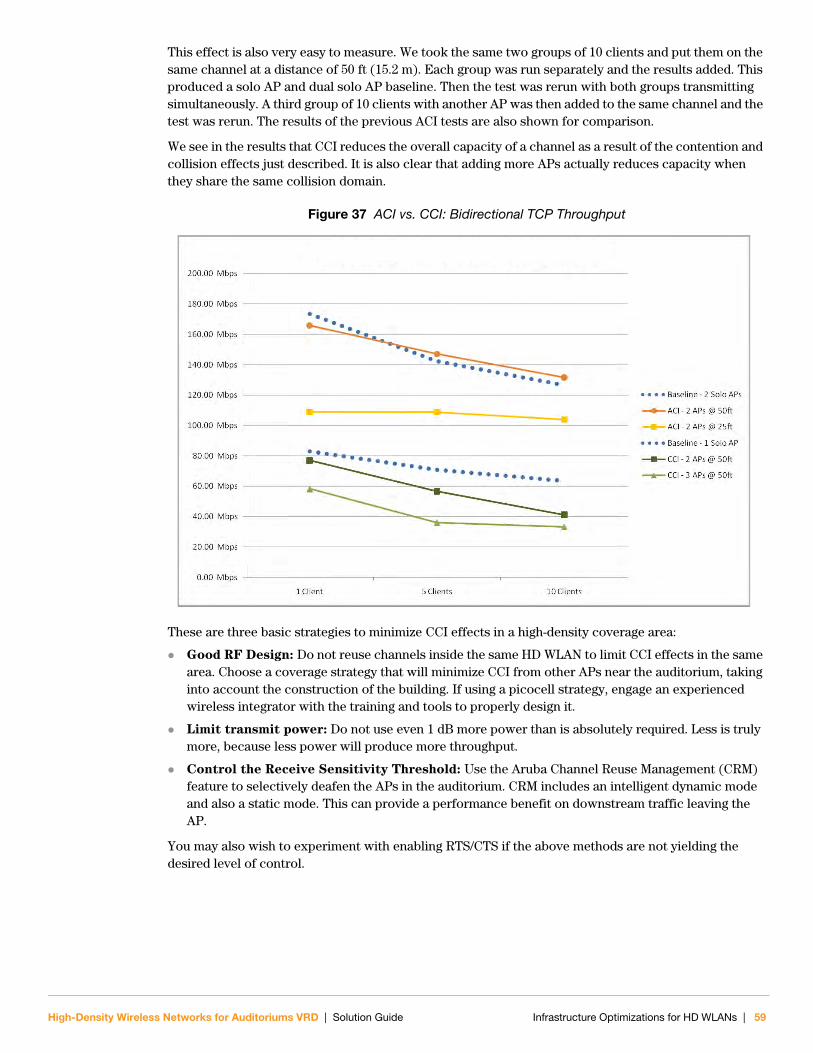
This effect is also very easy to measure. We took the same two groups of 10 clients and put them on the same channel at a distance of 50 ft (15.2 m). Each group was run separately and the results added. This produced a solo AP and dual solo AP baseline. Then the test was rerun with both groups transmitting simultaneously. A third group of 10 clients with another AP was then added to the same channel and the test was rerun. The results of the previous ACI tests are also shown for comparison.
We see in the results that CCI reduces the overall capacity of a channel as a result of the contention and collision effects just described. It is also clear that adding more APs actually reduces capacity when they share the same collision domain.
Figure 37 ACI vs. CCI: Bidirectional TCP Throughput
These are three basic strategies to minimize CCI effects in a high-density coverage area:
Good RF Design: Do not reuse channels inside the same HD WLAN to limit CCI effects in the same area. Choose a coverage strategy that will minimize CCI from other APs near the auditorium, taking into account the construction of the building. If using a picocell strategy, engage an experienced wireless integrator with the training and tools to properly design it.
Limit transmit power: Do not use even 1 dB more power than is absolutely required. Less is truly more, because less power will produce more throughput.
Control the Receive Sensitivity Threshold: Use the Aruba Channel Reuse Management (CRM) feature to selectively deafen the APs in the auditorium. CRM includes an intelligent dynamic mode and also a static mode. This can provide a performance benefit on downstream traffic leaving the AP.
You may also wish to experiment with enabling RTS/CTS if the above methods are not yielding the desired level of control.
High-Density Wireless Networks for Auditoriums VRD | Solution Guide Infrastructure Optimizations for HD WLANs | 59
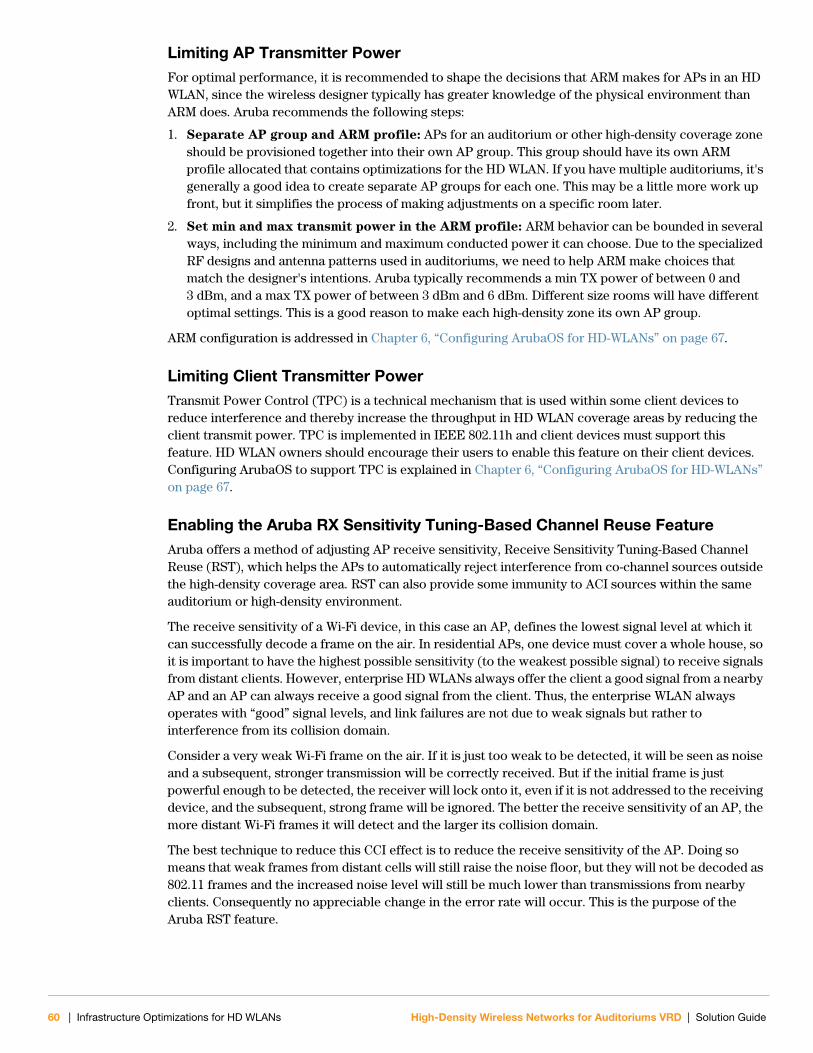
Limiting AP Transmitter PowerFor optimal performance, it is recommended to shape the decisions that ARM makes for APs in an HD WLAN, since the wireless designer typically has greater knowledge of the physical environment than ARM does. Aruba recommends the following steps:
1. Separate AP group and ARM profile: APs for an auditorium or other high-density coverage zone should be provisioned together into their own AP group. This group should have its own ARM profile allocated that contains optimizations for the HD WLAN. If you have multiple auditoriums, it's generally a good idea to create separate AP groups for each one. This may be a little more work up front, but it simplifies the process of making adjustments on a specific room later.
2. Set min and max transmit power in the ARM profile: ARM behavior can be bounded in several ways, including the minimum and maximum conducted power it can choose. Due to the specialized RF designs and antenna patterns used in auditoriums, we need to help ARM make choices that match the designer's intentions. Aruba typically recommends a min TX power of between 0 and 3 dBm, and a max TX power of between 3 dBm and 6 dBm. Different size rooms will have different optimal settings. This is a good reason to make each high-density zone its own AP group.
ARM configuration is addressed in Chapter 6, “Configuring ArubaOS for HD-WLANs” on page 67.
Limiting Client Transmitter PowerTransmit Power Control (TPC) is a technical mechanism that is used within some client devices to reduce interference and thereby increase the throughput in HD WLAN coverage areas by reducing the client transmit power. TPC is implemented in IEEE 802.11h and client devices must support this feature. HD WLAN owners should encourage their users to enable this feature on their client devices. Configuring ArubaOS to support TPC is explained in Chapter 6, “Configuring ArubaOS for HD-WLANs” on page 67.
Enabling the Aruba RX Sensitivity Tuning-Based Channel Reuse FeatureAruba offers a method of adjusting AP receive sensitivity, Receive Sensitivity Tuning-Based Channel Reuse (RST), which helps the APs to automatically reject interference from co-channel sources outside the high-density coverage area. RST can also provide some immunity to ACI sources within the same auditorium or high-density environment.
The receive sensitivity of a Wi-Fi device, in this case an AP, defines the lowest signal level at which it can successfully decode a frame on the air. In residential APs, one device must cover a whole house, so it is important to have the highest possible sensitivity (to the weakest possible signal) to receive signals from distant clients. However, enterprise HD WLANs always offer the client a good signal from a nearby AP and an AP can always receive a good signal from the client. Thus, the enterprise WLAN always operates with “good” signal levels, and link failures are not due to weak signals but rather to interference from its collision domain.
Consider a very weak Wi-Fi frame on the air. If it is just too weak to be detected, it will be seen as noise and a subsequent, stronger transmission will be correctly received. But if the initial frame is just powerful enough to be detected, the receiver will lock onto it, even if it is not addressed to the receiving device, and the subsequent, strong frame will be ignored. The better the receive sensitivity of an AP, the more distant Wi-Fi frames it will detect and the larger its collision domain.
The best technique to reduce this CCI effect is to reduce the receive sensitivity of the AP. Doing so means that weak frames from distant cells will still raise the noise floor, but they will not be decoded as 802.11 frames and the increased noise level will still be much lower than transmissions from nearby clients. Consequently no appreciable change in the error rate will occur. This is the purpose of the Aruba RST feature.
60 | Infrastructure Optimizations for HD WLANs High-Density Wireless Networks for Auditoriums VRD | Solution Guide
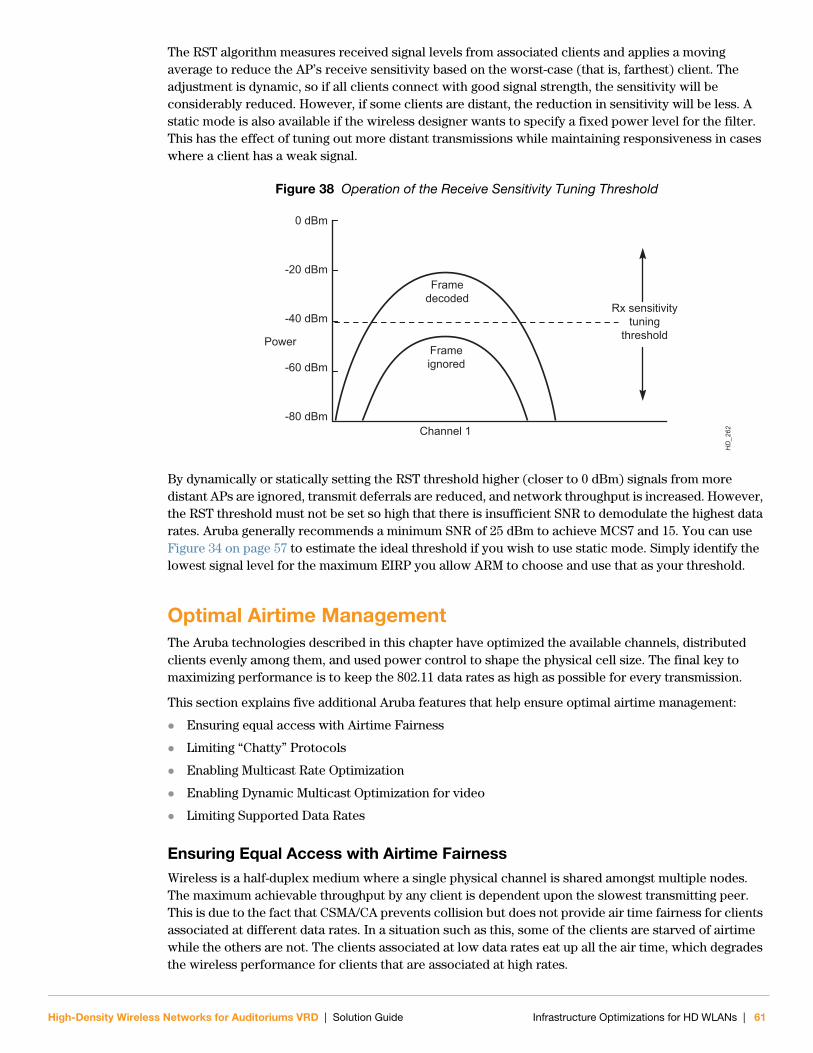
The RST algorithm measures received signal levels from associated clients and applies a moving average to reduce the AP’s receive sensitivity based on the worst-case (that is, farthest) client. The adjustment is dynamic, so if all clients connect with good signal strength, the sensitivity will be considerably reduced. However, if some clients are distant, the reduction in sensitivity will be less. A static mode is also available if the wireless designer wants to specify a fixed power level for the filter. This has the effect of tuning out more distant transmissions while maintaining responsiveness in cases where a client has a weak signal.
Figure 38 Operation of the Receive Sensitivity Tuning Threshold
By dynamically or statically setting the RST threshold higher (closer to 0 dBm) signals from more distant APs are ignored, transmit deferrals are reduced, and network throughput is increased. However, the RST threshold must not be set so high that there is insufficient SNR to demodulate the highest data rates. Aruba generally recommends a minimum SNR of 25 dBm to achieve MCS7 and 15. You can use Figure 34 on page 57 to estimate the ideal threshold if you wish to use static mode. Simply identify the lowest signal level for the maximum EIRP you allow ARM to choose and use that as your threshold.
Optimal Airtime ManagementThe Aruba technologies described in this chapter have optimized the available channels, distributed clients evenly among them, and used power control to shape the physical cell size. The final key to maximizing performance is to keep the 802.11 data rates as high as possible for every transmission.
This section explains five additional Aruba features that help ensure optimal airtime management:
Ensuring equal access with Airtime Fairness
Limiting “Chatty” Protocols
Enabling Multicast Rate Optimization
Enabling Dynamic Multicast Optimization for video
Limiting Supported Data Rates
Ensuring Equal Access with Airtime FairnessWireless is a half-duplex medium where a single physical channel is shared amongst multiple nodes. The maximum achievable throughput by any client is dependent upon the slowest transmitting peer. This is due to the fact that CSMA/CA prevents collision but does not provide air time fairness for clients associated at different data rates. In a situation such as this, some of the clients are starved of airtime while the others are not. The clients associated at low data rates eat up all the air time, which degrades the wireless performance for clients that are associated at high rates.
HD
_262
Power
Rx sensitivitytuning
threshold
0 dBm
-40 dBm
-20 dBm
-60 dBm
-80 dBmChannel 1
Framedecoded
Frameignored
High-Density Wireless Networks for Auditoriums VRD | Solution Guide Infrastructure Optimizations for HD WLANs | 61
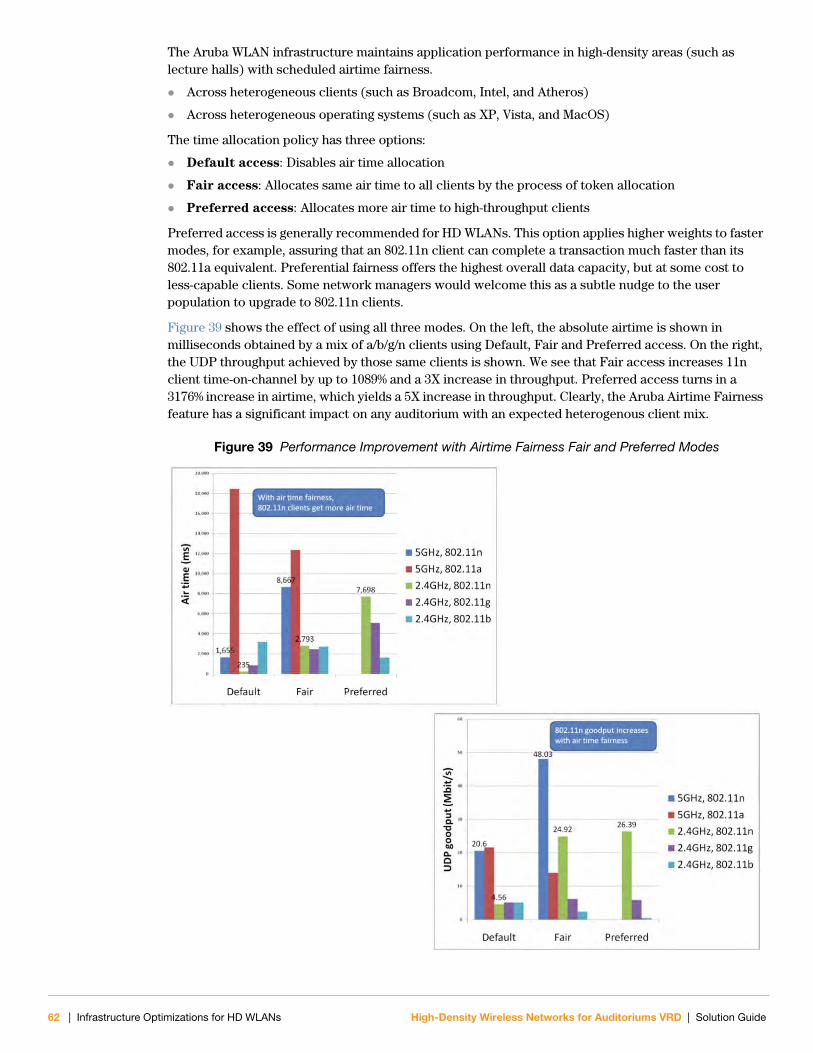
The Aruba WLAN infrastructure maintains application performance in high-density areas (such as lecture halls) with scheduled airtime fairness.
Across heterogeneous clients (such as Broadcom, Intel, and Atheros)
Across heterogeneous operating systems (such as XP, Vista, and MacOS)
The time allocation policy has three options:
Default access: Disables air time allocation
Fair access: Allocates same air time to all clients by the process of token allocation
Preferred access: Allocates more air time to high-throughput clients
Preferred access is generally recommended for HD WLANs. This option applies higher weights to faster modes, for example, assuring that an 802.11n client can complete a transaction much faster than its 802.11a equivalent. Preferential fairness offers the highest overall data capacity, but at some cost to less-capable clients. Some network managers would welcome this as a subtle nudge to the user population to upgrade to 802.11n clients.
Figure 39 shows the effect of using all three modes. On the left, the absolute airtime is shown in milliseconds obtained by a mix of a/b/g/n clients using Default, Fair and Preferred access. On the right, the UDP throughput achieved by those same clients is shown. We see that Fair access increases 11n client time-on-channel by up to 1089% and a 3X increase in throughput. Preferred access turns in a 3176% increase in airtime, which yields a 5X increase in throughput. Clearly, the Aruba Airtime Fairness feature has a significant impact on any auditorium with an expected heterogenous client mix.
Figure 39 Performance Improvement with Airtime Fairness Fair and Preferred Modes
62 | Infrastructure Optimizations for HD WLANs High-Density Wireless Networks for Auditoriums VRD | Solution Guide
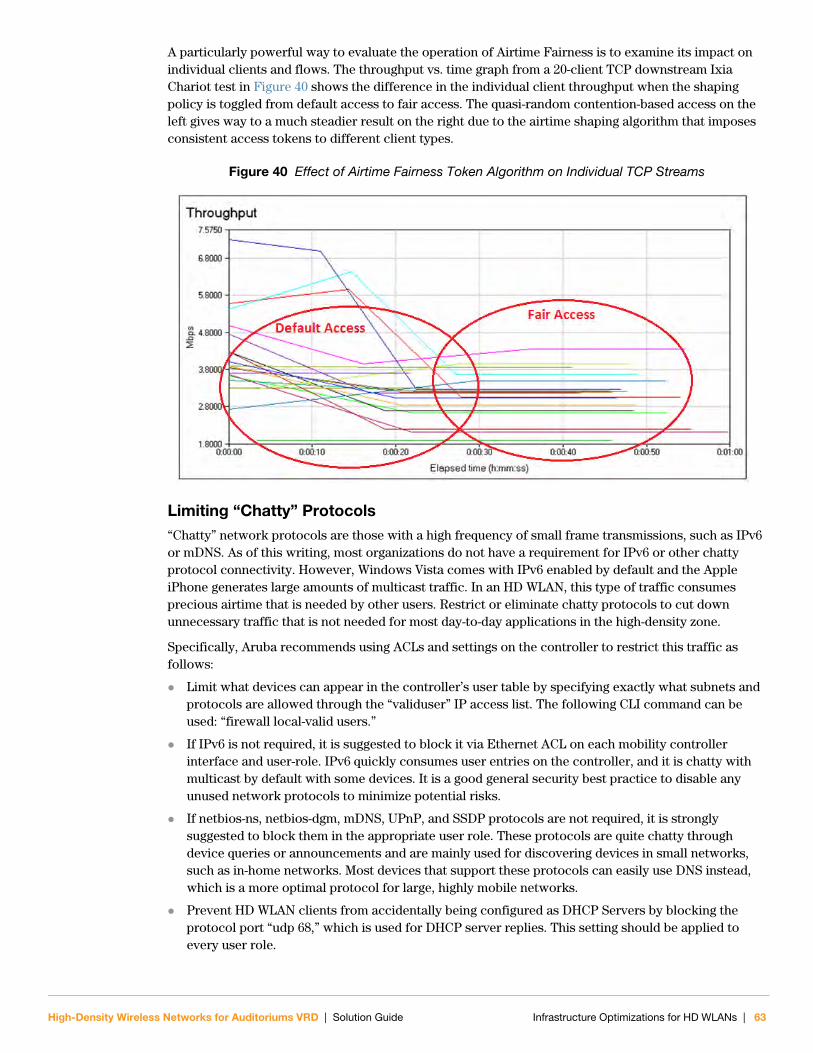
A particularly powerful way to evaluate the operation of Airtime Fairness is to examine its impact on individual clients and flows. The throughput vs. time graph from a 20-client TCP downstream Ixia Chariot test in Figure 40 shows the difference in the individual client throughput when the shaping policy is toggled from default access to fair access. The quasi-random contention-based access on the left gives way to a much steadier result on the right due to the airtime shaping algorithm that imposes consistent access tokens to different client types.
Figure 40 Effect of Airtime Fairness Token Algorithm on Individual TCP Streams
Limiting “Chatty” Protocols“Chatty” network protocols are those with a high frequency of small frame transmissions, such as IPv6 or mDNS. As of this writing, most organizations do not have a requirement for IPv6 or other chatty protocol connectivity. However, Windows Vista comes with IPv6 enabled by default and the Apple iPhone generates large amounts of multicast traffic. In an HD WLAN, this type of traffic consumes precious airtime that is needed by other users. Restrict or eliminate chatty protocols to cut down unnecessary traffic that is not needed for most day-to-day applications in the high-density zone.
Specifically, Aruba recommends using ACLs and settings on the controller to restrict this traffic as follows:
Limit what devices can appear in the controller’s user table by specifying exactly what subnets and protocols are allowed through the “validuser” IP access list. The following CLI command can be used: “firewall local-valid users.”
If IPv6 is not required, it is suggested to block it via Ethernet ACL on each mobility controller interface and user-role. IPv6 quickly consumes user entries on the controller, and it is chatty with multicast by default with some devices. It is a good general security best practice to disable any unused network protocols to minimize potential risks.
If netbios-ns, netbios-dgm, mDNS, UPnP, and SSDP protocols are not required, it is strongly suggested to block them in the appropriate user role. These protocols are quite chatty through device queries or announcements and are mainly used for discovering devices in small networks, such as in-home networks. Most devices that support these protocols can easily use DNS instead, which is a more optimal protocol for large, highly mobile networks.
Prevent HD WLAN clients from accidentally being configured as DHCP Servers by blocking the protocol port “udp 68,” which is used for DHCP server replies. This setting should be applied to every user role.
High-Density Wireless Networks for Auditoriums VRD | Solution Guide Infrastructure Optimizations for HD WLANs | 63
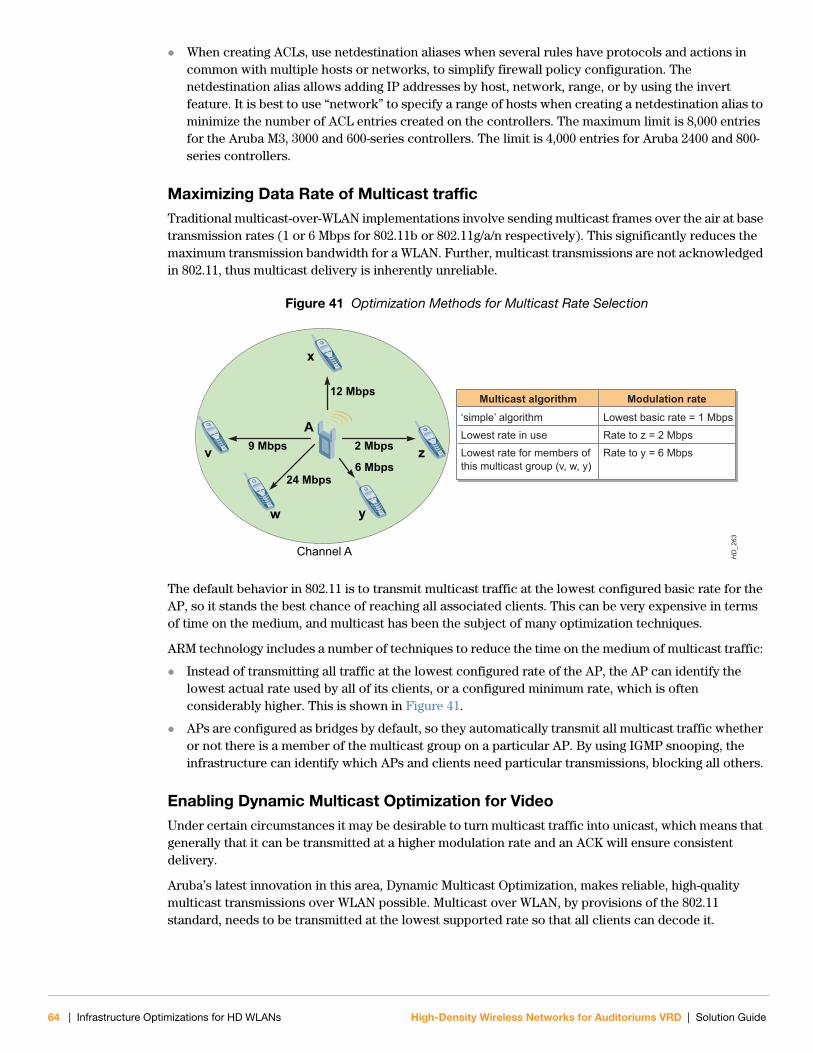
When creating ACLs, use netdestination aliases when several rules have protocols and actions in common with multiple hosts or networks, to simplify firewall policy configuration. The netdestination alias allows adding IP addresses by host, network, range, or by using the invert feature. It is best to use “network” to specify a range of hosts when creating a netdestination alias to minimize the number of ACL entries created on the controllers. The maximum limit is 8,000 entries for the Aruba M3, 3000 and 600-series controllers. The limit is 4,000 entries for Aruba 2400 and 800-series controllers.
Maximizing Data Rate of Multicast trafficTraditional multicast-over-WLAN implementations involve sending multicast frames over the air at base transmission rates (1 or 6 Mbps for 802.11b or 802.11g/a/n respectively). This significantly reduces the maximum transmission bandwidth for a WLAN. Further, multicast transmissions are not acknowledged in 802.11, thus multicast delivery is inherently unreliable.
Figure 41 Optimization Methods for Multicast Rate Selection
The default behavior in 802.11 is to transmit multicast traffic at the lowest configured basic rate for the AP, so it stands the best chance of reaching all associated clients. This can be very expensive in terms of time on the medium, and multicast has been the subject of many optimization techniques.
ARM technology includes a number of techniques to reduce the time on the medium of multicast traffic:
Instead of transmitting all traffic at the lowest configured rate of the AP, the AP can identify the lowest actual rate used by all of its clients, or a configured minimum rate, which is often considerably higher. This is shown in Figure 41.
APs are configured as bridges by default, so they automatically transmit all multicast traffic whether or not there is a member of the multicast group on a particular AP. By using IGMP snooping, the infrastructure can identify which APs and clients need particular transmissions, blocking all others.
Enabling Dynamic Multicast Optimization for VideoUnder certain circumstances it may be desirable to turn multicast traffic into unicast, which means that generally that it can be transmitted at a higher modulation rate and an ACK will ensure consistent delivery.
Aruba’s latest innovation in this area, Dynamic Multicast Optimization, makes reliable, high-quality multicast transmissions over WLAN possible. Multicast over WLAN, by provisions of the 802.11 standard, needs to be transmitted at the lowest supported rate so that all clients can decode it.
HD
_263
Multicast algorithm Modulation rate‘simple’ algorithm
Optimizing Multicast Modulation Rates
Lowest basic rate = 1 Mbps
Lowest rate in use Rate to z = 2 Mbps
Lowest rate for members ofthis multicast group (v, w, y)
Rate to y = 6 Mbps
x
w
v z
y
12 Mbps
2 Mbps9 Mbps
24 Mbps6 Mbps
Channel A
A
64 | Infrastructure Optimizations for HD WLANs High-Density Wireless Networks for Auditoriums VRD | Solution Guide
The Aruba solution tackles the multicast reliability problem on multiple fronts:
IGMP Snooping ensures that the wired infrastructure sends video traffic only to those APs that have subscribers.
DMO sends multicast traffic as unicast traffic, which can be transmitted at much higher speeds and has an acknowledgement mechanism ensuring reliable multicast.
Transmission automatically switches back to multicast when the client count increases high enough that the efficiency of unicast is lost.
Multicast-rate-optimization keeps track of the transmit rates sustainable for each associated client and use the lowest common sustainable rate for multicast transmissions.
As a result, reliable high-performance multicast video delivery over a high-density wireless network becomes a reality.
Limiting Supported Legacy Data RatesIt is essential to reduce the number of supported data rates in an HD WLAN to maximize speeds as well as to cut back on derating due to the collision process.
Most if not all users in an auditorium will connect to their nearest AP at the highest data rate supported by their wireless NIC. This is made possible by a clear line of sight to the APs, and the absence of walls or other structures to block signal. At the same time, the high density of users virtually guarantees abnormally high collision rates. In most WLANs, the default behavior when a collision is detected is to try again at a lower data rate. Sometimes, this results in the same frame being tried over and over at progressively slower rates. Aruba has an automatic feature that will intelligently retry at higher rates when packet loss is due to a collision as opposed to a client moving farther away. We can further reduce the number of low-rate retries by limiting the supported rates in the high-density BSS.
Aruba recommends that you enable only the top two data rates for each legacy PHY type:
48 and 54 Mbps for 802.11a/g
5.5 and 11 Mbps for 802.11b
At this time, Aruba does not recommend disabling any MCS rates as it has been observed to cause unpredictable client driver behaviors.
Other Required Infrastructure Settings
VLAN PoolingUse VLAN pools in the virtual AP profile for large networks that require more than one subnet for HD WLAN clients within a specific floor or building. Doing so restricts the size of the broadcast domain, thereby limiting unnecessary traffic.
Keep each VLAN subnet within a VLAN pool to a 24-bit subnet mask.
Do not have more than 10 VLANs within a pool so that broadcast or multicast traffic does not consume too much air time access.
High-Density Wireless Networks for Auditoriums VRD | Solution Guide Infrastructure Optimizations for HD WLANs | 65

66 | Infrastructure Optimizations for HD WLANs High-Density Wireless Networks for Auditoriums VRD | Solution Guide
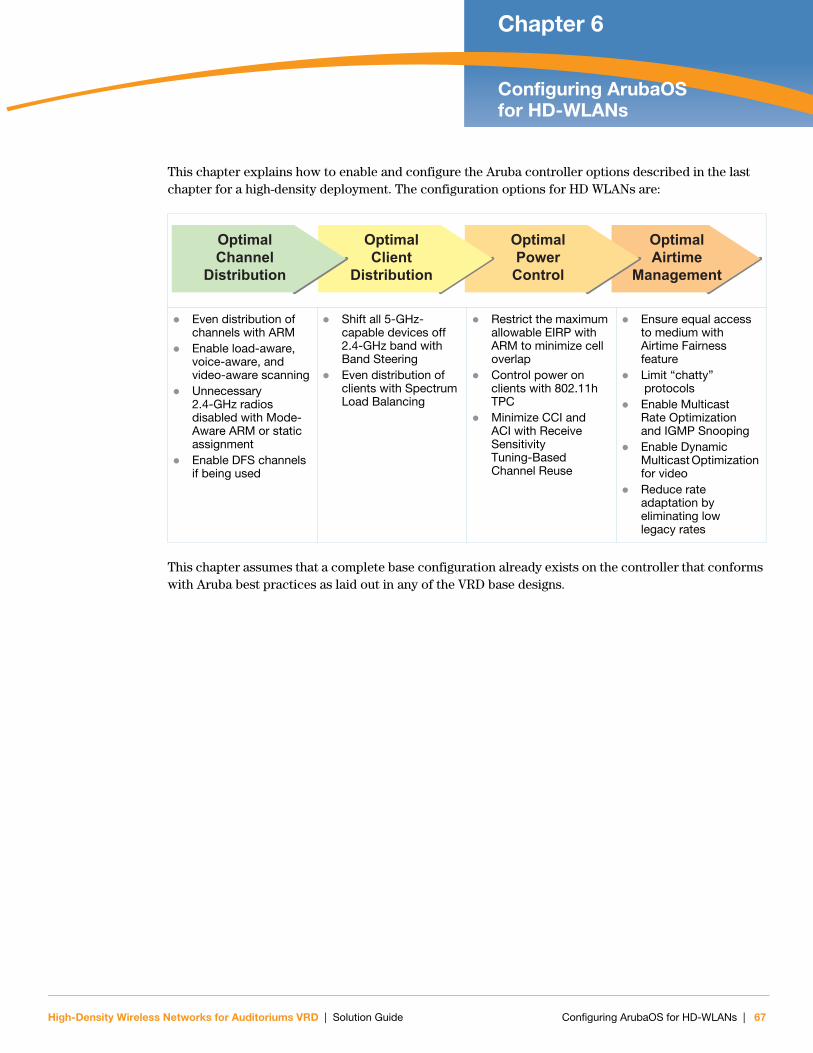
High-Density Wireless Networks for Auditoriums VRD | Solution Guide
Chapter 6Configuring ArubaOS for HD-WLANs
This chapter explains how to enable and configure the Aruba controller options described in the last chapter for a high-density deployment. The configuration options for HD WLANs are:
This chapter assumes that a complete base configuration already exists on the controller that conforms with Aruba best practices as laid out in any of the VRD base designs.
Even distribution of channels with ARM
Enable load-aware, voice-aware, and video-aware scanning
Unnecessary 2.4-GHz radios disabled with Mode-Aware ARM or static assignment
Enable DFS channels if being used
Shift all 5-GHz-capable devices off 2.4-GHz band with Band Steering
Even distribution of clients with Spectrum Load Balancing
Restrict the maximum allowable EIRP with ARM to minimize cell overlap
Control power on clients with 802.11h TPC
Minimize CCI and ACI with Receive Sensitivity Tuning-Based Channel Reuse
Ensure equal access to medium with Airtime Fairness feature
Limit “chatty” protocols
Enable Multicast Rate Optimization and IGMP Snooping
Enable Dynamic Multicast Optimization for video
Reduce rate adaptation by eliminating low legacy rates
OptimalAirtime
Management
OptimalPowerControl
OptimalClient
Distribution
OptimalChannel
Distribution
Configuring ArubaOS for HD-WLANs | 67
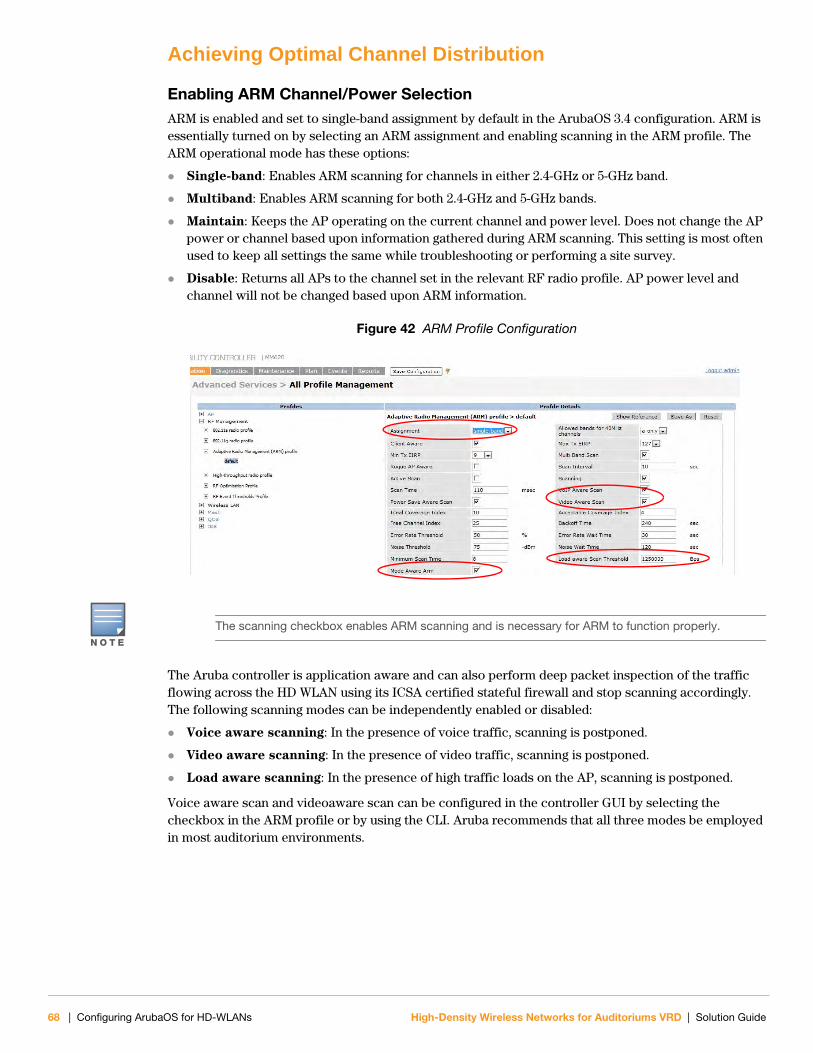
Achieving Optimal Channel Distribution
Enabling ARM Channel/Power Selection ARM is enabled and set to single-band assignment by default in the ArubaOS 3.4 configuration. ARM is essentially turned on by selecting an ARM assignment and enabling scanning in the ARM profile. The ARM operational mode has these options:
Single-band: Enables ARM scanning for channels in either 2.4-GHz or 5-GHz band.
Multiband: Enables ARM scanning for both 2.4-GHz and 5-GHz bands.
Maintain: Keeps the AP operating on the current channel and power level. Does not change the AP power or channel based upon information gathered during ARM scanning. This setting is most often used to keep all settings the same while troubleshooting or performing a site survey.
Disable: Returns all APs to the channel set in the relevant RF radio profile. AP power level and channel will not be changed based upon ARM information.
Figure 42 ARM Profile Configuration
The Aruba controller is application aware and can also perform deep packet inspection of the traffic flowing across the HD WLAN using its ICSA certified stateful firewall and stop scanning accordingly. The following scanning modes can be independently enabled or disabled:
Voice aware scanning: In the presence of voice traffic, scanning is postponed.
Video aware scanning: In the presence of video traffic, scanning is postponed.
Load aware scanning: In the presence of high traffic loads on the AP, scanning is postponed.
Voice aware scan and videoaware scan can be configured in the controller GUI by selecting the checkbox in the ARM profile or by using the CLI. Aruba recommends that all three modes be employed in most auditorium environments.
N O T E
The scanning checkbox enables ARM scanning and is necessary for ARM to function properly.
68 | Configuring ArubaOS for HD-WLANs High-Density Wireless Networks for Auditoriums VRD | Solution Guide
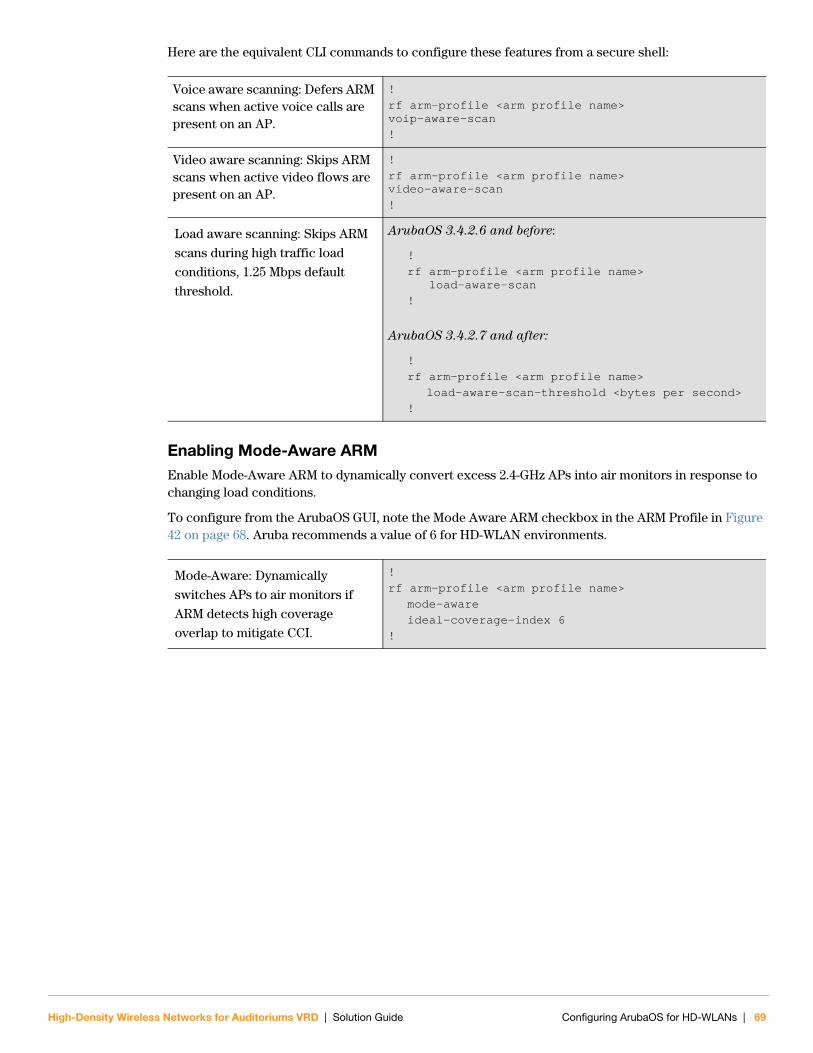
Here are the equivalent CLI commands to configure these features from a secure shell:
Enabling Mode-Aware ARMEnable Mode-Aware ARM to dynamically convert excess 2.4-GHz APs into air monitors in response to changing load conditions.
To configure from the ArubaOS GUI, note the Mode Aware ARM checkbox in the ARM Profile in Figure 42 on page 68. Aruba recommends a value of 6 for HD-WLAN environments.
Voice aware scanning: Defers ARM scans when active voice calls are present on an AP.
!
rf arm-profile <arm profile name> voip-aware-scan
!
Video aware scanning: Skips ARM scans when active video flows are present on an AP.
!
rf arm-profile <arm profile name> video-aware-scan
!
Load aware scanning: Skips ARM
scans during high traffic load
conditions, 1.25 Mbps default
threshold.
ArubaOS 3.4.2.6 and before:
!
rf arm-profile <arm profile name> load-aware-scan
!
ArubaOS 3.4.2.7 and after:
!
rf arm-profile <arm profile name>
load-aware-scan-threshold <bytes per second>
!
Mode-Aware: Dynamically
switches APs to air monitors if
ARM detects high coverage
overlap to mitigate CCI.
!
rf arm-profile <arm profile name>
mode-aware
ideal-coverage-index 6
!
High-Density Wireless Networks for Auditoriums VRD | Solution Guide Configuring ArubaOS for HD-WLANs | 69

Enabling DFS ChannelsDFS channels are disabled by default. If needed for your HD WLAN, they can be enabled in the Regulatory Domain profile for the AP group in the controller GUI. After the Country has been selected, use the check boxes to select or deselect the applicable channels for DFS operation in the designated country. For a list of all DFS channels, please see Table 2 on page 21.
Figure 43 Valid Channel Selection in the Regulatory Domain Profile
DFS channels can be also be enabled or disabled via the following CLI commands:
!
ap regulatory-domain-profile default
valid-11a-channel <20mhz channel number>
valid-11a-40mhz-channel-pair <40mhz channel pair>no valid-11a-channel <20mhz channel number>
no valid-11a-40mhz-channel-pair <40mhz channel pair>
!
70 | Configuring ArubaOS for HD-WLANs High-Density Wireless Networks for Auditoriums VRD | Solution Guide
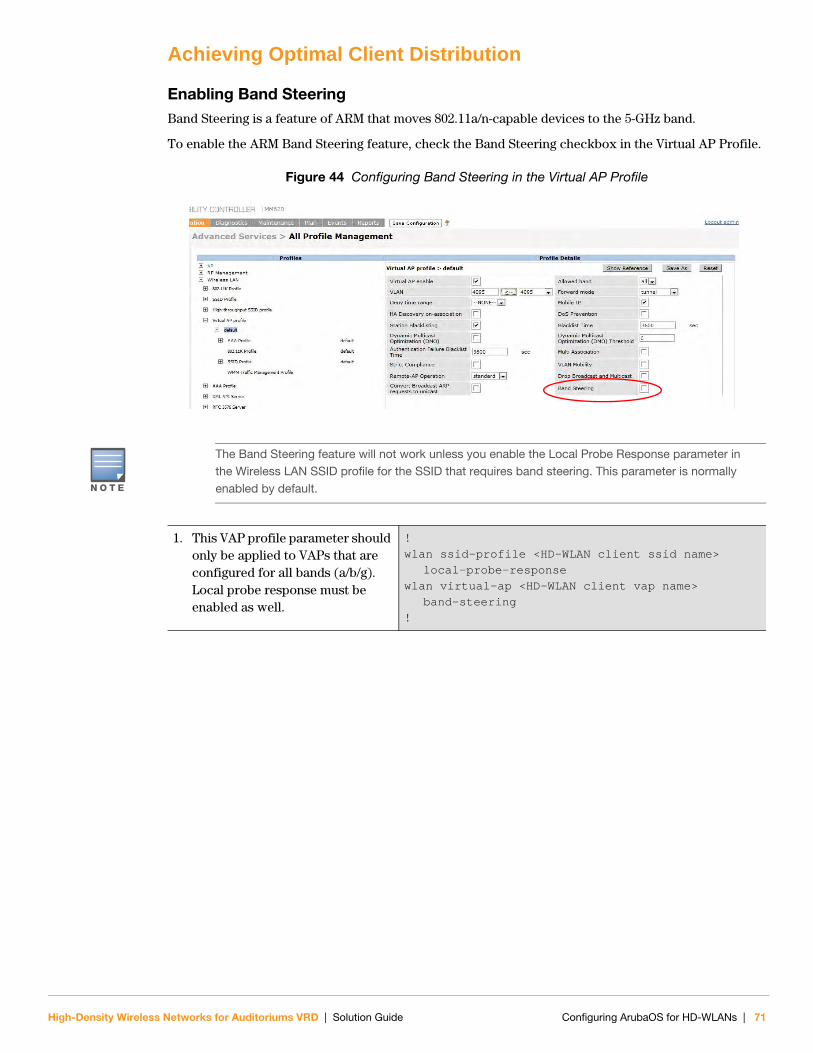
Achieving Optimal Client Distribution
Enabling Band SteeringBand Steering is a feature of ARM that moves 802.11a/n-capable devices to the 5-GHz band.
To enable the ARM Band Steering feature, check the Band Steering checkbox in the Virtual AP Profile.
Figure 44 Configuring Band Steering in the Virtual AP Profile
N O T E
The Band Steering feature will not work unless you enable the Local Probe Response parameter in the Wireless LAN SSID profile for the SSID that requires band steering. This parameter is normally enabled by default.
1. This VAP profile parameter should only be applied to VAPs that are configured for all bands (a/b/g). Local probe response must be enabled as well.
!
wlan ssid-profile <HD-WLAN client ssid name>
local-probe-response
wlan virtual-ap <HD-WLAN client vap name>
band-steering
!
High-Density Wireless Networks for Auditoriums VRD | Solution Guide Configuring ArubaOS for HD-WLANs | 71
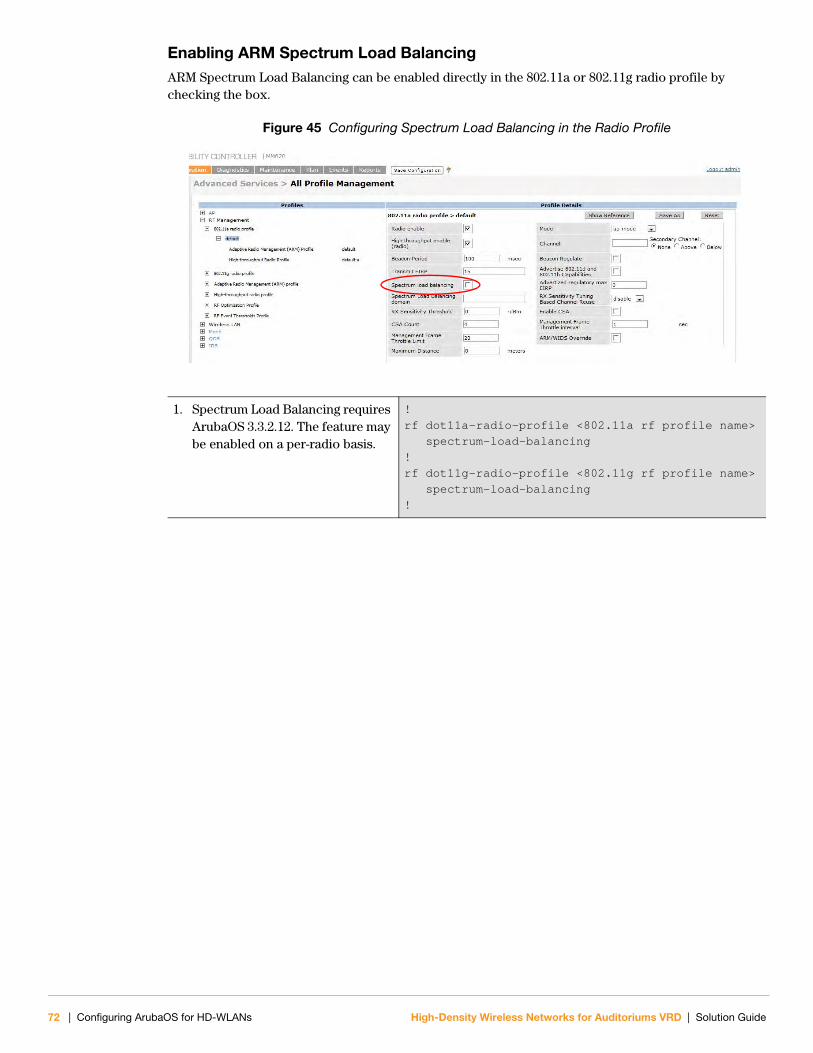
Enabling ARM Spectrum Load BalancingARM Spectrum Load Balancing can be enabled directly in the 802.11a or 802.11g radio profile by checking the box.
Figure 45 Configuring Spectrum Load Balancing in the Radio Profile
1. Spectrum Load Balancing requires ArubaOS 3.3.2.12. The feature may be enabled on a per-radio basis.
!
rf dot11a-radio-profile <802.11a rf profile name>
spectrum-load-balancing
!
rf dot11g-radio-profile <802.11g rf profile name>
spectrum-load-balancing
!
72 | Configuring ArubaOS for HD-WLANs High-Density Wireless Networks for Auditoriums VRD | Solution Guide
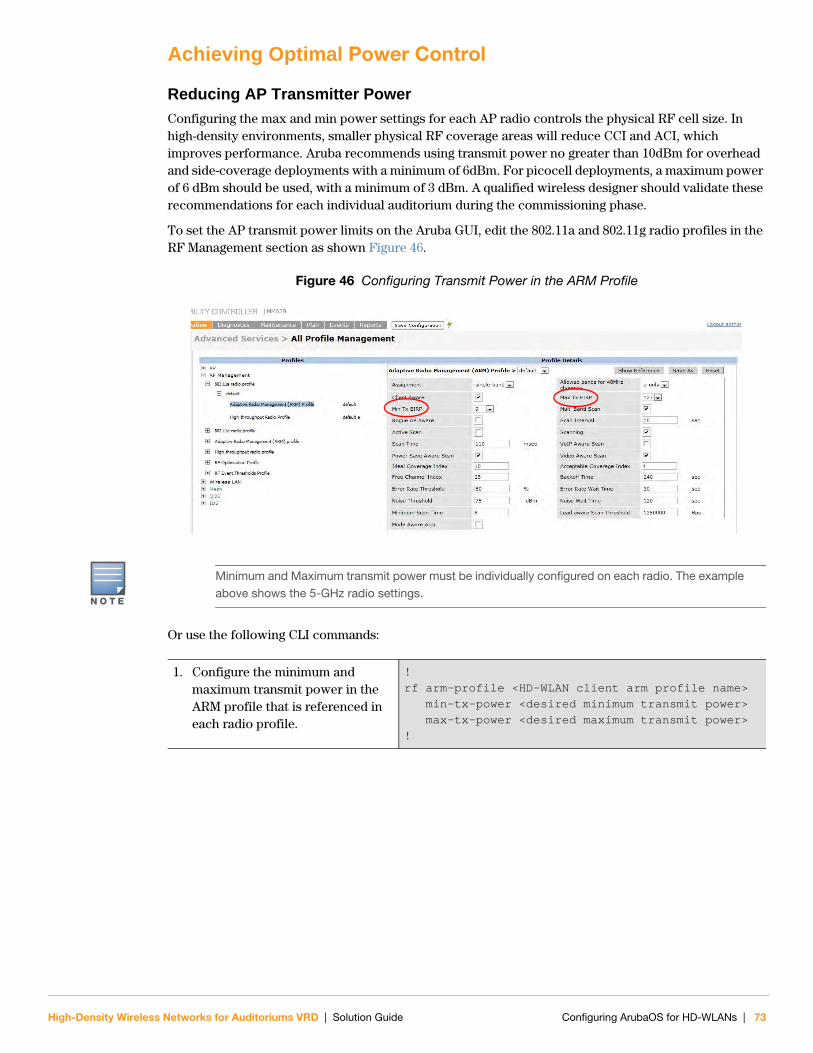
Achieving Optimal Power Control
Reducing AP Transmitter Power
Configuring the max and min power settings for each AP radio controls the physical RF cell size. In high-density environments, smaller physical RF coverage areas will reduce CCI and ACI, which improves performance. Aruba recommends using transmit power no greater than 10dBm for overhead and side-coverage deployments with a minimum of 6dBm. For picocell deployments, a maximum power of 6 dBm should be used, with a minimum of 3 dBm. A qualified wireless designer should validate these recommendations for each individual auditorium during the commissioning phase.
To set the AP transmit power limits on the Aruba GUI, edit the 802.11a and 802.11g radio profiles in the RF Management section as shown Figure 46.
Figure 46 Configuring Transmit Power in the ARM Profile
Or use the following CLI commands:
N O T E
Minimum and Maximum transmit power must be individually configured on each radio. The example above shows the 5-GHz radio settings.
1. Configure the minimum and maximum transmit power in the ARM profile that is referenced in each radio profile.
!
rf arm-profile <HD-WLAN client arm profile name>
min-tx-power <desired minimum transmit power>
max-tx-power <desired maximum transmit power>
!
High-Density Wireless Networks for Auditoriums VRD | Solution Guide Configuring ArubaOS for HD-WLANs | 73
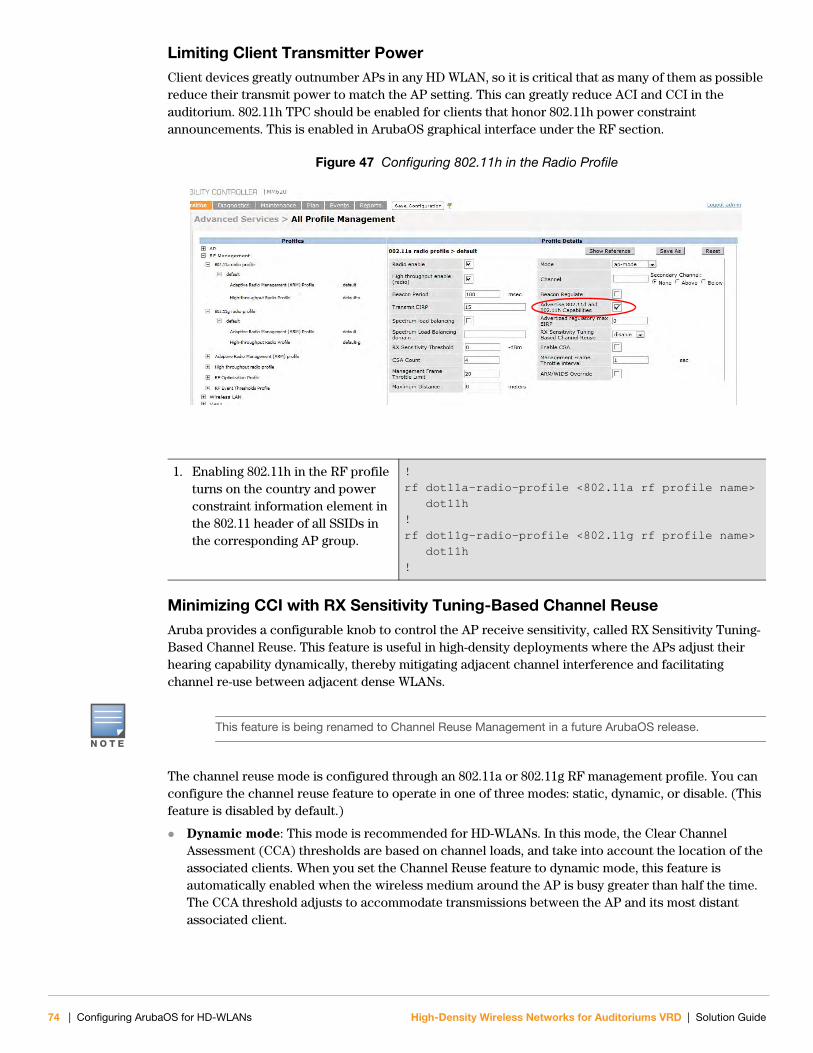
Limiting Client Transmitter PowerClient devices greatly outnumber APs in any HD WLAN, so it is critical that as many of them as possible reduce their transmit power to match the AP setting. This can greatly reduce ACI and CCI in the auditorium. 802.11h TPC should be enabled for clients that honor 802.11h power constraint announcements. This is enabled in ArubaOS graphical interface under the RF section.
Figure 47 Configuring 802.11h in the Radio Profile
Minimizing CCI with RX Sensitivity Tuning-Based Channel ReuseAruba provides a configurable knob to control the AP receive sensitivity, called RX Sensitivity Tuning-Based Channel Reuse. This feature is useful in high-density deployments where the APs adjust their hearing capability dynamically, thereby mitigating adjacent channel interference and facilitating channel re-use between adjacent dense WLANs.
The channel reuse mode is configured through an 802.11a or 802.11g RF management profile. You can configure the channel reuse feature to operate in one of three modes: static, dynamic, or disable. (This feature is disabled by default.)
Dynamic mode: This mode is recommended for HD-WLANs. In this mode, the Clear Channel Assessment (CCA) thresholds are based on channel loads, and take into account the location of the associated clients. When you set the Channel Reuse feature to dynamic mode, this feature is automatically enabled when the wireless medium around the AP is busy greater than half the time. The CCA threshold adjusts to accommodate transmissions between the AP and its most distant associated client.
1. Enabling 802.11h in the RF profile turns on the country and power constraint information element in the 802.11 header of all SSIDs in the corresponding AP group.
!
rf dot11a-radio-profile <802.11a rf profile name>
dot11h
!
rf dot11g-radio-profile <802.11g rf profile name>
dot11h
!
N O T E
This feature is being renamed to Channel Reuse Management in a future ArubaOS release.
74 | Configuring ArubaOS for HD-WLANs High-Density Wireless Networks for Auditoriums VRD | Solution Guide
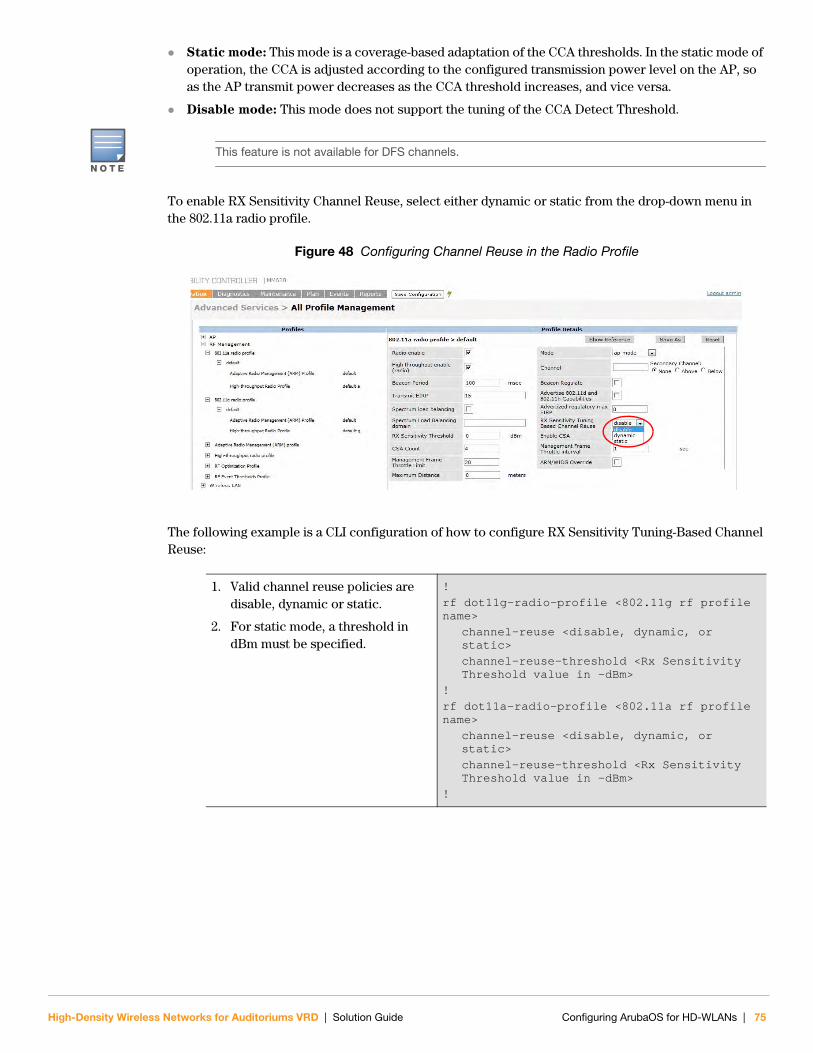
Static mode: This mode is a coverage-based adaptation of the CCA thresholds. In the static mode of operation, the CCA is adjusted according to the configured transmission power level on the AP, so as the AP transmit power decreases as the CCA threshold increases, and vice versa.
Disable mode: This mode does not support the tuning of the CCA Detect Threshold.
To enable RX Sensitivity Channel Reuse, select either dynamic or static from the drop-down menu in the 802.11a radio profile.
Figure 48 Configuring Channel Reuse in the Radio Profile
The following example is a CLI configuration of how to configure RX Sensitivity Tuning-Based Channel Reuse:
N O T E
This feature is not available for DFS channels.
1. Valid channel reuse policies are disable, dynamic or static.
2. For static mode, a threshold in dBm must be specified.
!
rf dot11g-radio-profile <802.11g rf profile name>
channel-reuse <disable, dynamic, or static>
channel-reuse-threshold <Rx Sensitivity Threshold value in -dBm>
!
rf dot11a-radio-profile <802.11a rf profile name>
channel-reuse <disable, dynamic, or static>
channel-reuse-threshold <Rx Sensitivity Threshold value in -dBm>
!
High-Density Wireless Networks for Auditoriums VRD | Solution Guide Configuring ArubaOS for HD-WLANs | 75
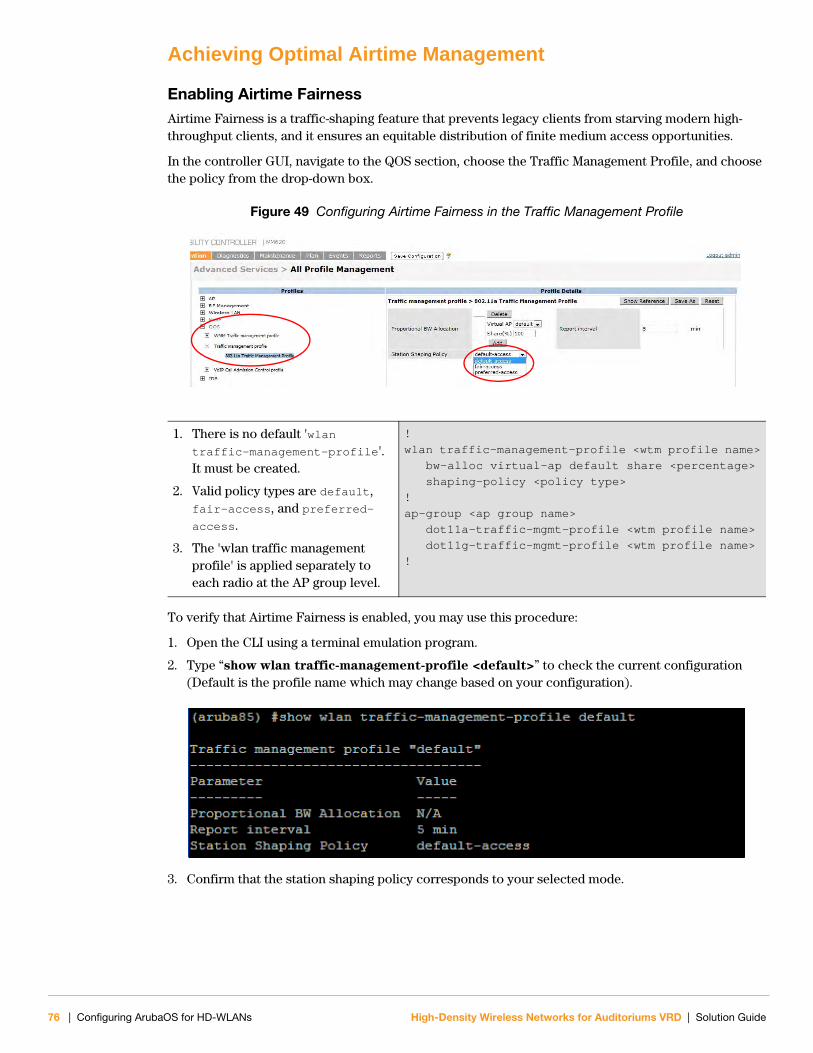
Achieving Optimal Airtime Management
Enabling Airtime FairnessAirtime Fairness is a traffic-shaping feature that prevents legacy clients from starving modern high-throughput clients, and it ensures an equitable distribution of finite medium access opportunities.
In the controller GUI, navigate to the QOS section, choose the Traffic Management Profile, and choose the policy from the drop-down box.
Figure 49 Configuring Airtime Fairness in the Traffic Management Profile
To verify that Airtime Fairness is enabled, you may use this procedure:
1. Open the CLI using a terminal emulation program.
2. Type “show wlan traffic-management-profile <default>” to check the current configuration (Default is the profile name which may change based on your configuration).
3. Confirm that the station shaping policy corresponds to your selected mode.
1. There is no default 'wlan traffic-management-profile'. It must be created.
2. Valid policy types are default, fair-access, and preferred-access.
3. The 'wlan traffic management profile' is applied separately to each radio at the AP group level.
!
wlan traffic-management-profile <wtm profile name>
bw-alloc virtual-ap default share <percentage>
shaping-policy <policy type>
!
ap-group <ap group name>
dot11a-traffic-mgmt-profile <wtm profile name>
dot11g-traffic-mgmt-profile <wtm profile name>
!
76 | Configuring ArubaOS for HD-WLANs High-Density Wireless Networks for Auditoriums VRD | Solution Guide
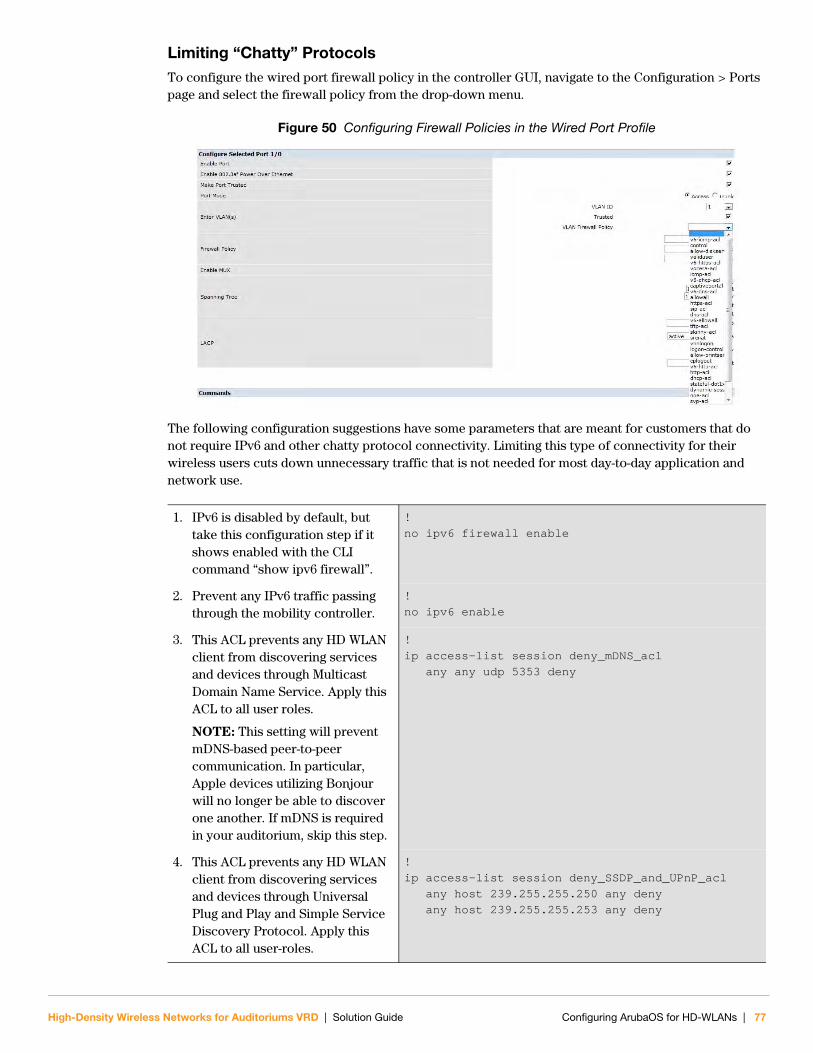
Limiting “Chatty” ProtocolsTo configure the wired port firewall policy in the controller GUI, navigate to the Configuration > Ports page and select the firewall policy from the drop-down menu.
Figure 50 Configuring Firewall Policies in the Wired Port Profile
The following configuration suggestions have some parameters that are meant for customers that do not require IPv6 and other chatty protocol connectivity. Limiting this type of connectivity for their wireless users cuts down unnecessary traffic that is not needed for most day-to-day application and network use.
1. IPv6 is disabled by default, but take this configuration step if it shows enabled with the CLI command “show ipv6 firewall”.
!
no ipv6 firewall enable
2. Prevent any IPv6 traffic passing through the mobility controller.
!
no ipv6 enable
3. This ACL prevents any HD WLAN client from discovering services and devices through Multicast Domain Name Service. Apply this ACL to all user roles.
NOTE: This setting will prevent mDNS-based peer-to-peer communication. In particular, Apple devices utilizing Bonjour will no longer be able to discover one another. If mDNS is required in your auditorium, skip this step.
!
ip access-list session deny_mDNS_acl
any any udp 5353 deny
4. This ACL prevents any HD WLAN client from discovering services and devices through Universal Plug and Play and Simple Service Discovery Protocol. Apply this ACL to all user-roles.
!
ip access-list session deny_SSDP_and_UPnP_acl
any host 239.255.255.250 any deny
any host 239.255.255.253 any deny
High-Density Wireless Networks for Auditoriums VRD | Solution Guide Configuring ArubaOS for HD-WLANs | 77
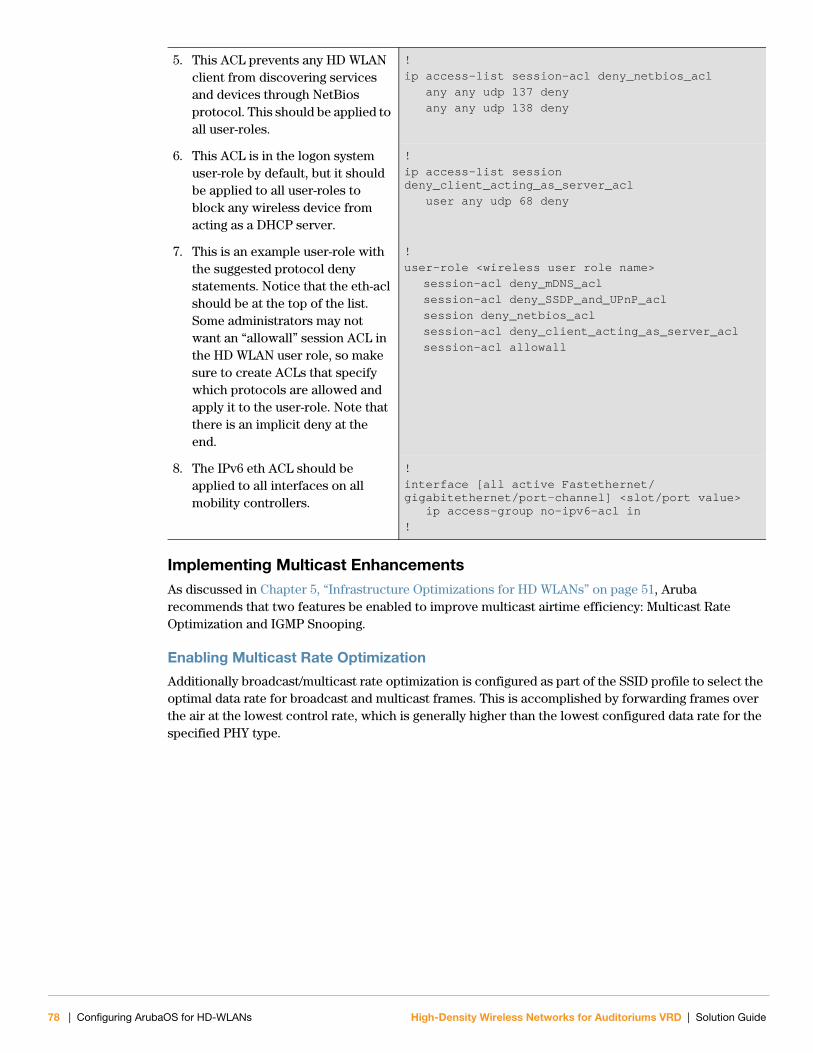
Implementing Multicast EnhancementsAs discussed in Chapter 5, “Infrastructure Optimizations for HD WLANs” on page 51, Aruba recommends that two features be enabled to improve multicast airtime efficiency: Multicast Rate Optimization and IGMP Snooping.
Enabling Multicast Rate Optimization
Additionally broadcast/multicast rate optimization is configured as part of the SSID profile to select the optimal data rate for broadcast and multicast frames. This is accomplished by forwarding frames over the air at the lowest control rate, which is generally higher than the lowest configured data rate for the specified PHY type.
5. This ACL prevents any HD WLAN client from discovering services and devices through NetBios protocol. This should be applied to all user-roles.
!
ip access-list session-acl deny_netbios_acl
any any udp 137 deny
any any udp 138 deny
6. This ACL is in the logon system user-role by default, but it should be applied to all user-roles to block any wireless device from acting as a DHCP server.
!
ip access-list session deny_client_acting_as_server_acl
user any udp 68 deny
7. This is an example user-role with the suggested protocol deny statements. Notice that the eth-acl should be at the top of the list. Some administrators may not want an “allowall” session ACL in the HD WLAN user role, so make sure to create ACLs that specify which protocols are allowed and apply it to the user-role. Note that there is an implicit deny at the end.
!
user-role <wireless user role name>
session-acl deny_mDNS_acl
session-acl deny_SSDP_and_UPnP_acl
session deny_netbios_acl
session-acl deny_client_acting_as_server_acl
session-acl allowall
8. The IPv6 eth ACL should be applied to all interfaces on all mobility controllers.
!
interface [all active Fastethernet/gigabitethernet/port-channel] <slot/port value> ip access-group no-ipv6-acl in
!
78 | Configuring ArubaOS for HD-WLANs High-Density Wireless Networks for Auditoriums VRD | Solution Guide
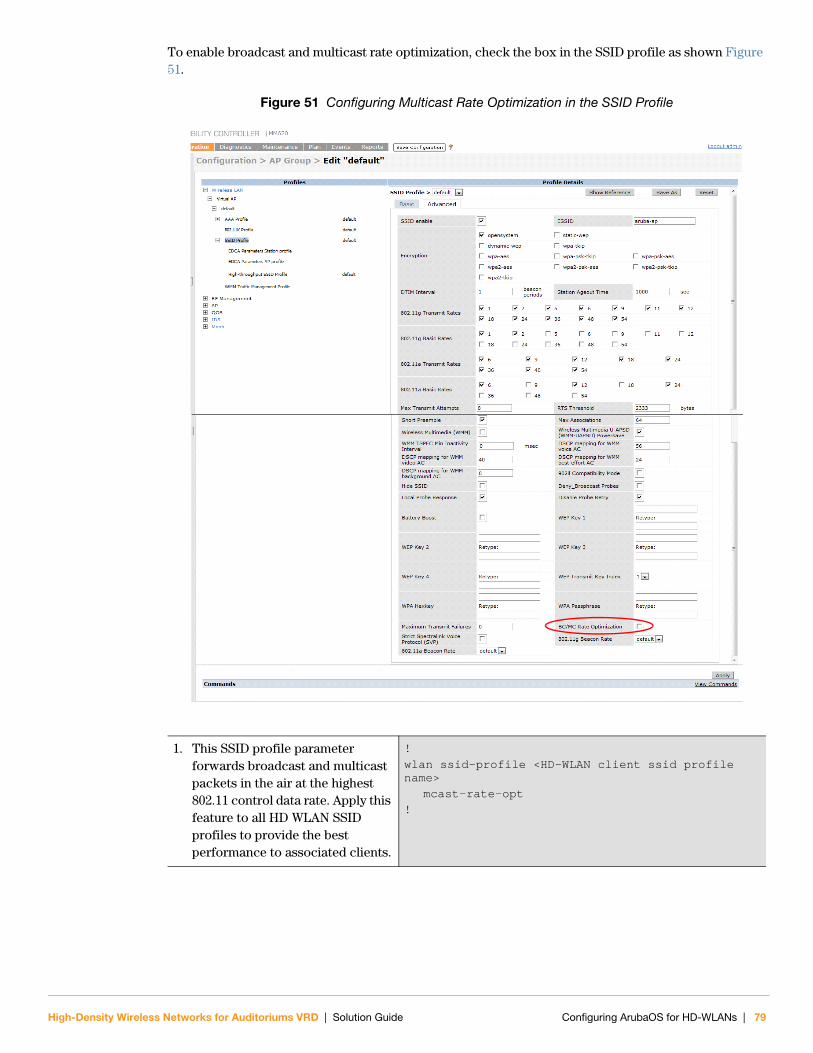
To enable broadcast and multicast rate optimization, check the box in the SSID profile as shown Figure 51.
Figure 51 Configuring Multicast Rate Optimization in the SSID Profile
1. This SSID profile parameter forwards broadcast and multicast packets in the air at the highest 802.11 control data rate. Apply this feature to all HD WLAN SSID profiles to provide the best performance to associated clients.
!
wlan ssid-profile <HD-WLAN client ssid profile name>
mcast-rate-opt
!
High-Density Wireless Networks for Auditoriums VRD | Solution Guide Configuring ArubaOS for HD-WLANs | 79
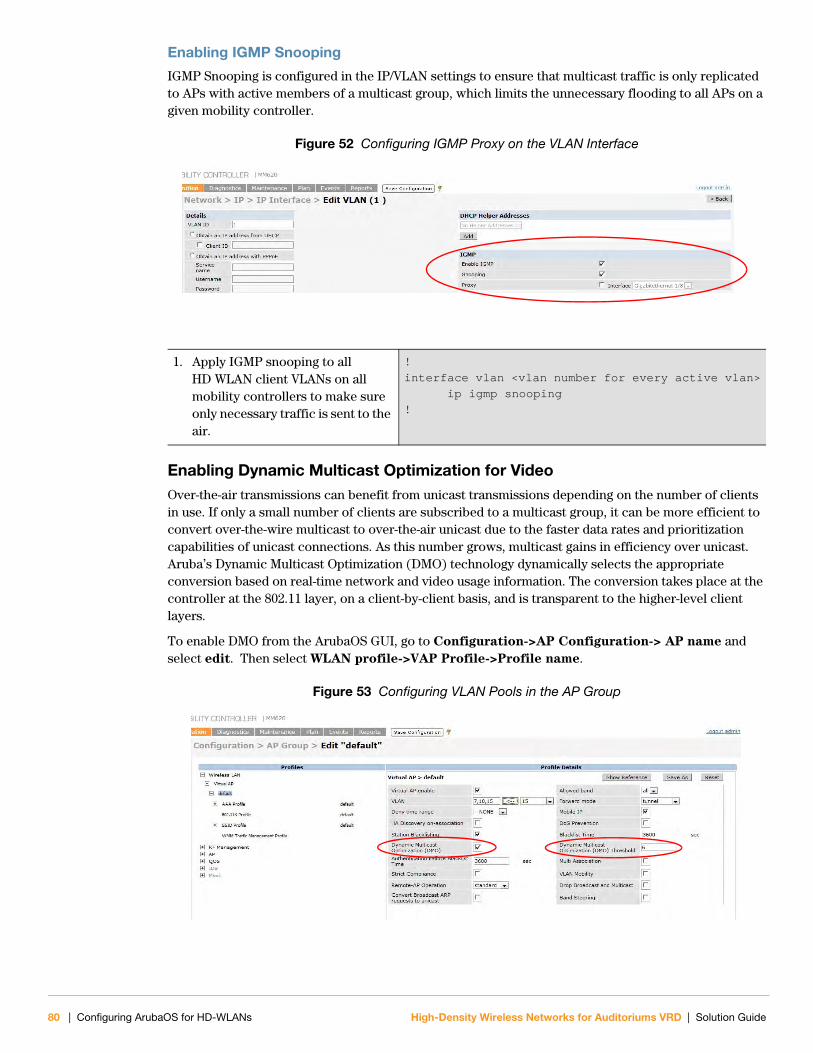
Enabling IGMP Snooping
IGMP Snooping is configured in the IP/VLAN settings to ensure that multicast traffic is only replicated to APs with active members of a multicast group, which limits the unnecessary flooding to all APs on a given mobility controller.
Figure 52 Configuring IGMP Proxy on the VLAN Interface
Enabling Dynamic Multicast Optimization for VideoOver-the-air transmissions can benefit from unicast transmissions depending on the number of clients in use. If only a small number of clients are subscribed to a multicast group, it can be more efficient to convert over-the-wire multicast to over-the-air unicast due to the faster data rates and prioritization capabilities of unicast connections. As this number grows, multicast gains in efficiency over unicast. Aruba’s Dynamic Multicast Optimization (DMO) technology dynamically selects the appropriate conversion based on real-time network and video usage information. The conversion takes place at the controller at the 802.11 layer, on a client-by-client basis, and is transparent to the higher-level client layers.
To enable DMO from the ArubaOS GUI, go to Configuration->AP Configuration-> AP name and select edit. Then select WLAN profile->VAP Profile->Profile name.
Figure 53 Configuring VLAN Pools in the AP Group
1. Apply IGMP snooping to all HD WLAN client VLANs on all mobility controllers to make sure only necessary traffic is sent to the air.
!
interface vlan <vlan number for every active vlan>
ip igmp snooping
!
80 | Configuring ArubaOS for HD-WLANs High-Density Wireless Networks for Auditoriums VRD | Solution Guide
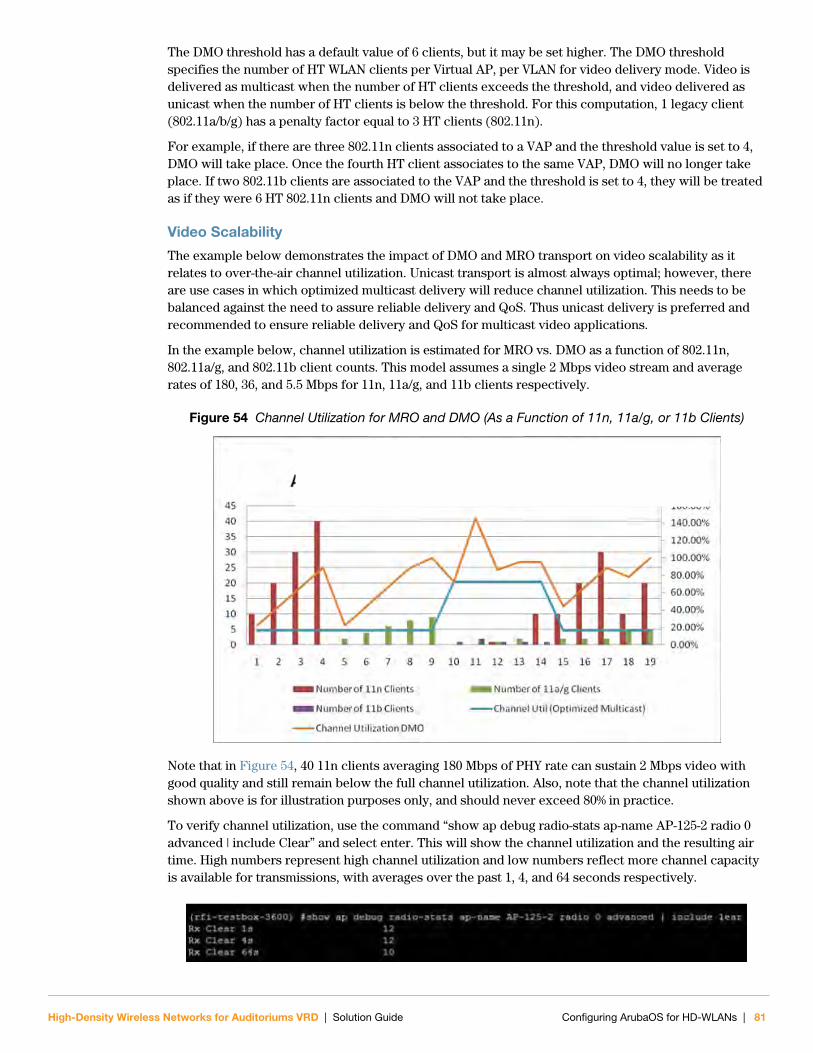
The DMO threshold has a default value of 6 clients, but it may be set higher. The DMO threshold specifies the number of HT WLAN clients per Virtual AP, per VLAN for video delivery mode. Video is delivered as multicast when the number of HT clients exceeds the threshold, and video delivered as unicast when the number of HT clients is below the threshold. For this computation, 1 legacy client (802.11a/b/g) has a penalty factor equal to 3 HT clients (802.11n).
For example, if there are three 802.11n clients associated to a VAP and the threshold value is set to 4, DMO will take place. Once the fourth HT client associates to the same VAP, DMO will no longer take place. If two 802.11b clients are associated to the VAP and the threshold is set to 4, they will be treated as if they were 6 HT 802.11n clients and DMO will not take place.
Video Scalability
The example below demonstrates the impact of DMO and MRO transport on video scalability as it relates to over-the-air channel utilization. Unicast transport is almost always optimal; however, there are use cases in which optimized multicast delivery will reduce channel utilization. This needs to be balanced against the need to assure reliable delivery and QoS. Thus unicast delivery is preferred and recommended to ensure reliable delivery and QoS for multicast video applications.
In the example below, channel utilization is estimated for MRO vs. DMO as a function of 802.11n, 802.11a/g, and 802.11b client counts. This model assumes a single 2 Mbps video stream and average rates of 180, 36, and 5.5 Mbps for 11n, 11a/g, and 11b clients respectively.
Figure 54 Channel Utilization for MRO and DMO (As a Function of 11n, 11a/g, or 11b Clients)
Note that in Figure 54, 40 11n clients averaging 180 Mbps of PHY rate can sustain 2 Mbps video with good quality and still remain below the full channel utilization. Also, note that the channel utilization shown above is for illustration purposes only, and should never exceed 80% in practice.
To verify channel utilization, use the command “show ap debug radio-stats ap-name AP-125-2 radio 0 advanced | include Clear” and select enter. This will show the channel utilization and the resulting air time. High numbers represent high channel utilization and low numbers reflect more channel capacity is available for transmissions, with averages over the past 1, 4, and 64 seconds respectively.
High-Density Wireless Networks for Auditoriums VRD | Solution Guide Configuring ArubaOS for HD-WLANs | 81
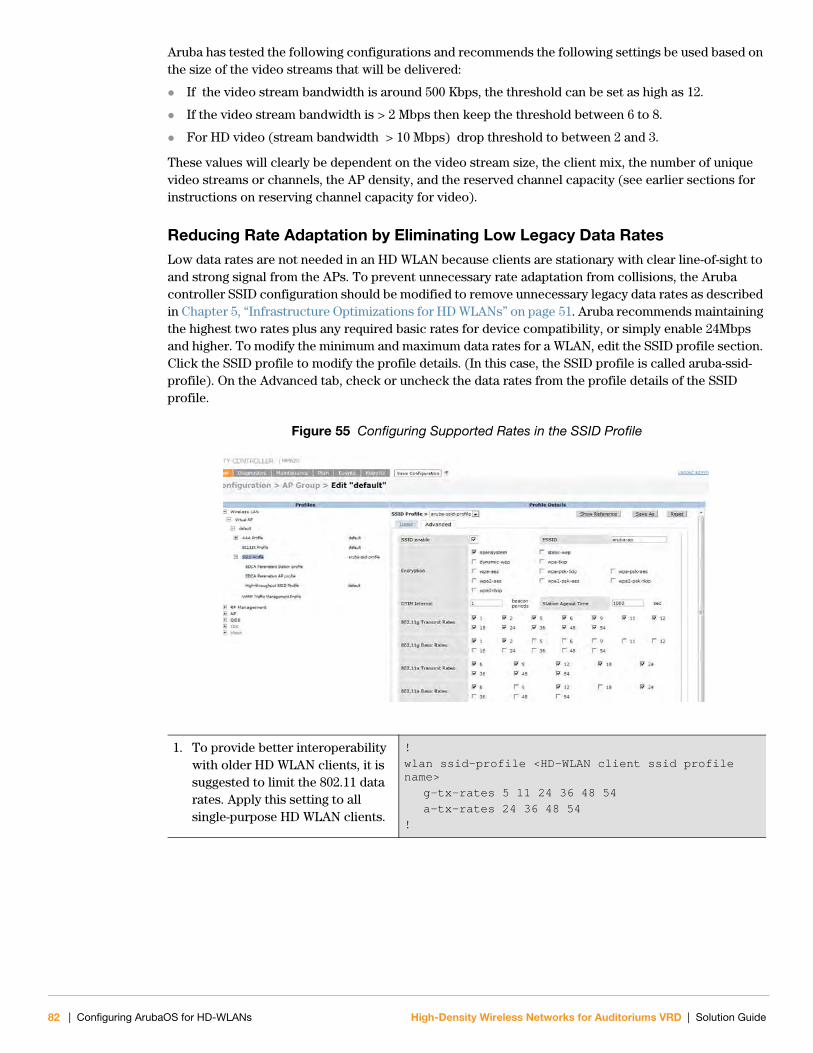
Aruba has tested the following configurations and recommends the following settings be used based on the size of the video streams that will be delivered:
If the video stream bandwidth is around 500 Kbps, the threshold can be set as high as 12.
If the video stream bandwidth is > 2 Mbps then keep the threshold between 6 to 8.
For HD video (stream bandwidth > 10 Mbps) drop threshold to between 2 and 3.
These values will clearly be dependent on the video stream size, the client mix, the number of unique video streams or channels, the AP density, and the reserved channel capacity (see earlier sections for instructions on reserving channel capacity for video).
Reducing Rate Adaptation by Eliminating Low Legacy Data RatesLow data rates are not needed in an HD WLAN because clients are stationary with clear line-of-sight to and strong signal from the APs. To prevent unnecessary rate adaptation from collisions, the Aruba controller SSID configuration should be modified to remove unnecessary legacy data rates as described in Chapter 5, “Infrastructure Optimizations for HD WLANs” on page 51. Aruba recommends maintaining the highest two rates plus any required basic rates for device compatibility, or simply enable 24Mbps and higher. To modify the minimum and maximum data rates for a WLAN, edit the SSID profile section. Click the SSID profile to modify the profile details. (In this case, the SSID profile is called aruba-ssid-profile). On the Advanced tab, check or uncheck the data rates from the profile details of the SSID profile.
Figure 55 Configuring Supported Rates in the SSID Profile
1. To provide better interoperability with older HD WLAN clients, it is suggested to limit the 802.11 data rates. Apply this setting to all single-purpose HD WLAN clients.
!
wlan ssid-profile <HD-WLAN client ssid profile name>
g-tx-rates 5 11 24 36 48 54
a-tx-rates 24 36 48 54
!
82 | Configuring ArubaOS for HD-WLANs High-Density Wireless Networks for Auditoriums VRD | Solution Guide
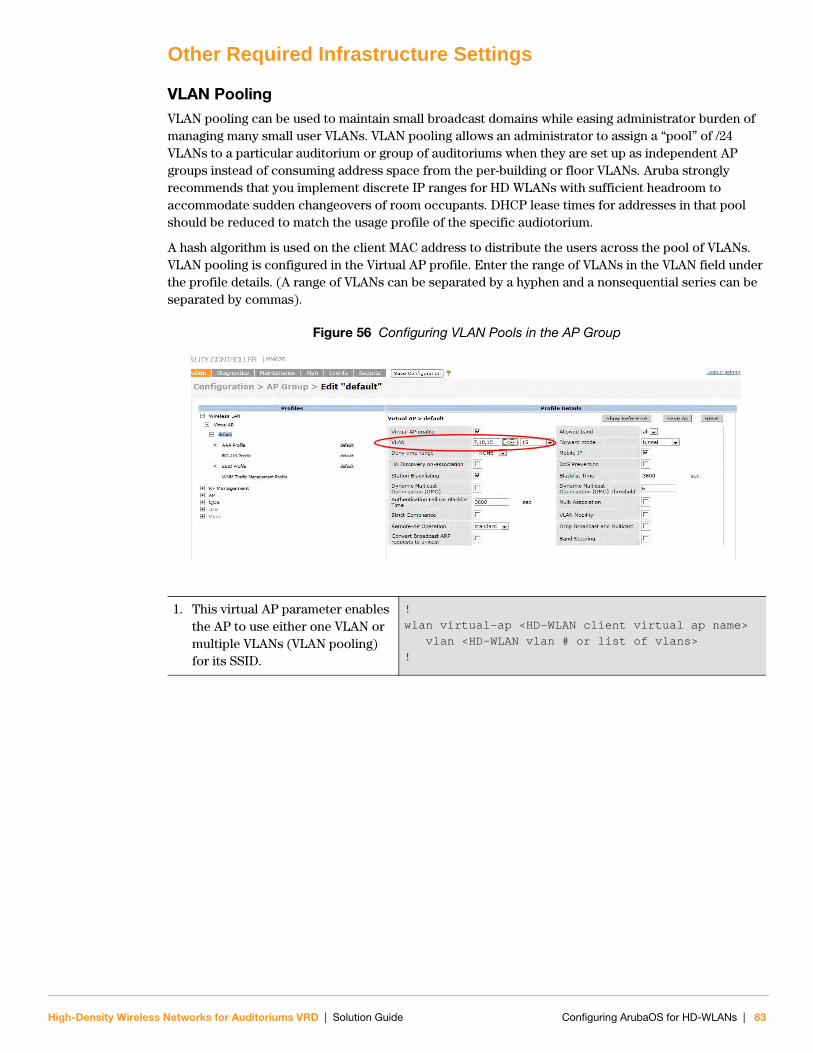
Other Required Infrastructure Settings
VLAN Pooling VLAN pooling can be used to maintain small broadcast domains while easing administrator burden of managing many small user VLANs. VLAN pooling allows an administrator to assign a “pool” of /24 VLANs to a particular auditorium or group of auditoriums when they are set up as independent AP groups instead of consuming address space from the per-building or floor VLANs. Aruba strongly recommends that you implement discrete IP ranges for HD WLANs with sufficient headroom to accommodate sudden changeovers of room occupants. DHCP lease times for addresses in that pool should be reduced to match the usage profile of the specific audiotorium.
A hash algorithm is used on the client MAC address to distribute the users across the pool of VLANs. VLAN pooling is configured in the Virtual AP profile. Enter the range of VLANs in the VLAN field under the profile details. (A range of VLANs can be separated by a hyphen and a nonsequential series can be separated by commas).
Figure 56 Configuring VLAN Pools in the AP Group
1. This virtual AP parameter enables the AP to use either one VLAN or multiple VLANs (VLAN pooling) for its SSID.
!
wlan virtual-ap <HD-WLAN client virtual ap name>
vlan <HD-WLAN vlan # or list of vlans>
!
High-Density Wireless Networks for Auditoriums VRD | Solution Guide Configuring ArubaOS for HD-WLANs | 83

84 | Configuring ArubaOS for HD-WLANs High-Density Wireless Networks for Auditoriums VRD | Solution Guide
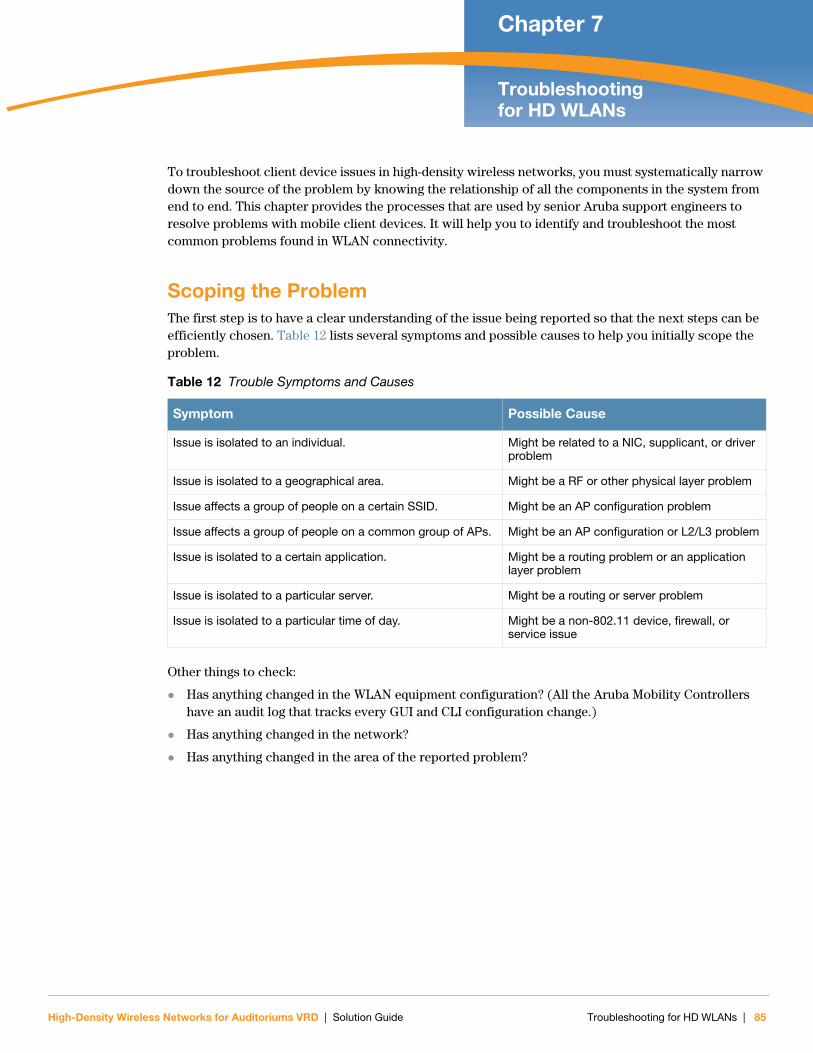
High-Density Wireless Networks for Auditoriums VRD | Solution Guide
Chapter 7Troubleshooting for HD WLANs
To troubleshoot client device issues in high-density wireless networks, you must systematically narrow down the source of the problem by knowing the relationship of all the components in the system from end to end. This chapter provides the processes that are used by senior Aruba support engineers to resolve problems with mobile client devices. It will help you to identify and troubleshoot the most common problems found in WLAN connectivity.
Scoping the ProblemThe first step is to have a clear understanding of the issue being reported so that the next steps can be efficiently chosen. Table 12 lists several symptoms and possible causes to help you initially scope the problem.
Other things to check:
Has anything changed in the WLAN equipment configuration? (All the Aruba Mobility Controllers have an audit log that tracks every GUI and CLI configuration change.)
Has anything changed in the network?
Has anything changed in the area of the reported problem?
Table 12 Trouble Symptoms and Causes
Symptom Possible Cause
Issue is isolated to an individual. Might be related to a NIC, supplicant, or driver problem
Issue is isolated to a geographical area. Might be a RF or other physical layer problem
Issue affects a group of people on a certain SSID. Might be an AP configuration problem
Issue affects a group of people on a common group of APs. Might be an AP configuration or L2/L3 problem
Issue is isolated to a certain application. Might be a routing problem or an application layer problem
Issue is isolated to a particular server. Might be a routing or server problem
Issue is isolated to a particular time of day. Might be a non-802.11 device, firewall, or service issue
Troubleshooting for HD WLANs | 85
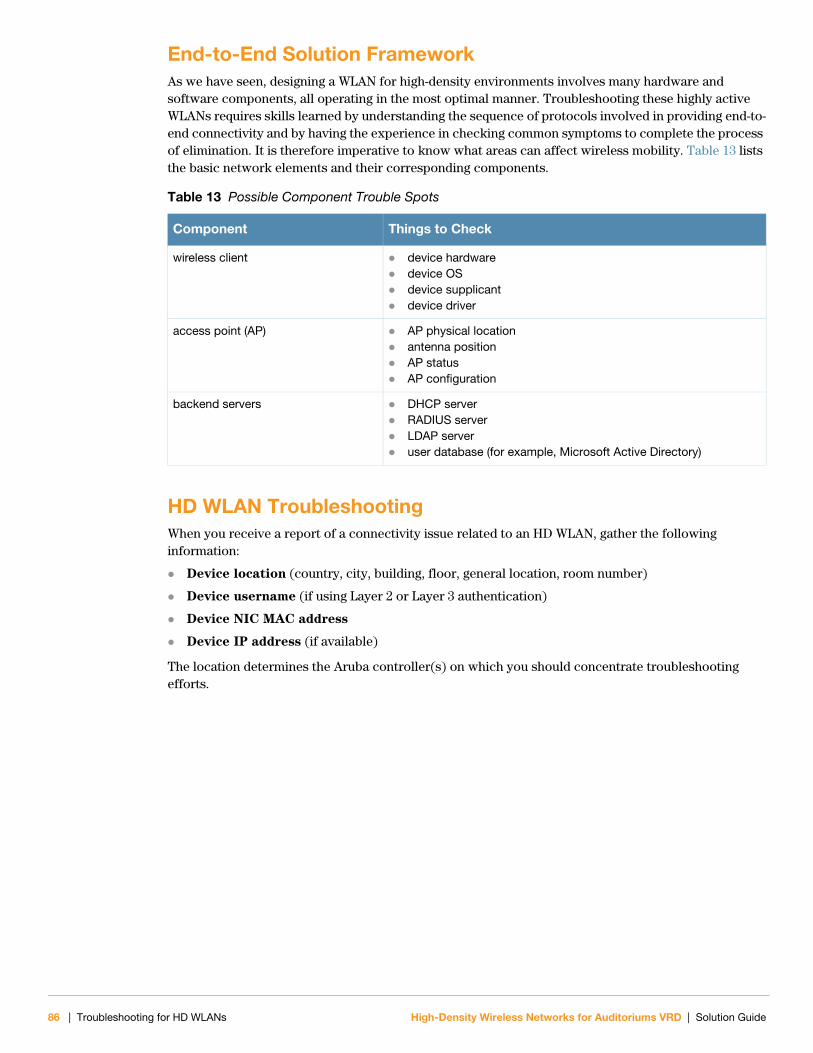
End-to-End Solution FrameworkAs we have seen, designing a WLAN for high-density environments involves many hardware and software components, all operating in the most optimal manner. Troubleshooting these highly active WLANs requires skills learned by understanding the sequence of protocols involved in providing end-to-end connectivity and by having the experience in checking common symptoms to complete the process of elimination. It is therefore imperative to know what areas can affect wireless mobility. Table 13 lists the basic network elements and their corresponding components.
HD WLAN TroubleshootingWhen you receive a report of a connectivity issue related to an HD WLAN, gather the following information:
Device location (country, city, building, floor, general location, room number)
Device username (if using Layer 2 or Layer 3 authentication)
Device NIC MAC address
Device IP address (if available)
The location determines the Aruba controller(s) on which you should concentrate troubleshooting efforts.
Table 13 Possible Component Trouble Spots
Component Things to Check
wireless client device hardware device OS device supplicant device driver
access point (AP) AP physical location antenna position AP status AP configuration
backend servers DHCP server RADIUS server LDAP server user database (for example, Microsoft Active Directory)
86 | Troubleshooting for HD WLANs High-Density Wireless Networks for Auditoriums VRD | Solution Guide
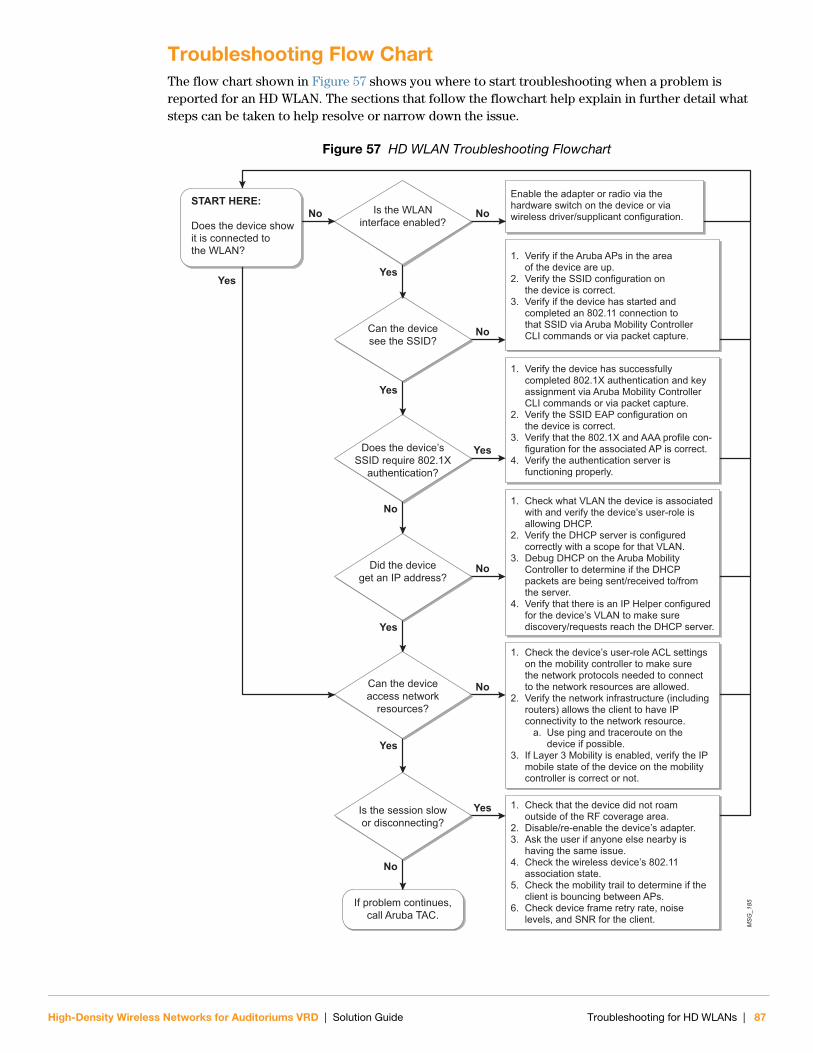
Troubleshooting Flow ChartThe flow chart shown in Figure 57 shows you where to start troubleshooting when a problem is reported for an HD WLAN. The sections that follow the flowchart help explain in further detail what steps can be taken to help resolve or narrow down the issue.
Figure 57 HD WLAN Troubleshooting Flowchart
MS
G_1
85
START HERE:
Does the device showit is connected to the WLAN?
Is the WLANinterface enabled?
Can the devicesee the SSID?
Enable the adapter or radio via thehardware switch on the device or viawireless driver/supplicant configuration.
1.
2.
3.
Verify if the Aruba APs in the areaof the device are up. Verify the SSID configuration onthe device is correct.Verify if the device has started andcompleted an 802.11 connection tothat SSID via Aruba Mobility ControllerCLI commands or via packet capture.
1.
2.
3.
1.
2.3.
4.
5.
6.
Check the device’s user-role ACL settings on the mobility controller to make surethe network protocols needed to connectto the network resources are allowed.Verify the network infrastructure (including routers) allows the client to have IP connectivity to the network resource. a. Use ping and traceroute on the device if possible.If Layer 3 Mobility is enabled, verify the IP mobile state of the device on the mobility controller is correct or not.
Check that the device did not roamoutside of the RF coverage area.Disable/re-enable the device’s adapter.Ask the user if anyone else nearby is having the same issue.Check the wireless device’s 802.11 association state.Check the mobility trail to determine if the client is bouncing between APs.Check device frame retry rate, noise levels, and SNR for the client.
1.
2.
3.
4.
Verify the device has successfullycompleted 802.1X authentication and keyassignment via Aruba Mobility ControllerCLI commands or via packet capture.Verify the SSID EAP configuration onthe device is correct.Verify that the 802.1X and AAA profile con-figuration for the associated AP is correct.Verify the authentication server is functioning properly.
1.
2.
3.
4.
Check what VLAN the device is associatedwith and verify the device’s user-role isallowing DHCP.Verify the DHCP server is configuredcorrectly with a scope for that VLAN.Debug DHCP on the Aruba MobilityController to determine if the DHCPpackets are being sent/received to/fromthe server.Verify that there is an IP Helper configuredfor the device’s VLAN to make sure discovery/requests reach the DHCP server.
Does the device’sSSID require 802.1X
authentication?
Did the deviceget an IP address?
Can the deviceaccess network
resources?
YesYes
No No
Yes
No
No
Yes
Yes
No
Yes
No
If problem continues,call Aruba TAC.
Is the session slowor disconnecting?
No
Yes
High-Density Wireless Networks for Auditoriums VRD | Solution Guide Troubleshooting for HD WLANs | 87
Symptom #1: Device cannot see any SSIDsSuggested actions:
1. Check building location of the wireless device.
2. SSH to the Aruba Mobility Controller that is responsible for the building.
3. Verify that APs are up on the controller.
Show ap bss-table and show ap active
This command lists all APs with their respective AP names and their active SSIDs and BSSIDs.
4. Verify that the SSID is not hidden.
If the SSID is hidden, verify that the client is properly configured to associate to it.
5. Check the wireless NIC enable/disable physical switch on the mobile device.
6. Check the wireless NIC enable/disable soft setting within wireless supplicant software.
7. If the device is using Microsoft Windows Operating System, issue a “repair” in Network Connections or wireless NIC system tray icon. For MacOS devices, turn AirPort off and then back on again.
If no issues are found and these actions have not corrected the problem, continue with device troubleshooting. In addition to previously gathered information (username, location, MAC/IP), gather device hardware model name and number and wireless NIC brand, model, type, and driver version for further troubleshooting. Also, take a wireless packet capture so that Aruba Support can perform analysis by means of the AP Remote Packet Capture method or by means of third-party software (for example, WildPackets OmniPeek, CACE Technologies AirPcap, and so on). Please also provide the Aruba Support Team all the necessary CLI command output for mobility controller, AP, and user statistics.
Symptom #2: Device can see SSIDs but not the one it needsSuggested actions:
1. Verify that the required SSIDs are active and enabled in the Aruba Mobility Controller.
Show ap bss-table
Issue this command from any mobility controller, master or local, that is servicing APs. This command lists all APs with their AP names and their active SSIDs and BSSIDs.
2. Verify that all APs are up and active, especially those in the area of the problem device.
show ap database long | include <auditorium>
Issue this command from the master mobility controller that is servicing the area of the problem device. This command lists all known APs serviced from that master mobility controller, regardless of being up or down.
3. If all APs have proper SSID configurations and no APs are reported down, verify that the client device is attempting to associate and authenticate.
configure terminal
logging level debugging user-debug <wireless device's mac address>
end
This command starts debugging on all Aruba processes for the wireless device and logs the results in Aruba logging category “user-debug.”
View the debug output with this CLI command:
show log user-debug all | include <wireless device’s mac address>
88 | Troubleshooting for HD WLANs High-Density Wireless Networks for Auditoriums VRD | Solution Guide

show ap debug mgmt-frames client-mac <wireless device's mac address>
This command lists the 802.11 management packets (Association Request, Association Response, Re-Association Request, Re-Association Response, Disassociation, and Deauth) for the specified wireless device.
If you see the latest packet as “assoc-resp,” the wireless device should be authenticating (if VAP is configured for Layer 2 or Layer 3 authentication) or should be authenticated already.
show log system all | include <wireless device's mac address>
Issue this command from any master or local mobility controller that is servicing APs to which the device may attempt to associate. This command shows if the problem client is attempting to associate. Look for the problem client MAC address. It also shows to which AP the client MAC is attempting to associate. Note the BSSID.
show ap association client-mac <wireless device's mac address>
This command shows the 802.11 state of the wireless device, what SSID it is associated to, what VLAN it is assigned, what PHY type it is using, how long it has been associated to the AP’s BSSID, and what capabilities it has such as WMM, Active/Not Active, RRM client, Band Steerable, or HT-capable.
Use the AP BSSID and device MAC taken from this command.
show ap association | include <AP BSSID that the device is associated to> and show user-table bssid <AP BSSID that the device is associated to>
This output can be used to verify if there are other devices currently associated to the same AP, thus helping to rule out infrastructure issues as compared to a single-client issue.
show log security all | include <wireless device's mac address>
Look for the problem client MAC. This command can be used to determine whether the client is attempting to authenticate via Layer 2 or Layer 3 authentication and if the request is being rejected. If the attempt is rejected, this can be established as the reason for client failure. Investigate authentication server logs as needed.
show auth-tracebuf
If the device is configured to use Layer 2 authentication such as 802.1X, verify that the wireless device successfully completed all EAP and Key exchange phases using this CLI command: show auth-tracebuf mac <wireless device mac address>
show log errorlog all
This command can be used to determine if there are any miscellaneous errors with the mobility controller, the AP, or the wireless device.
This command can also point to problems with an authentication server not responding to authentication requests if Layer 2 or Layer 3 authentication is enabled on the virtual AP to which the device is trying to connect.
If the authentication server is RADIUS, look for excessive RADIUS timeouts or instances of the Aruba Mobility Controller taking a RADIUS server out of service for the server hold-down timer. This behavior indicates possible RADIUS server connectivity or performance issues and should be investigated as needed.
Using these steps, you can determine if the device has passed 802.11 negotiation and is attempting to authenticate (if Layer 2 or Layer 3 authentication is required). If none of these steps yields information that helps you correct the problem, take a wireless packet capture for Aruba Support to analyze. You can use the AP Remote Packet Capture method or third-party software (for example, WildPackets OmniPeek, CACE Technologies AirPcap, and so on). Please also provide the Aruba Support Team all the necessary CLI command output for mobility controller, AP, and user statistics.
High-Density Wireless Networks for Auditoriums VRD | Solution Guide Troubleshooting for HD WLANs | 89
Symptom #3: Device successfully authenticates but cannot communicate This scenario is most likely related to the device being in a restricted user-role (firewall ACL misconfiguration). Or the device may not be getting an IP address from the DHCP server due to VAP configuration, DHCP connectivity issues, DHCP Scope misconfiguration, or Layer 3 Mobility issues (if enabled).
Suggested actions:
1. Verify that the device is receiving an IP address via device statistics or via the Aruba Mobility Controller:
show user mac <wireless device MAC address>
This command displays all details pertaining to the client. Verify that the IP address is not 0.0.0.0 or a 169.x.x.x address.
This command is also used to verify if the user was successfully authenticated, and displays the user-role, ACL number, authentication method, and associated AP name/BSSID.
If the device is associated to the right user-role and VLAN but it does not have a valid IP address, disable and re-enable its wireless adapter or force a DHCP “release-renew” in the operating system of the device.
If the problem is not corrected, investigate DHCP infrastructure and connectivity.
DHCP troubleshooting:
Enable DHCP debugging on the Aruba Mobility Controller at the AP device location.
config t
logging level debugging network subcat dhcp
end
View the DHCP debug for the wireless device using this CLI command show log network all | include <wireless device MAC address>
Confirm that the DHCP server is in service.
Verify that the upstream router has the correct DHCP helper-address for the device’s VLAN.
Investigate whether or not the DHCP scope is correctly configured for the device’s subnet and that it has available IP addresses in its pool.
2. Verify that the device has been placed in the correct user role with the correct session policies.
show user mac <wireless device MAC address> or show user ip <ipaddr>
This command lists all details pertaining to the client. Use this output to confirm that the user’s authenticated role is correct.
show rights <device’s assigned role name>
Use this command to determine which policies are associated to the device’s authenticated role and verify that they allow the required protocols for device IP and application connectivity.
show datapath session table <device IP address>
This command displays all IP flows between the device and the network.
Have the device attempt a connection to its required network resource and use this command to confirm that traffic passing from the device is not being denied by the Aruba stateful firewall role-based policies by verifying no IP flow is marked with the “D” flag (denied).
Using these steps, you can determine if the device has received a proper IP address, has been placed in the correct user-role with the correct policies, and verify network connectivity. If none of these steps yields information that helps you correct the problem, then prepare a wired packet capture for the Aruba Support team to analyze between the Aruba Mobility Controller and the uplink switch. This can
90 | Troubleshooting for HD WLANs High-Density Wireless Networks for Auditoriums VRD | Solution Guide
be done with built-in operating system applications like tcpdump, network monitor, or third-party software like Wireshark, Ethereal, or WildPackets OmniPeek/EtherPeek. Another method to achieve device packet capture is by implementing session mirroring in the device’s user-role on the mobility controller.
Symptom #4: Device has Connection Loss and/or Poor Performance Suggested actions:
1. Confirm with the user that they did not roam outside of the engineered RF coverage area with their device.
2. Disable and re-enable the device’s adapter and verify if the issue persists.
3. Confirm that the AP to which the device is associated is nearby.
To determine the “last Rx SNR” value of the device, use this CLI command:
show ap debug client-table ap-name <ap name that the device is associated to>
Anything with “Last Rx SNR” value of 25 or greater normally provides good performance with the higher supported 802.11 data rates.
4. Compare the problem user’s stated location with the building and AP floor plan or use Aruba RF Plan.
5. Ask the user who is reporting the trouble if anyone else nearby is having the same issue. This information assists in determining if this is an infrastructure or single-user problem.
6. Check the user log and the AP 802.11 management frames for possible cause of disconnection.
show log user all | include <wireless device's mac address>
show ap debug mgmt-frames client-mac <wireless device's mac address>
This command determines from when and where the disconnection originated (either the AP or the device) and helps determine the reason.
7. Check the 802.11 association state of the wireless device.
show ap debug client-table ap-name <Aruba AP name where the wireless device is
associated to>
Part of this CLI output displays the Last_Rx_SNR, Tx_Rate, and Rx_Rate of the wireless device.
If the SNR is 15 or lower, the wireless device is possibly too far from the AP. This might be due to the device’s roaming algorithm not being optimal and needs to be forced to look for a closer AP by disabling and re-enabling its network adapter.
If the Tx_Rate or Rx_Rate are 1, 2, or 6, the device may be experiencing interference or is too far away from the AP.
If the Tx Retry rate is constantly 35% or higher, the device may be experiencing interference or is far away from the AP.
There might be non-802.11 interference if the MAC and PHY errors are at an aggregate of 20% or higher, which can be seen using this CLI command:
show ap arm rf-summary ap-name <Aruba AP name where the wireless device is
associated to>
8. Check mobility trail to determine if the client is bouncing between APs even when stationary.
show ip mobile trail <wireless device MAC address>
“router mobile” must be configured for this CLI command to work.
This command displays the mobility history of a given client. This can be used to check for the frequency of roaming.
High-Density Wireless Networks for Auditoriums VRD | Solution Guide Troubleshooting for HD WLANs | 91
9. Check device frame retry rate, noise levels, and SNR for the client.
show user mac <device wireless MAC address> orshow user ip <device IP address>
Investigate the following:
Channel Frame Retry Rate:
This means that 40% of the frames sent to the air have been retransmitted.
This is a symptom of heavy interference or low signal strength between the device and the AP.
Take a wireless packet capture to see if the 802.11 frame retries are due to the AP not hearing the wireless device, or the wireless device is not hearing the AP due to interference, or the device is too far from the AP.
Channel Noise:
From these steps you can determine possible causes for poor performance or roaming issues due to device driver sub-optimal performance, roaming outside of the WLAN coverage area, or interference. If none of these steps yields information that helps you correct the problem, then take a wireless packet capture for Aruba Support to analyze by means of the AP Remote Packet Capture method or third-party software (for example, WildPackets OmniPeek, CACE Technologies AirPcap, and so on). Please also provide the Aruba Support Team with all the necessary CLI command output for mobility controller, AP, and user statistics.
Before You Contact Aruba SupportTo help Aruba Support provide the fastest problem resolution to any HD WLAN connectivity or performance issue, provide the following information:
1. Provide the Aruba WLAN Controller logs and the output of the “show tech-support” command.
CLI Example:
a. tar logs tech-support
b. copy flash: logs.tar tftp:<tftp server IP address> <file name>
2. Provide the Syslog Server file of the Aruba WLAN Controller at the time of the problem.
If no Syslog Server is available to capture log output from the Aruba WLAN Controller, set one up as soon as possible, because this is a strongly suggested troubleshooting and monitoring best practice.
A free Syslog server can be found at Kiwi Enterprises (http://www.kiwisyslog.com/).
3. State the scope of the problem as mentioned earlier in this section.
4. If there was a configuration change, list the exact configuration steps and commands used.
5. State the date and time (if possible) when the problem first occurred.
6. Is the problem reproducible?
If the problem is reproducible, list the exact steps taken to recreate the problem.
10-20% is normal
20-30% is intermediate
40+% is very high
If channel noise is at a value of 75 or below, this is a critical interference level that should be viewed with a Spectrum Analyzer.
92 | Troubleshooting for HD WLANs High-Density Wireless Networks for Auditoriums VRD | Solution Guide
7. Provide the wireless device’s make, model number, and its OS version, including any service packs or patches.
8. Provide the Wireless LAN Card’s make, model number, driver date, driver version, and configuration on the wireless device.
9. Provide a detailed network topology:
a. Include all the devices in the network between the user and the Aruba WLAN Controller with IP addresses and Interface numbers, if possible.
b. The diagram can be formatted as Visio, PowerPoint, JPEG, TIF, etc., or it can even be hand written and then faxed to the Aruba Support Team (1-408-227-4550).
10. Provide any wired or wireless sniffer traces taken during the time of the problem.
11. Provide the following HD WLAN statistic output on the mobility controller:
a. show aaa state user <wireless client ip address>
b. show ap association client-mac <wireless device's mac address>
c. show ap debug mgmt-frames client-mac <wireless device's mac address>
d. show ap debug client-stats <wireless device's mac address> advanced
Run this command at least three times during the debugging.
e. show ap monitor stats ap-name <ap name> mac <client mac> verbose
Run this command at least three times during the debugging.
f. show auth-tracebuf mac <wireless client mac address>
12. Provide the following AP statistics on the mobility controller output:
a. show ap tech-support ap-name <Aruba AP name where the wireless device is
associated to>
Run this command at least three times for every AP the wireless device has a problem with performance or roaming to.
13. If Layer 3 Mobility is enabled on the mobility controllers, provide the following CLI output:
a. show ip mobile binding | begin <wireless device's mac address>
b. show ip mobile domain
c. show ip mobile global
d. show ip mobile host <wireless device's mac address>
e. show ip mobile remote <wireless device's mac address>]
f. show ip mobile trace <wireless device's mac address>
g. show ip mobile traffic foreign-agent
h. show ip mobile traffic home-agent
i. show ip mobile traffic proxy
j. show ip mobile traffic proxy-dhcp
k. show ip mobile trail <wireless device's mac address>
l. show ip mobile visitor <wireless device's mac address>
High-Density Wireless Networks for Auditoriums VRD | Solution Guide Troubleshooting for HD WLANs | 93

94 | Troubleshooting for HD WLANs High-Density Wireless Networks for Auditoriums VRD | Solution Guide
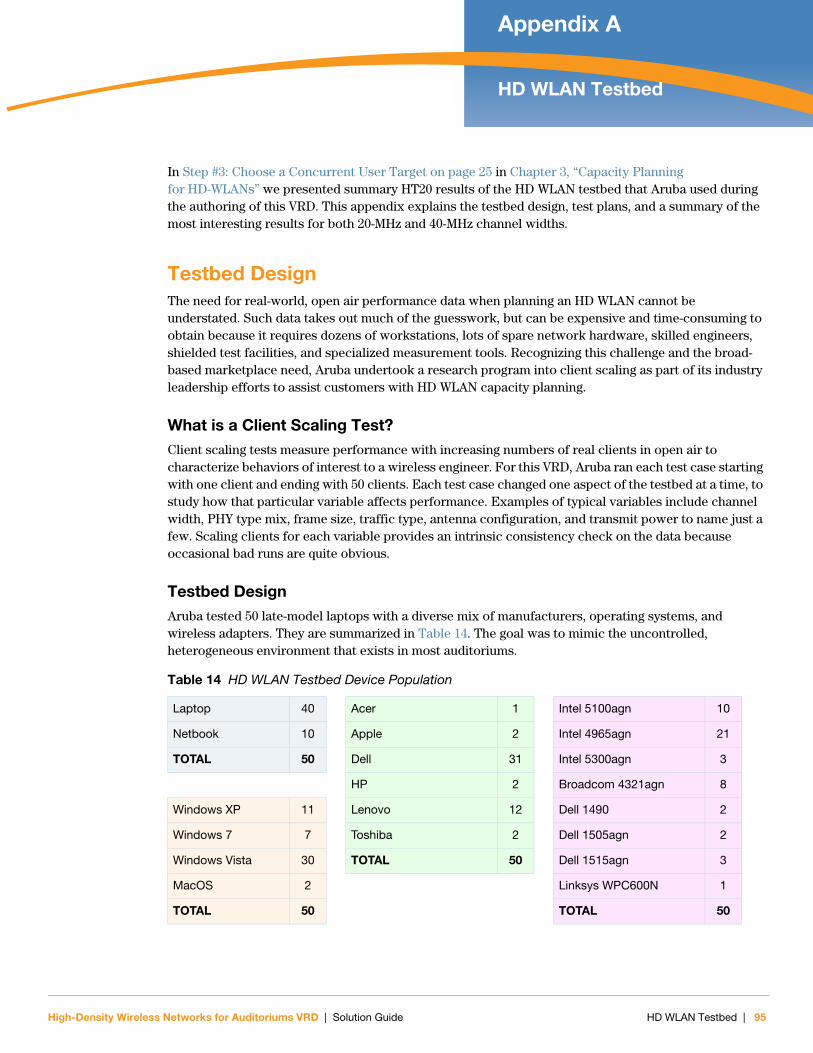
High-Density Wireless Networks for Auditoriums VRD | Solution Guide
Appendix AHD WLAN Testbed
In Step #3: Choose a Concurrent User Target on page 25 in Chapter 3, “Capacity Planning for HD-WLANs” we presented summary HT20 results of the HD WLAN testbed that Aruba used during the authoring of this VRD. This appendix explains the testbed design, test plans, and a summary of the most interesting results for both 20-MHz and 40-MHz channel widths.
Testbed DesignThe need for real-world, open air performance data when planning an HD WLAN cannot be understated. Such data takes out much of the guesswork, but can be expensive and time-consuming to obtain because it requires dozens of workstations, lots of spare network hardware, skilled engineers, shielded test facilities, and specialized measurement tools. Recognizing this challenge and the broad-based marketplace need, Aruba undertook a research program into client scaling as part of its industry leadership efforts to assist customers with HD WLAN capacity planning.
What is a Client Scaling Test?Client scaling tests measure performance with increasing numbers of real clients in open air to characterize behaviors of interest to a wireless engineer. For this VRD, Aruba ran each test case starting with one client and ending with 50 clients. Each test case changed one aspect of the testbed at a time, to study how that particular variable affects performance. Examples of typical variables include channel width, PHY type mix, frame size, traffic type, antenna configuration, and transmit power to name just a few. Scaling clients for each variable provides an intrinsic consistency check on the data because occasional bad runs are quite obvious.
Testbed DesignAruba tested 50 late-model laptops with a diverse mix of manufacturers, operating systems, and wireless adapters. They are summarized in Table 14. The goal was to mimic the uncontrolled, heterogeneous environment that exists in most auditoriums.
Table 14 HD WLAN Testbed Device Population
Laptop 40 Acer 1 Intel 5100agn 10
Netbook 10 Apple 2 Intel 4965agn 21
TOTAL 50 Dell 31 Intel 5300agn 3
HP 2 Broadcom 4321agn 8
Windows XP 11 Lenovo 12 Dell 1490 2
Windows 7 7 Toshiba 2 Dell 1505agn 2
Windows Vista 30 TOTAL 50 Dell 1515agn 3
MacOS 2 Linksys WPC600N 1
TOTAL 50 TOTAL 50
HD WLAN Testbed | 95
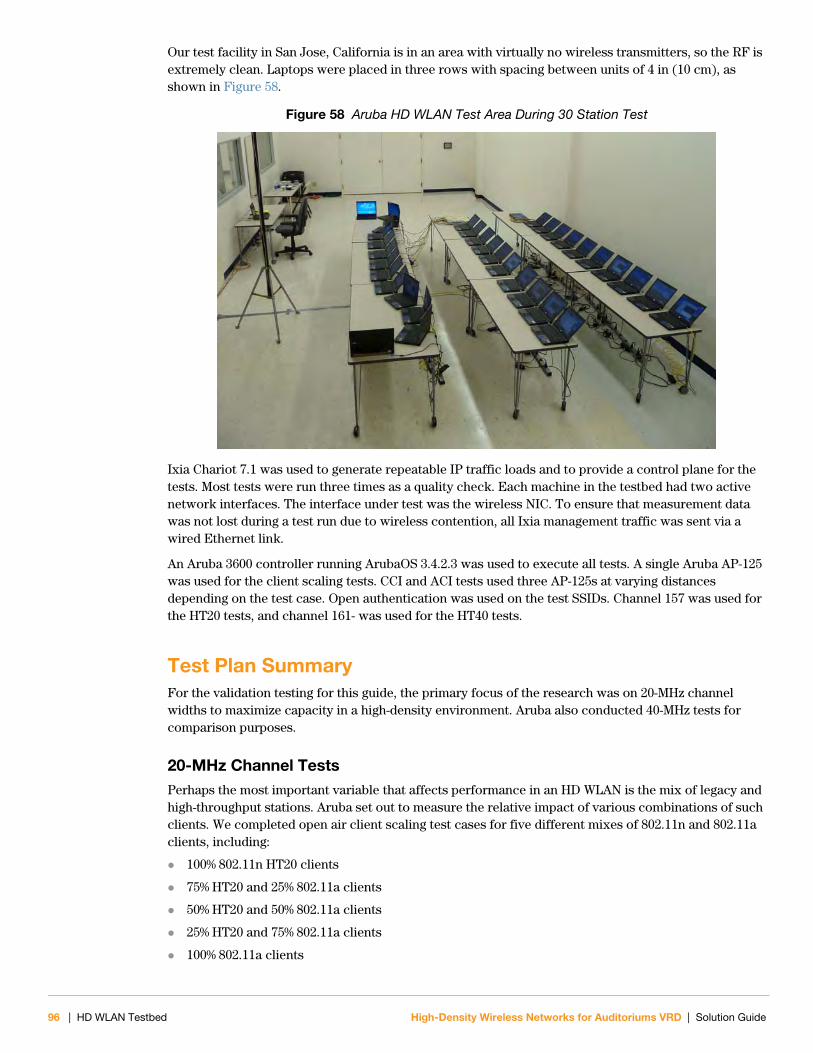
Our test facility in San Jose, California is in an area with virtually no wireless transmitters, so the RF is extremely clean. Laptops were placed in three rows with spacing between units of 4 in (10 cm), as shown in Figure 58.
Figure 58 Aruba HD WLAN Test Area During 30 Station Test
Ixia Chariot 7.1 was used to generate repeatable IP traffic loads and to provide a control plane for the tests. Most tests were run three times as a quality check. Each machine in the testbed had two active network interfaces. The interface under test was the wireless NIC. To ensure that measurement data was not lost during a test run due to wireless contention, all Ixia management traffic was sent via a wired Ethernet link.
An Aruba 3600 controller running ArubaOS 3.4.2.3 was used to execute all tests. A single Aruba AP-125 was used for the client scaling tests. CCI and ACI tests used three AP-125s at varying distances depending on the test case. Open authentication was used on the test SSIDs. Channel 157 was used for the HT20 tests, and channel 161- was used for the HT40 tests.
Test Plan SummaryFor the validation testing for this guide, the primary focus of the research was on 20-MHz channel widths to maximize capacity in a high-density environment. Aruba also conducted 40-MHz tests for comparison purposes.
20-MHz Channel TestsPerhaps the most important variable that affects performance in an HD WLAN is the mix of legacy and high-throughput stations. Aruba set out to measure the relative impact of various combinations of such clients. We completed open air client scaling test cases for five different mixes of 802.11n and 802.11a clients, including:
100% 802.11n HT20 clients
75% HT20 and 25% 802.11a clients
50% HT20 and 50% 802.11a clients
25% HT20 and 75% 802.11a clients
100% 802.11a clients
96 | HD WLAN Testbed High-Density Wireless Networks for Auditoriums VRD | Solution Guide
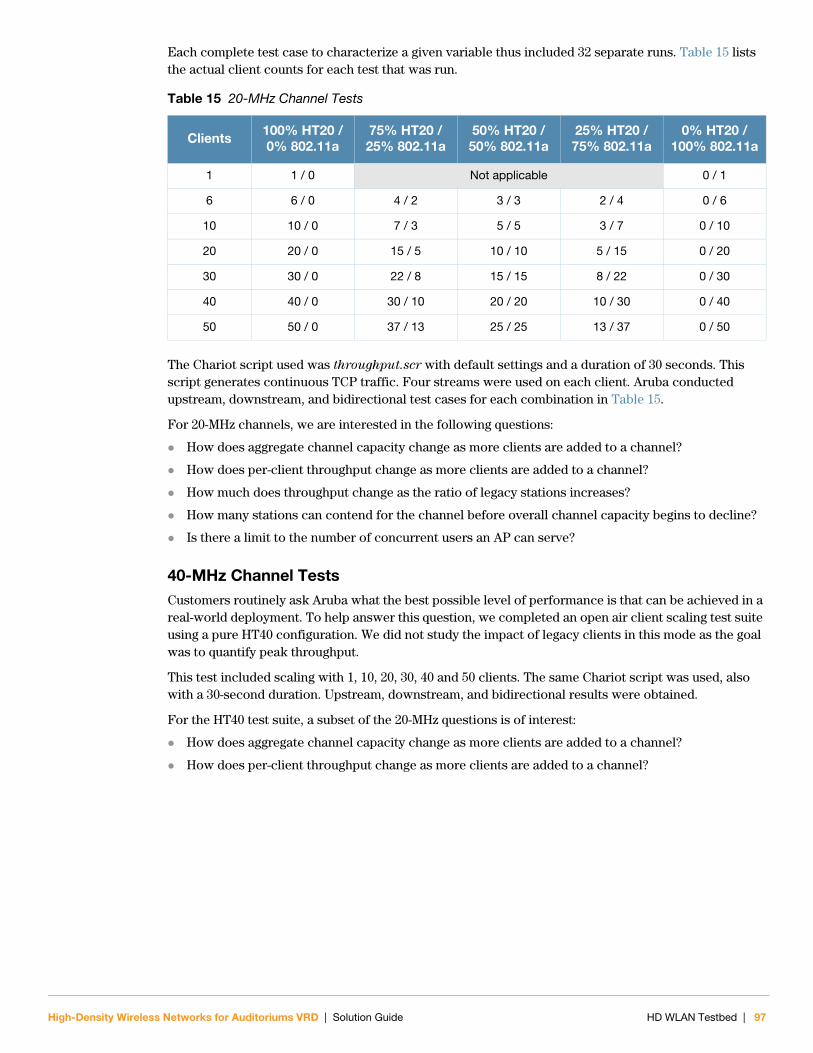
Each complete test case to characterize a given variable thus included 32 separate runs. Table 15 lists the actual client counts for each test that was run.
The Chariot script used was throughput.scr with default settings and a duration of 30 seconds. This script generates continuous TCP traffic. Four streams were used on each client. Aruba conducted upstream, downstream, and bidirectional test cases for each combination in Table 15.
For 20-MHz channels, we are interested in the following questions:
How does aggregate channel capacity change as more clients are added to a channel?
How does per-client throughput change as more clients are added to a channel?
How much does throughput change as the ratio of legacy stations increases?
How many stations can contend for the channel before overall channel capacity begins to decline?
Is there a limit to the number of concurrent users an AP can serve?
40-MHz Channel TestsCustomers routinely ask Aruba what the best possible level of performance is that can be achieved in a real-world deployment. To help answer this question, we completed an open air client scaling test suite using a pure HT40 configuration. We did not study the impact of legacy clients in this mode as the goal was to quantify peak throughput.
This test included scaling with 1, 10, 20, 30, 40 and 50 clients. The same Chariot script was used, also with a 30-second duration. Upstream, downstream, and bidirectional results were obtained.
For the HT40 test suite, a subset of the 20-MHz questions is of interest:
How does aggregate channel capacity change as more clients are added to a channel?
How does per-client throughput change as more clients are added to a channel?
Table 15 20-MHz Channel Tests
Clients100% HT20 / 0% 802.11a
75% HT20 / 25% 802.11a
50% HT20 / 50% 802.11a
25% HT20 / 75% 802.11a
0% HT20 / 100% 802.11a
1 1 / 0 Not applicable 0 / 1
6 6 / 0 4 / 2 3 / 3 2 / 4 0 / 6
10 10 / 0 7 / 3 5 / 5 3 / 7 0 / 10
20 20 / 0 15 / 5 10 / 10 5 / 15 0 / 20
30 30 / 0 22 / 8 15 / 15 8 / 22 0 / 30
40 40 / 0 30 / 10 20 / 20 10 / 30 0 / 40
50 50 / 0 37 / 13 25 / 25 13 / 37 0 / 50
High-Density Wireless Networks for Auditoriums VRD | Solution Guide HD WLAN Testbed | 97
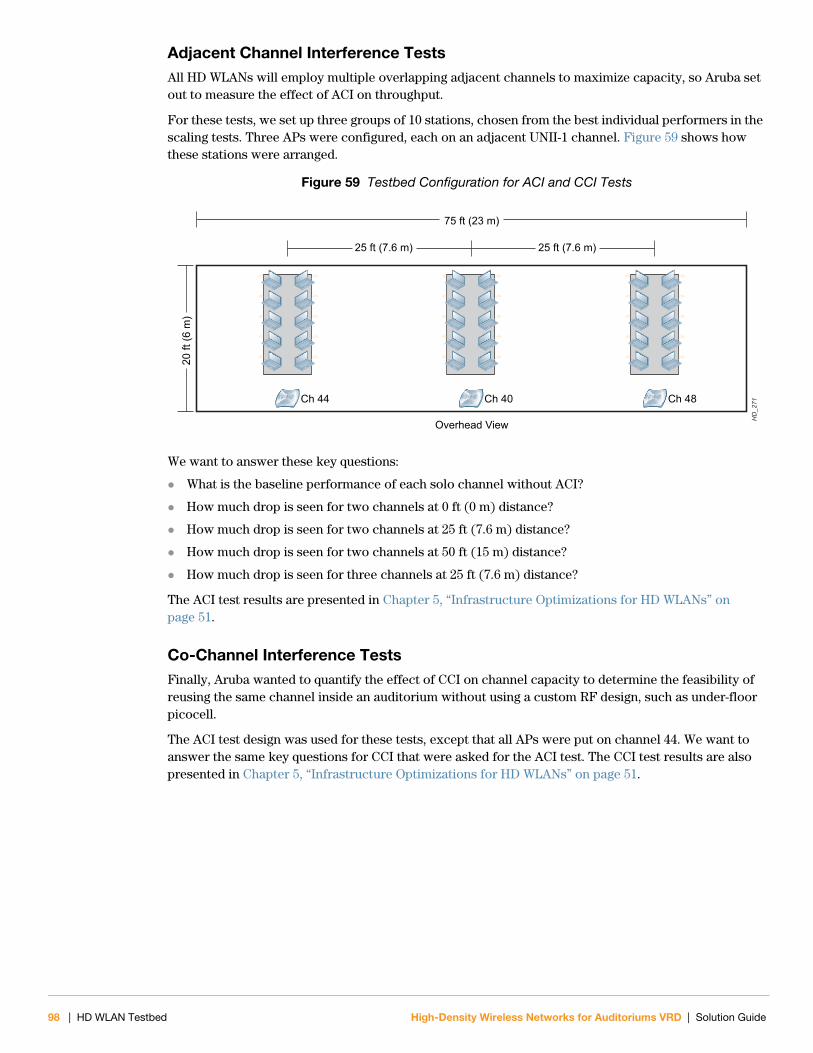
Adjacent Channel Interference TestsAll HD WLANs will employ multiple overlapping adjacent channels to maximize capacity, so Aruba set out to measure the effect of ACI on throughput.
For these tests, we set up three groups of 10 stations, chosen from the best individual performers in the scaling tests. Three APs were configured, each on an adjacent UNII-1 channel. Figure 59 shows how these stations were arranged.
Figure 59 Testbed Configuration for ACI and CCI Tests
We want to answer these key questions:
What is the baseline performance of each solo channel without ACI?
How much drop is seen for two channels at 0 ft (0 m) distance?
How much drop is seen for two channels at 25 ft (7.6 m) distance?
How much drop is seen for two channels at 50 ft (15 m) distance?
How much drop is seen for three channels at 25 ft (7.6 m) distance?
The ACI test results are presented in Chapter 5, “Infrastructure Optimizations for HD WLANs” on page 51.
Co-Channel Interference TestsFinally, Aruba wanted to quantify the effect of CCI on channel capacity to determine the feasibility of reusing the same channel inside an auditorium without using a custom RF design, such as under-floor picocell.
The ACI test design was used for these tests, except that all APs were put on channel 44. We want to answer the same key questions for CCI that were asked for the ACI test. The CCI test results are also presented in Chapter 5, “Infrastructure Optimizations for HD WLANs” on page 51.
HD
_271
Overhead View
Ch 44 Ch 40 Ch 48
75 ft (23 m)
25 ft (7.6 m) 25 ft (7.6 m)
20 ft
(6 m
)
98 | HD WLAN Testbed High-Density Wireless Networks for Auditoriums VRD | Solution Guide
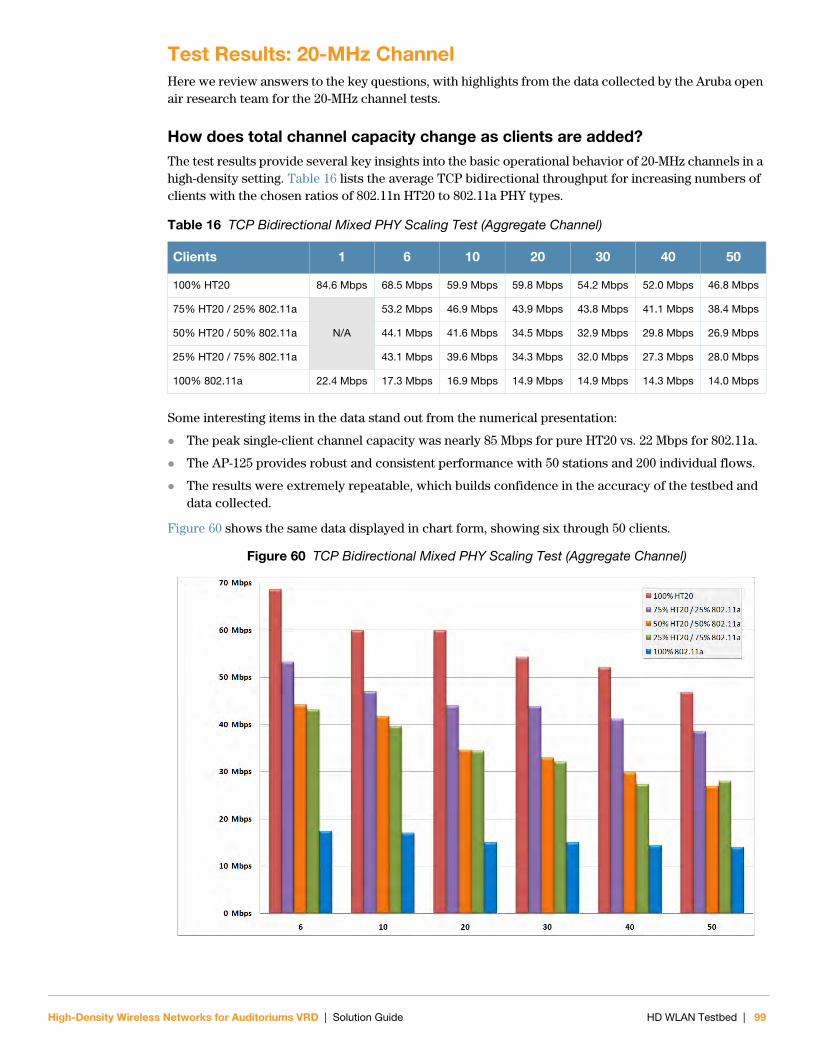
Test Results: 20-MHz ChannelHere we review answers to the key questions, with highlights from the data collected by the Aruba open air research team for the 20-MHz channel tests.
How does total channel capacity change as clients are added?The test results provide several key insights into the basic operational behavior of 20-MHz channels in a high-density setting. Table 16 lists the average TCP bidirectional throughput for increasing numbers of clients with the chosen ratios of 802.11n HT20 to 802.11a PHY types.
Some interesting items in the data stand out from the numerical presentation:
The peak single-client channel capacity was nearly 85 Mbps for pure HT20 vs. 22 Mbps for 802.11a.
The AP-125 provides robust and consistent performance with 50 stations and 200 individual flows.
The results were extremely repeatable, which builds confidence in the accuracy of the testbed and data collected.
Figure 60 shows the same data displayed in chart form, showing six through 50 clients.
Figure 60 TCP Bidirectional Mixed PHY Scaling Test (Aggregate Channel)
Table 16 TCP Bidirectional Mixed PHY Scaling Test (Aggregate Channel)
Clients 1 6 10 20 30 40 50
100% HT20 84.6 Mbps 68.5 Mbps 59.9 Mbps 59.8 Mbps 54.2 Mbps 52.0 Mbps 46.8 Mbps
75% HT20 / 25% 802.11a
N/A
53.2 Mbps 46.9 Mbps 43.9 Mbps 43.8 Mbps 41.1 Mbps 38.4 Mbps
50% HT20 / 50% 802.11a 44.1 Mbps 41.6 Mbps 34.5 Mbps 32.9 Mbps 29.8 Mbps 26.9 Mbps
25% HT20 / 75% 802.11a 43.1 Mbps 39.6 Mbps 34.3 Mbps 32.0 Mbps 27.3 Mbps 28.0 Mbps
100% 802.11a 22.4 Mbps 17.3 Mbps 16.9 Mbps 14.9 Mbps 14.9 Mbps 14.3 Mbps 14.0 Mbps
High-Density Wireless Networks for Auditoriums VRD | Solution Guide HD WLAN Testbed | 99
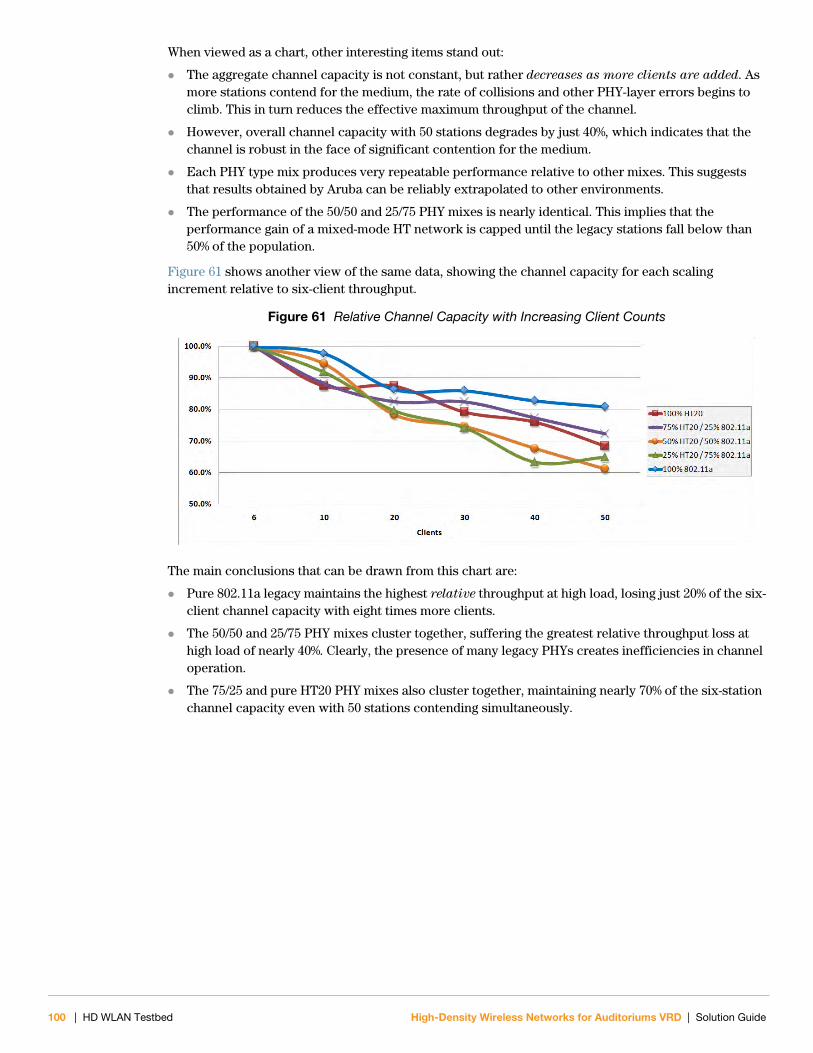
When viewed as a chart, other interesting items stand out:
The aggregate channel capacity is not constant, but rather decreases as more clients are added. As more stations contend for the medium, the rate of collisions and other PHY-layer errors begins to climb. This in turn reduces the effective maximum throughput of the channel.
However, overall channel capacity with 50 stations degrades by just 40%, which indicates that the channel is robust in the face of significant contention for the medium.
Each PHY type mix produces very repeatable performance relative to other mixes. This suggests that results obtained by Aruba can be reliably extrapolated to other environments.
The performance of the 50/50 and 25/75 PHY mixes is nearly identical. This implies that the performance gain of a mixed-mode HT network is capped until the legacy stations fall below than 50% of the population.
Figure 61 shows another view of the same data, showing the channel capacity for each scaling increment relative to six-client throughput.
Figure 61 Relative Channel Capacity with Increasing Client Counts
The main conclusions that can be drawn from this chart are:
Pure 802.11a legacy maintains the highest relative throughput at high load, losing just 20% of the six-client channel capacity with eight times more clients.
The 50/50 and 25/75 PHY mixes cluster together, suffering the greatest relative throughput loss at high load of nearly 40%. Clearly, the presence of many legacy PHYs creates inefficiencies in channel operation.
The 75/25 and pure HT20 PHY mixes also cluster together, maintaining nearly 70% of the six-station channel capacity even with 50 stations contending simultaneously.
100 | HD WLAN Testbed High-Density Wireless Networks for Auditoriums VRD | Solution Guide
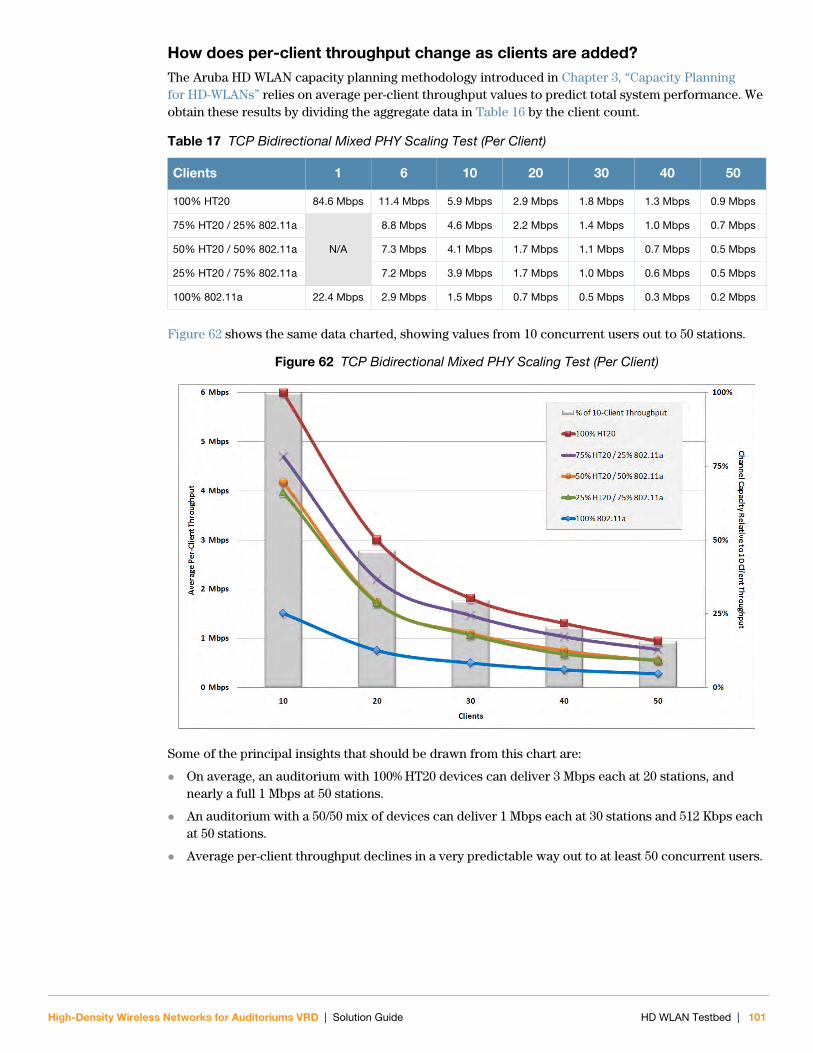
How does per-client throughput change as clients are added?The Aruba HD WLAN capacity planning methodology introduced in Chapter 3, “Capacity Planning for HD-WLANs” relies on average per-client throughput values to predict total system performance. We obtain these results by dividing the aggregate data in Table 16 by the client count.
Figure 62 shows the same data charted, showing values from 10 concurrent users out to 50 stations.
Figure 62 TCP Bidirectional Mixed PHY Scaling Test (Per Client)
Some of the principal insights that should be drawn from this chart are:
On average, an auditorium with 100% HT20 devices can deliver 3 Mbps each at 20 stations, and nearly a full 1 Mbps at 50 stations.
An auditorium with a 50/50 mix of devices can deliver 1 Mbps each at 30 stations and 512 Kbps each at 50 stations.
Average per-client throughput declines in a very predictable way out to at least 50 concurrent users.
Table 17 TCP Bidirectional Mixed PHY Scaling Test (Per Client)
Clients 1 6 10 20 30 40 50
100% HT20 84.6 Mbps 11.4 Mbps 5.9 Mbps 2.9 Mbps 1.8 Mbps 1.3 Mbps 0.9 Mbps
75% HT20 / 25% 802.11a
N/A
8.8 Mbps 4.6 Mbps 2.2 Mbps 1.4 Mbps 1.0 Mbps 0.7 Mbps
50% HT20 / 50% 802.11a 7.3 Mbps 4.1 Mbps 1.7 Mbps 1.1 Mbps 0.7 Mbps 0.5 Mbps
25% HT20 / 75% 802.11a 7.2 Mbps 3.9 Mbps 1.7 Mbps 1.0 Mbps 0.6 Mbps 0.5 Mbps
100% 802.11a 22.4 Mbps 2.9 Mbps 1.5 Mbps 0.7 Mbps 0.5 Mbps 0.3 Mbps 0.2 Mbps
High-Density Wireless Networks for Auditoriums VRD | Solution Guide HD WLAN Testbed | 101
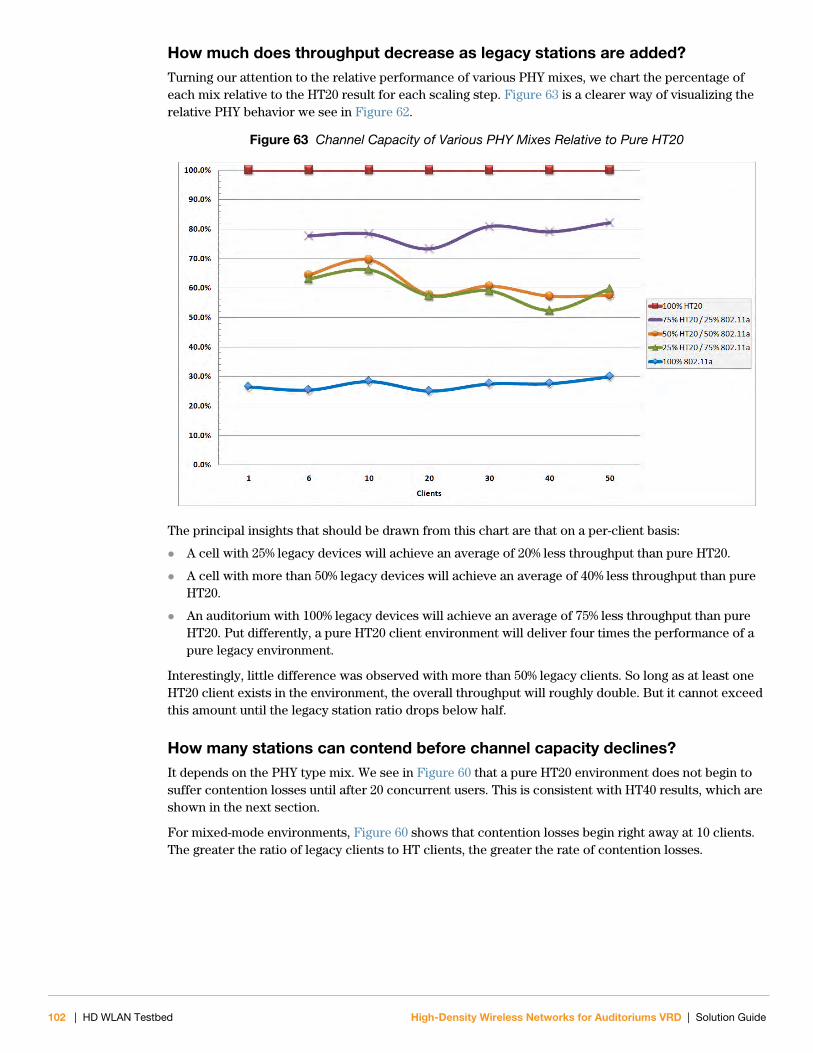
How much does throughput decrease as legacy stations are added?Turning our attention to the relative performance of various PHY mixes, we chart the percentage of each mix relative to the HT20 result for each scaling step. Figure 63 is a clearer way of visualizing the relative PHY behavior we see in Figure 62.
Figure 63 Channel Capacity of Various PHY Mixes Relative to Pure HT20
The principal insights that should be drawn from this chart are that on a per-client basis:
A cell with 25% legacy devices will achieve an average of 20% less throughput than pure HT20.
A cell with more than 50% legacy devices will achieve an average of 40% less throughput than pure HT20.
An auditorium with 100% legacy devices will achieve an average of 75% less throughput than pure HT20. Put differently, a pure HT20 client environment will deliver four times the performance of a pure legacy environment.
Interestingly, little difference was observed with more than 50% legacy clients. So long as at least one HT20 client exists in the environment, the overall throughput will roughly double. But it cannot exceed this amount until the legacy station ratio drops below half.
How many stations can contend before channel capacity declines?It depends on the PHY type mix. We see in Figure 60 that a pure HT20 environment does not begin to suffer contention losses until after 20 concurrent users. This is consistent with HT40 results, which are shown in the next section.
For mixed-mode environments, Figure 60 shows that contention losses begin right away at 10 clients. The greater the ratio of legacy clients to HT clients, the greater the rate of contention losses.
102 | HD WLAN Testbed High-Density Wireless Networks for Auditoriums VRD | Solution Guide
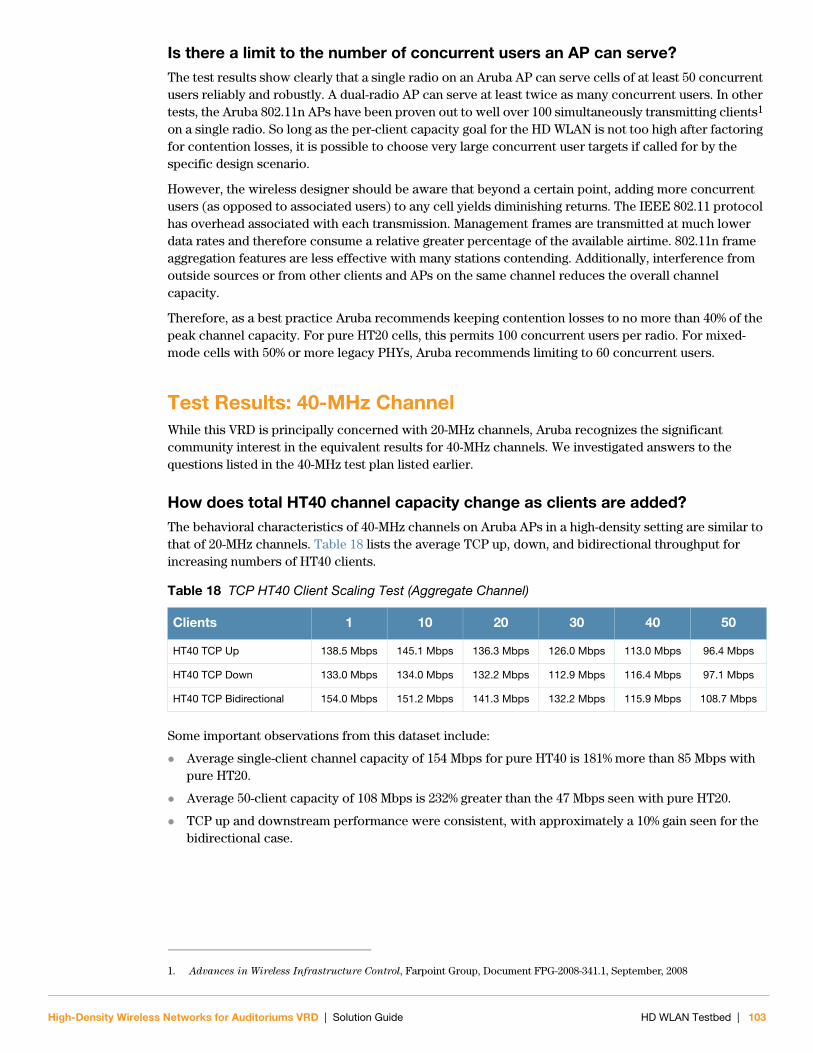
Is there a limit to the number of concurrent users an AP can serve?The test results show clearly that a single radio on an Aruba AP can serve cells of at least 50 concurrent users reliably and robustly. A dual-radio AP can serve at least twice as many concurrent users. In other tests, the Aruba 802.11n APs have been proven out to well over 100 simultaneously transmitting clients1 on a single radio. So long as the per-client capacity goal for the HD WLAN is not too high after factoring for contention losses, it is possible to choose very large concurrent user targets if called for by the specific design scenario.
However, the wireless designer should be aware that beyond a certain point, adding more concurrent users (as opposed to associated users) to any cell yields diminishing returns. The IEEE 802.11 protocol has overhead associated with each transmission. Management frames are transmitted at much lower data rates and therefore consume a relative greater percentage of the available airtime. 802.11n frame aggregation features are less effective with many stations contending. Additionally, interference from outside sources or from other clients and APs on the same channel reduces the overall channel capacity.
Therefore, as a best practice Aruba recommends keeping contention losses to no more than 40% of the peak channel capacity. For pure HT20 cells, this permits 100 concurrent users per radio. For mixed-mode cells with 50% or more legacy PHYs, Aruba recommends limiting to 60 concurrent users.
Test Results: 40-MHz ChannelWhile this VRD is principally concerned with 20-MHz channels, Aruba recognizes the significant community interest in the equivalent results for 40-MHz channels. We investigated answers to the questions listed in the 40-MHz test plan listed earlier.
How does total HT40 channel capacity change as clients are added?The behavioral characteristics of 40-MHz channels on Aruba APs in a high-density setting are similar to that of 20-MHz channels. Table 18 lists the average TCP up, down, and bidirectional throughput for increasing numbers of HT40 clients.
Some important observations from this dataset include:
Average single-client channel capacity of 154 Mbps for pure HT40 is 181% more than 85 Mbps with pure HT20.
Average 50-client capacity of 108 Mbps is 232% greater than the 47 Mbps seen with pure HT20.
TCP up and downstream performance were consistent, with approximately a 10% gain seen for the bidirectional case.
1. Advances in Wireless Infrastructure Control, Farpoint Group, Document FPG-2008-341.1, September, 2008
Table 18 TCP HT40 Client Scaling Test (Aggregate Channel)
Clients 1 10 20 30 40 50
HT40 TCP Up 138.5 Mbps 145.1 Mbps 136.3 Mbps 126.0 Mbps 113.0 Mbps 96.4 Mbps
HT40 TCP Down 133.0 Mbps 134.0 Mbps 132.2 Mbps 112.9 Mbps 116.4 Mbps 97.1 Mbps
HT40 TCP Bidirectional 154.0 Mbps 151.2 Mbps 141.3 Mbps 132.2 Mbps 115.9 Mbps 108.7 Mbps
High-Density Wireless Networks for Auditoriums VRD | Solution Guide HD WLAN Testbed | 103
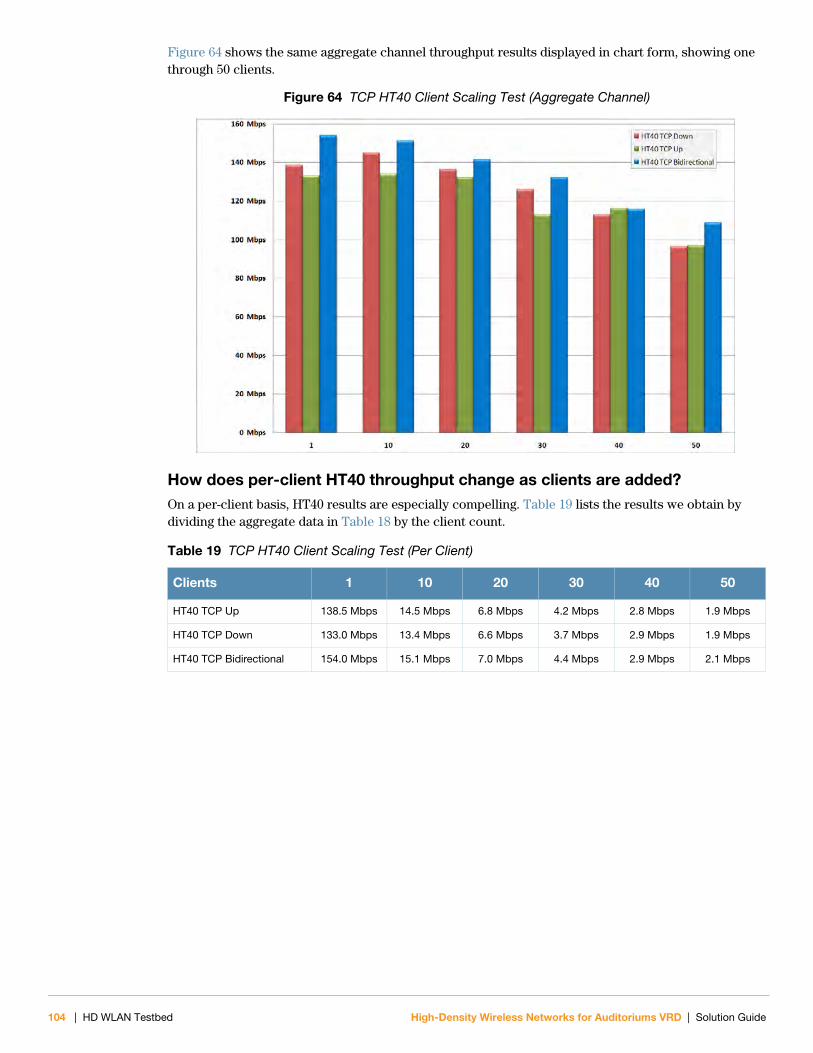
Figure 64 shows the same aggregate channel throughput results displayed in chart form, showing one through 50 clients.
Figure 64 TCP HT40 Client Scaling Test (Aggregate Channel)
How does per-client HT40 throughput change as clients are added?On a per-client basis, HT40 results are especially compelling. Table 19 lists the results we obtain by dividing the aggregate data in Table 18 by the client count.
Table 19 TCP HT40 Client Scaling Test (Per Client)
Clients 1 10 20 30 40 50
HT40 TCP Up 138.5 Mbps 14.5 Mbps 6.8 Mbps 4.2 Mbps 2.8 Mbps 1.9 Mbps
HT40 TCP Down 133.0 Mbps 13.4 Mbps 6.6 Mbps 3.7 Mbps 2.9 Mbps 1.9 Mbps
HT40 TCP Bidirectional 154.0 Mbps 15.1 Mbps 7.0 Mbps 4.4 Mbps 2.9 Mbps 2.1 Mbps
104 | HD WLAN Testbed High-Density Wireless Networks for Auditoriums VRD | Solution Guide
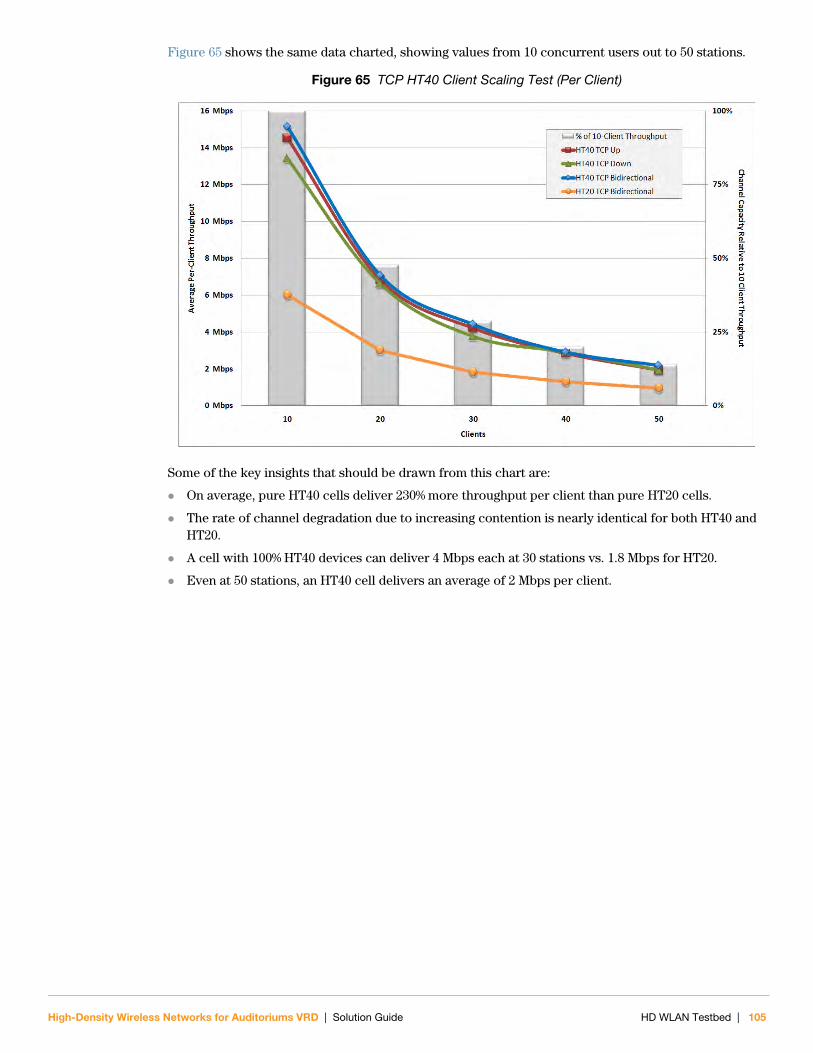
Figure 65 shows the same data charted, showing values from 10 concurrent users out to 50 stations.
Figure 65 TCP HT40 Client Scaling Test (Per Client)
Some of the key insights that should be drawn from this chart are:
On average, pure HT40 cells deliver 230% more throughput per client than pure HT20 cells.
The rate of channel degradation due to increasing contention is nearly identical for both HT40 and HT20.
A cell with 100% HT40 devices can deliver 4 Mbps each at 30 stations vs. 1.8 Mbps for HT20.
Even at 50 stations, an HT40 cell delivers an average of 2 Mbps per client.
High-Density Wireless Networks for Auditoriums VRD | Solution Guide HD WLAN Testbed | 105

106 | HD WLAN Testbed High-Density Wireless Networks for Auditoriums VRD | Solution Guide
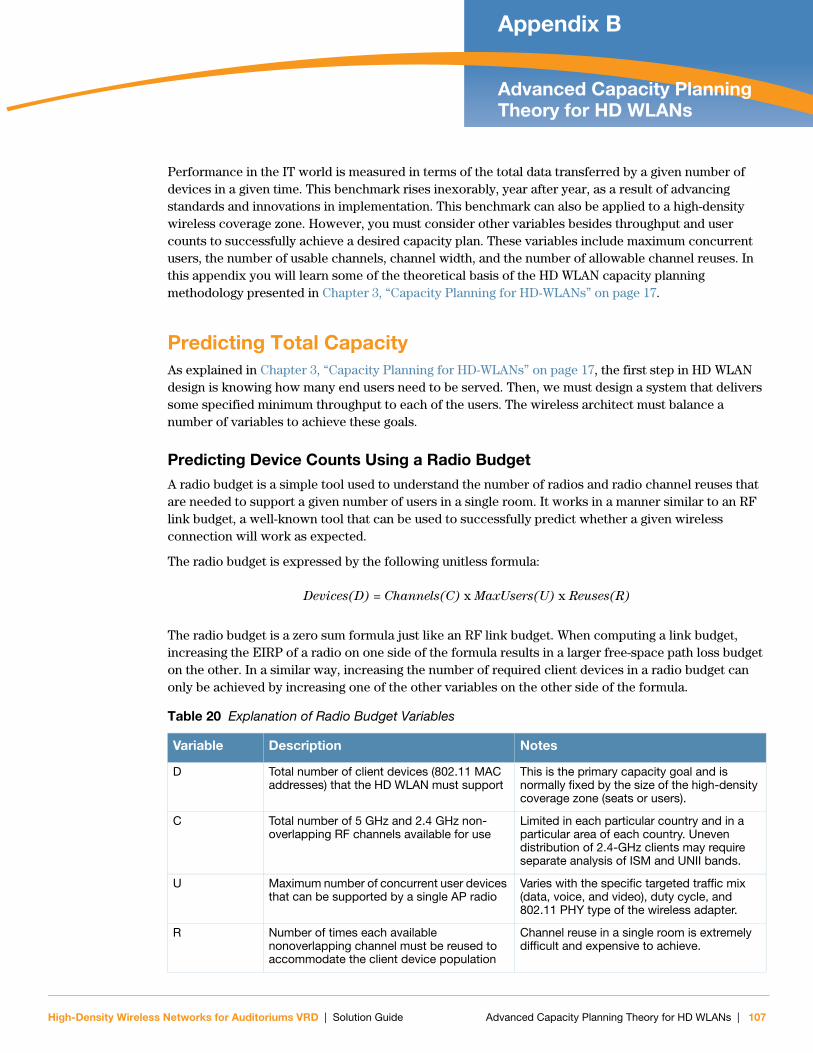
High-Density Wireless Networks for Auditoriums VRD | Solution Guide
Appendix BAdvanced Capacity Planning Theory for HD WLANs
Performance in the IT world is measured in terms of the total data transferred by a given number of devices in a given time. This benchmark rises inexorably, year after year, as a result of advancing standards and innovations in implementation. This benchmark can also be applied to a high-density wireless coverage zone. However, you must consider other variables besides throughput and user counts to successfully achieve a desired capacity plan. These variables include maximum concurrent users, the number of usable channels, channel width, and the number of allowable channel reuses. In this appendix you will learn some of the theoretical basis of the HD WLAN capacity planning methodology presented in Chapter 3, “Capacity Planning for HD-WLANs” on page 17.
Predicting Total CapacityAs explained in Chapter 3, “Capacity Planning for HD-WLANs” on page 17, the first step in HD WLAN design is knowing how many end users need to be served. Then, we must design a system that delivers some specified minimum throughput to each of the users. The wireless architect must balance a number of variables to achieve these goals.
Predicting Device Counts Using a Radio BudgetA radio budget is a simple tool used to understand the number of radios and radio channel reuses that are needed to support a given number of users in a single room. It works in a manner similar to an RF link budget, a well-known tool that can be used to successfully predict whether a given wireless connection will work as expected.
The radio budget is expressed by the following unitless formula:
The radio budget is a zero sum formula just like an RF link budget. When computing a link budget, increasing the EIRP of a radio on one side of the formula results in a larger free-space path loss budget on the other. In a similar way, increasing the number of required client devices in a radio budget can only be achieved by increasing one of the other variables on the other side of the formula.
Table 20 Explanation of Radio Budget Variables
Variable Description Notes
D Total number of client devices (802.11 MAC addresses) that the HD WLAN must support
This is the primary capacity goal and is normally fixed by the size of the high-density coverage zone (seats or users).
C Total number of 5 GHz and 2.4 GHz non-overlapping RF channels available for use
Limited in each particular country and in a particular area of each country. Uneven distribution of 2.4-GHz clients may require separate analysis of ISM and UNII bands.
U Maximum number of concurrent user devices that can be supported by a single AP radio
Varies with the specific targeted traffic mix (data, voice, and video), duty cycle, and 802.11 PHY type of the wireless adapter.
R Number of times each available nonoverlapping channel must be reused to accommodate the client device population
Channel reuse in a single room is extremely difficult and expensive to achieve.
Devices(D) = Channels(C) x MaxUsers(U) x Reuses(R)
Advanced Capacity Planning Theory for HD WLANs | 107
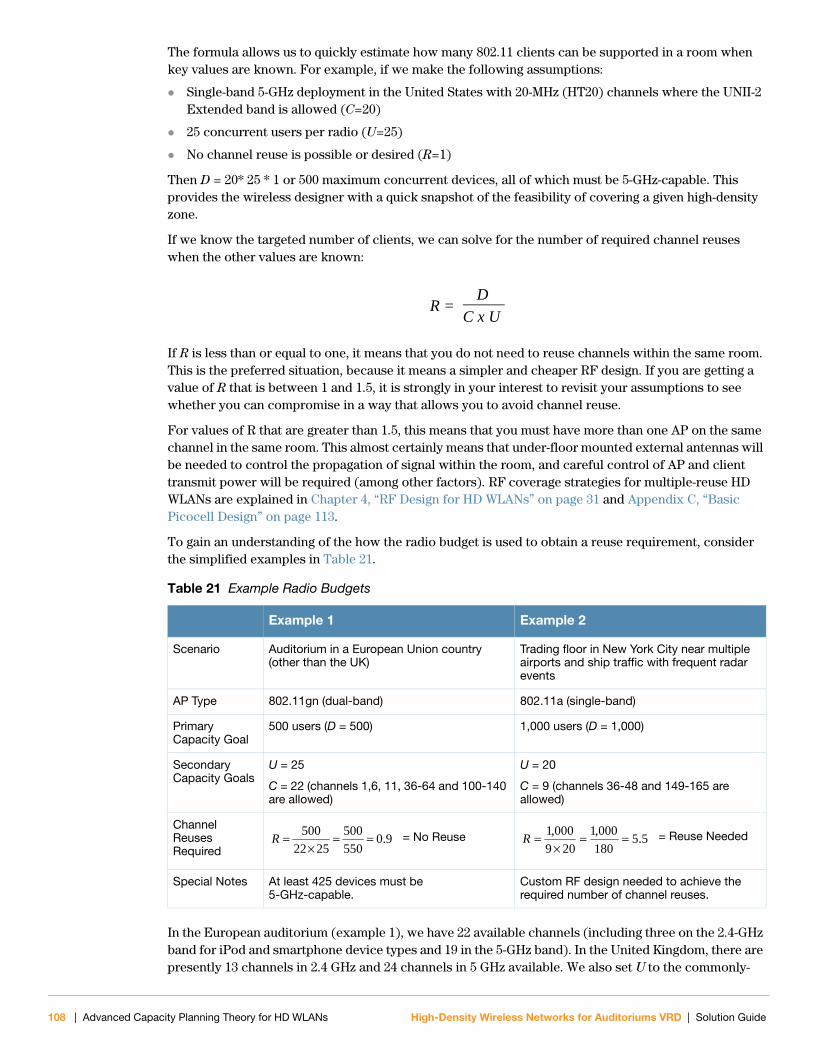
The formula allows us to quickly estimate how many 802.11 clients can be supported in a room when key values are known. For example, if we make the following assumptions:
Single-band 5-GHz deployment in the United States with 20-MHz (HT20) channels where the UNII-2 Extended band is allowed (C=20)
25 concurrent users per radio (U=25)
No channel reuse is possible or desired (R=1)
Then D = 20* 25 * 1 or 500 maximum concurrent devices, all of which must be 5-GHz-capable. This provides the wireless designer with a quick snapshot of the feasibility of covering a given high-density zone.
If we know the targeted number of clients, we can solve for the number of required channel reuses when the other values are known:
If R is less than or equal to one, it means that you do not need to reuse channels within the same room. This is the preferred situation, because it means a simpler and cheaper RF design. If you are getting a value of R that is between 1 and 1.5, it is strongly in your interest to revisit your assumptions to see whether you can compromise in a way that allows you to avoid channel reuse.
For values of R that are greater than 1.5, this means that you must have more than one AP on the same channel in the same room. This almost certainly means that under-floor mounted external antennas will be needed to control the propagation of signal within the room, and careful control of AP and client transmit power will be required (among other factors). RF coverage strategies for multiple-reuse HD WLANs are explained in Chapter 4, “RF Design for HD WLANs” on page 31 and Appendix C, “Basic Picocell Design” on page 113.
To gain an understanding of the how the radio budget is used to obtain a reuse requirement, consider the simplified examples in Table 21.
In the European auditorium (example 1), we have 22 available channels (including three on the 2.4-GHz band for iPod and smartphone device types and 19 in the 5-GHz band). In the United Kingdom, there are presently 13 channels in 2.4 GHz and 24 channels in 5 GHz available. We also set U to the commonly-
Table 21 Example Radio Budgets
Example 1 Example 2
Scenario Auditorium in a European Union country (other than the UK)
Trading floor in New York City near multiple airports and ship traffic with frequent radar events
AP Type 802.11gn (dual-band) 802.11a (single-band)
Primary Capacity Goal
500 users (D = 500) 1,000 users (D = 1,000)
Secondary Capacity Goals
U = 25
C = 22 (channels 1,6, 11, 36-64 and 100-140 are allowed)
U = 20
C = 9 (channels 36-48 and 149-165 are allowed)
Channel Reuses Required
Special Notes At least 425 devices must be5-GHz-capable.
Custom RF design needed to achieve the required number of channel reuses.
R = C x U
D
9.0550500
2522500
R = No Reuse 5.5180000,1
209000,1
R = Reuse Needed
108 | Advanced Capacity Planning Theory for HD WLANs High-Density Wireless Networks for Auditoriums VRD | Solution Guide
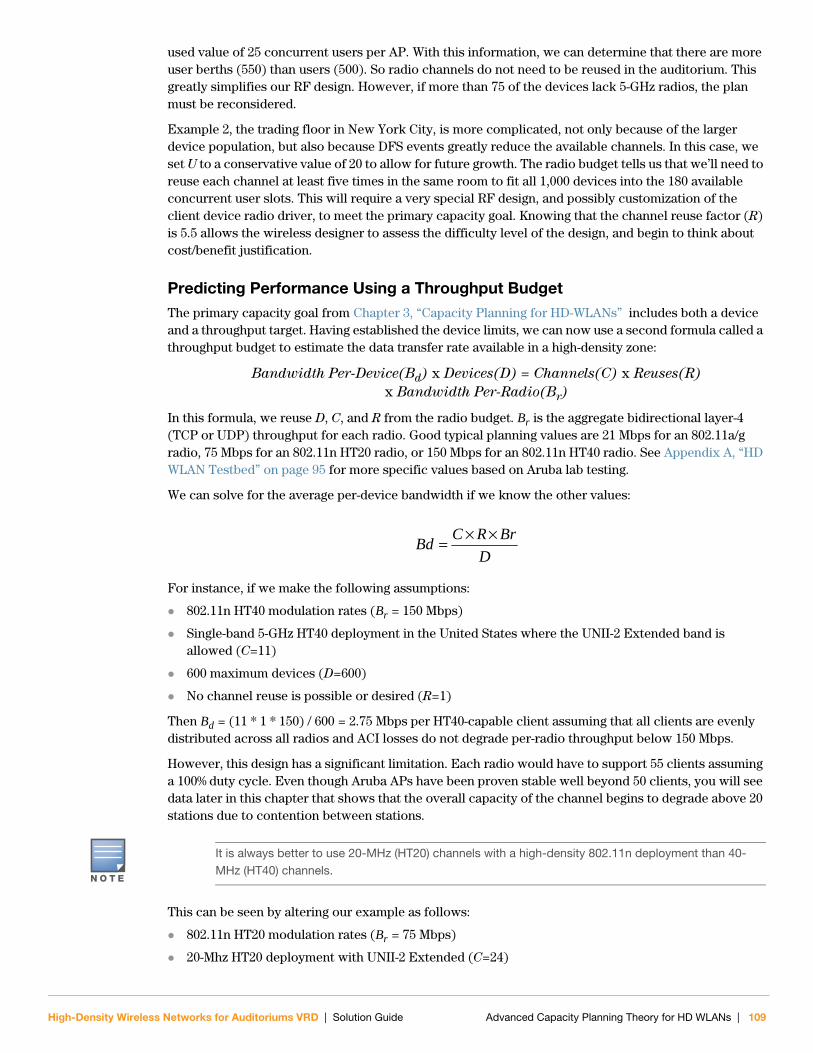
used value of 25 concurrent users per AP. With this information, we can determine that there are more user berths (550) than users (500). So radio channels do not need to be reused in the auditorium. This greatly simplifies our RF design. However, if more than 75 of the devices lack 5-GHz radios, the plan must be reconsidered.
Example 2, the trading floor in New York City, is more complicated, not only because of the larger device population, but also because DFS events greatly reduce the available channels. In this case, we set U to a conservative value of 20 to allow for future growth. The radio budget tells us that we’ll need to reuse each channel at least five times in the same room to fit all 1,000 devices into the 180 available concurrent user slots. This will require a very special RF design, and possibly customization of the client device radio driver, to meet the primary capacity goal. Knowing that the channel reuse factor (R) is 5.5 allows the wireless designer to assess the difficulty level of the design, and begin to think about cost/benefit justification.
Predicting Performance Using a Throughput BudgetThe primary capacity goal from Chapter 3, “Capacity Planning for HD-WLANs” includes both a device and a throughput target. Having established the device limits, we can now use a second formula called a throughput budget to estimate the data transfer rate available in a high-density zone:
Bandwidth Per-Device(Bd) x Devices(D) = Channels(C) x Reuses(R)
x Bandwidth Per-Radio(Br)
In this formula, we reuse D, C, and R from the radio budget. Br is the aggregate bidirectional layer-4 (TCP or UDP) throughput for each radio. Good typical planning values are 21 Mbps for an 802.11a/g radio, 75 Mbps for an 802.11n HT20 radio, or 150 Mbps for an 802.11n HT40 radio. See Appendix A, “HD WLAN Testbed” on page 95 for more specific values based on Aruba lab testing.
We can solve for the average per-device bandwidth if we know the other values:
For instance, if we make the following assumptions:
802.11n HT40 modulation rates (Br = 150 Mbps)
Single-band 5-GHz HT40 deployment in the United States where the UNII-2 Extended band is allowed (C=11)
600 maximum devices (D=600)
No channel reuse is possible or desired (R=1)
Then Bd = (11 * 1 * 150) / 600 = 2.75 Mbps per HT40-capable client assuming that all clients are evenly distributed across all radios and ACI losses do not degrade per-radio throughput below 150 Mbps.
However, this design has a significant limitation. Each radio would have to support 55 clients assuming a 100% duty cycle. Even though Aruba APs have been proven stable well beyond 50 clients, you will see data later in this chapter that shows that the overall capacity of the channel begins to degrade above 20 stations due to contention between stations.
This can be seen by altering our example as follows:
802.11n HT20 modulation rates (Br = 75 Mbps)
20-Mhz HT20 deployment with UNII-2 Extended (C=24)
DBrRCBd
N O T E
It is always better to use 20-MHz (HT20) channels with a high-density 802.11n deployment than 40-MHz (HT40) channels.
High-Density Wireless Networks for Auditoriums VRD | Solution Guide Advanced Capacity Planning Theory for HD WLANs | 109
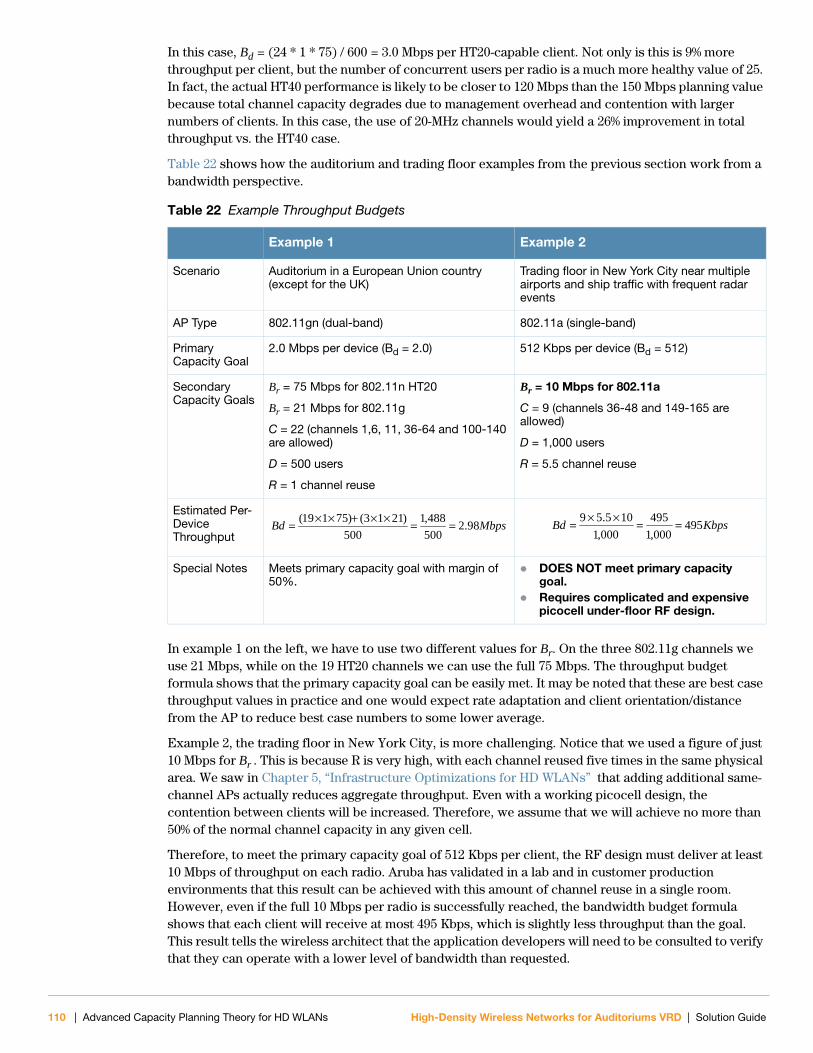
In this case, Bd = (24 * 1 * 75) / 600 = 3.0 Mbps per HT20-capable client. Not only is this is 9% more throughput per client, but the number of concurrent users per radio is a much more healthy value of 25. In fact, the actual HT40 performance is likely to be closer to 120 Mbps than the 150 Mbps planning value because total channel capacity degrades due to management overhead and contention with larger numbers of clients. In this case, the use of 20-MHz channels would yield a 26% improvement in total throughput vs. the HT40 case.
Table 22 shows how the auditorium and trading floor examples from the previous section work from a bandwidth perspective.
In example 1 on the left, we have to use two different values for Br. On the three 802.11g channels we use 21 Mbps, while on the 19 HT20 channels we can use the full 75 Mbps. The throughput budget formula shows that the primary capacity goal can be easily met. It may be noted that these are best case throughput values in practice and one would expect rate adaptation and client orientation/distance from the AP to reduce best case numbers to some lower average.
Example 2, the trading floor in New York City, is more challenging. Notice that we used a figure of just 10 Mbps for Br . This is because R is very high, with each channel reused five times in the same physical area. We saw in Chapter 5, “Infrastructure Optimizations for HD WLANs” that adding additional same-channel APs actually reduces aggregate throughput. Even with a working picocell design, the contention between clients will be increased. Therefore, we assume that we will achieve no more than 50% of the normal channel capacity in any given cell.
Therefore, to meet the primary capacity goal of 512 Kbps per client, the RF design must deliver at least 10 Mbps of throughput on each radio. Aruba has validated in a lab and in customer production environments that this result can be achieved with this amount of channel reuse in a single room. However, even if the full 10 Mbps per radio is successfully reached, the bandwidth budget formula shows that each client will receive at most 495 Kbps, which is slightly less throughput than the goal. This result tells the wireless architect that the application developers will need to be consulted to verify that they can operate with a lower level of bandwidth than requested.
Table 22 Example Throughput Budgets
Example 1 Example 2
Scenario Auditorium in a European Union country (except for the UK)
Trading floor in New York City near multiple airports and ship traffic with frequent radar events
AP Type 802.11gn (dual-band) 802.11a (single-band)
Primary Capacity Goal
2.0 Mbps per device (Bd = 2.0) 512 Kbps per device (Bd = 512)
Secondary Capacity Goals
Br = 75 Mbps for 802.11n HT20
Br = 21 Mbps for 802.11g
C = 22 (channels 1,6, 11, 36-64 and 100-140 are allowed)
D = 500 users
R = 1 channel reuse
Br = 10 Mbps for 802.11a
C = 9 (channels 36-48 and 149-165 are allowed)
D = 1,000 users
R = 5.5 channel reuse
Estimated Per-Device Throughput
Special Notes Meets primary capacity goal with margin of 50%.
DOES NOT meet primary capacity goal.
Requires complicated and expensive picocell under-floor RF design.
MbpsBd 98.2500488,1
500)2113()75119( KbpsBd 495
000,1495
000,1105.59
110 | Advanced Capacity Planning Theory for HD WLANs High-Density Wireless Networks for Auditoriums VRD | Solution Guide
Capacity Planning Methodology for HD WLANsArmed with the radio budget and bandwidth budget formulas, you have the tools necessary to complete the Aruba methodology for HD WLAN capacity planning. This methodology is a more in-depth version of the process presented in Chapter 3, “Capacity Planning for HD-WLANs” on page 17. Figure 66 shows the planning cycle.
Figure 66 HD WLAN Capacity Planning Cycle
1. Device count (D): Determine the number of concurrent wireless client connections needed over the useful life of the network.
2. Channel count (C): Determine the number of different, nonoverlapping frequencies that are available and usable by the expected client device drivers.
3. Concurrent user target (U): Determine the number of concurrently transmitting clients that each AP can handle (per radio).
4. Capacity reserve (-U): Choose the amount of spare capacity that you want to hold back for traffic peaks and future growth. Adjust U downward by this amount.
5. Determine reuse (R): Use the radio budget formula to determine if each channel will need to be used more than one time
6. Radio bandwidth target (Br): Look up the maximum per-radio throughput for the radio type and R value (802.11a/b/g/n). Tables are provided for this purpose in Appendix A, “HD WLAN Testbed” on page 95. If you plan to reuse channels in the same room, divide the single-radio throughput value by the number of reuses.
7. Determine available per-device bandwidth (Bd): Derive the per client value and compare to the primary capacity goal.
8. Validate primary capacity goal: If the primary capacity goal cannot be achieved, make necessary design compromises and repeat steps 1-7 with adjusted input values.
This methodology allows the wireless architect to make an assessment of how much bandwidth can be made available to a given population of users.
HD_270
Device count (D)Channel count (C)
Target (U)
Capacityreserve (-U)
Determinereuse (R)
Radio bandwidthtarget (Br)
Determine availableper-device
bandwidth (Bd)
Validate primarycapacity goal
High-Density Wireless Networks for Auditoriums VRD | Solution Guide Advanced Capacity Planning Theory for HD WLANs | 111

112 | Advanced Capacity Planning Theory for HD WLANs High-Density Wireless Networks for Auditoriums VRD | Solution Guide
High-Density Wireless Networks for Auditoriums VRD | Solution Guide
Appendix CBasic Picocell Design
The main body of this VRD assumes that no channel reuse is needed to implement an HD WLAN in an auditorium. This is easily achievable in countries that offer 13 or more 20-MHz channels in the 5-GHz band. However, this is much harder for countries such as China with only five allowed 5-GHz channels at the time of this writing, or sites that reserve channels for other purposes such as medical telemetry or security video.
This appendix covers the basics of picocell design to help wireless engineers understand the requirements and constraints of channel reuse. A full treatment of picocell design is beyond the scope of this guide. Contact your local Aruba representative for further information or engineering consultation.
RF Design for PicocellPicocells are one of the most interesting and challenging RF designs to undertake. Controlling the collision domain requires careful analysis in three dimensions, not only between APs and clients but also between clients.
An under-floor picocell system has three key RF design differences from a conventional WLAN deployment:
Client device radios tend to increase picocell radius as opposed to shrinking the cell radius.
The link budget for clients at the picocell edge must factor in variable amounts of structural and body loss.
The minimum channel reuse distance between picocells on the same channel must be determined and observed.
Basic Picocell Design | 113
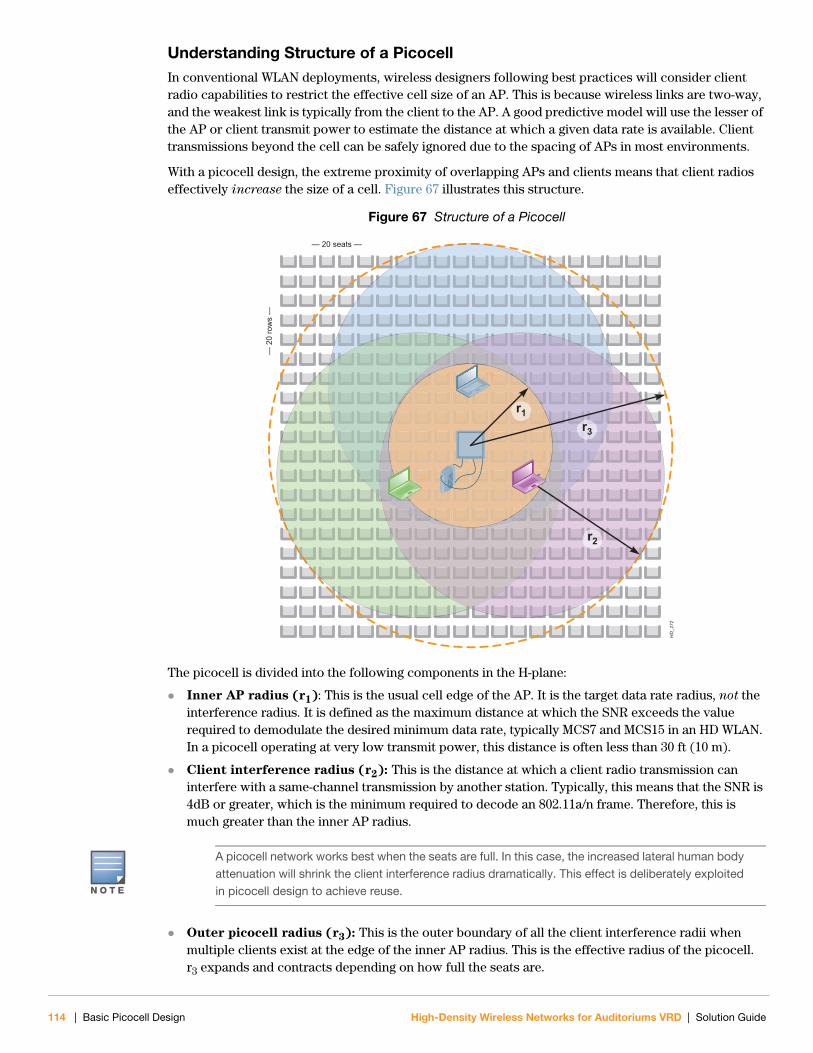
Understanding Structure of a PicocellIn conventional WLAN deployments, wireless designers following best practices will consider client radio capabilities to restrict the effective cell size of an AP. This is because wireless links are two-way, and the weakest link is typically from the client to the AP. A good predictive model will use the lesser of the AP or client transmit power to estimate the distance at which a given data rate is available. Client transmissions beyond the cell can be safely ignored due to the spacing of APs in most environments.
With a picocell design, the extreme proximity of overlapping APs and clients means that client radios effectively increase the size of a cell. Figure 67 illustrates this structure.
Figure 67 Structure of a Picocell
The picocell is divided into the following components in the H-plane:
Inner AP radius (r1): This is the usual cell edge of the AP. It is the target data rate radius, not the interference radius. It is defined as the maximum distance at which the SNR exceeds the value required to demodulate the desired minimum data rate, typically MCS7 and MCS15 in an HD WLAN. In a picocell operating at very low transmit power, this distance is often less than 30 ft (10 m).
Client interference radius (r2): This is the distance at which a client radio transmission can interfere with a same-channel transmission by another station. Typically, this means that the SNR is 4dB or greater, which is the minimum required to decode an 802.11a/n frame. Therefore, this is much greater than the inner AP radius.
Outer picocell radius (r3): This is the outer boundary of all the client interference radii when multiple clients exist at the edge of the inner AP radius. This is the effective radius of the picocell. r3 expands and contracts depending on how full the seats are.
HD
_272
— 20 seats —
— 2
0 ro
ws
—
r1
r2
r3
N O T E
A picocell network works best when the seats are full. In this case, the increased lateral human body attenuation will shrink the client interference radius dramatically. This effect is deliberately exploited in picocell design to achieve reuse.
114 | Basic Picocell Design High-Density Wireless Networks for Auditoriums VRD | Solution Guide

From this analysis, it is clear that client transmissions have the result of increasing the size of a picocell due to the small power levels and short distances involved.
Link Budget AnalysisAnother unique requirement of picocells is the need to perform link budget planning to compute the required EIRP to deliver the desired SNR level to all of the users above the AP after considering losses for flooring, seating, and human body attenuation. These losses are not constant, but increase as the angle between the AP and the user decreases. Just as with a conventional WLAN, the wireless designer must ensure that the clients at the edge of the cell exceed the SNR requirement for a desired speed. It is assumed that clients in the center of the cell will work well if this is achieved.
Figure 68 Picocell Link Budget
Figure 68 shows two applications of the picocell link budget formula:
PRX = PTX – Lfreespace – Lfloor – Lbody + GTX + GRX
Where:
PRX = Received power at the client in dBm
PTX = Conducted power at the antenna port of the AP in dBm
Lfreespace = Free space path loss in dB using standard path loss formula
Lfloor = Loss due to flooring and structural materials in dB
Lbody = Loss due to human bodies in dB
GTX = Antenna gain at the transmitter in dBi
GRX = Antenna gain at the receiver in dBi
In the figure, all three types of loss vary with the angle of incidence, which increases the distance that RF energy must travel. Free space loss increases with distance. Floor loss increases as the length of the path through the floor goes up. Body loss increases as the number of bodies or body parts in the transmission path increases.
The quickest, surest way to obtain reliable planning data is to do an active RF survey with a test AP installed on, in, or under the floor as envisioned by the designer. Using a site survey tool such as AirMagnet or Ekahau, it is possible to quickly determine Lfloor + Lfreespace for an empty auditorium.
To quantify Lbody, the test can be repeated with volunteers filling up a section, or possibly during an actual event. The Aruba Customer Engineering (ACE) organization has measured body loss data, and is available to consult with customers planning picocell systems. Ask your local Aruba systems engineer for more information.
HD
_273
L freespace
L freespace
L body
L body
L floor
L floor
High-Density Wireless Networks for Auditoriums VRD | Solution Guide Basic Picocell Design | 115
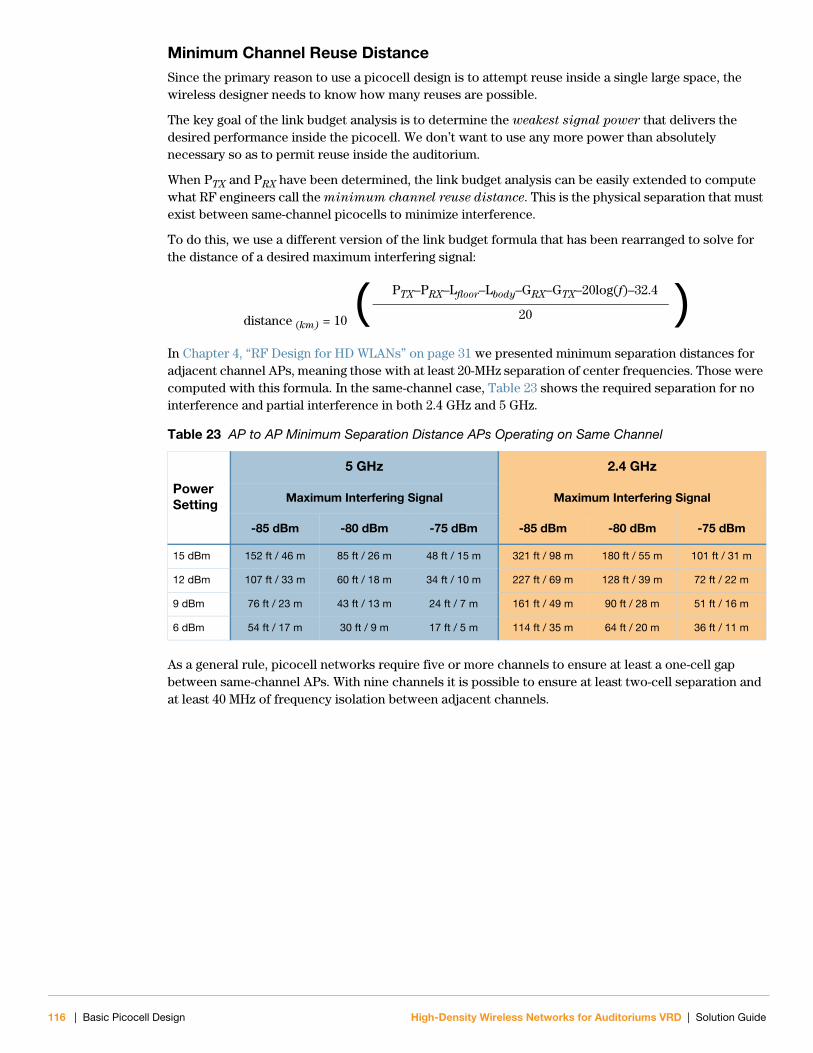
Minimum Channel Reuse DistanceSince the primary reason to use a picocell design is to attempt reuse inside a single large space, the wireless designer needs to know how many reuses are possible.
The key goal of the link budget analysis is to determine the weakest signal power that delivers the desired performance inside the picocell. We don’t want to use any more power than absolutely necessary so as to permit reuse inside the auditorium.
When PTX and PRX have been determined, the link budget analysis can be easily extended to compute what RF engineers call the minimum channel reuse distance. This is the physical separation that must exist between same-channel picocells to minimize interference.
To do this, we use a different version of the link budget formula that has been rearranged to solve for the distance of a desired maximum interfering signal:
In Chapter 4, “RF Design for HD WLANs” on page 31 we presented minimum separation distances for adjacent channel APs, meaning those with at least 20-MHz separation of center frequencies. Those were computed with this formula. In the same-channel case, Table 23 shows the required separation for no interference and partial interference in both 2.4 GHz and 5 GHz.
As a general rule, picocell networks require five or more channels to ensure at least a one-cell gap between same-channel APs. With nine channels it is possible to ensure at least two-cell separation and at least 40 MHz of frequency isolation between adjacent channels.
Table 23 AP to AP Minimum Separation Distance APs Operating on Same Channel
Power Setting
5 GHz 2.4 GHz
Maximum Interfering Signal Maximum Interfering Signal
-85 dBm -80 dBm -75 dBm -85 dBm -80 dBm -75 dBm
15 dBm 152 ft / 46 m 85 ft / 26 m 48 ft / 15 m 321 ft / 98 m 180 ft / 55 m 101 ft / 31 m
12 dBm 107 ft / 33 m 60 ft / 18 m 34 ft / 10 m 227 ft / 69 m 128 ft / 39 m 72 ft / 22 m
9 dBm 76 ft / 23 m 43 ft / 13 m 24 ft / 7 m 161 ft / 49 m 90 ft / 28 m 51 ft / 16 m
6 dBm 54 ft / 17 m 30 ft / 9 m 17 ft / 5 m 114 ft / 35 m 64 ft / 20 m 36 ft / 11 m
distance (km) = 10
PTX–PRX–Lfloor–Lbody–GRX–GTX–20log(f)–32.4
20( )
116 | Basic Picocell Design High-Density Wireless Networks for Auditoriums VRD | Solution Guide
Capacity Planning for PicocellThe physical cell, as defined by the boundary at which SNR meets the data rate objective for the network, must also be aligned with the concurrent user capacity of the AP and the duty cycle of client devices.
The number of seats that can be served by a single picocell can be determined by this formula:
Where:
Concurrent user limit is the value you chose in Chapter 3, “Capacity Planning for HD-WLANs” on page 17.
Devices per seat is the number of radio MACs per user.
Average duty cycle is the percentage of time they have data to transmit.
For example, a cell with a 50 concurrent user limit where each seat has one device and the duty cycle is 10% could support 500 seats. However, a cell with 25 concurrent users with a single device and a 75% duty cycle can only support 33 users.
Our focus is 5-GHz coverage in this guide, and it should be noted that some additional clients can be served in the 2.4-GHz band, which permits some increase in the “size” of the picocell from a capacity perspective. However, due to the inherent limitations of 2.4 GHz, it is often better to exclude it from the capacity plan.
Reconciling the RF and Capacity PlansThe last step in the picocell planning process is to reconcile the RF design with the capacity plan. The goal is to exactly align the number of seats reached by the radio coverage with the network capacity of the AP.
This is relatively easy to do for high concurrent-user limit, low duty-cycle environments, even for large numbers of clients. The earlier example with 500 seats implies an area of 25 seats across by 20 rows. At typical seat dimensions, this is 3,750 ft2 (350 m2). Aruba has successfully constructed picocells of this size with no difficulty.
The most challenging situation is low concurrent-user limit, high duty-cycle auditoriums. In the 33-seat example above, this is an area of roughly six seats square. At typical seat sizes, this is just 275 ft2 (25 m2). This implies an inner radius of under 10 ft (3 m), which is quite difficult even before dealing with the client interference radius.
The Aruba RX Sensitivity Tuning-Based Channel Reuse feature is critical tool in the wireless designer’s arsenal to help refine performance in those situations. For further assistance, contact your local Aruba systems engineer.
seats = concurrent user limit
devices per seat * average duty cycle
High-Density Wireless Networks for Auditoriums VRD | Solution Guide Basic Picocell Design | 117

118 | Basic Picocell Design High-Density Wireless Networks for Auditoriums VRD | Solution Guide

High-Density Wireless Networks for Auditoriums VRD | Solution Guide
Appendix DDynamic Frequency Selection Operation
With a total of about twenty 20-MHz channels (different vendors support slightly different numbers) the 5-GHz band with Dynamic Frequency Selection (DFS) now has sufficient channels to implement most HD WLAN scenarios. So why wouldn’t everyone use DFS?
Three significant exceptions could adversely affect HD WLAN performance with DFS enabled. The wireless architect must assess whether any of these exceptions applies to their organization:
Proximity to radar sources in the 5450- to 5725-MHz band
Lack of DFS support on required client devices
Need for the Aruba Receive Sensitivity Tuning-Based Channel Reuse feature
If you do plan to use DFS channels, here is an overview of how DFS works and what you can expect when radar events occur.
For more information, please see Chapter 4, “RF Design for HD WLANs” on page 31.
Behavior of 5-GHz Client Devices in Presence of RadarActual radar events can be extremely disruptive to a WLAN that attempts to use DFS channels. To better understand what this means, we will review the constraints on APs and clients on these channels.
The rules for DFS are different for different countries or regions. The definition of what kind of signals should be considered radar signals and how each signal is classified also vary (per region and over time). But, at a high level, the following steps provide a generic description of DFS for WLAN:
1. Before initiating any transmission on a DFS channel, the device (can be AP or client) monitors the channel for the presence of radar signals for the Channel Availability Check (CAC) time. In most cases, this CAC time equals a minimum of 60 seconds, but is increased to a minimum of 10 mins for channels in the 5,600- to 5,650-MHz sub-band in Europe (channels 120, 124, 128, 116+, 120-, 124+, and 128-)
2. If any radar signal is detected, the device “blacklists” the channel and selects a different channel. If that channel is also a DFS channel, the process in step 1 is repeated. If a non-DFS channel is selected, this process no longer applies. Any blacklisted channels are considered unavailable for a minimum of 30 mins (nonoccupancy period).
3. If no radar signals are detected during the CAC time, the device can start using the channel.
4. While using the channel, the device that “owns” the connection (typically the AP) continuously monitors the channel for radar signals (in-service monitoring). If a radar signal is detected, the AP issues commands to all clients to instruct them to stop any transmissions on the channel, and selects a new available channel. After detection, the AP needs to clear the channel within 10 seconds.
As you can see, APs on DFS channels take longer to come up and users on DFS channels can potentially experience lengthy service interruptions from radar events. Because radar frequencies do not align with 802.11 channelization, such events can impact multiple Wi-Fi channels simultaneously.
Therefore, the wireless designer is strongly encouraged to conduct a DFS survey during the HD WLAN planning process to validate the availability of these channels. Just because there is no airport nearby
Dynamic Frequency Selection Operation | 119
does not mean there is no radar. Other common sources of radar include marine shipping traffic, military installations, and doppler weather systems at local television stations.
A DFS survey is relatively simple to perform, and requires an Aruba controller and AP. These are the basic steps:
1. Install the controller with ARM scanning disabled. If the controller is not in the location where the survey will take place, arrange for wide-area connectivity to the AP.
2. Provision the AP to operate on channel 52.
3. Allow the AP to dwell on that channel for four hours.
4. If a radar event has occurred, it can be noted from the system log, and you’ll notice that the AP will be on another channel.
5. Repeat steps 2 and 3 on the next highest 20-MHz channel until channel 140 has been completed.
Unfortunately, radar pulses cannot be detected with any PC-based portable spectrum analyzers on the market as of this writing. The cost of renting and operating a laboratory-quality spectrum analyzer is typically much higher than simply using the Aruba equipment you intend to deploy.
Behavior and Capabilities of 5 GHz Client DevicesAs noted in Chapter 3, “Capacity Planning for HD-WLANs” on page 17, there is a wide variety in 5-GHz channel support among client devices. Some devices don’t support any of the 15 DFS channels, some support only the four in the UNII-2 sub-band, and currently only a few support all channels. The number of devices with full DFS support is growing, but the majority still has limitations. Typically, the actual level of DFS support depends not only on the client device itself (or WLAN chipset), but also the specific software driver version for that device.
Note that WLAN client devices with support for DFS channels will typically not implement actual radar detection capabilities, but depend on the AP for this. Therefore, even with DFS supported, these client devices are unable to establish ad-hoc networks or do active scanning on DFS channels. Without a detection mechanism, devices are not permitted to initiate transmissions on DFS channels. Also, they need to respond to commands from the AP to vacate the channel in a well-defined manner.
As a result of the limitation to passive scanning, even when DFS is supported it will typically take much longer for a client to “see” an AP on a DFS channel, and the client will appear to have a “preference” for the non-DFS channels. It should be noted that implementing a WLAN deployment where DFS channels are included in the supported channel list (regulatory profile) in which some clients do and others do not support the full set of clients has the potential to create large coverage holes for some clients.
To address this concern, start with an inventory of the critical devices in each HD WLAN coverage zone. Validate that the NIC and driver software fully support DFS. If they do not, a mitigation plan will be needed upgrade them before DFS channels can be utilized.
DFS SummaryDFS channels are a vital weapon in the wireless architect’s arsenal when planning any HD WLAN. However, due to the importance of these possible exceptions, all DFS channels are disabled in ArubaOS by default but can be easily enabled. This is explained in Chapter 6, “Configuring ArubaOS for HD-WLANs” on page 67.
Before enabling DFS channels in any WLAN system, it is critical to complete a DFS survey and to understand the behavior of all client devices in the system on all DFS channels.
120 | Dynamic Frequency Selection Operation High-Density Wireless Networks for Auditoriums VRD | Solution Guide
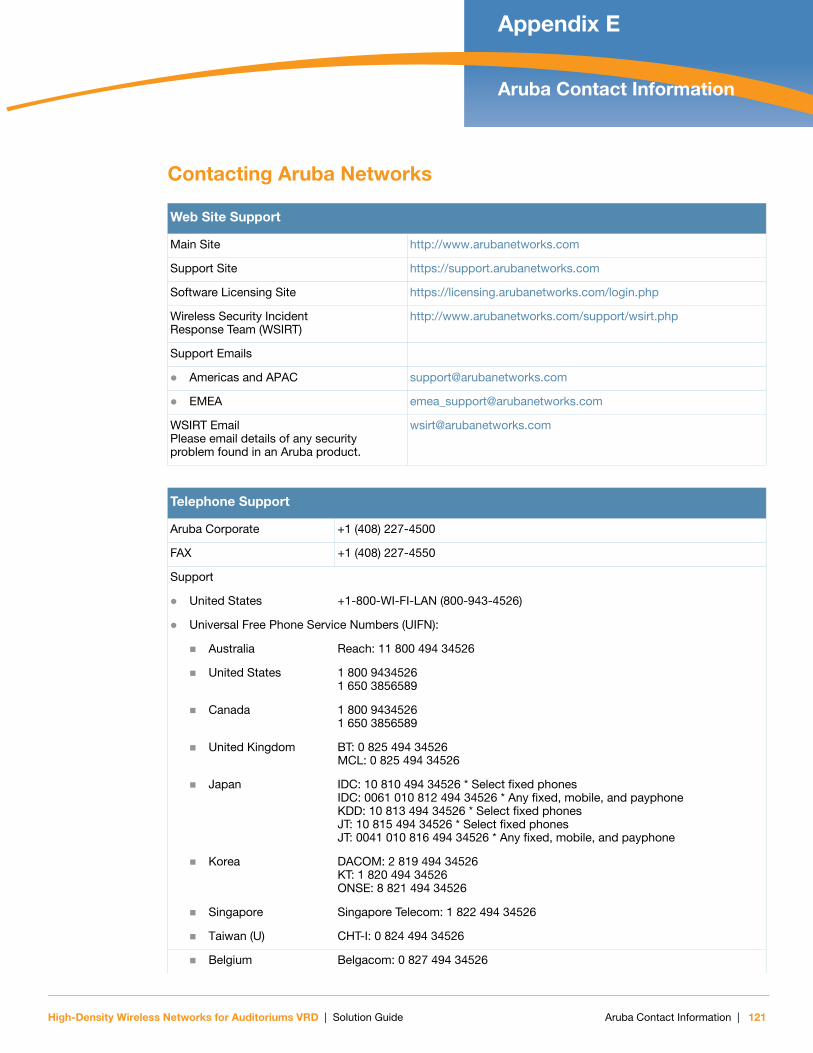
High-Density Wireless Networks for Auditoriums VRD | Solution Guide
Appendix EAruba Contact Information
Contacting Aruba Networks
Web Site Support
Main Site http://www.arubanetworks.com
Support Site https://support.arubanetworks.com
Software Licensing Site https://licensing.arubanetworks.com/login.php
Wireless Security IncidentResponse Team (WSIRT)
http://www.arubanetworks.com/support/wsirt.php
Support Emails
Americas and APAC [email protected]
EMEA [email protected]
WSIRT EmailPlease email details of any securityproblem found in an Aruba product.
Telephone Support
Aruba Corporate +1 (408) 227-4500
FAX +1 (408) 227-4550
Support
United States +1-800-WI-FI-LAN (800-943-4526)
Universal Free Phone Service Numbers (UIFN):
Australia Reach: 11 800 494 34526
United States 1 800 94345261 650 3856589
Canada 1 800 94345261 650 3856589
United Kingdom BT: 0 825 494 34526MCL: 0 825 494 34526
Japan IDC: 10 810 494 34526 * Select fixed phonesIDC: 0061 010 812 494 34526 * Any fixed, mobile, and payphoneKDD: 10 813 494 34526 * Select fixed phonesJT: 10 815 494 34526 * Select fixed phonesJT: 0041 010 816 494 34526 * Any fixed, mobile, and payphone
Korea DACOM: 2 819 494 34526KT: 1 820 494 34526ONSE: 8 821 494 34526
Singapore Singapore Telecom: 1 822 494 34526
Taiwan (U) CHT-I: 0 824 494 34526
Belgium Belgacom: 0 827 494 34526
Aruba Contact Information | 121
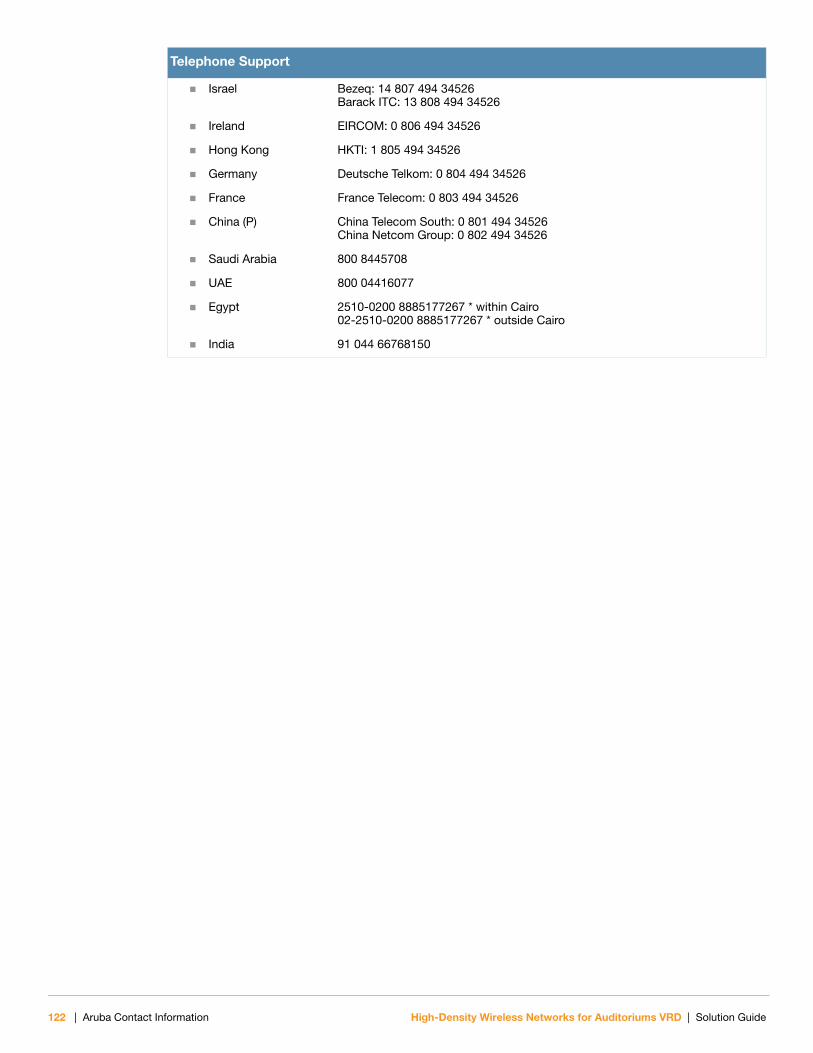
Israel Bezeq: 14 807 494 34526Barack ITC: 13 808 494 34526
Ireland EIRCOM: 0 806 494 34526
Hong Kong HKTI: 1 805 494 34526
Germany Deutsche Telkom: 0 804 494 34526
France France Telecom: 0 803 494 34526
China (P) China Telecom South: 0 801 494 34526China Netcom Group: 0 802 494 34526
Saudi Arabia 800 8445708
UAE 800 04416077
Egypt 2510-0200 8885177267 * within Cairo02-2510-0200 8885177267 * outside Cairo
India 91 044 66768150
Telephone Support
122 | Aruba Contact Information High-Density Wireless Networks for Auditoriums VRD | Solution Guide