high cut sllop
TRANSCRIPT
8/12/2019 high cut sllop
http://slidepdf.com/reader/full/high-cut-sllop 1/6
RESEARCH ON HIGH-CUT SLOPE INFORMATION MODEL OF THE THREE
GORGES AREA*
ZHONGSHI TANG, HONGRUI ZHAO, GANG FU AND QIAO GE
3S Centre, Tsinghua University, Beijing, 100084, China [email protected]
KEY WORDS: Hazards, Monitoring, Modeling, Geo-Spatial Information Model
ABSTRACT:
Taking advantages of geo-spatial technology integrated with monitoring methods, and aiming at high-cut slope monitoring and
management, this paper proposed a new concept of high-cut slope geo-spatial information model and its corresponding constructing
methods. The geo-spatial information is described from individual slope scale to regional scale, which combines multi-level
information so as to construct a new convenient way to manage and analyse all the information related with the security of high-cut
slope in Three Gorges Area.
* Supported by the National Natural Science Foundation of China (Grant No. 40771135)
1. INTRODUCTION
In the mountain area, various construction projects, newly built
ways (especially highways), bridges, large-scale construction of
urban infrastructure and housing, will inevitably result in
excavations and slopes. The destruction of landslide’s original
stable state may cause instability or deformation, collapses,
stone falling and other geological disasters.
Many researchers have done a lot of works on landslide, and
some of them can be adapted to high-cut slope in Three Gorges
Area. However, from some aspects, there are some
disadvantages in these models, such as:
1. To some extent, some models over-reliance on
mathematical method. In fact, multi-level and holographic
information is often needed so as to be more objective;
2. The visualized expression of existing model needs
further improvement. It is necessary to study the influence
factors of high-cut slope from both regional scale and
individual slope scale as to get macro and micro
information related with the objectivities.
3. It is difficult to improve the accuracy of short-term
disaster simulation and forecast because of the shortage of
the data before and after the damage of stability. Geo-
technology may be helpful to solve the problem.
Since the 1990s, Remote Sensing (RS), geographic information
system (GIS), global positioning system (GPS) (3S) play an
important role in monitoring, analysis evaluation and prediction
of landslide disaster. With the help of 3S technology and
comprehensive monitoring system for geological disasters, it is
possible to provide multi-level information support, from micro
level such as individual high-cut slope to that of macro level, in
which regional geological information is concluded. For this
purpose, a geo-spatial information model is proposed in this
paper.
2. HIGH-CUT SLOPE GEO-SPATIAL INFORMATION
MODEL
2.1 Research Levels of the Information Model In this paper, the concept of spatial information of high-cut
slope refers to its general content, and it includes the whole
spatial information factors of the slope. These factors include
the monitoring point information, the individual slope
information and the regional geographic information such as
geography, environment, hydrology, geology, meteorology and
land cover.
The geospatial information model for early warning of the high-
cut slope stability may have the following three features:
1. The holographic expression of the high-cut slope
including the ground and underground information;
2. The multi-level expression, which is expressed as
point-individual-regional information. Point information
refers to the monitoring site, individual information
includes all the information related to a specific slope and
the regional information is regarded as the regional data
corresponding with the stability of the region where the
studied high-cut slopes are.
3. The complete digitalization of geo-spatial information.
Geo-technology reveals a better way to fulfil the above three
demands. Basically, our research on the high-cut slope disaster
early warning information began with three levels: abstraction
level, methodology level and application level (Figure 1). The
abstraction level only summaries micro and macro elements on
the spatial information model, and only concept and semantic
aspects are concerned in this level; In methodology level, the
research aims at the methods of construct the spatial
information model and the expression model, which is based on
the models created by abstraction level; The application level
research refers to the high-cut slope stability early warning
based on all information models being created.
1553

8/12/2019 high cut sllop
http://slidepdf.com/reader/full/high-cut-sllop 2/6
The International Archives of the Photogrammetry, Remote Sensing and Spatial Information Sciences. Vol. XXXVII. Part B4. Beijing 2008
Figure 1. Research levels of geospatial information model
2.2 Construction of High-Cut Slope Geo-spatial
Information
2.2.1 Research Status of GIS, GPS and RS Technologies in
Landslide Monitoring and Early Warning
The functions of 3S technology in landslide monitoring are (Fu
Xiaolin, 2004): Usually, RS(remote sensing) is regarded as an
important data source used to construct and update the
geological thematic database, which is use in GIS, such as the
developing characteristics of geological disasters, the formationlithology, regional structure and other geological environment,
ecology resources, etc); GPS provides GIS with spatial
coordinates, which can accessed to the surface of target
elements of disaster (such as the elevation, borders and
deformation monitoring points and three-dimensional
coordinates, etc); GIS is used as an efficient tool of the storage,
processing, analysis, classification functions of the multi-source
data (such as topographic maps, land use, weather, vegetation,
basis of geology, hydrogeology and engineering geology,
geological environment and geological disaster monitoring,
prevention and treatment projects, remote sensing images, GPS
and other spatial data). GIS also has the advantage of the spatial
analysis of multi-source data and two-dimensional or three-
dimensional expression of the former analysis results.
3S technology in landslide hazard assessment and geological
research mainly focused on landslide spatial evaluation,
forecasting and mapping. GIS can be used as analysis tools for
landslide risk assessment (Christian Conoscenti, 2008); Logistic
regression model, remote sensing and GIS have been used for
landslide risk mapping (S.LEE, 1005); Gao Kechang took
Wanzhou of Chongqing as an example, and studied GIS
application and information model-based landslide disaster
assessment (Gao Kechang, 2006); High resolution remote
sensing image has been used for quantitative assessment of
landslide risk (N.-W.Park, 2008); ASTER image data has been
used for the Three Gorges valley landslide hazard assessment
(J.G.Liu, 2004); Hu Deyong discussed the way of using GISand RS method to obtain and manage the high-cut slope disaster
information, and also discussed high-cut slope spatial forecast
methods under the hot and humid tropical rain forest region (Hu
Deyong, 2007).
It is well accepted that geo-technology is helpful for geological
disaster warning. Our research aims at taking good advantage of
geo-technology, which as characterized by 3S technology, so as
to combine 3S technology and geological disaster warning
methods together to make the disaster warning more convenient.
2.2.2 Relevant Research Content of the High-Cut Slope Geo-
spatial Information Model
The research is based on the high-cut slope semantic model,
which is used to create high slope disaster early warning spatial
information models. The main works are as the following:
(1) Regional level spatial information modeling: with the
geospatial information modeling theories, the spatial
continuous object collections and spatial scattered
object collections should be analysed. The regional
level model may be accomplished based on the
concept of domain and object oriented spatialinformation modelling ;
(2) RS-based information modeling: This research
studies RS-based information modeling method of
the high-cut slope regional and individual levels. The
perspectives of this research are remote sensing,
imaging mechanism and geographic driving force,
integrated with image information and geographic
theories;
(3) Research on GIS-based information modeling: This
research focuses on GIS-based information modeling
method of the high-cut slope regional and individual
levels. The perspectives of this research are
visualized expression and geographic theories of GIS;
(4) Research on integrated monitoring data modeling:This research studies the modeling method of
internal characteristics of individual high-cut slope,
which based on landslide monitoring data and
mechanism of landslide internal stress;
(5) Research on holographic spatial information
modeling: Base on the results of (1) to (4), this
research explores the holographic spatial information
model, and analyzes the integrated expression of
landslide disaster from both regional and the
individual factor. This research also studies
corresponding relationship between factors. The
research also studies high-cut slope macro-micro
integrated three-dimensional visualized expression
model;(6) Research on dynamic analysis modeling: Base on the
results of (1) to (5), this research studies a timing and
spatial related comprehensive modeling method in
order to create a landslide disaster dynamic
information analysis model and spatial information
analysis model;
(7) Research on spatial-timing high-cut slope disaster
early warning modeling: Base on the results of (1) to
(6), through the spatial statistical regression and
spatial structural adaptive model, the research
provides a spatial-timing high-cut slope disaster
early warning model.
1554

8/12/2019 high cut sllop
http://slidepdf.com/reader/full/high-cut-sllop 3/6
The International Archives of the Photogrammetry, Remote Sensing and Spatial Information Sciences. Vol. XXXVII. Part B4. Beijing 2008
2.2.3 High-cut Slope Information Model based on GIS,
GPS and Remote Sensing Technologies
For the advantages of geo-spatial technology (including GIS,
GPS and RS) in high-cut slope disaster monitoring and early
warning, this paper provides a high-cut slope information
modeling solution (Figure 2).
Figure 2. Contents of the high-cut slope information model
First of all, by referring relevant literature, We build a GIS
database through spatial data engine (SDE), which includes thenecessary multi-source spatial data on point, individual and
regional levels of high-cut slope;
Second, based on the analysis of multi-source data and
information from the high-cut slope point-individual-regional,
the integrated factors which will cause disaster are summarized
and extracted. These integrated factors include topography,
climate, vegetation, geological structure, and other regional
factors. These also include individual shape, composition,
structure, stress and other related factors. On this basis, the
high-cut slope disaster concept model is created, and express by
unified modelling language (UML);
Third, we use geography mark-up language (GML) to express
the semantic model of high-cut slope disaster. This expression
is based on the concept model created by UML. This expression
also lays foundation for building the high-cut slope disaster
spatial information model and implementation of relevant
algorithms;
Fourth, based on high-cut slope regional and individual features,
and through visualized means such as map, graphic, image,
analyze the visualized expression on high-cut slope point-
individual-regional levels and reveal the digital features of
high-cut slope, and establish initial understanding of landslide
disaster spatial information expression;
Fifth, by selecting spatial and non-spatial information variables
of regional and individual high-cut slope disaster early warning
analysis based on graphics, image science, map algebra and
geological disaster theories, research the standards and
measurement of high-cut slope information expression, and then
establish the expression methods on high-cut slope point-
individual-regional levels;
Finally, integrated with 3D MAX modeling tool, and through
OpenGL and GML, develop the three-dimensional visualized
expression of the high-cut slope information.
3. MULTIPLE SCALES OF THE INFORMATION
MODEL
Multi-source data is the foundation of high-cut slope
information model. Taking the Three Gorges Area as
experimental area, we select RS data (SPOT5, IKONOS,
QuickBird, aerial photos), basic geographic data (residents,
roads, contour lines), thematic data (geology, vegetation,
precipitation), high-cut slope monitoring data (displacement,
drilling tilt, acoustic emission rate) and basic data (data from
slope’s planning design stage, survey and design stage,
construction management stage and inspection phase of theevaluation stage, etc) and social and human data, and other
heterogeneous data as the source of experimental data and, then
use ArcSDE and Oracle9i to create The multi-source data
database. In this paper, the landslide spatial information model
can be abstractly summarized from three scales: point scale,
individual scale and regional scale. Each scale has its different
factors for disaster expression and description.
3.1 Point-scale Information Model
Point-scale model is the most microscopic foundation in spatial
information model and also the minimum monitoring unit
which is the basis of high-cut slope disaster monitoring. Point-
scale model is multi-feature which includes: spatial positionfeatures, timing-sequence spatial feature and other attribute
features.
3.1.1 Spatial Feature of the Point
Spatial feature of the point mainly refers to the three-
dimensional coordinates. The coordinate can be obtained in
variety ways such as GPS monitoring network, total station
measurement, etc (Figure 3 is an example of monitoring point
records).
Figure 3. Monitoring point records
The expression or storage of the spatial information in database
is also multiple. As shown in Figure 4, the upper graph is vector
expression example and the lower one is raster-vector
overlapped expression example (the raster data is selected from
IKONOS image).
1555

8/12/2019 high cut sllop
http://slidepdf.com/reader/full/high-cut-sllop 4/6
The International Archives of the Photogrammetry, Remote Sensing and Spatial Information Sciences. Vol. XXXVII. Part B4. Beijing 2008
Figure 4. Vector and vector-raster overlapped expression of
point’s spatial position
3.1.2 Timing-Sequence Spatial Feature of the Point
Timing-sequence spatial feature mainly refers to the
deformation data of the monitoring point. This feature is the
most important basis of landslide disaster monitoring and
prediction, and the deformation characteristic is a direct
reflection of the whole landslide’s stability. Table 1 is an
example of timing-sequence displacement data of a point.
Date Displacement (cm)
1/8/1984 323.2
1/9/1984 326.3
1/10/1984 342.1
1/11/1984 362.5
1/12/1984 390.6
1/1/1985 434.9
1/2/1985 489.3
1/3/1985 550.3
1/4/1985 622.2
1/5/1985 751.1
Table 1. Displacement data of a monitoring point
3.2 Individual-scale Information Model
As every high-cut slope is of the relatively independence and is
the kernel of stability analysis and early warning, information
of individual high-cut slope become the mainstay of the whole
information model (Figure 5 is an example of typical landslide
displacement-time curve).
A
B
C
D
t1 t2 t3 Time
Displacement
Figure 5. Typical landslide displacement-time curve
In landslide data management, stability analysis and disaster
prediction, there mainly involves three types of data: Basic
geographic information data (such as location, area, volume and
stereo geological profile, etc), feature data (such as material,
monitoring methods and monitoring staff, etc) and prediction
model parameter data (the methods work on spatial data and
feature data), so GIS can be used as the graphics platform, thus
achieving a rapid spatial data management, automatic access to
model parameters, graphics rendering and the results of
visualized expression, and other functions. So from the view of
management function, the database should include three parts:
spatial data management, feature data management and
prediction model data management; while from the view of
expression, it contents graphic-digital integration (graphic and
non-graphic data. Figure 6 is spatial information of high-cut
slopes extracted from remote sensing image and Figure 7 is its’
corresponding attributes).
Figure 6. Graphic expression of high-cut slope
Figure 7. Non-graphic data
3.3 Regional-scale Information Model
The high-cut slope point-scale and the individual-scale model
are from relatively independent and macro level to describe the
spatial information. But if there are only these levels, the model
can hardly provide holographic information. It is necessary to
1556
8/12/2019 high cut sllop
http://slidepdf.com/reader/full/high-cut-sllop 5/6
The International Archives of the Photogrammetry, Remote Sensing and Spatial Information Sciences. Vol. XXXVII. Part B4. Beijing 2008
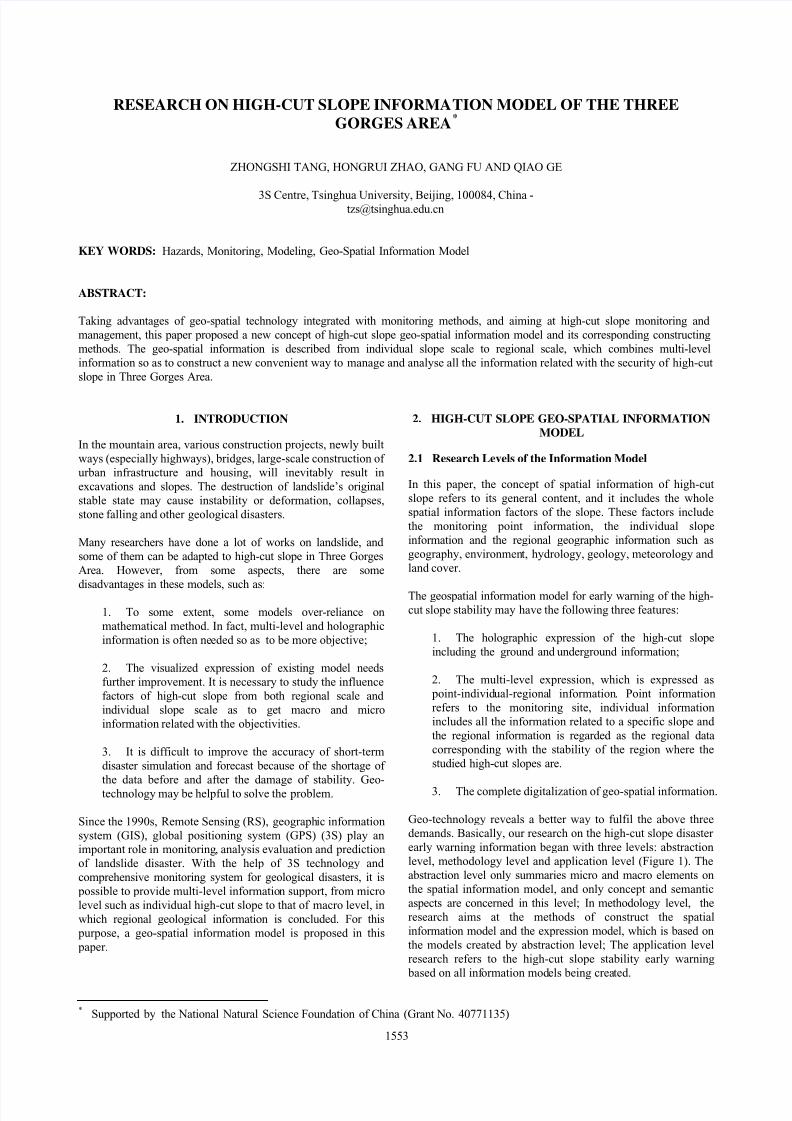
study landslide regional factors which will impact the stability
of high-cut slope. These factors include regional climate,
surface water distribution, geology, geomorphology, social and
human, and so on. It should also integrate with GIS, GPS and
RS technologies to obtain high-cut slope regional macro-level
information factors systemically (Figure 8 is an example of
regional vector data of Zigui county of Sichuan province).
Figure 8. Example of regional vector data (Zigui.Yichang)
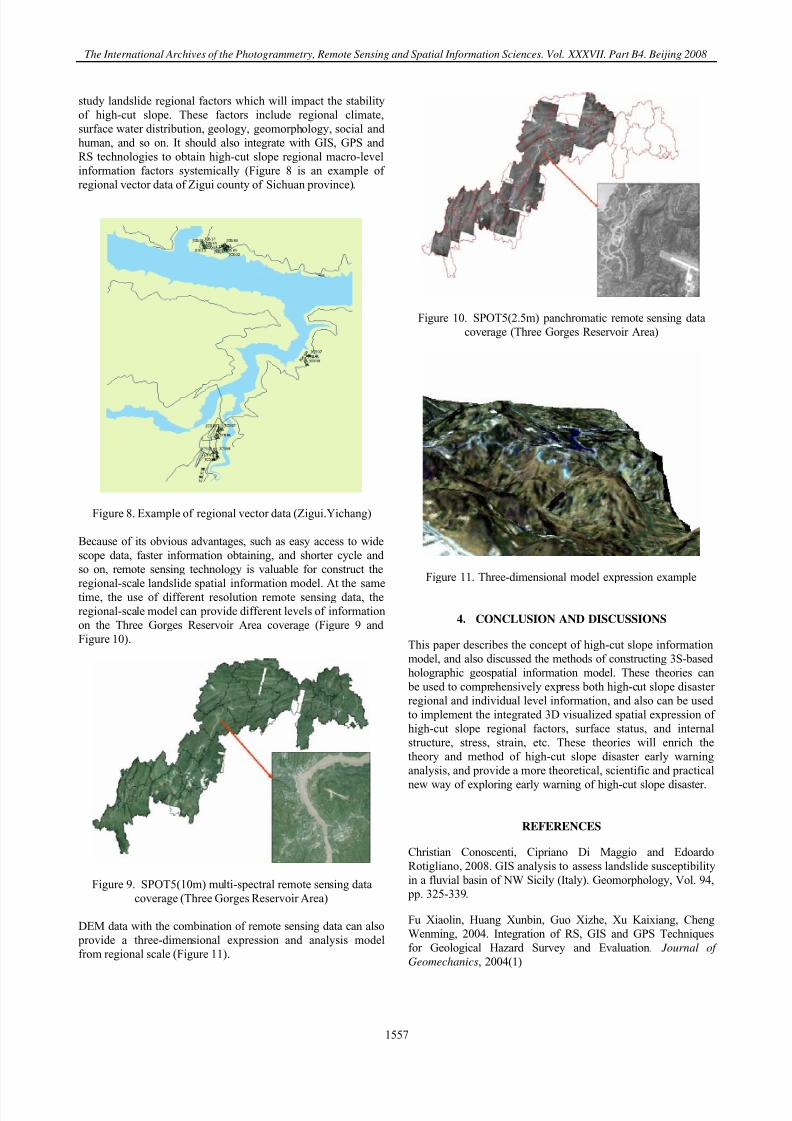
Because of its obvious advantages, such as easy access to wide
scope data, faster information obtaining, and shorter cycle and
so on, remote sensing technology is valuable for construct the
regional-scale landslide spatial information model. At the sametime, the use of different resolution remote sensing data, the
regional-scale model can provide different levels of information
on the Three Gorges Reservoir Area coverage (Figure 9 and
Figure 10).
Figure 9. SPOT5(10m) multi-spectral remote sensing data
coverage (Three Gorges Reservoir Area)
DEM data with the combination of remote sensing data can also
provide a three-dimensional expression and analysis model
from regional scale (Figure 11).
Figure 10. SPOT5(2.5m) panchromatic remote sensing data
coverage (Three Gorges Reservoir Area)
Figure 11. Three-dimensional model expression example
4. CONCLUSION AND DISCUSSIONS
This paper describes the concept of high-cut slope information
model, and also discussed the methods of constructing 3S-based
holographic geospatial information model. These theories can
be used to comprehensively express both high-cut slope disaster
regional and individual level information, and also can be used
to implement the integrated 3D visualized spatial expression of
high-cut slope regional factors, surface status, and internal
structure, stress, strain, etc. These theories will enrich the
theory and method of high-cut slope disaster early warning
analysis, and provide a more theoretical, scientific and practical
new way of exploring early warning of high-cut slope disaster.
REFERENCES
Christian Conoscenti, Cipriano Di Maggio and Edoardo
Rotigliano, 2008. GIS analysis to assess landslide susceptibility
in a fluvial basin of NW Sicily (Italy). Geomorphology, Vol. 94,
pp. 325-339.
Fu Xiaolin, Huang Xunbin, Guo Xizhe, Xu Kaixiang, Cheng
Wenming, 2004. Integration of RS, GIS and GPS Techniques
for Geological Hazard Survey and Evaluation. Journal of
Geomechanics, 2004(1)
1557

8/12/2019 high cut sllop
http://slidepdf.com/reader/full/high-cut-sllop 6/6
The International Archives of the Photogrammetry, Remote Sensing and Spatial Information Sciences. Vol. XXXVII. Part B4. Beijing 2008
Gao Kechang, Cui Peng, Zhao Chunyong, Wei Fangqiang, 2006.
Landslide hazard evaluation of Wanzhou based on GIS
information value method in the Three Gorges reservoir.
Chinese Journal of Rock Mechanics and Engineering, 25(5), pp.
991-996
Hu Deyong, Li Jing, Chen Yunhao, Zhang Jinshui, 2007. GIS-
based Landslide Spatial Prediction Methods, a Case Study inCameron Highland, Malaysia. Journal of Remote Sensing. 11(6),
pp. 852-859
J.G.Liu, P.J.Mason, N.Clerieiet.al, 2004. Landslide hazard
assessment in the Three Gorges area of the Yangtze river using
ASTER imagery: Zigui-Badong. Geomorphology. Vol. 61
N.-W.Park, K.-H.Chi, 2008. Quantitative assessment of
landslide susceptibility using high-resolution remote sensing
data and a generalized additive model. International Journal of
Remote Sensing, 29(1), pp. 247-264
S. LEE, 2005. Application of logistic regression model and its
validation for landslide susceptibility mapping using GIS and
remote sensing data. International Journal of Remote Sensing.
Vol. 26, pp 1477–1491
1558